Modeling of Transmission Compliance and Hysteresis Considering Degradation in a Harmonic Drive


Abstract
:1. Introduction
2. Mechanical Model
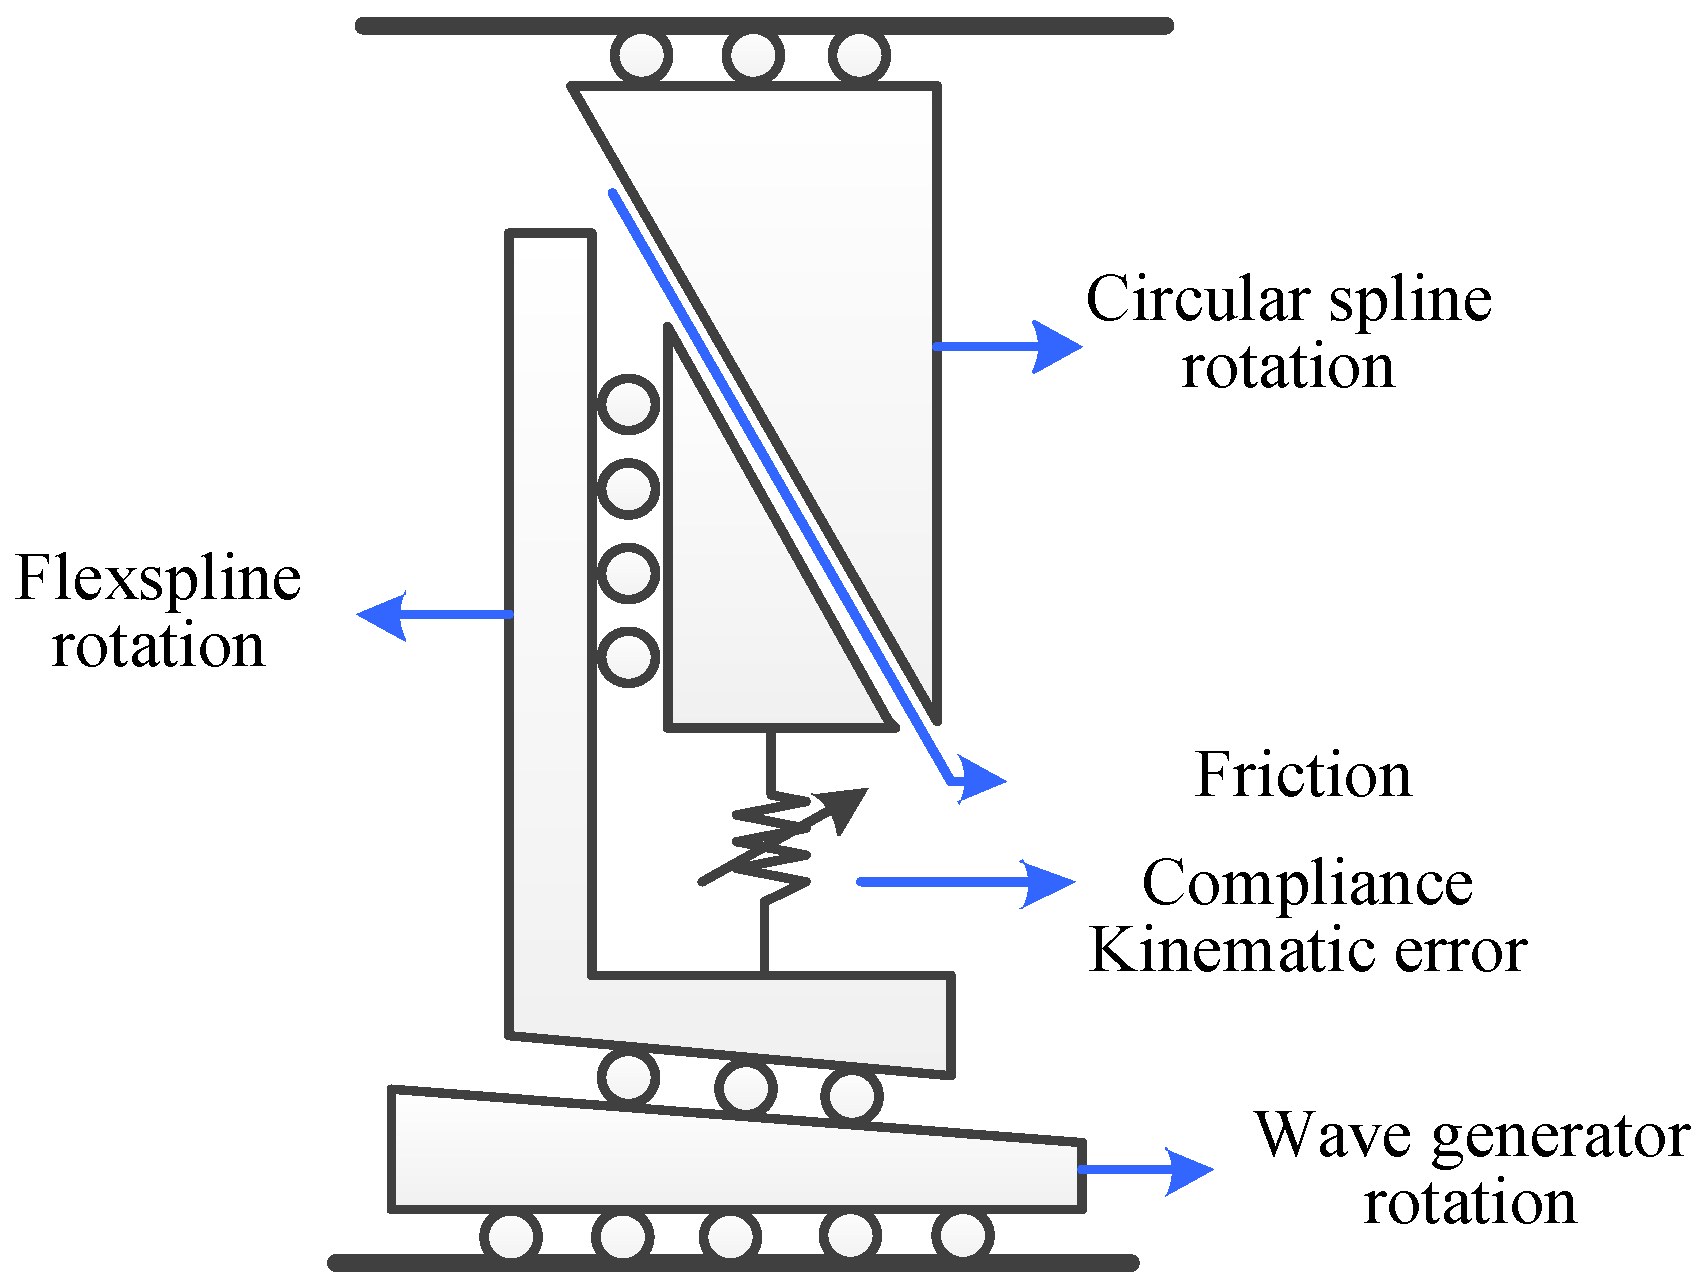
2.1. Ideal Model
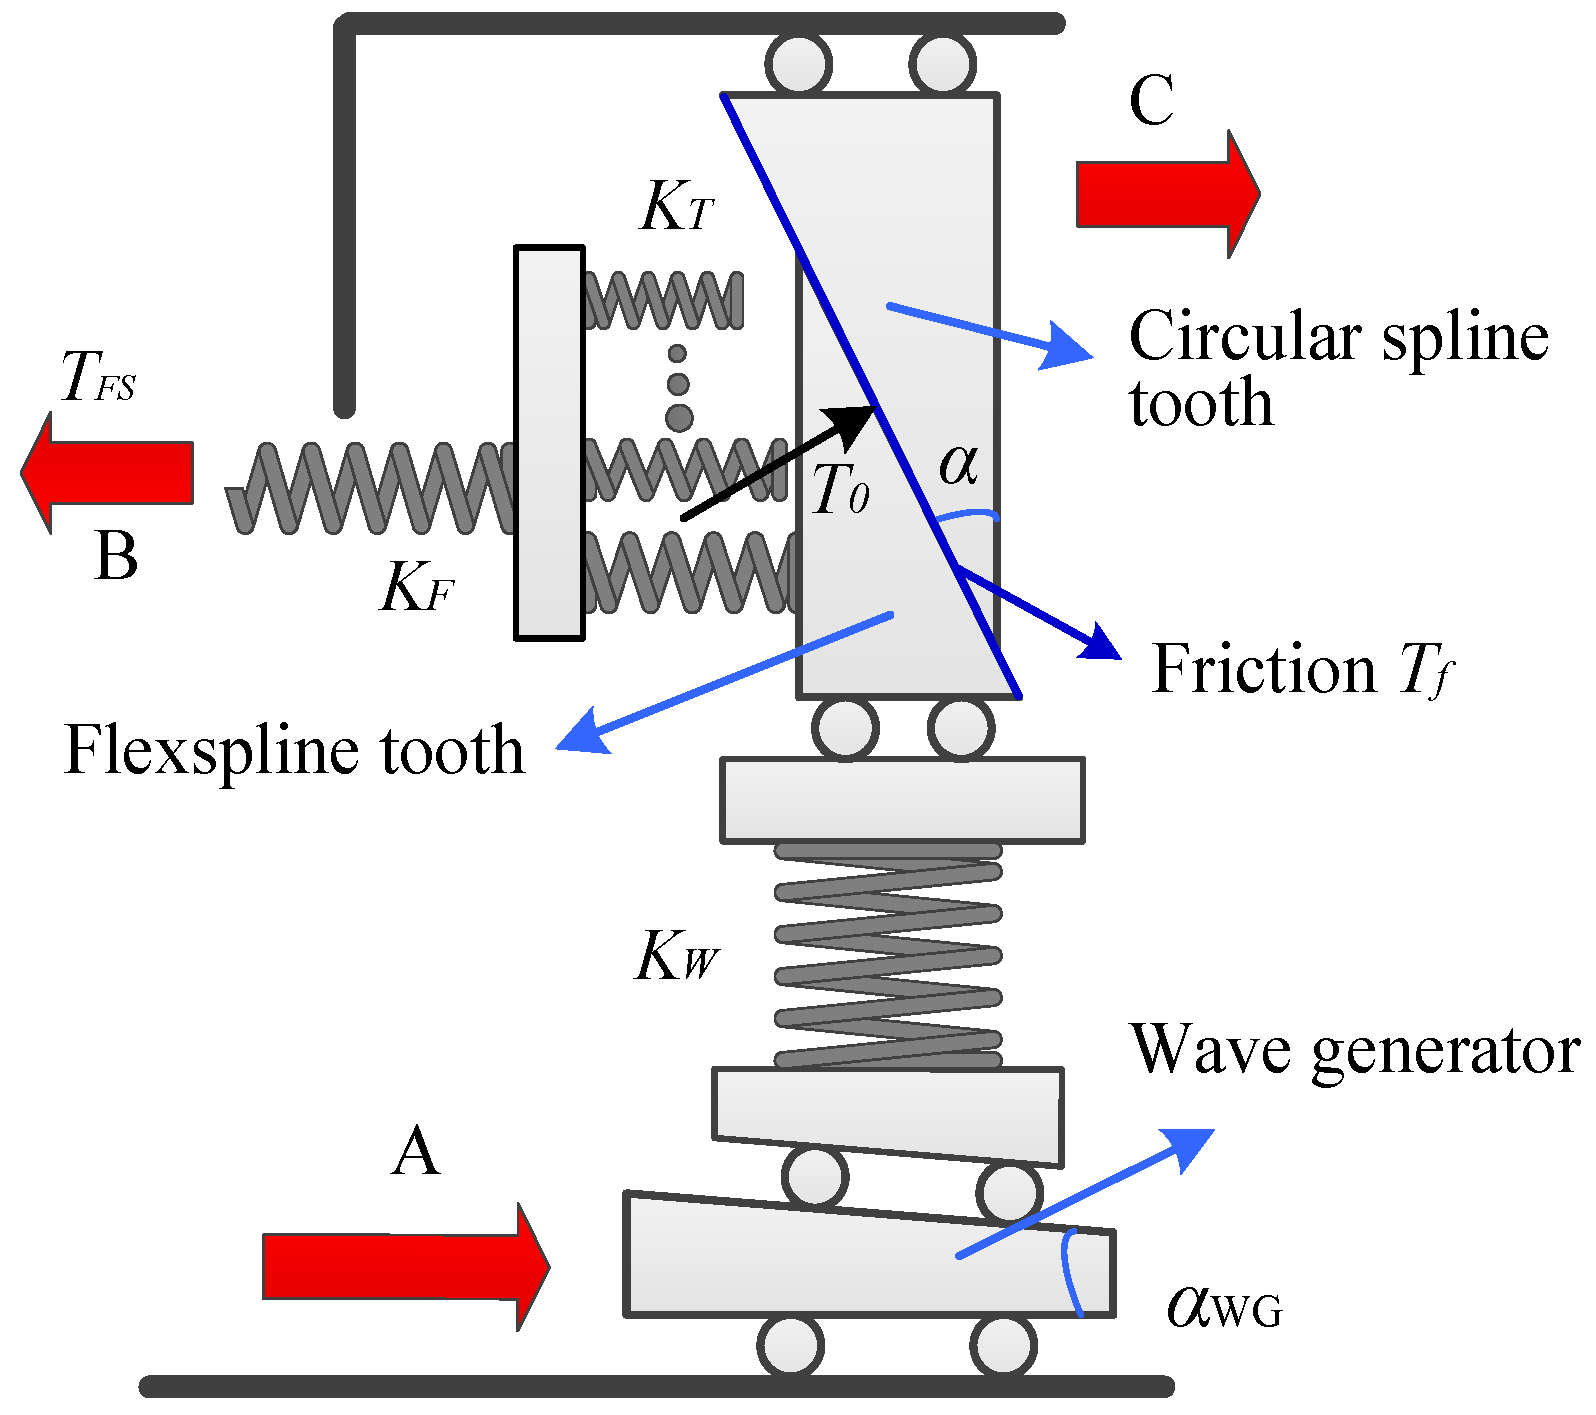
2.2. Basic Model with Friction, Compliance, and Kinematic Error
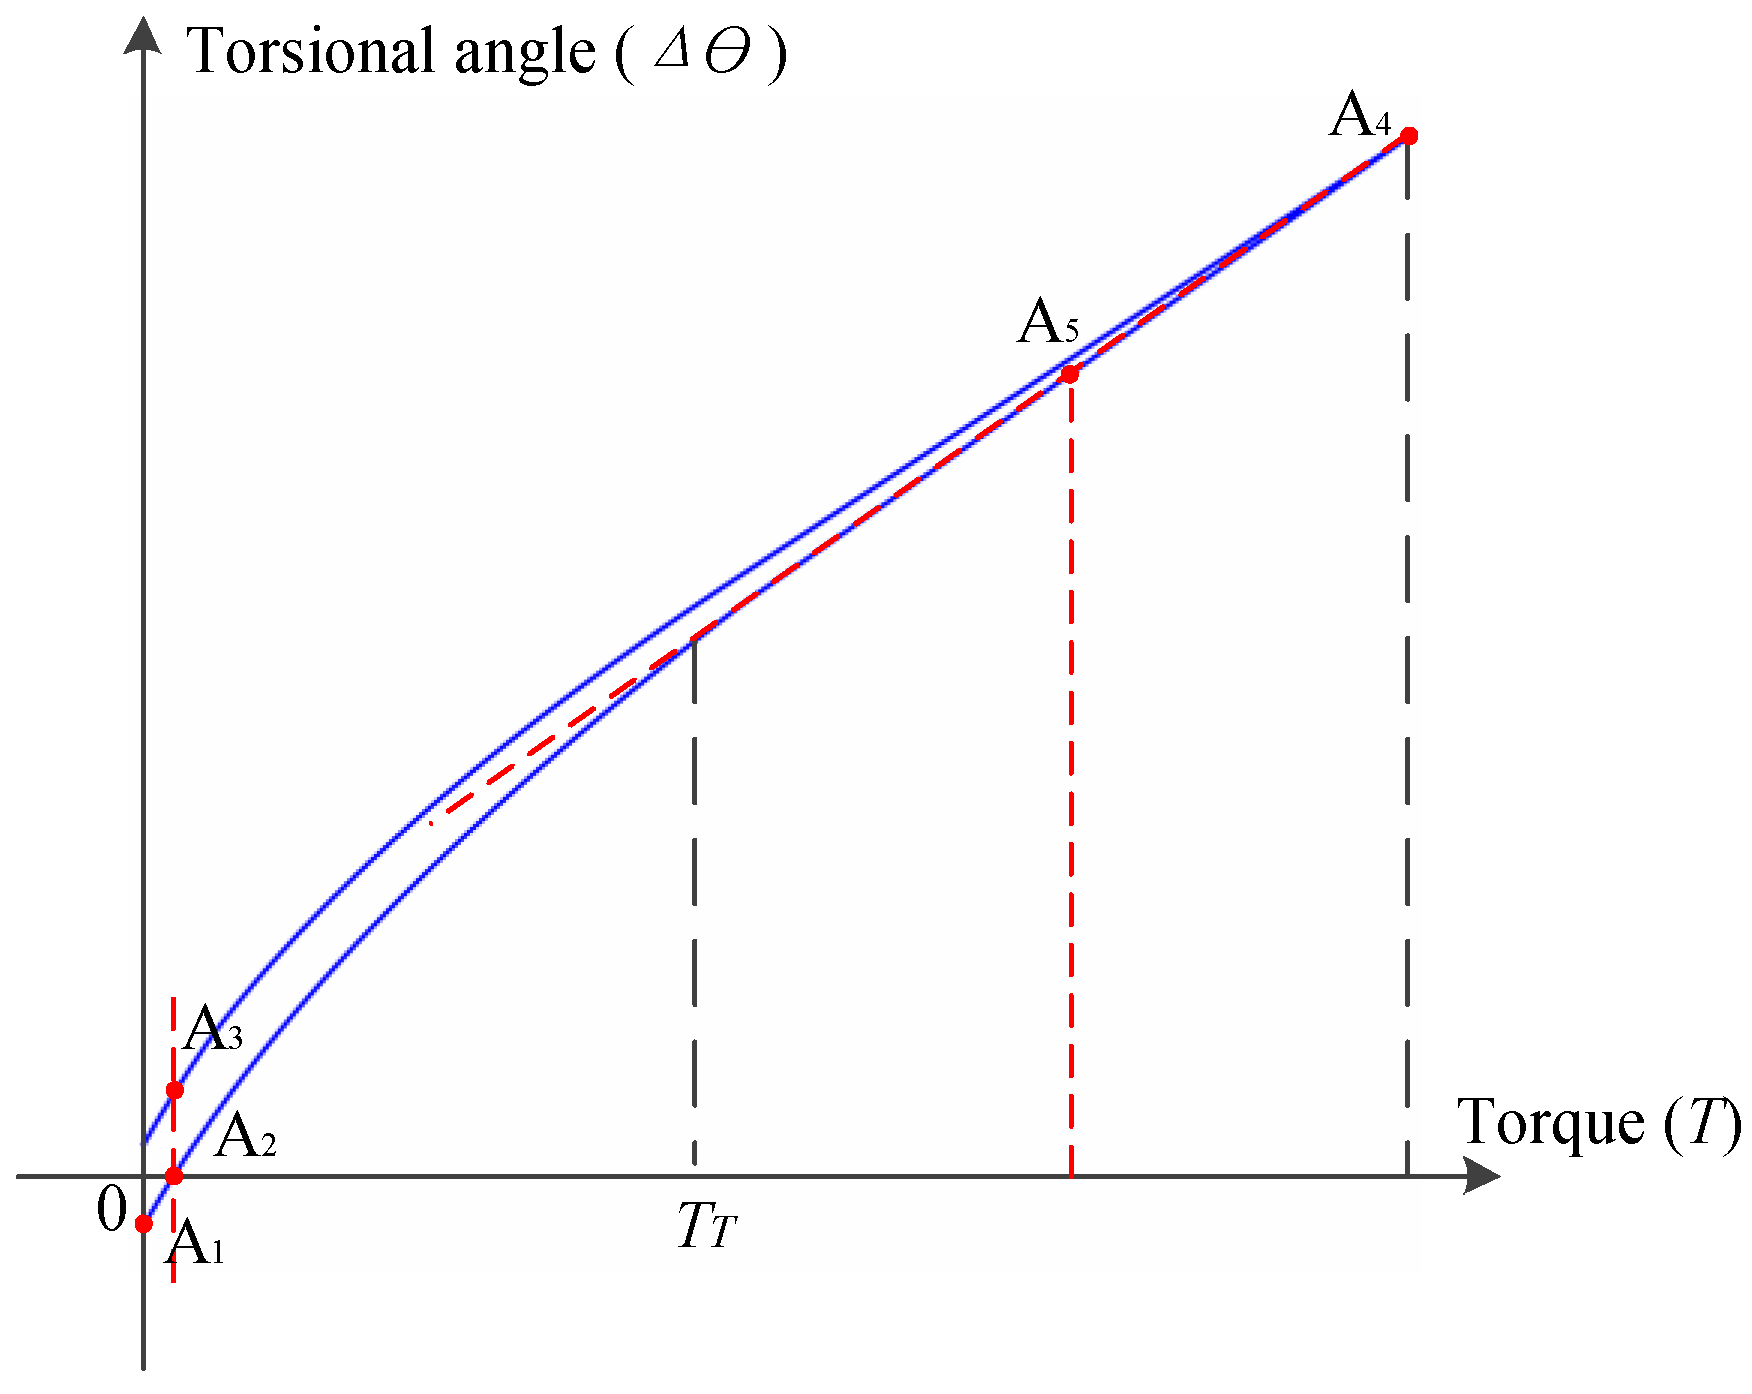
2.3. Modeling of Compliance and Hysteresis
3. Behavioral Degradation
4. Parameter Identification
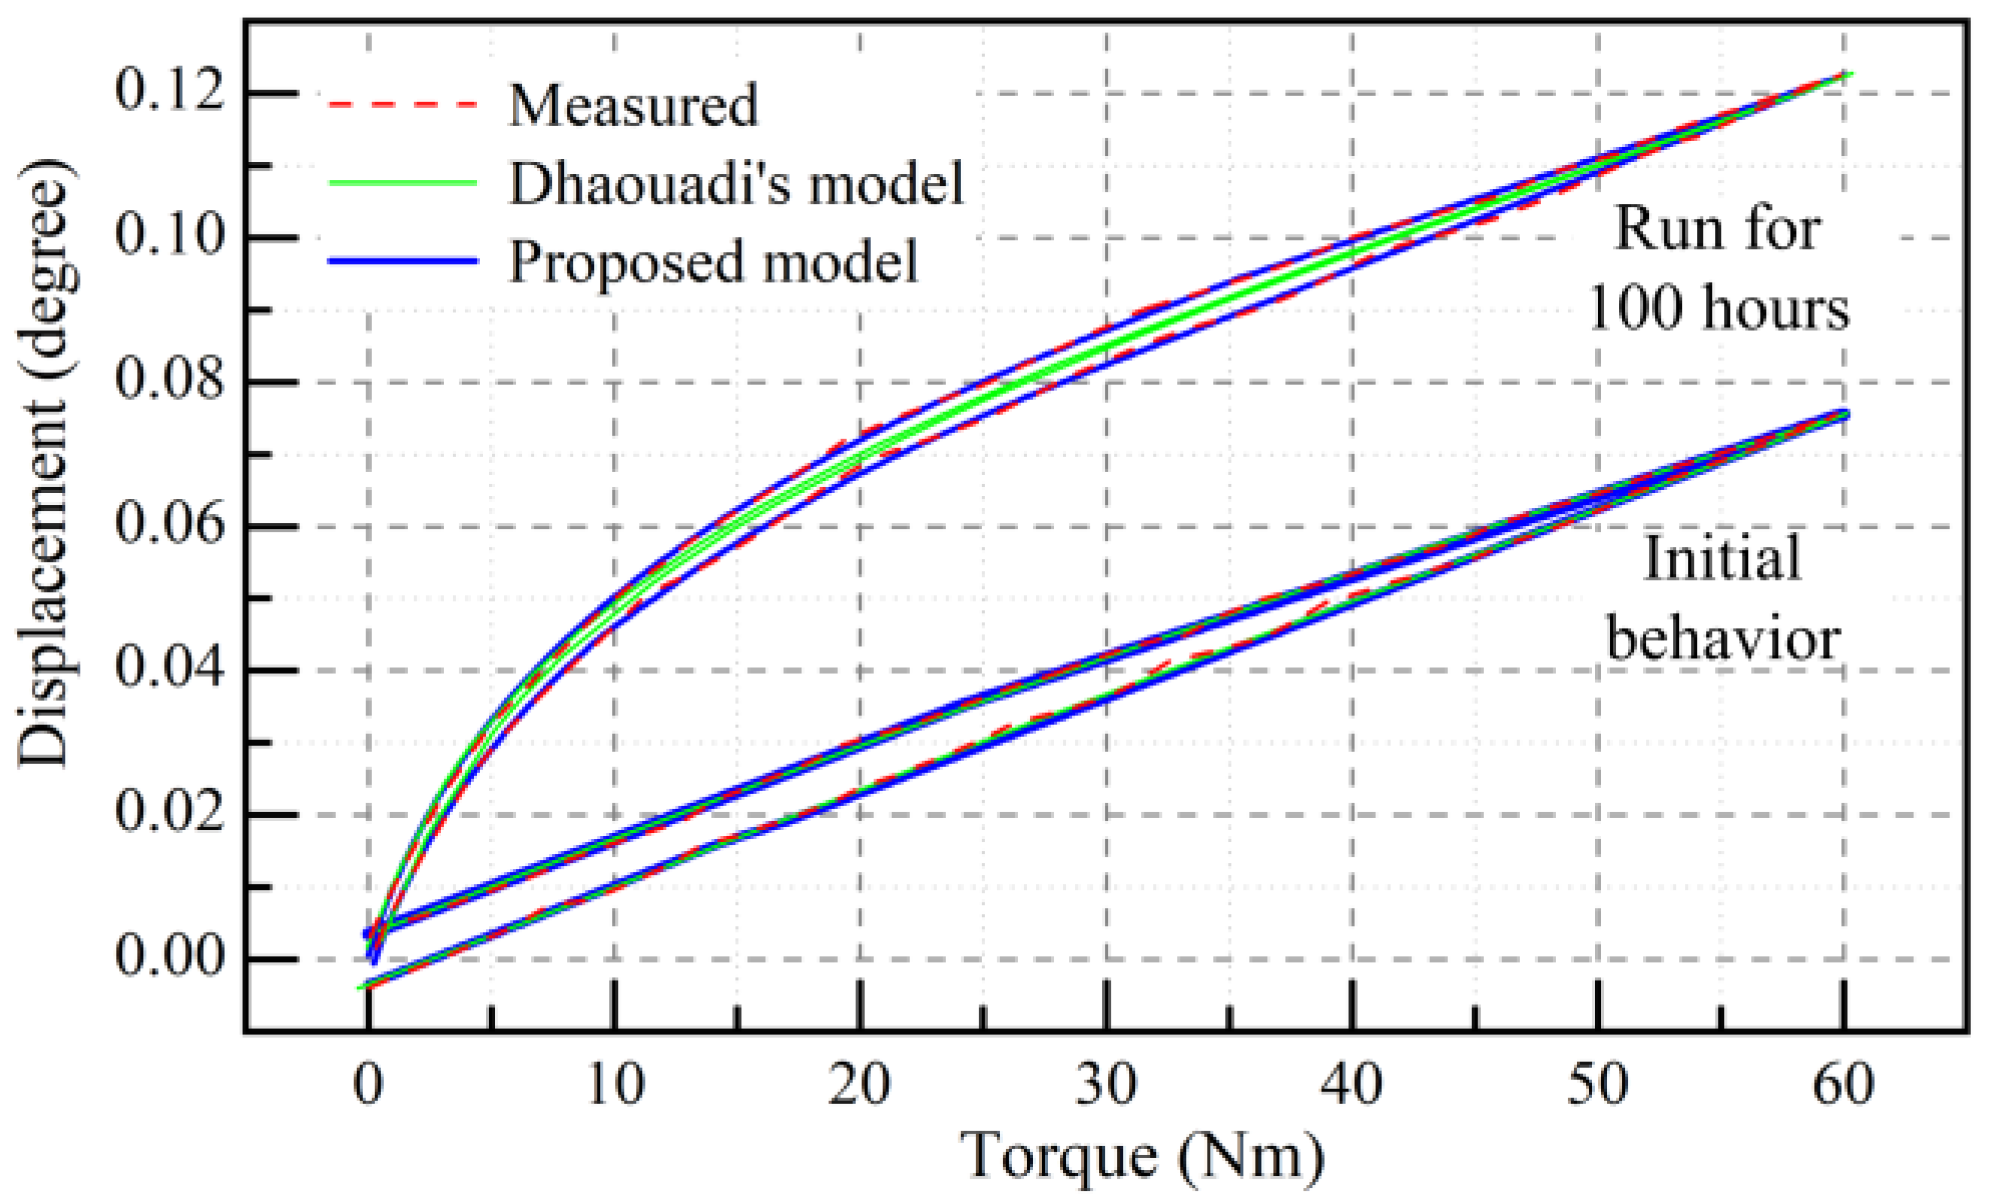
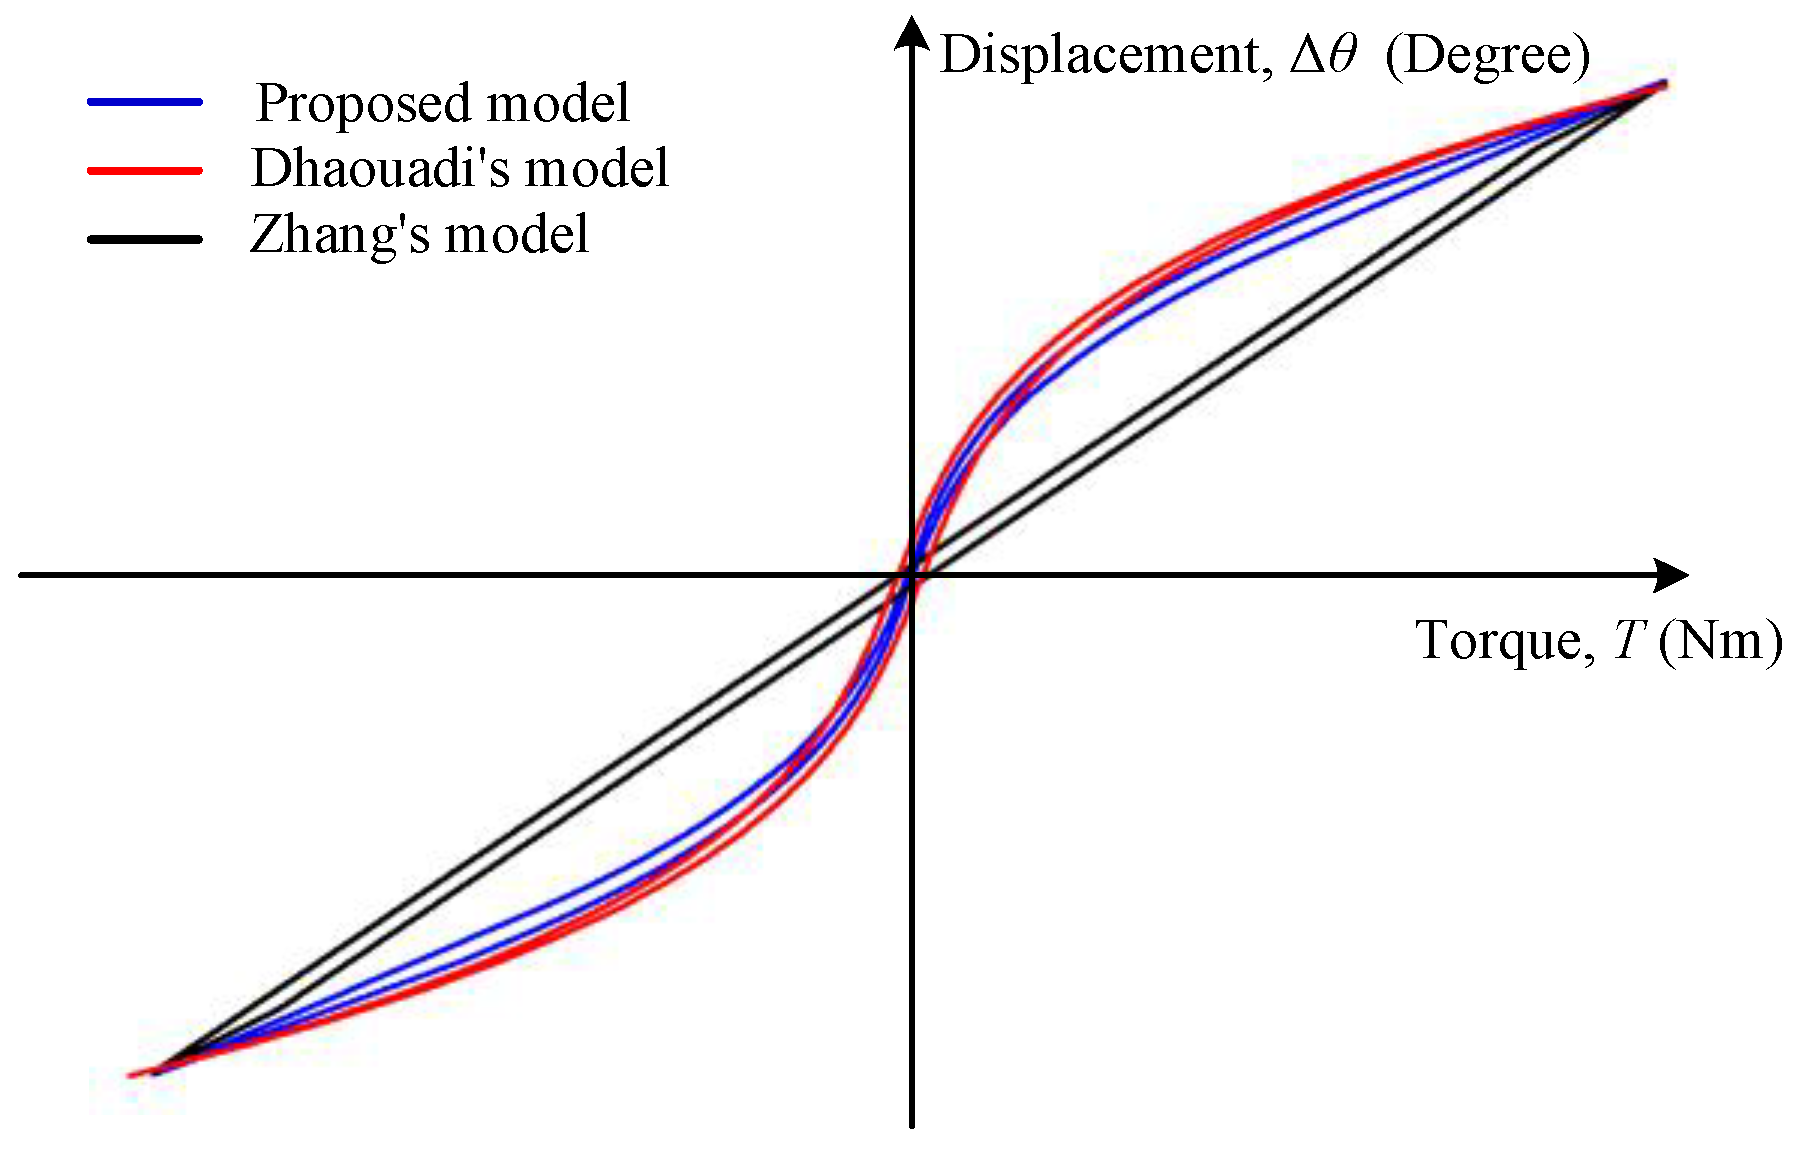
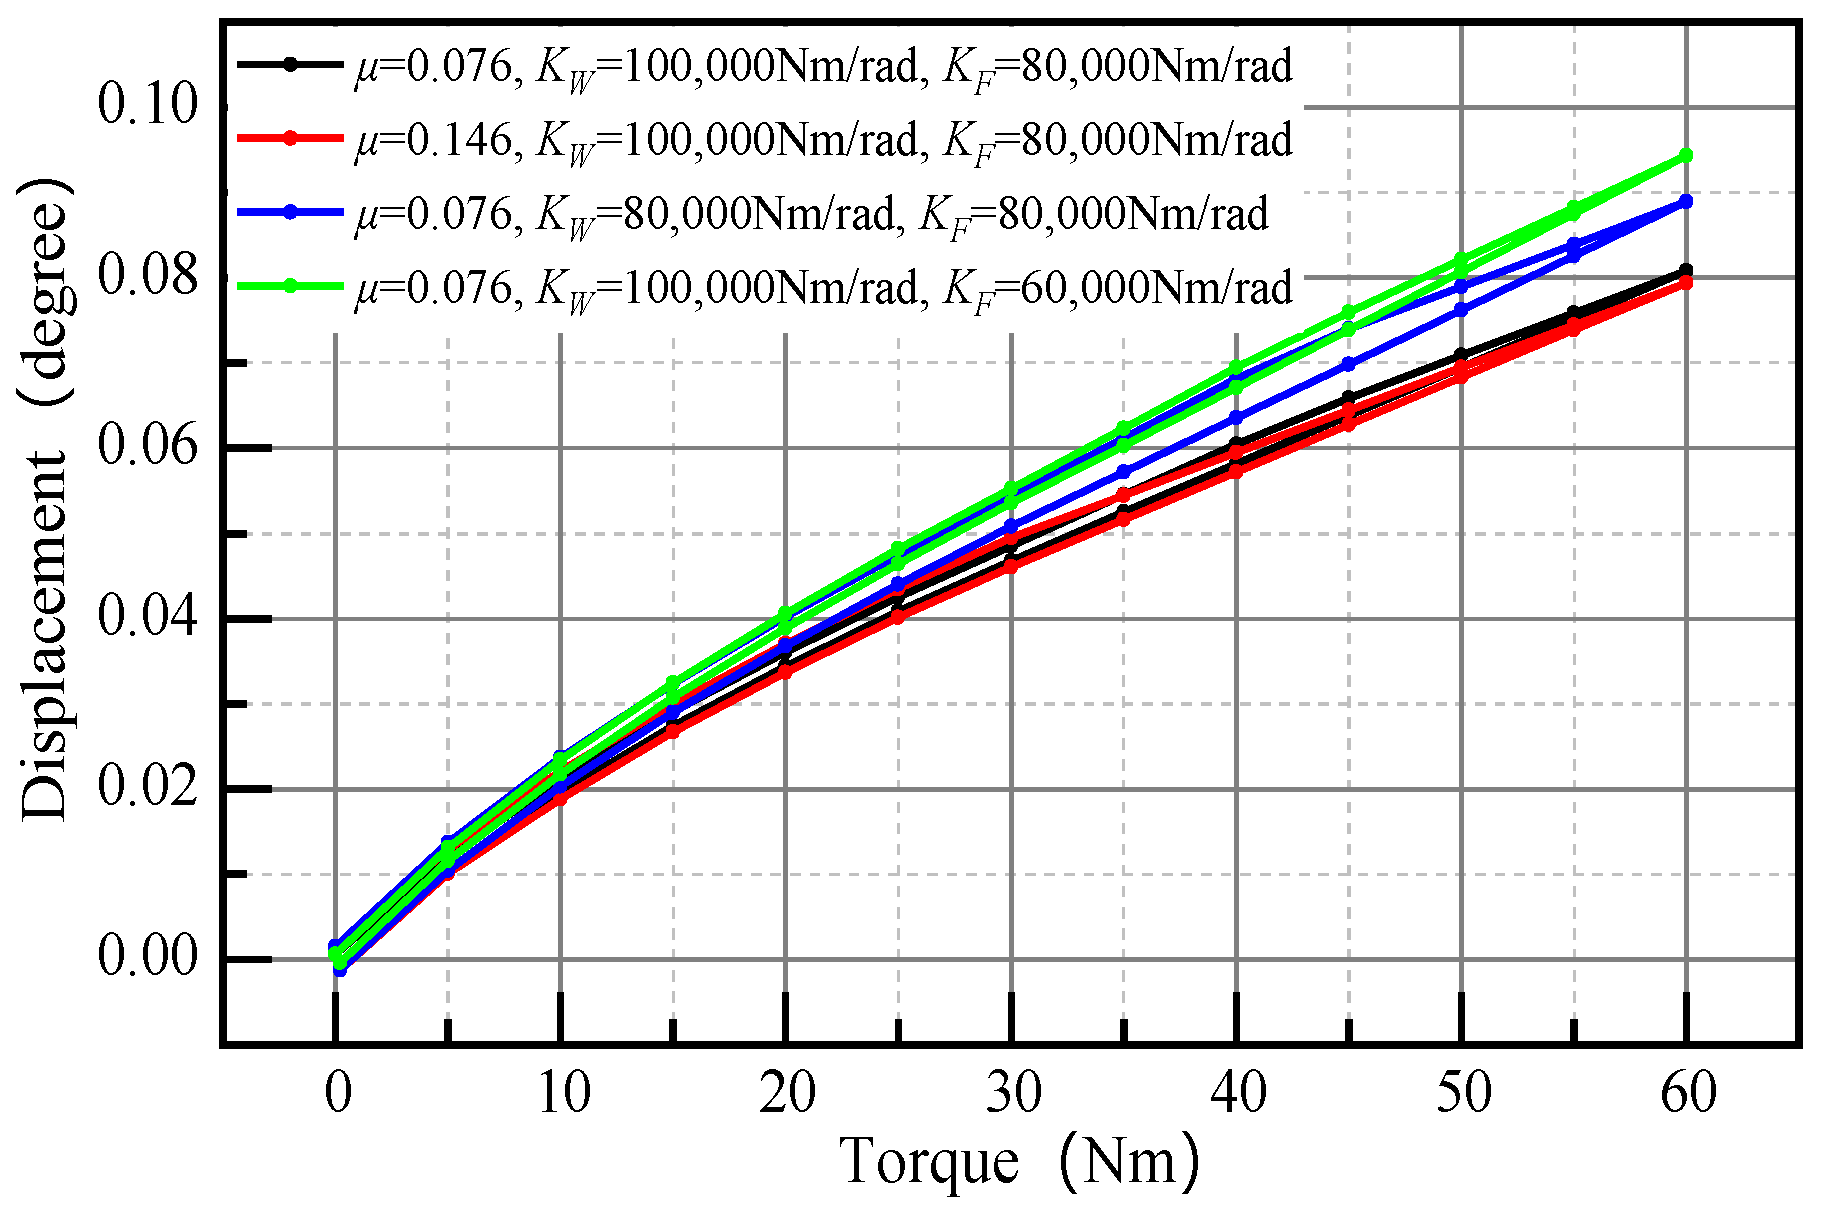
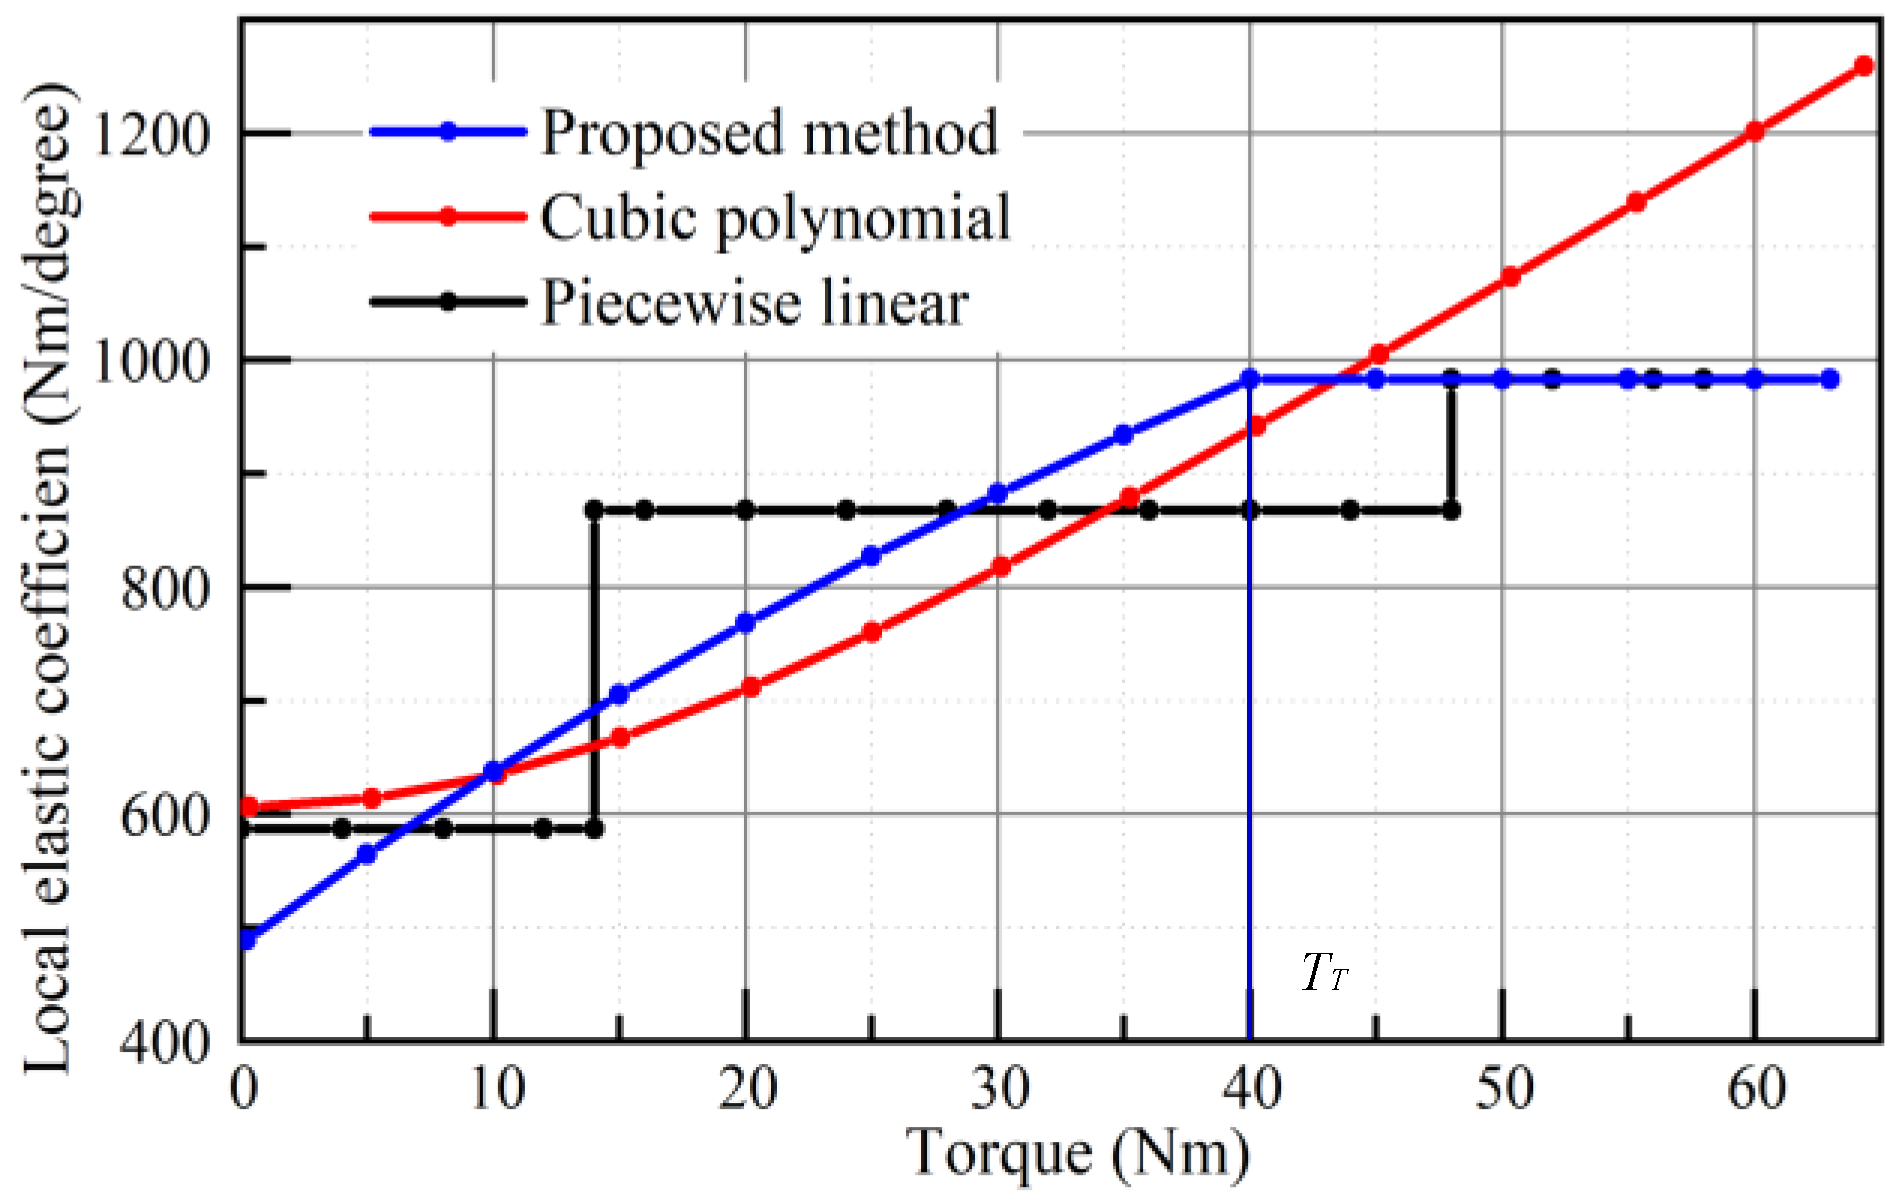
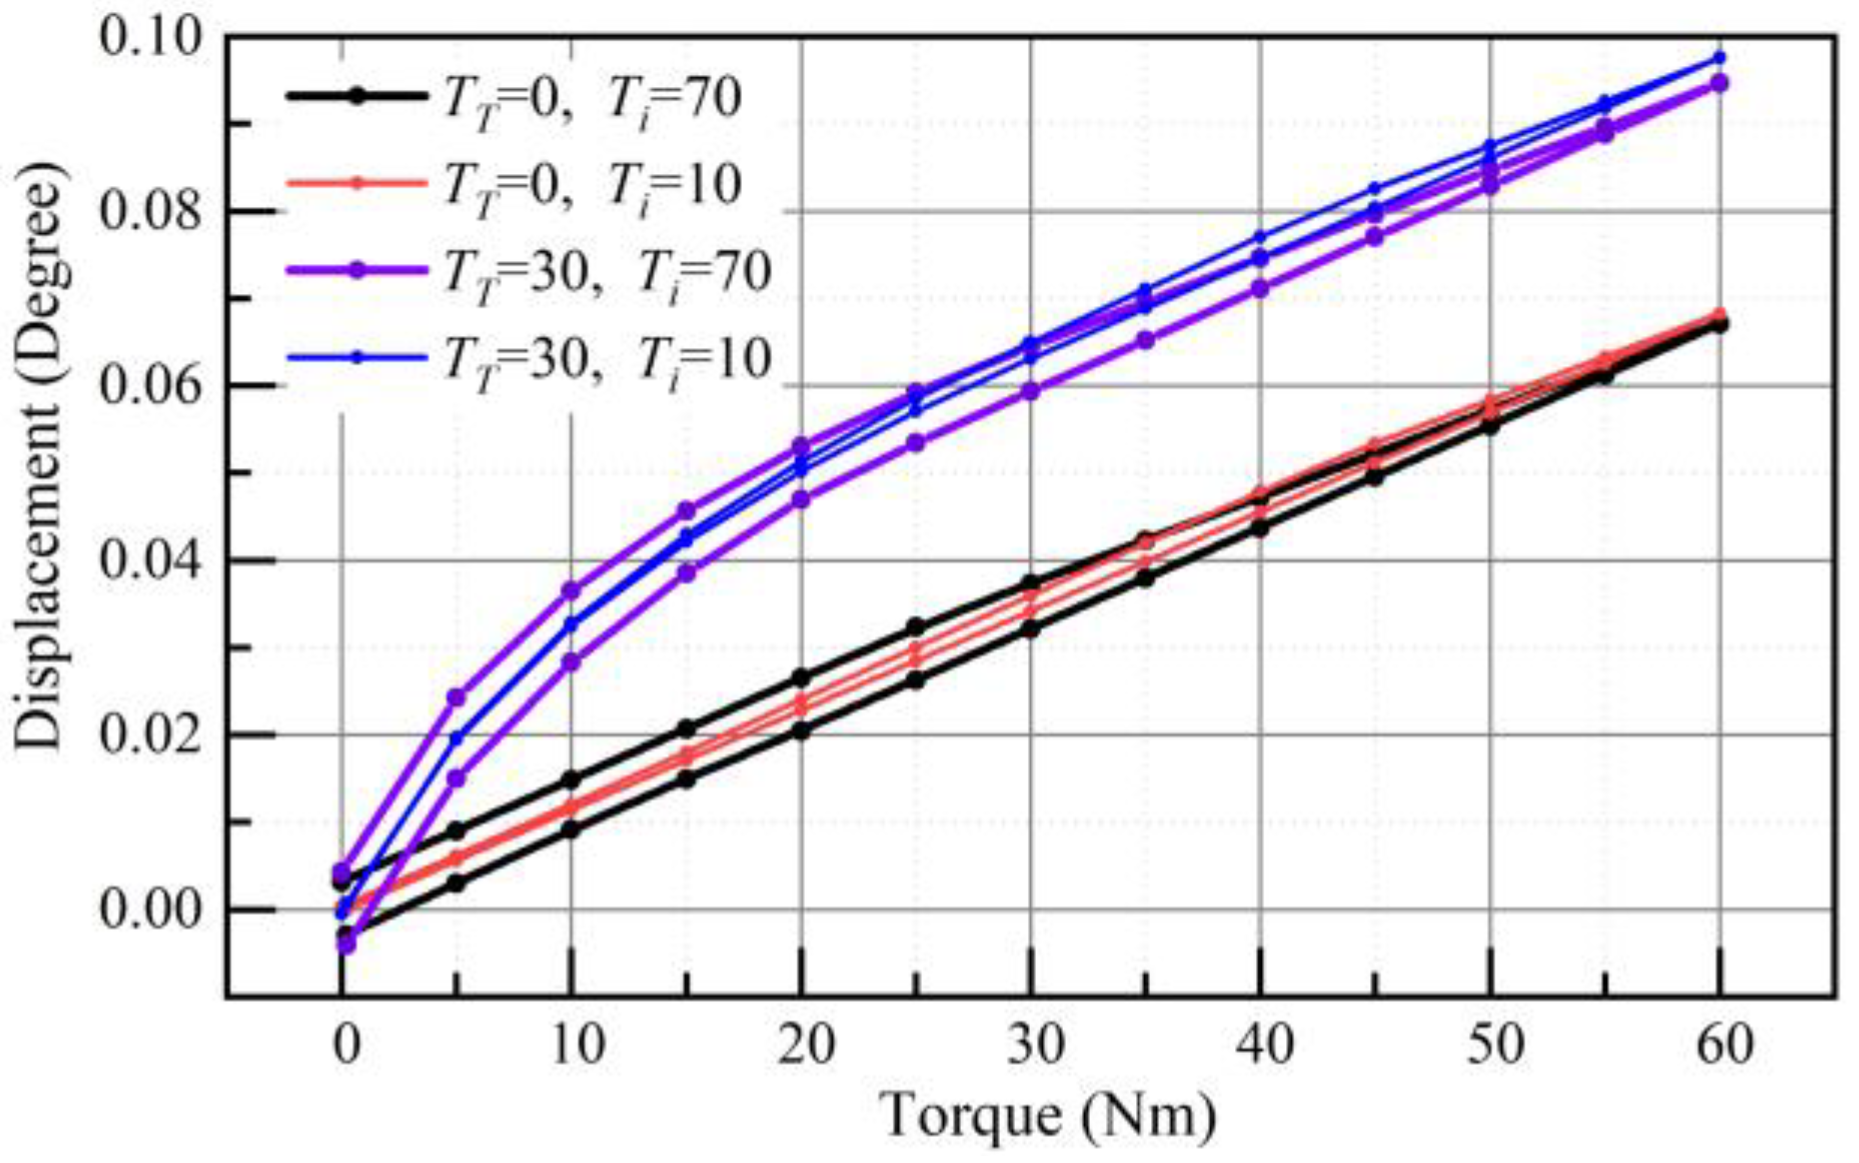
5. Results and Discussion
6. Conclusions
Author Contributions
Funding
Institutional Review Board Statement
Informed Consent Statement
Data Availability Statement
Conflicts of Interest
Nomenclature
| N | reduction Ratio |
| ZCS, ZFS | teeth number of CS and FS |
| θe | kinematic error |
| Δθ | harmonic drive torsional angle |
| θWG, θCS, θFS | angular position of WG, CS, and FS |
| ΔθW, ΔθT, ΔθF | torsional angle of WG, FS teeth, and FS cup |
| Δθu, Δθd, | harmonic drive torsional angle for increasing and decreasing load |
| Δθuj, Δθdj | estimated hysteresis torsional angle |
| ΔθWu, ΔθWd, | wave generator torsional angle for increasing and decreasing load |
| TWG, TCS, TFS | torque of WG, CS, and FS |
| T1, T2 | torque given by the manufacturer |
| Tf | friction torque |
| T0 () | no-load preload |
| Ti () | piecewise linear threshold |
| KT () | combined stiffness of meshing tooth pairs |
| TT () | piecewise linear threshold |
| KFL | local Elastic Coefficient |
| KF, KT, KW | stiffness of FS Cup, FS Teeth, and WG |
| K1, K2, K3 | stiffness Given by the Manufacturer |
| Fs | static friction |
| Fc | minimum value of the Coulomb friction |
| Fv | load parameter |
| Ω | lubricant parameter |
| Ai | amplitude for a particular cyclical frequency |
| Φi | phase angle |
| ωi | frequency |
| a, b (a’, b’) | coefficient of combined stiffness |
| c (c’) | coefficient of no-load preload |
| α | gear-tooth angle |
| δ | additional empirical parameter |
| μc, μl | boundary and hydrodynamic friction coefficient |
| μ | friction coefficient |
| Wl, Wa | load carried by the fluid and asperity |
| λ1, λ2 | fluid and asperity load ratio |
Appendix A. Dhaouadi’s Hysteresis Model
Appendix B. Zhang’s Hysteresis Model
References
- Musser, C.W. Strain Wave Gearing. U.S. Patent No. 2906143, 29 September 1959. [Google Scholar]
- Chen, X.; Liu, Y.; Xing, J. The parametric design of double-circular-arc tooth profile and its influence on the functional backlash of harmonic drive. Mech. Mach. Theory 2014, 72, 1–24. [Google Scholar]
- Pagani, R.; Legnani, G.; Incerti, G. Evaluation and modeling of the friction in robotic joints considering thermal effects. J. Mech. Robot. Trans. ASME 2020, 12, 021108. [Google Scholar] [CrossRef]
- Ghorbel, F.H.; Gandhi, P.S.; Alpeter, F. On the kinematic error in harmonic drive gears. J. Mech. Des. Trans. ASME 2001, 123, 90–97. [Google Scholar] [CrossRef]
- Harmonic Drive Technologies. Reducer Catalog. Available online: https://www.harmonicdrive.net/_hd/content/documents1/reducer_catalog.pdf (accessed on 10 January 2021).
- Volkov, D.P.; Zubkov, Y. Vibrations in a drive with a harmonic gear transmission. Russ. Eng. J. 1978, 58, 11–15. [Google Scholar]
- Hidaka, T.; Ishida, T.; Zhang, Y. Vibration of a strain-wave gearing in an industrial robot. Proc. Int. Power Transm. Gearing Conf. 1989, 11, 789–794. [Google Scholar]
- Dhaouadi, R.; Ghorbel, F.H.; Gandhi, P.S. A new dynamic model of hysteresis in harmonic drives. IEEE Trans. Ind. Electron. 2003, 50, 1165–1171. [Google Scholar] [CrossRef] [Green Version]
- Marilier, T.; Richard, J.A. Non-linear mechanic and electric behavior of a robot axis with a “harmonic-drive” gear. Robot. Comput. Integr. Manuf. 1989, 5, 129–136. [Google Scholar] [CrossRef]
- Zhang, H.; Ahmad, S.; Liu, G. Modeling of torsional compliance and hysteresis behaviors in harmonic drives. IEEE/ASME Trans. Mechatron. 2014, 20, 178–185. [Google Scholar]
- Tuttle, T.D.; Seering, W.P. A nonlinear model of a harmonic drive gear transmission. IEEE Trans. Robot. Autom. 1996, 12, 368–374. [Google Scholar] [CrossRef]
- Seyfferth, W.; Maghzal, A.J.; Angeles, J. Nonlinear modeling and parameter identification of harmonic drive robotic transmissions. In Proceedings of the 1995 IEEE International Conference on Robotics and Automation, Nagoya, Japan, 21–27 May 1995; Volume 3, pp. 3027–3032. [Google Scholar]
- Taghirad, H.D. On the Modeling and Identification of Harmonic Drive System. Ph.D. Thesis, Centre for Intelligent Machines, McGill University, Montréal, QC, Canada, 1997. [Google Scholar]
- Ruderman, M.; Hoffmann, F.; Bertram, T. Modeling and identification of elastic robot joints with hysteresis and backlash. IEEE Trans. Ind. Electron. 2009, 56, 3840–3847. [Google Scholar]
- Preissner, C.; Royston, T.J.; Shu, D. A high-fidelity harmonic drive model. J. Dyn. Syst. Meas. Control Trans. ASME 2011, 134, 011002. [Google Scholar] [CrossRef]
- Tjahjowidodo, T.; Al-Bender, F.; Van Brussel, H. Theoretical modelling and experimental identification of nonlinear torsional behaviour in harmonic drives. Mechatronics 2013, 23, 497–504. [Google Scholar] [CrossRef]
- Gandhi, P.S.; Ghorbel, F.H.; Dabney, J. Modeling, identification, and compensation of friction in harmonic drives. In Proceedings of the 41st IEEE Conference on Decision and Control, Las Vegas, NV, USA, 10–13 December 2002; Volume 1, pp. 160–166. [Google Scholar]
- Hong, J.; Hong, D.; Kim, B.G. Modeling backlash-like hysteresis of tendon sheath mechanism-pair. J. Mech. Robot. Trans. ASME 2020. [Google Scholar] [CrossRef]
- Dong, H.; Wang, D.; Ting, K. Kinematic effect of the compliant cup in harmonic drives. J. Mech. Des. Trans. ASME 2011, 133, 051004. [Google Scholar] [CrossRef]
- Sahoo, V.; Maiti, R. Load sharing by tooth pairs in involute toothed harmonic drive with conventional wave generator cam. Meccanica 2017, 53, 373–394. [Google Scholar]
- Ma, J.; Li, C.; Luo, Y.; Cui, L. Simulation of meshing characteristics of harmonic reducer and experimental verification. Adv. Mech. Eng. 2018, 10, 1–9. [Google Scholar]
- Schmidt, J.; Schmid, M. Life test of an industrial standard and of a stainless steel harmonic drive. In Proceedings of the 14th European Space Mechanisms and Tribology Symposium, Constance, Germany, 28–30 September 2011. [Google Scholar]
- Schafer, I.; Bourlier, P.; Hantschack, F.; Roberts, E.W.; John, C. Space lubrication and performance of harmonic drive gears. In Proceedings of the 11th Esmats Symposium, Lucerne, Switzerland, 21–23 September 2005. [Google Scholar]
- Heimerdinger, H.; Schmid, M. Life test experience on a harmonic-drive-based actuator. In Proceedings of the 6th European Space Mechanisms and Tribology Symposium, Zürich, Switzerland, 4–6 October 1995. [Google Scholar]
- Gill, S.; Forster, D.J.; Rowntree, R.A. Thermal vacuum performance of cycloid and harmonic gearboxes with solid (MoS2) and liquid (Braycote 601) lubrication. In Proceedings of the 5th European Space Mechanisms and Tribology Symposium, Noordwijk, The Netherlands, 28–30 October 1992. [Google Scholar]
- Ahmad, S.; Zhang, H.; Liu, G. Multiple working mode control of door-opening with a mobile modular and reconfigurable robot. IEEE/ASME Trans. Mechatron. 2013, 18, 833–844. [Google Scholar]
- Zhang, H.; Ahmad, S.; Liu, G. Torque estimation for robotic joint with harmonic drive transmission based on position measurements. IEEE Trans. Robot. 2015, 31, 322–330. [Google Scholar] [CrossRef]
- Hassani, V.; Tjahjowidodo, T.; Do, T.N. A survey on hysteresis modeling, identification and control. Mech. Syst. Signal Process. 2014, 49, 209–233. [Google Scholar]
- Al-Bender, F.; Symens, W.; Swevers, J.; Van Brussel, H. Theoretical analysis of the dynamic behavior of hysteresis elements in mechanical systems. Int. J. Non-Linear Mech. 2004, 39, 1721–1735. [Google Scholar]
- Ueura, K.; Kiyosawa, Y.; Kurogi, J.; Kanai, S.; Miyaba, K.; Maniwa, K.; Suzuki, M.; Obara, S. Tribological aspects of a strain wave gearing system with specific reference to its space application. Proc. Inst. Mech. Eng. Part J J. Eng. Tribol. 2008, 222, 1051–1061. [Google Scholar] [CrossRef]
- Masjedi, M.; Khonsari, M.M. An engineering approach for rapid evaluation of traction coefficient and wear in mixed EHL. Tribol. Int. 2015, 92, 184–190. [Google Scholar] [CrossRef]
- Pedersen, N.L.; Jorgensen, M.F. On gear tooth stiffness evaluation. Comput. Struct. 2014, 135, 109–117. [Google Scholar] [CrossRef]


| Name | Rating | Resolution |
|---|---|---|
| Driving servo motor | 6.5 Nm | - |
| Torque sensor for the input side | 20 Nm | 0.02 Nm |
| Encoder for input side | - | 0.00439° |
| Loading servo torque motor | 500 Nm | 0.5 Nm |
| Torque sensor for the output side | 1000 Nm | 0.1 Nm |
| Encoder for the output side | - | 0.00056° |
| Parameter | Initial Curve | Post-Test | Parameter | Initial Curve | Post-Test |
|---|---|---|---|---|---|
| TT | 0 Nm | 30 Nm | KW | 101,837.5 Nm/rad | 98,548.7 Nm/rad |
| A | - | 1833.5 | Μ | 0.066 | 0.076 |
| B | - | 5729.6 | C | −1.177 | −1.152 |
| KF (K) | 50,923.2 Nm/rad | 78,197.8 Nm/rad | Ti | 115.5 Nm | 70.2 Nm |
Publisher’s Note: MDPI stays neutral with regard to jurisdictional claims in published maps and institutional affiliations. |
© 2021 by the authors. Licensee MDPI, Basel, Switzerland. This article is an open access article distributed under the terms and conditions of the Creative Commons Attribution (CC BY) license (http://creativecommons.org/licenses/by/4.0/).
Share and Cite
Tang, T.; Jia, H.; Li, J.; Wang, J.; Zeng, X. Modeling of Transmission Compliance and Hysteresis Considering Degradation in a Harmonic Drive. Appl. Sci. 2021, 11, 665. https://doi.org/10.3390/app11020665
Tang T, Jia H, Li J, Wang J, Zeng X. Modeling of Transmission Compliance and Hysteresis Considering Degradation in a Harmonic Drive. Applied Sciences. 2021; 11(2):665. https://doi.org/10.3390/app11020665
Chicago/Turabian StyleTang, Ting, Hang Jia, Junyang Li, Jiaxu Wang, and Xingyu Zeng. 2021. "Modeling of Transmission Compliance and Hysteresis Considering Degradation in a Harmonic Drive" Applied Sciences 11, no. 2: 665. https://doi.org/10.3390/app11020665