Numerical Design and Laboratory Testing of Encapsulated PCM Panels for PCM-Air Heat Exchangers
Abstract
:1. Introduction
2. Methods
2.1. Design Procedure
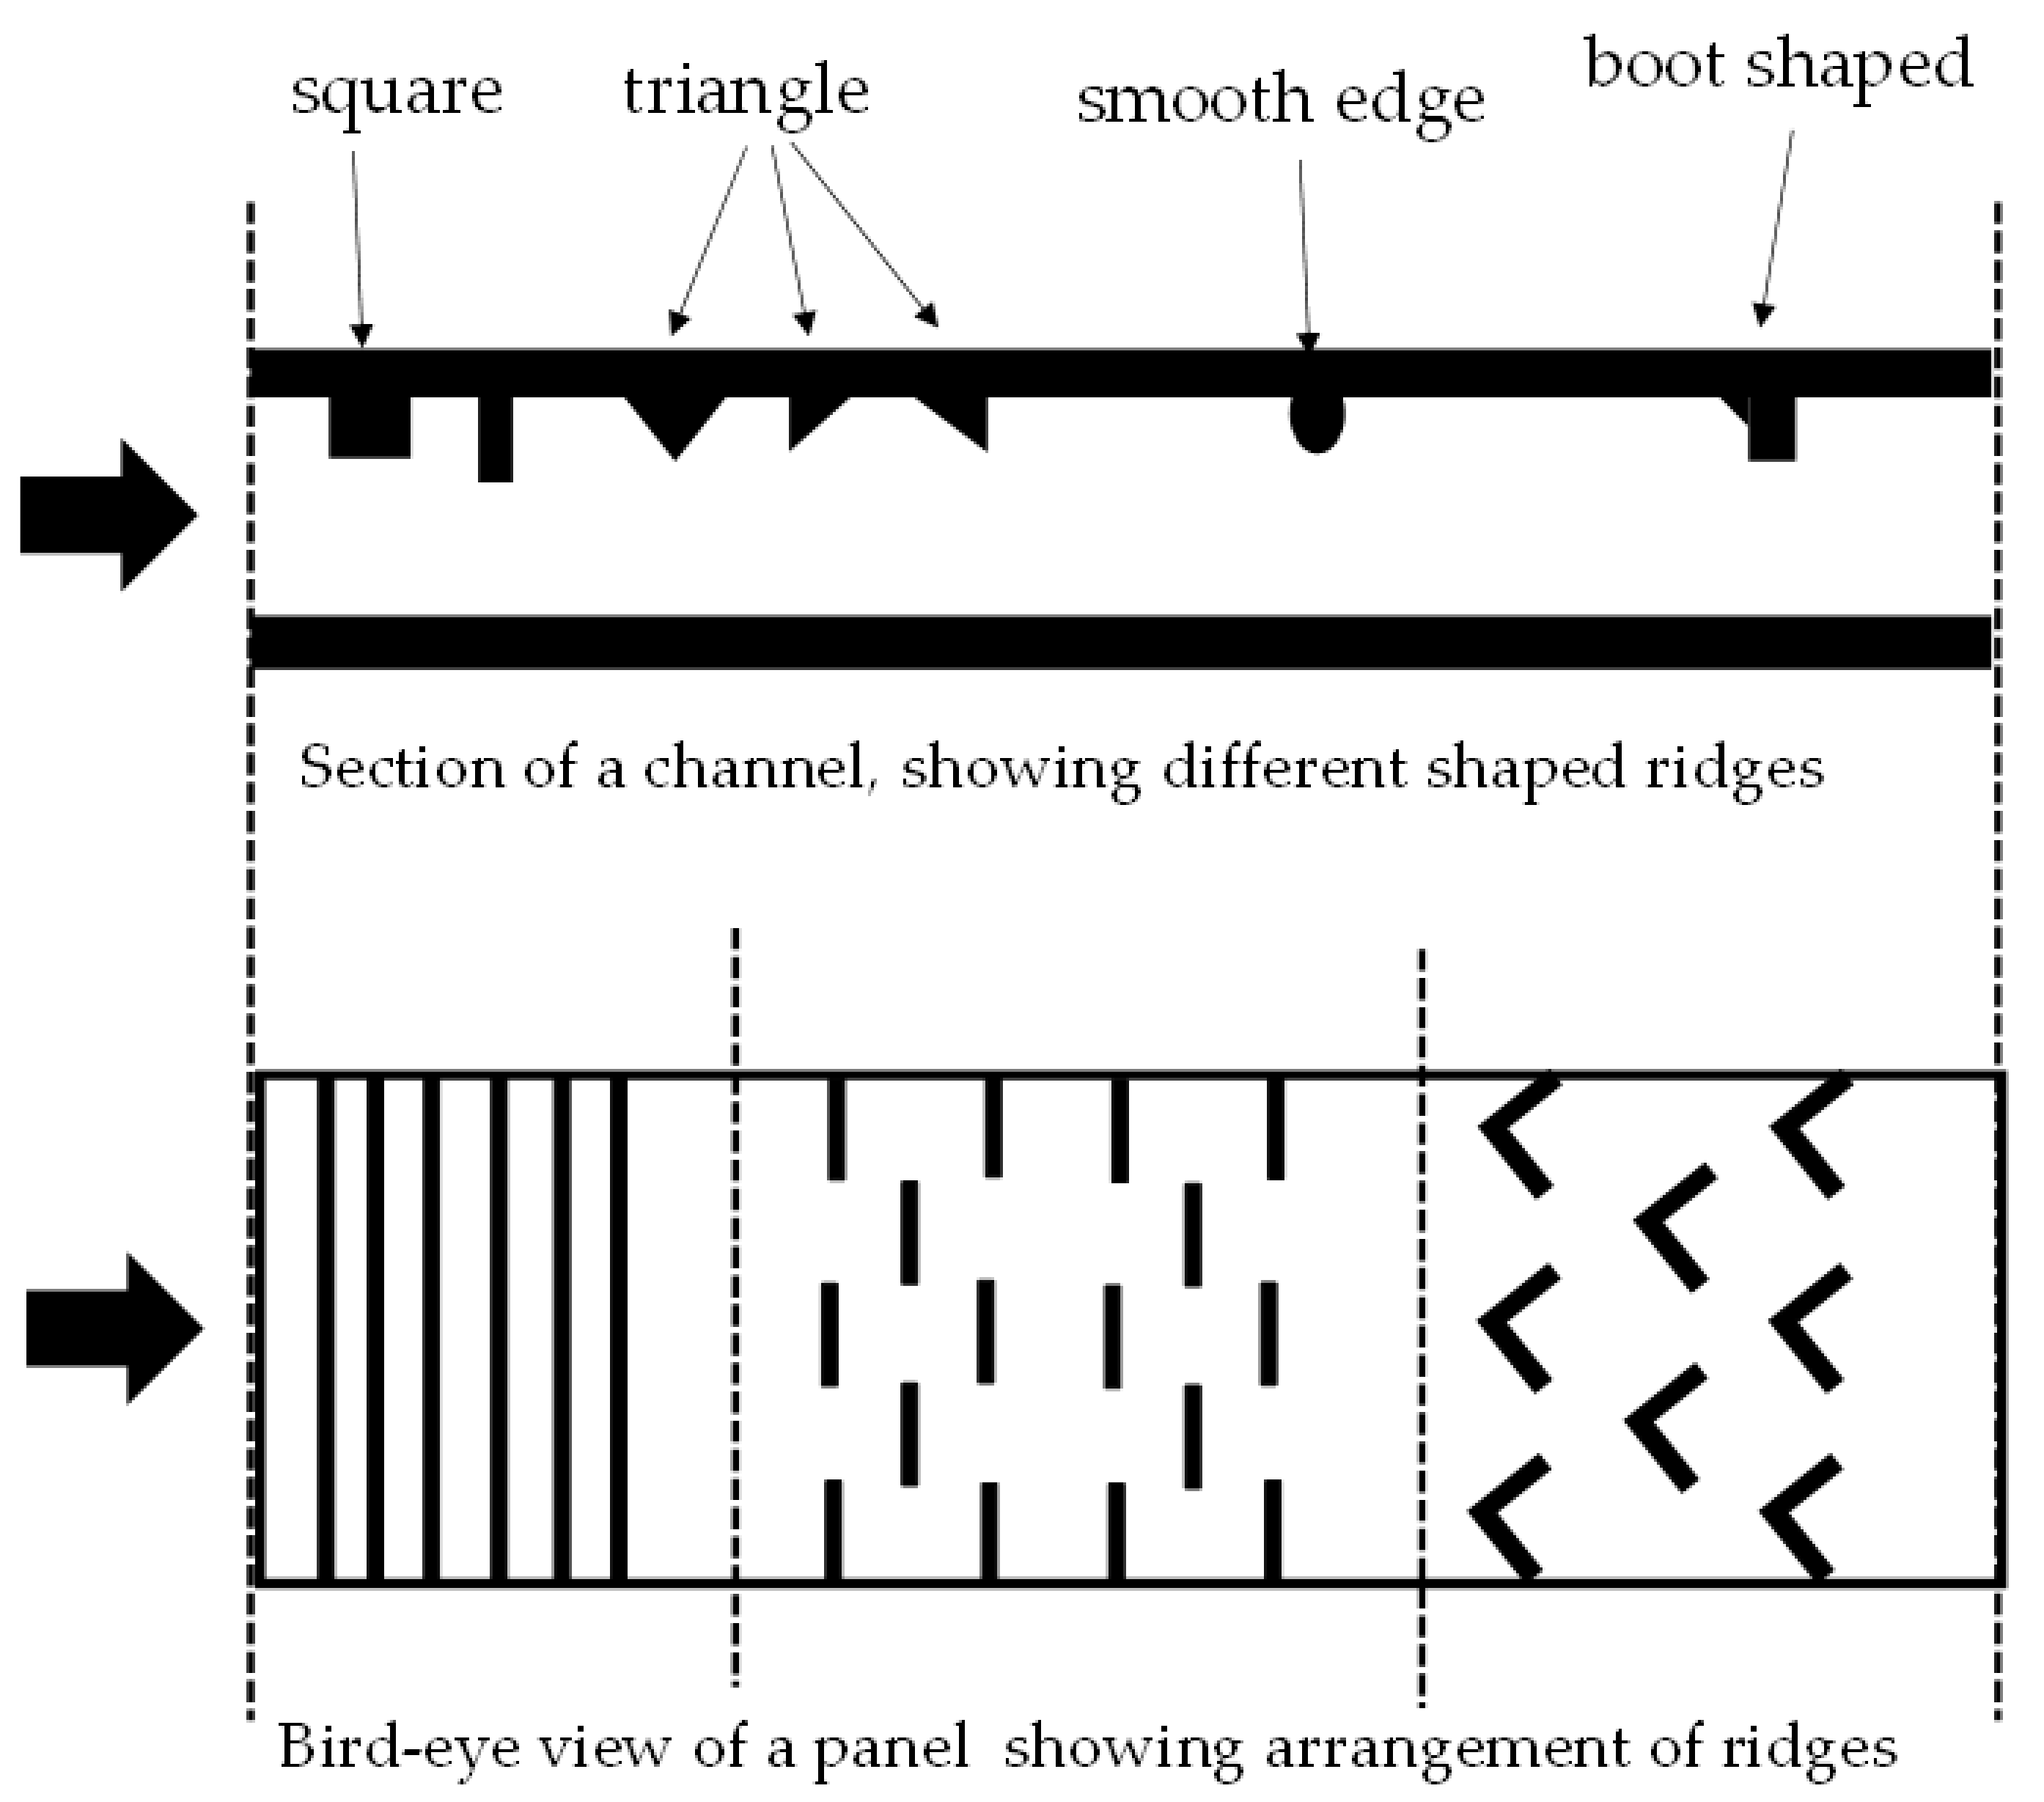
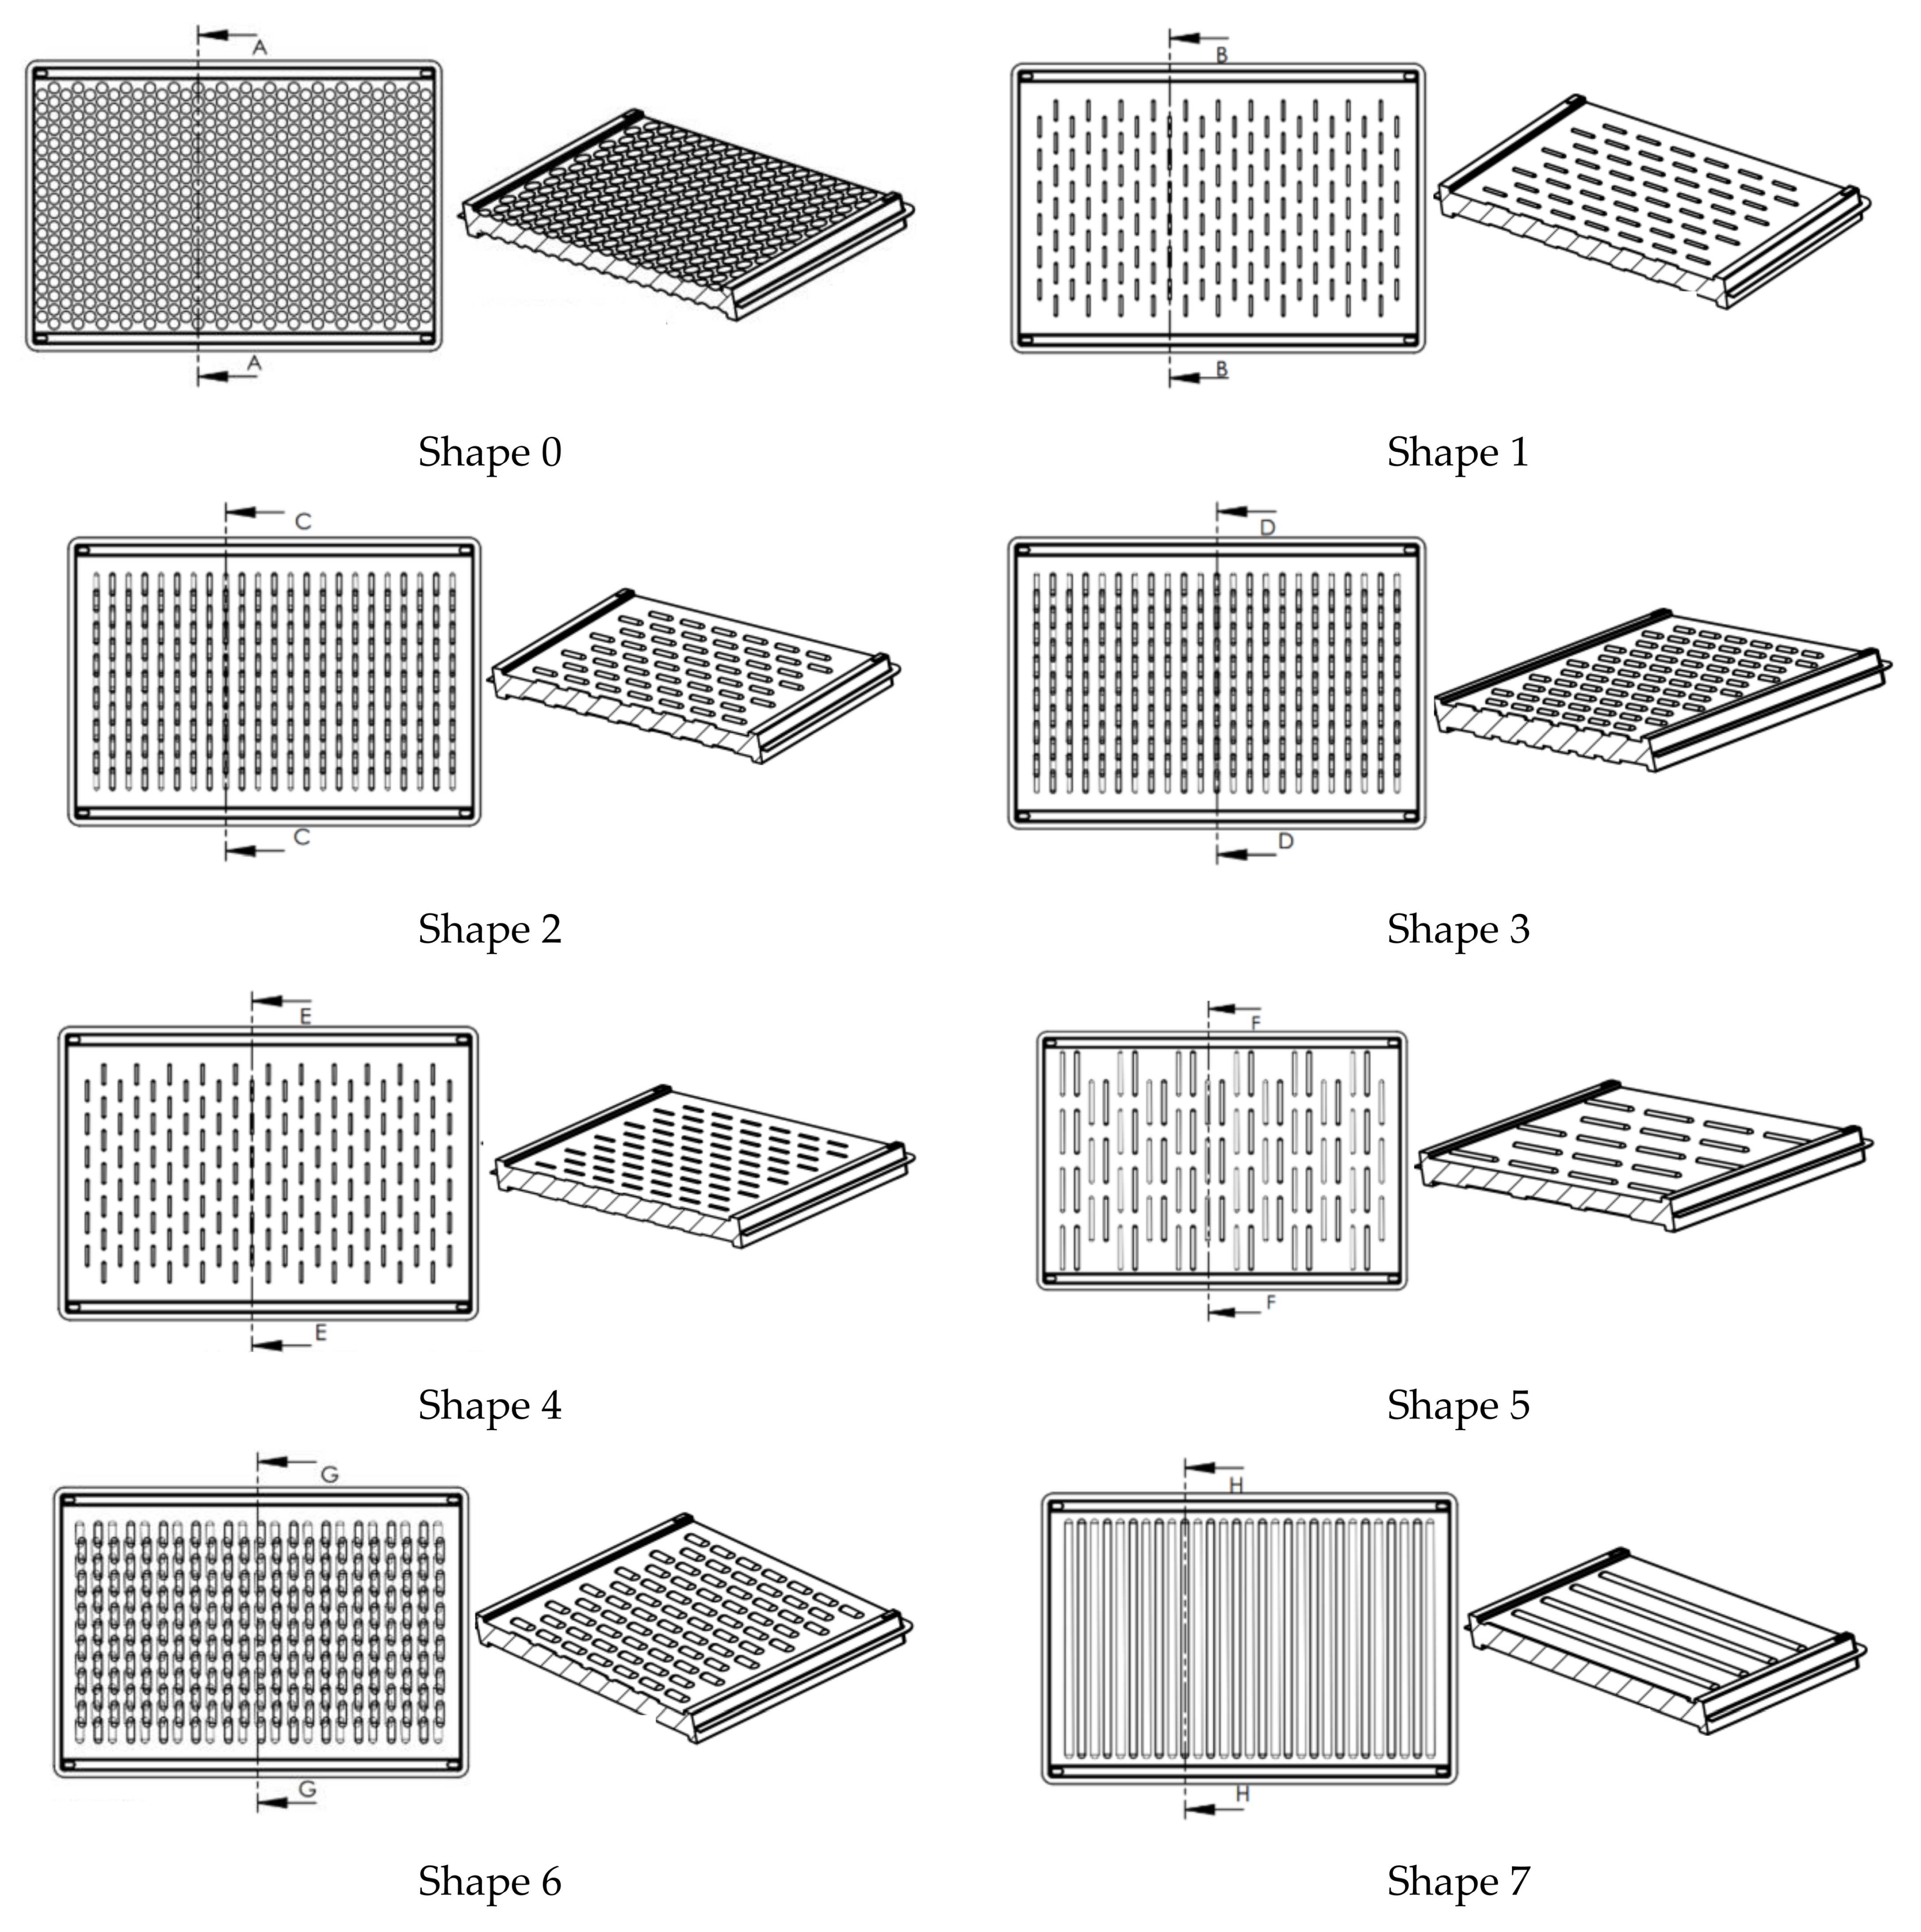
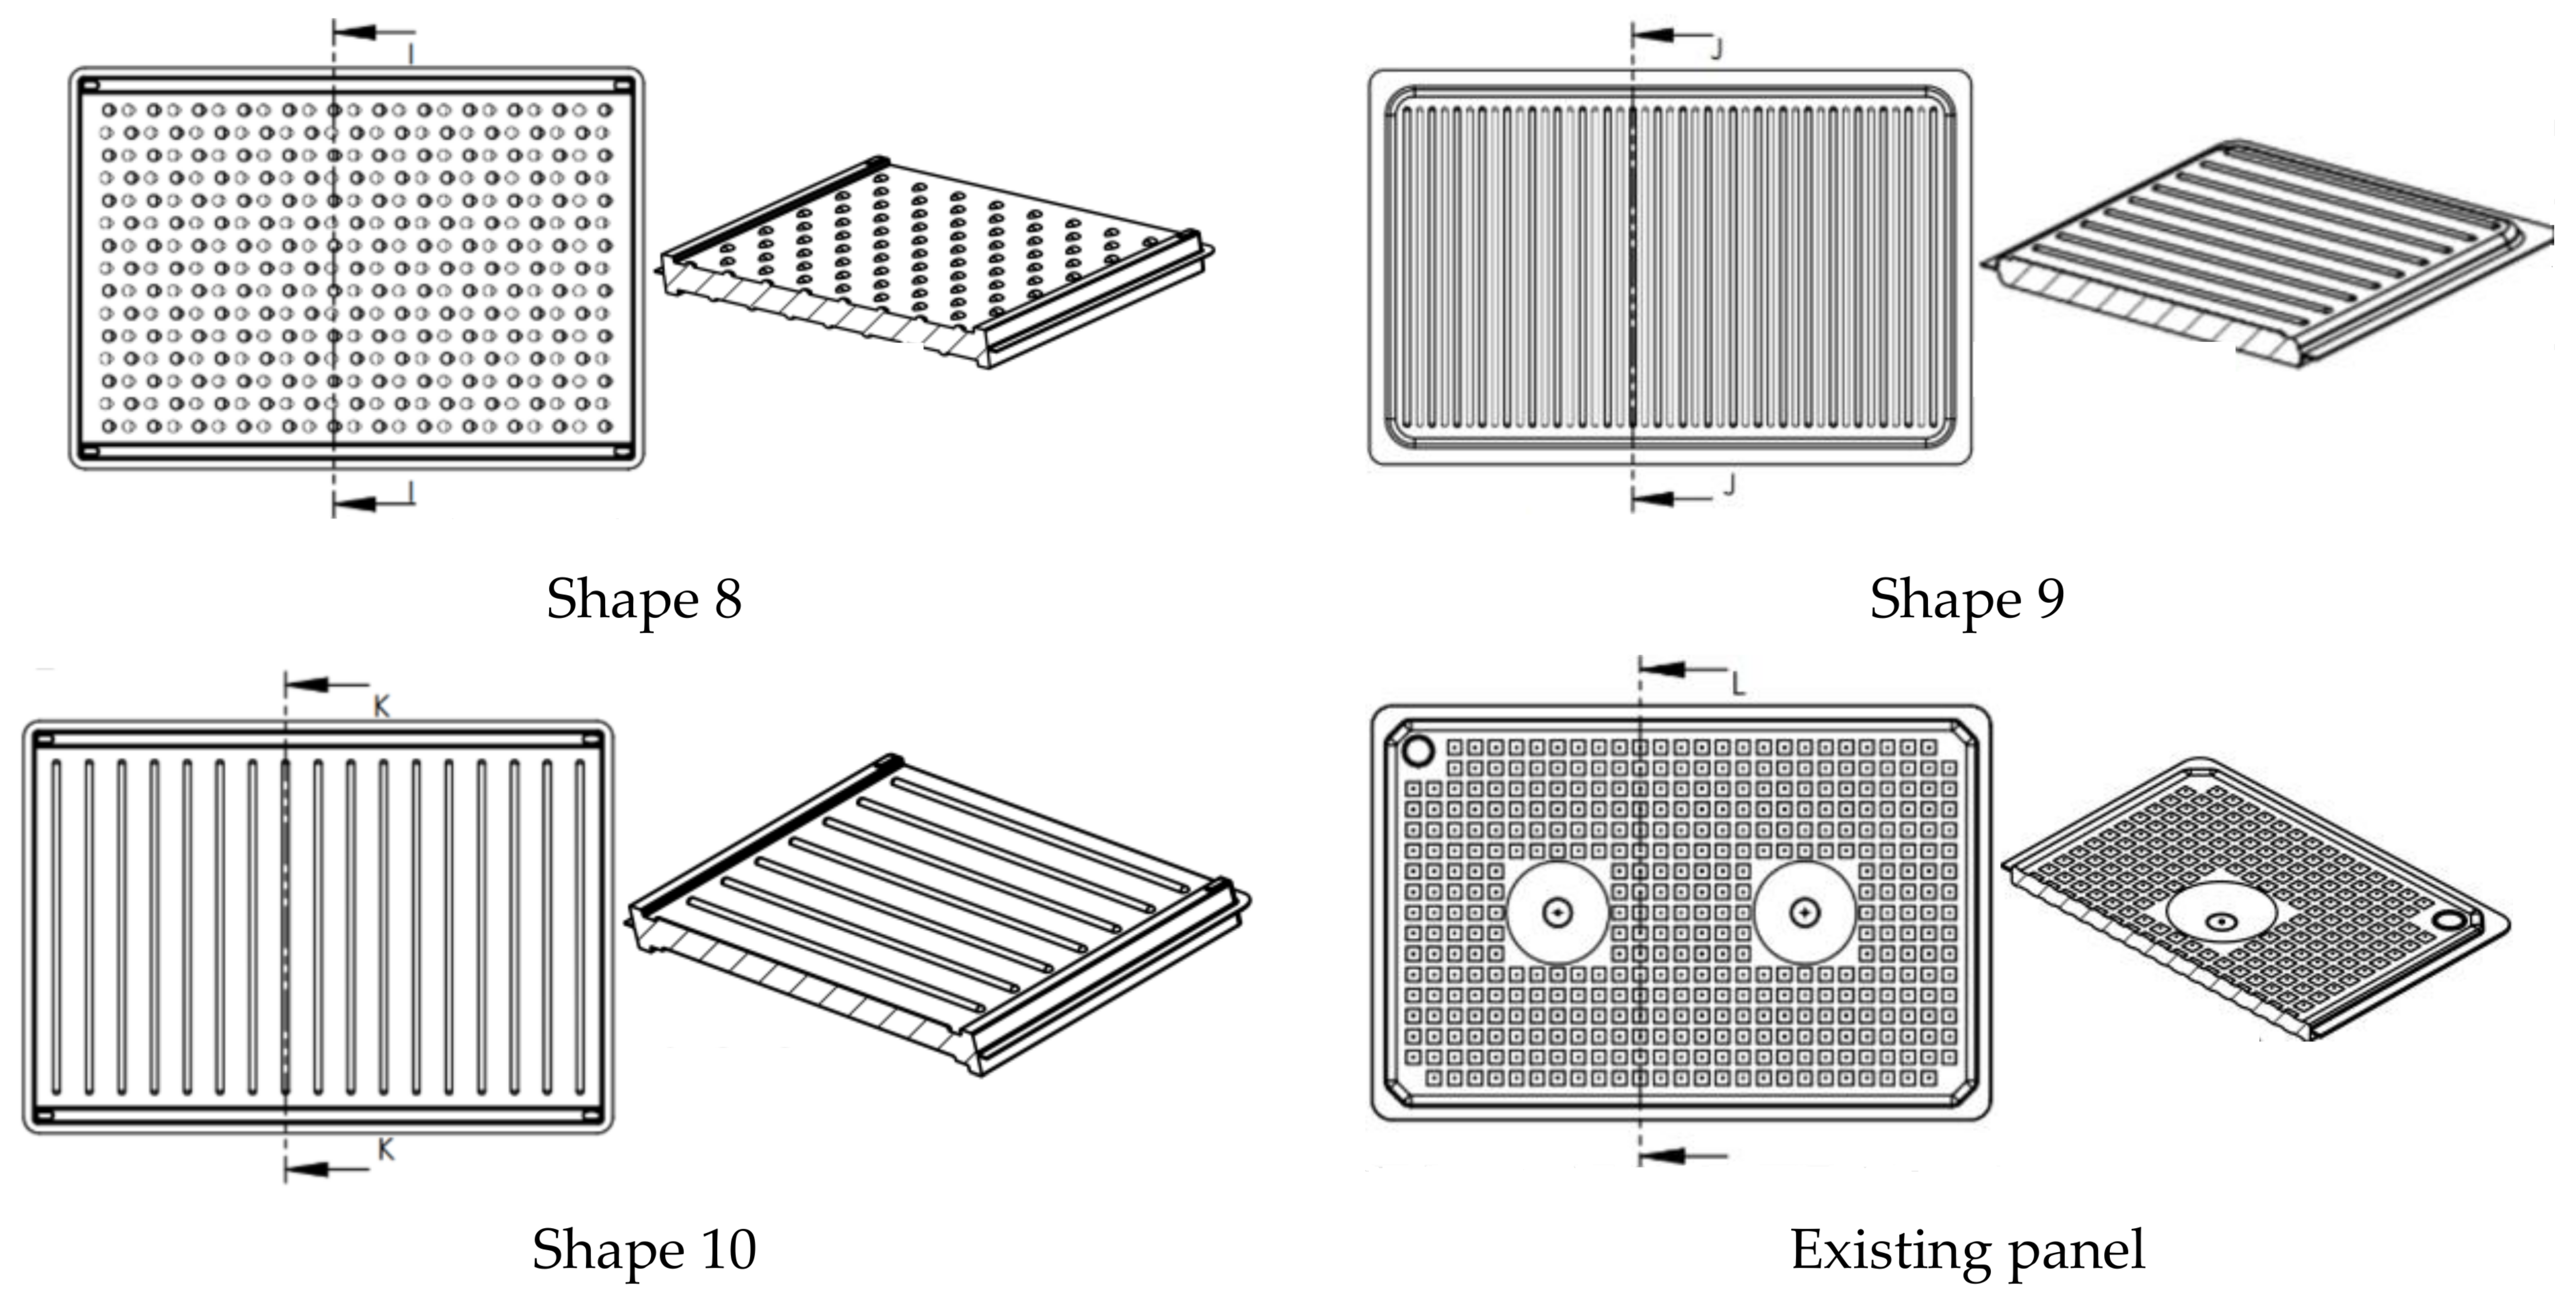
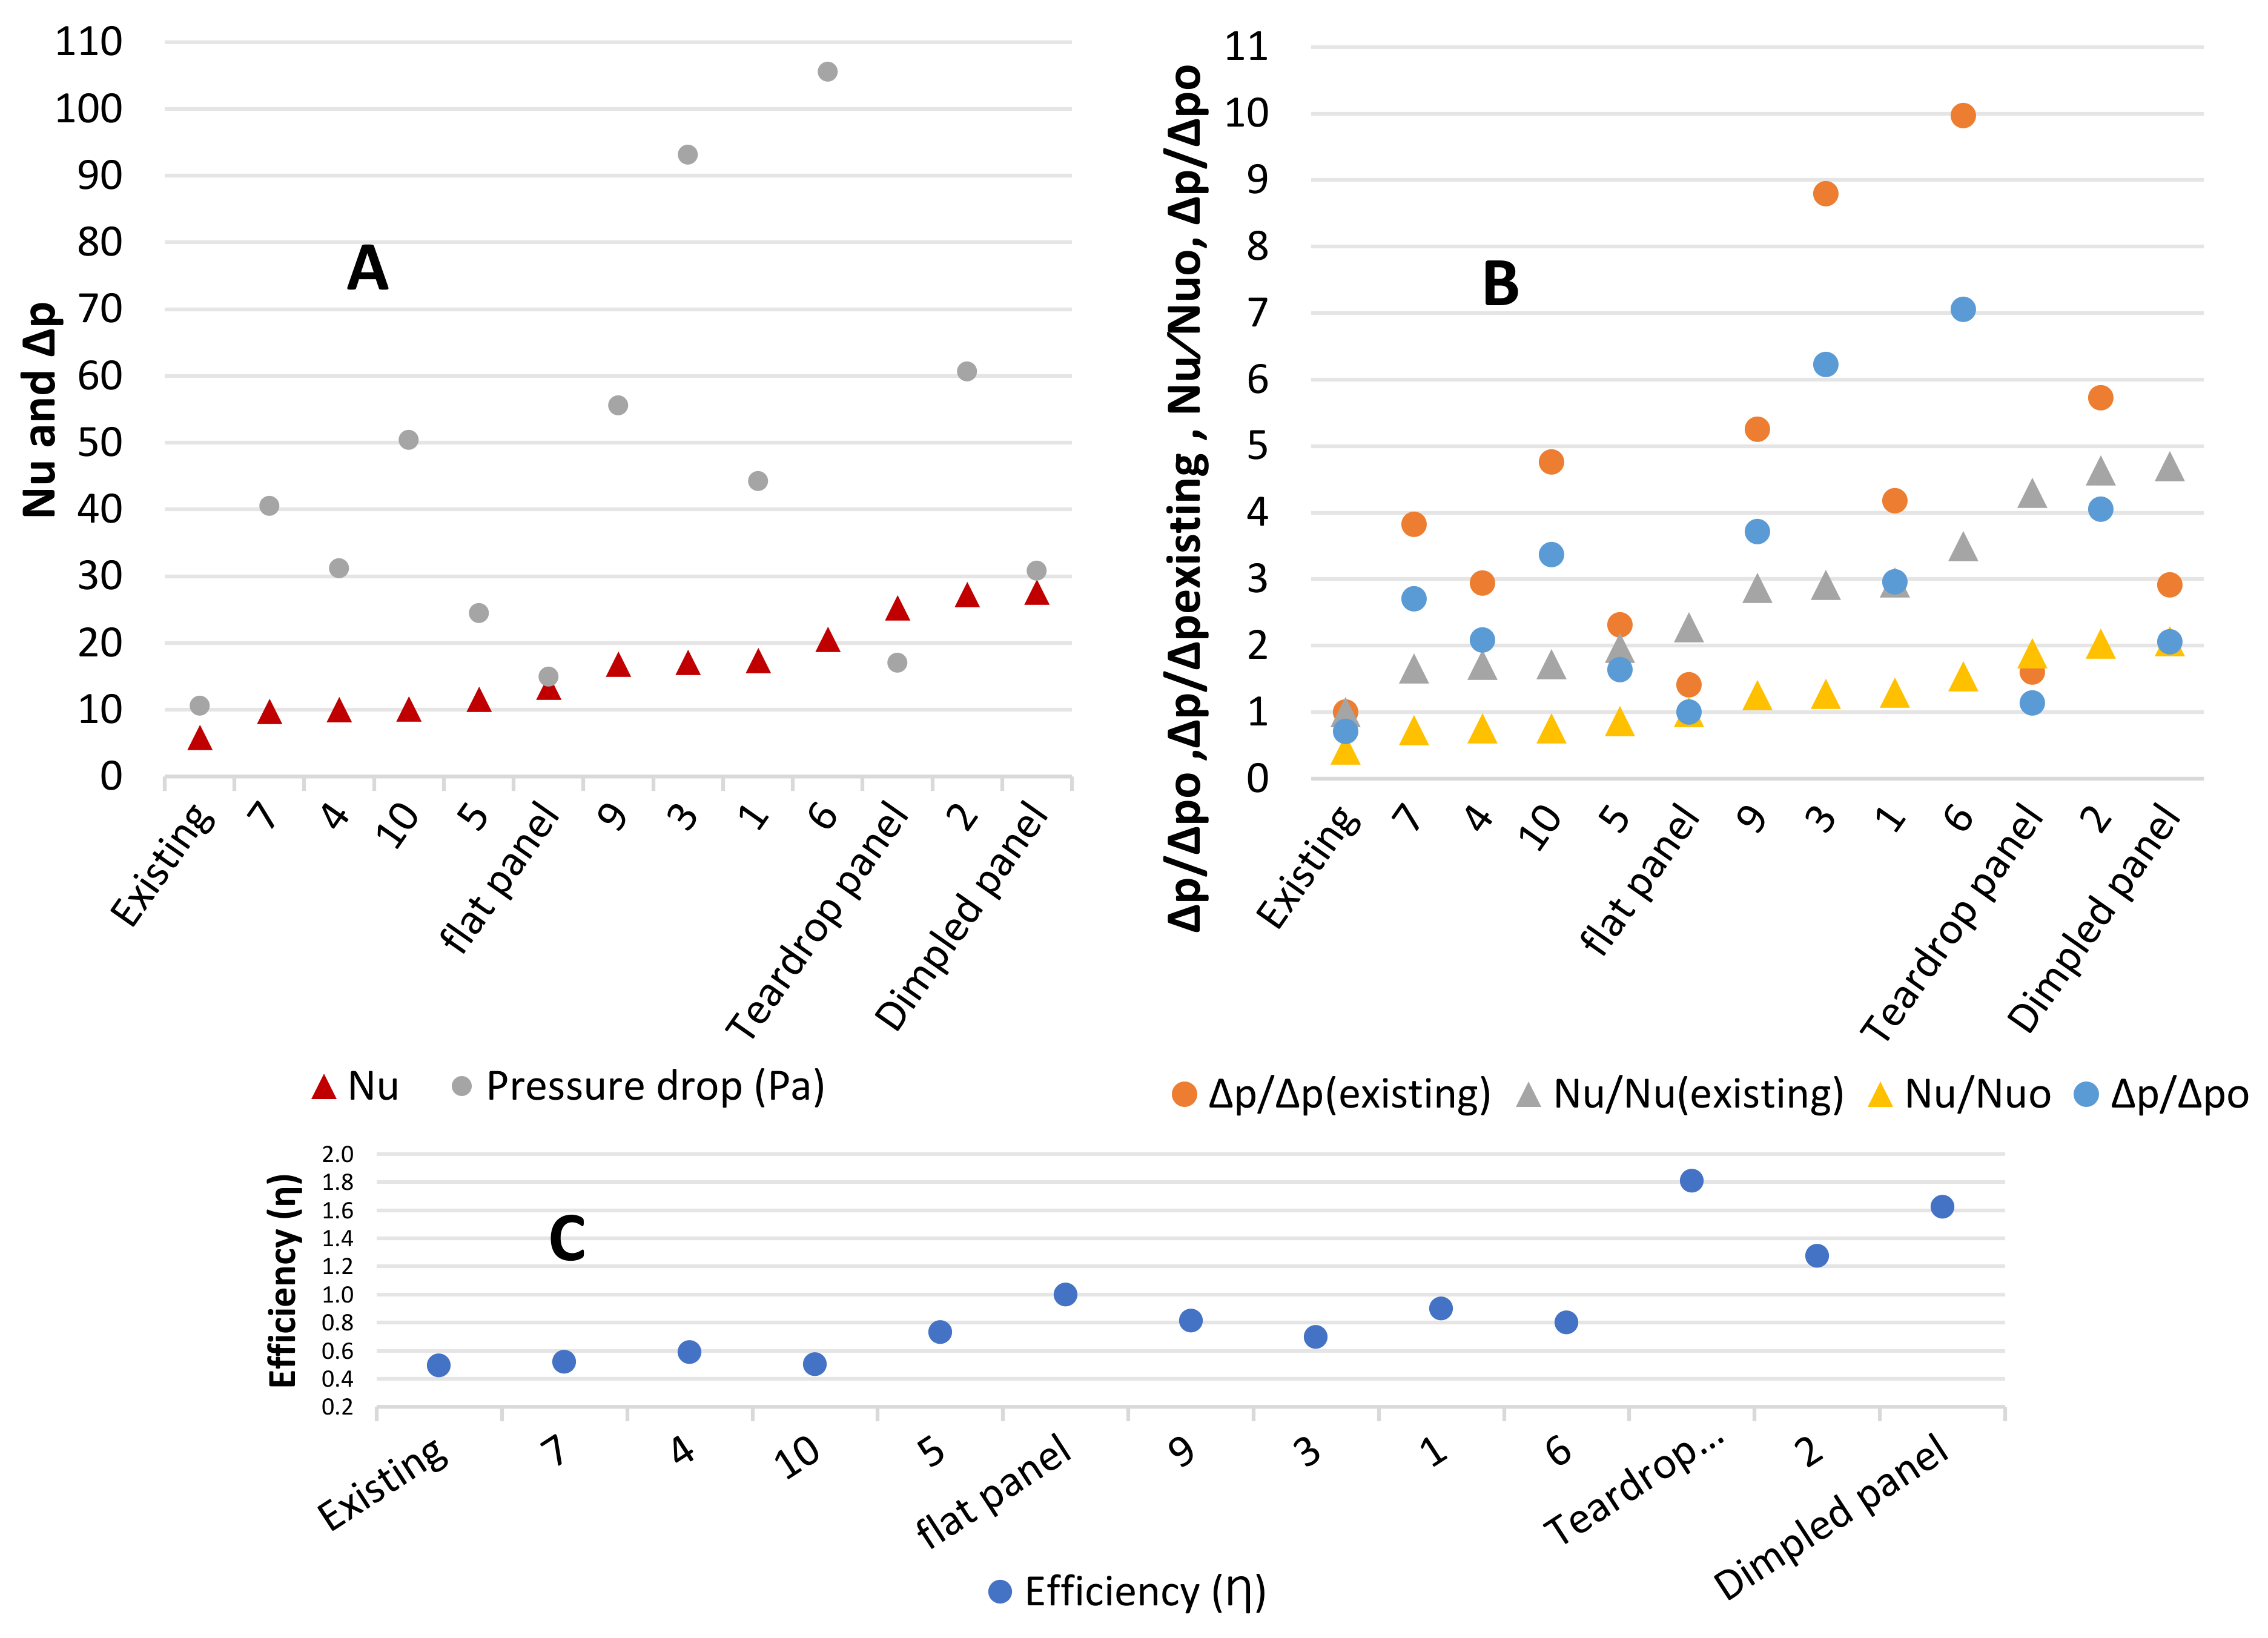
- Initially, a set of twelve 3D designs were simulated based on literature findings on the shape of ridges, their dimensions and separation; more details are included in Section 2.1.1. Correlations and a laboratory test were used to validate the simulation; this is presented in Section 2.1.2. One design was selected as the most promising which is uniform along its width.
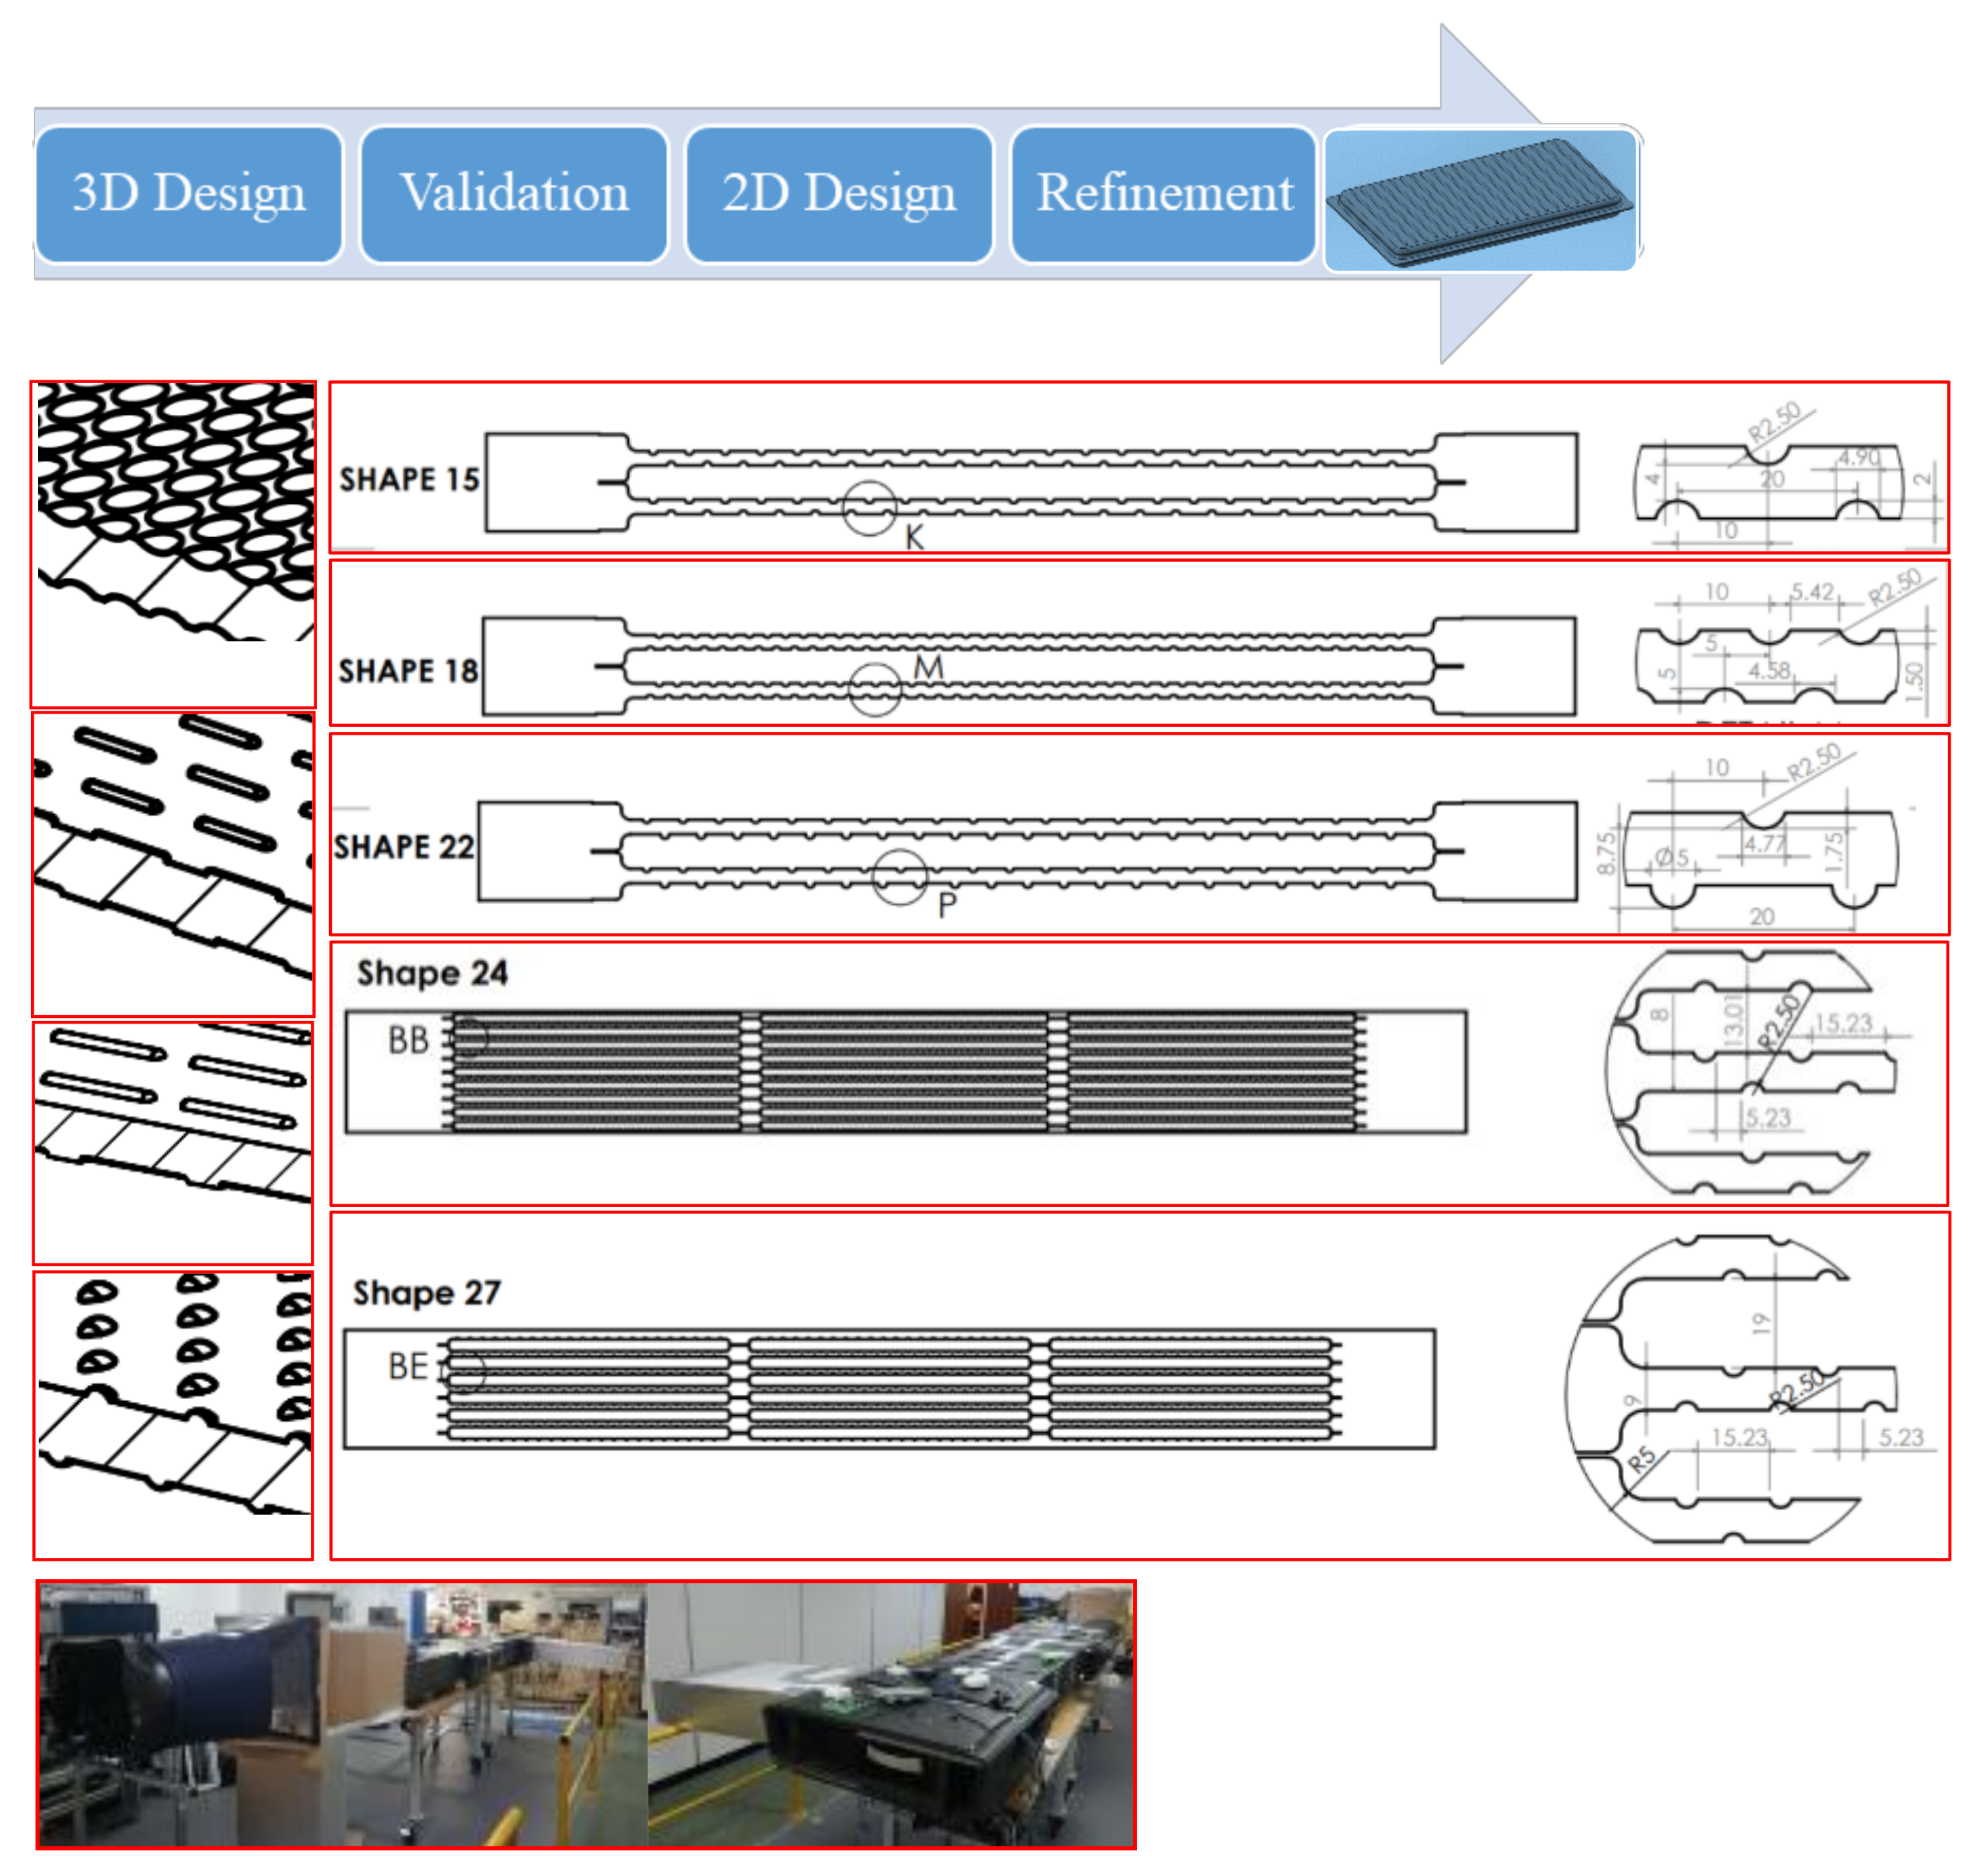
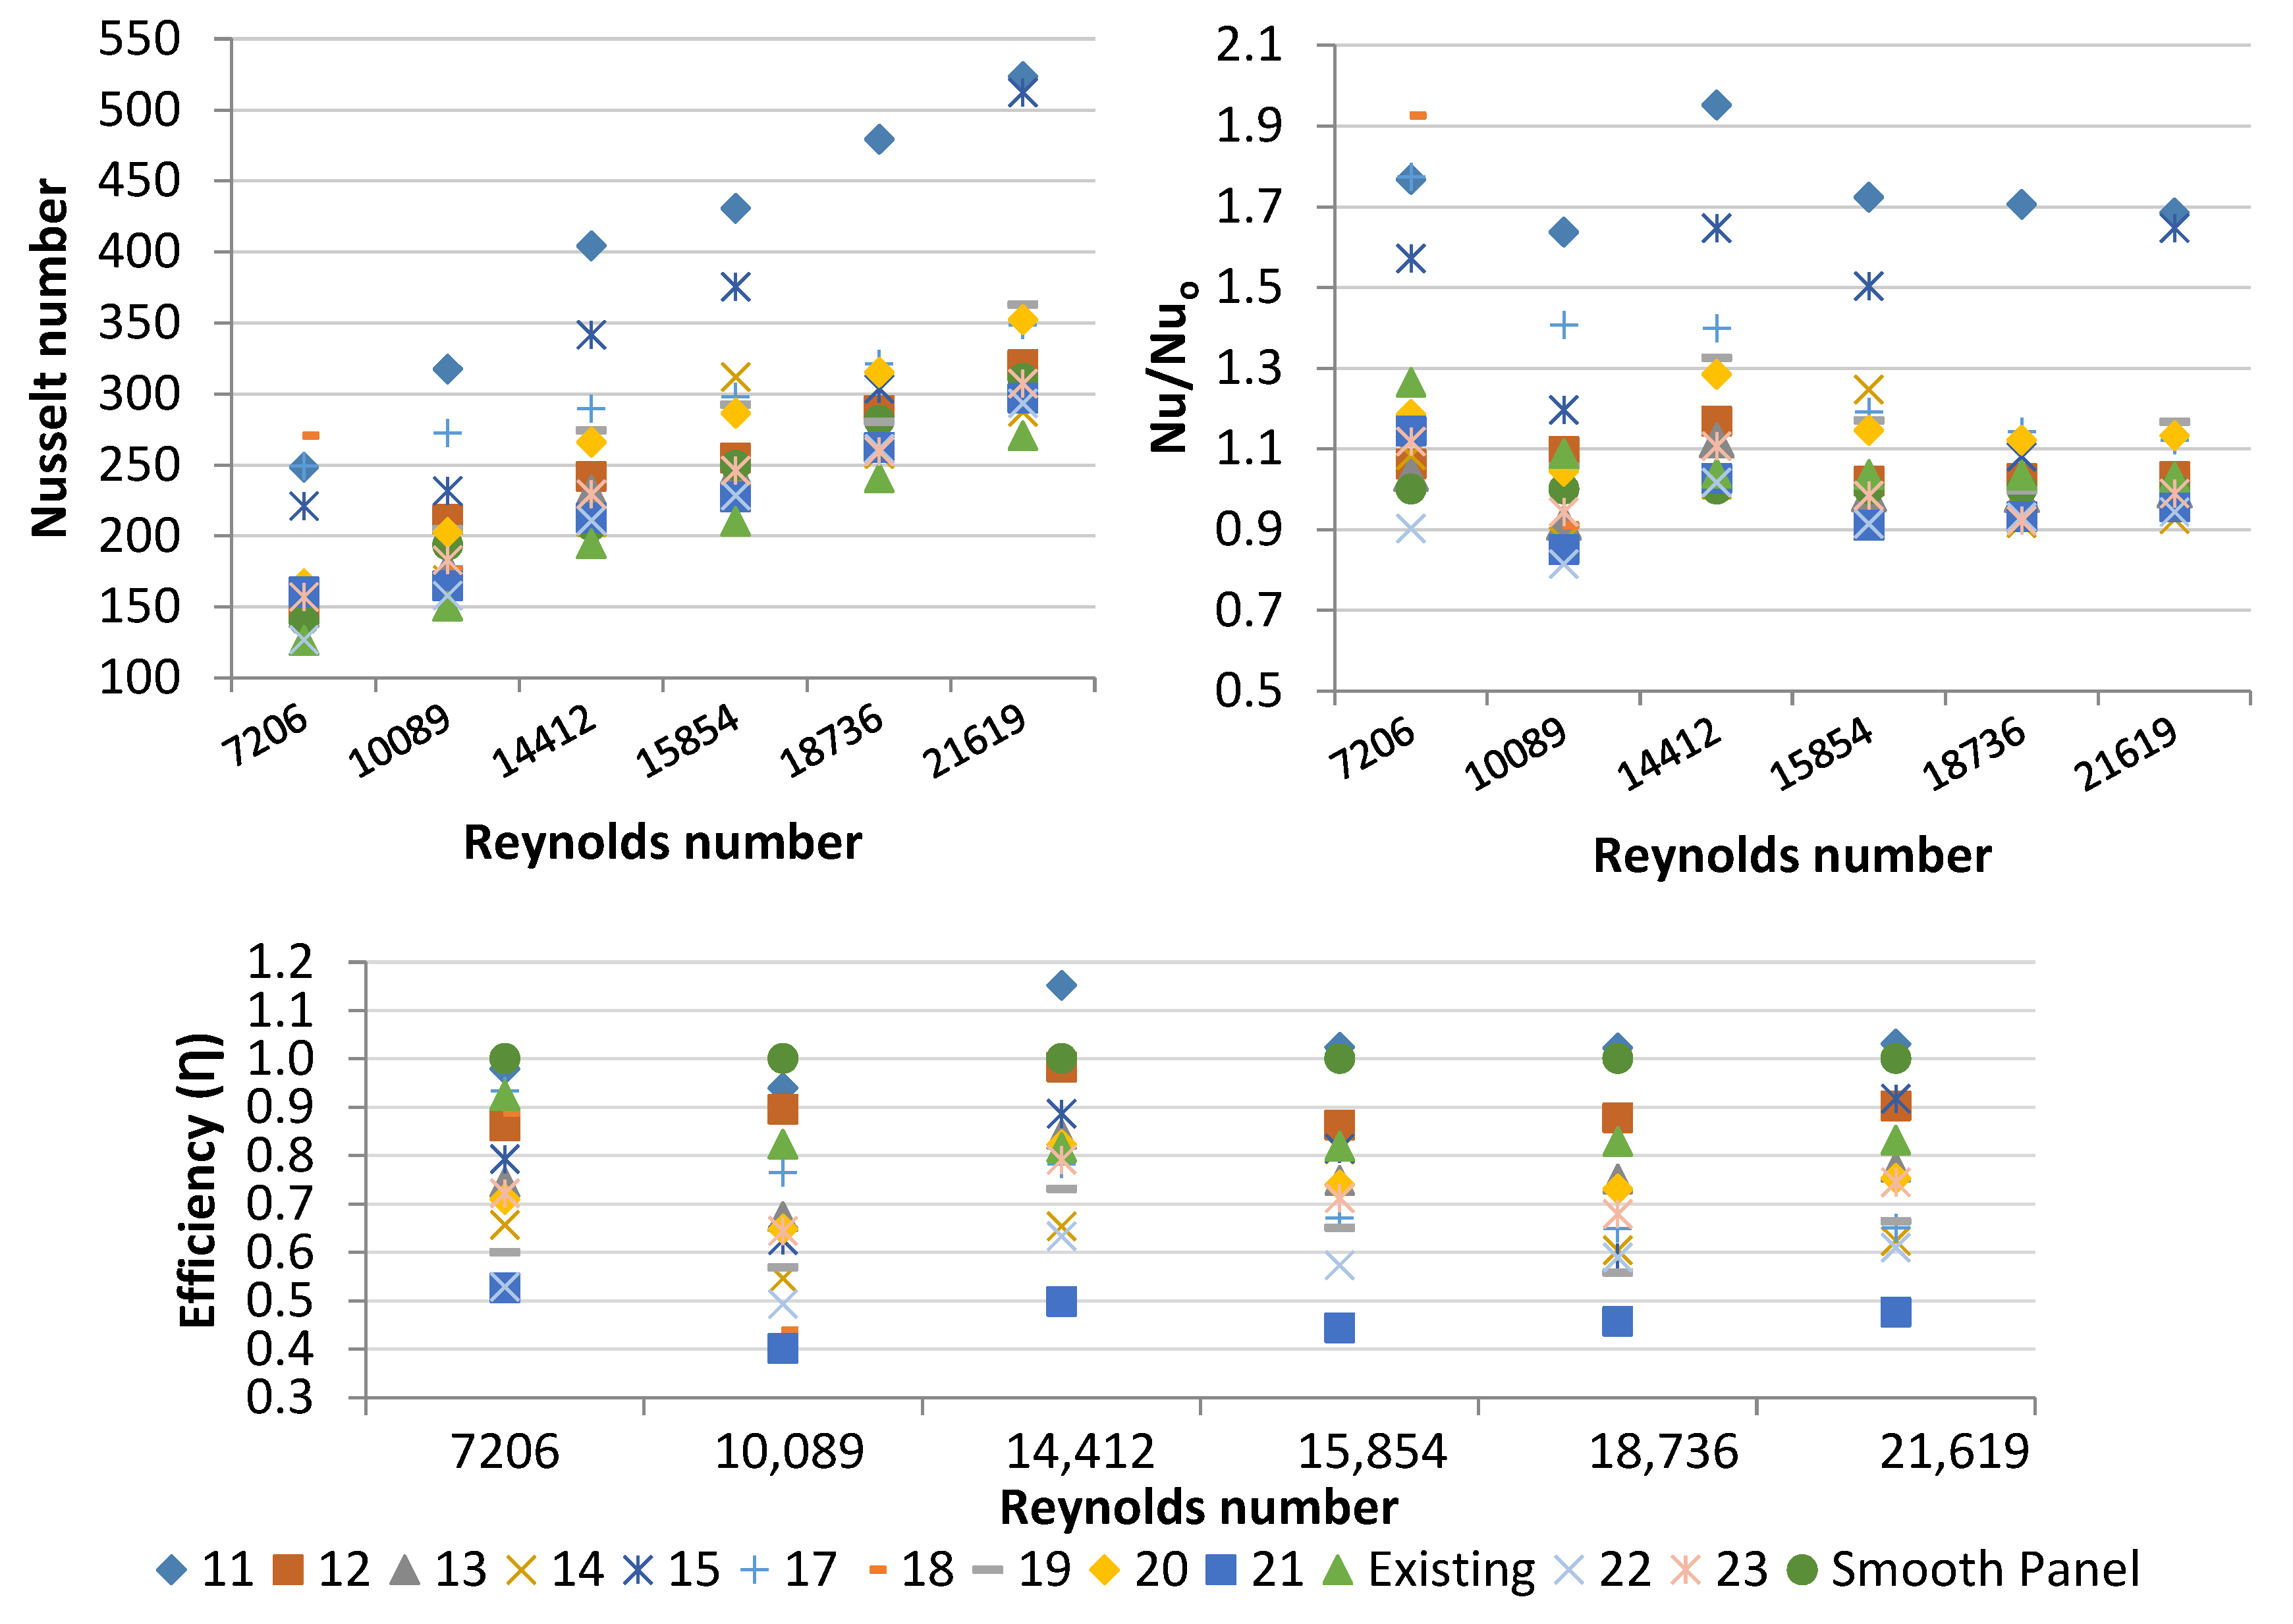
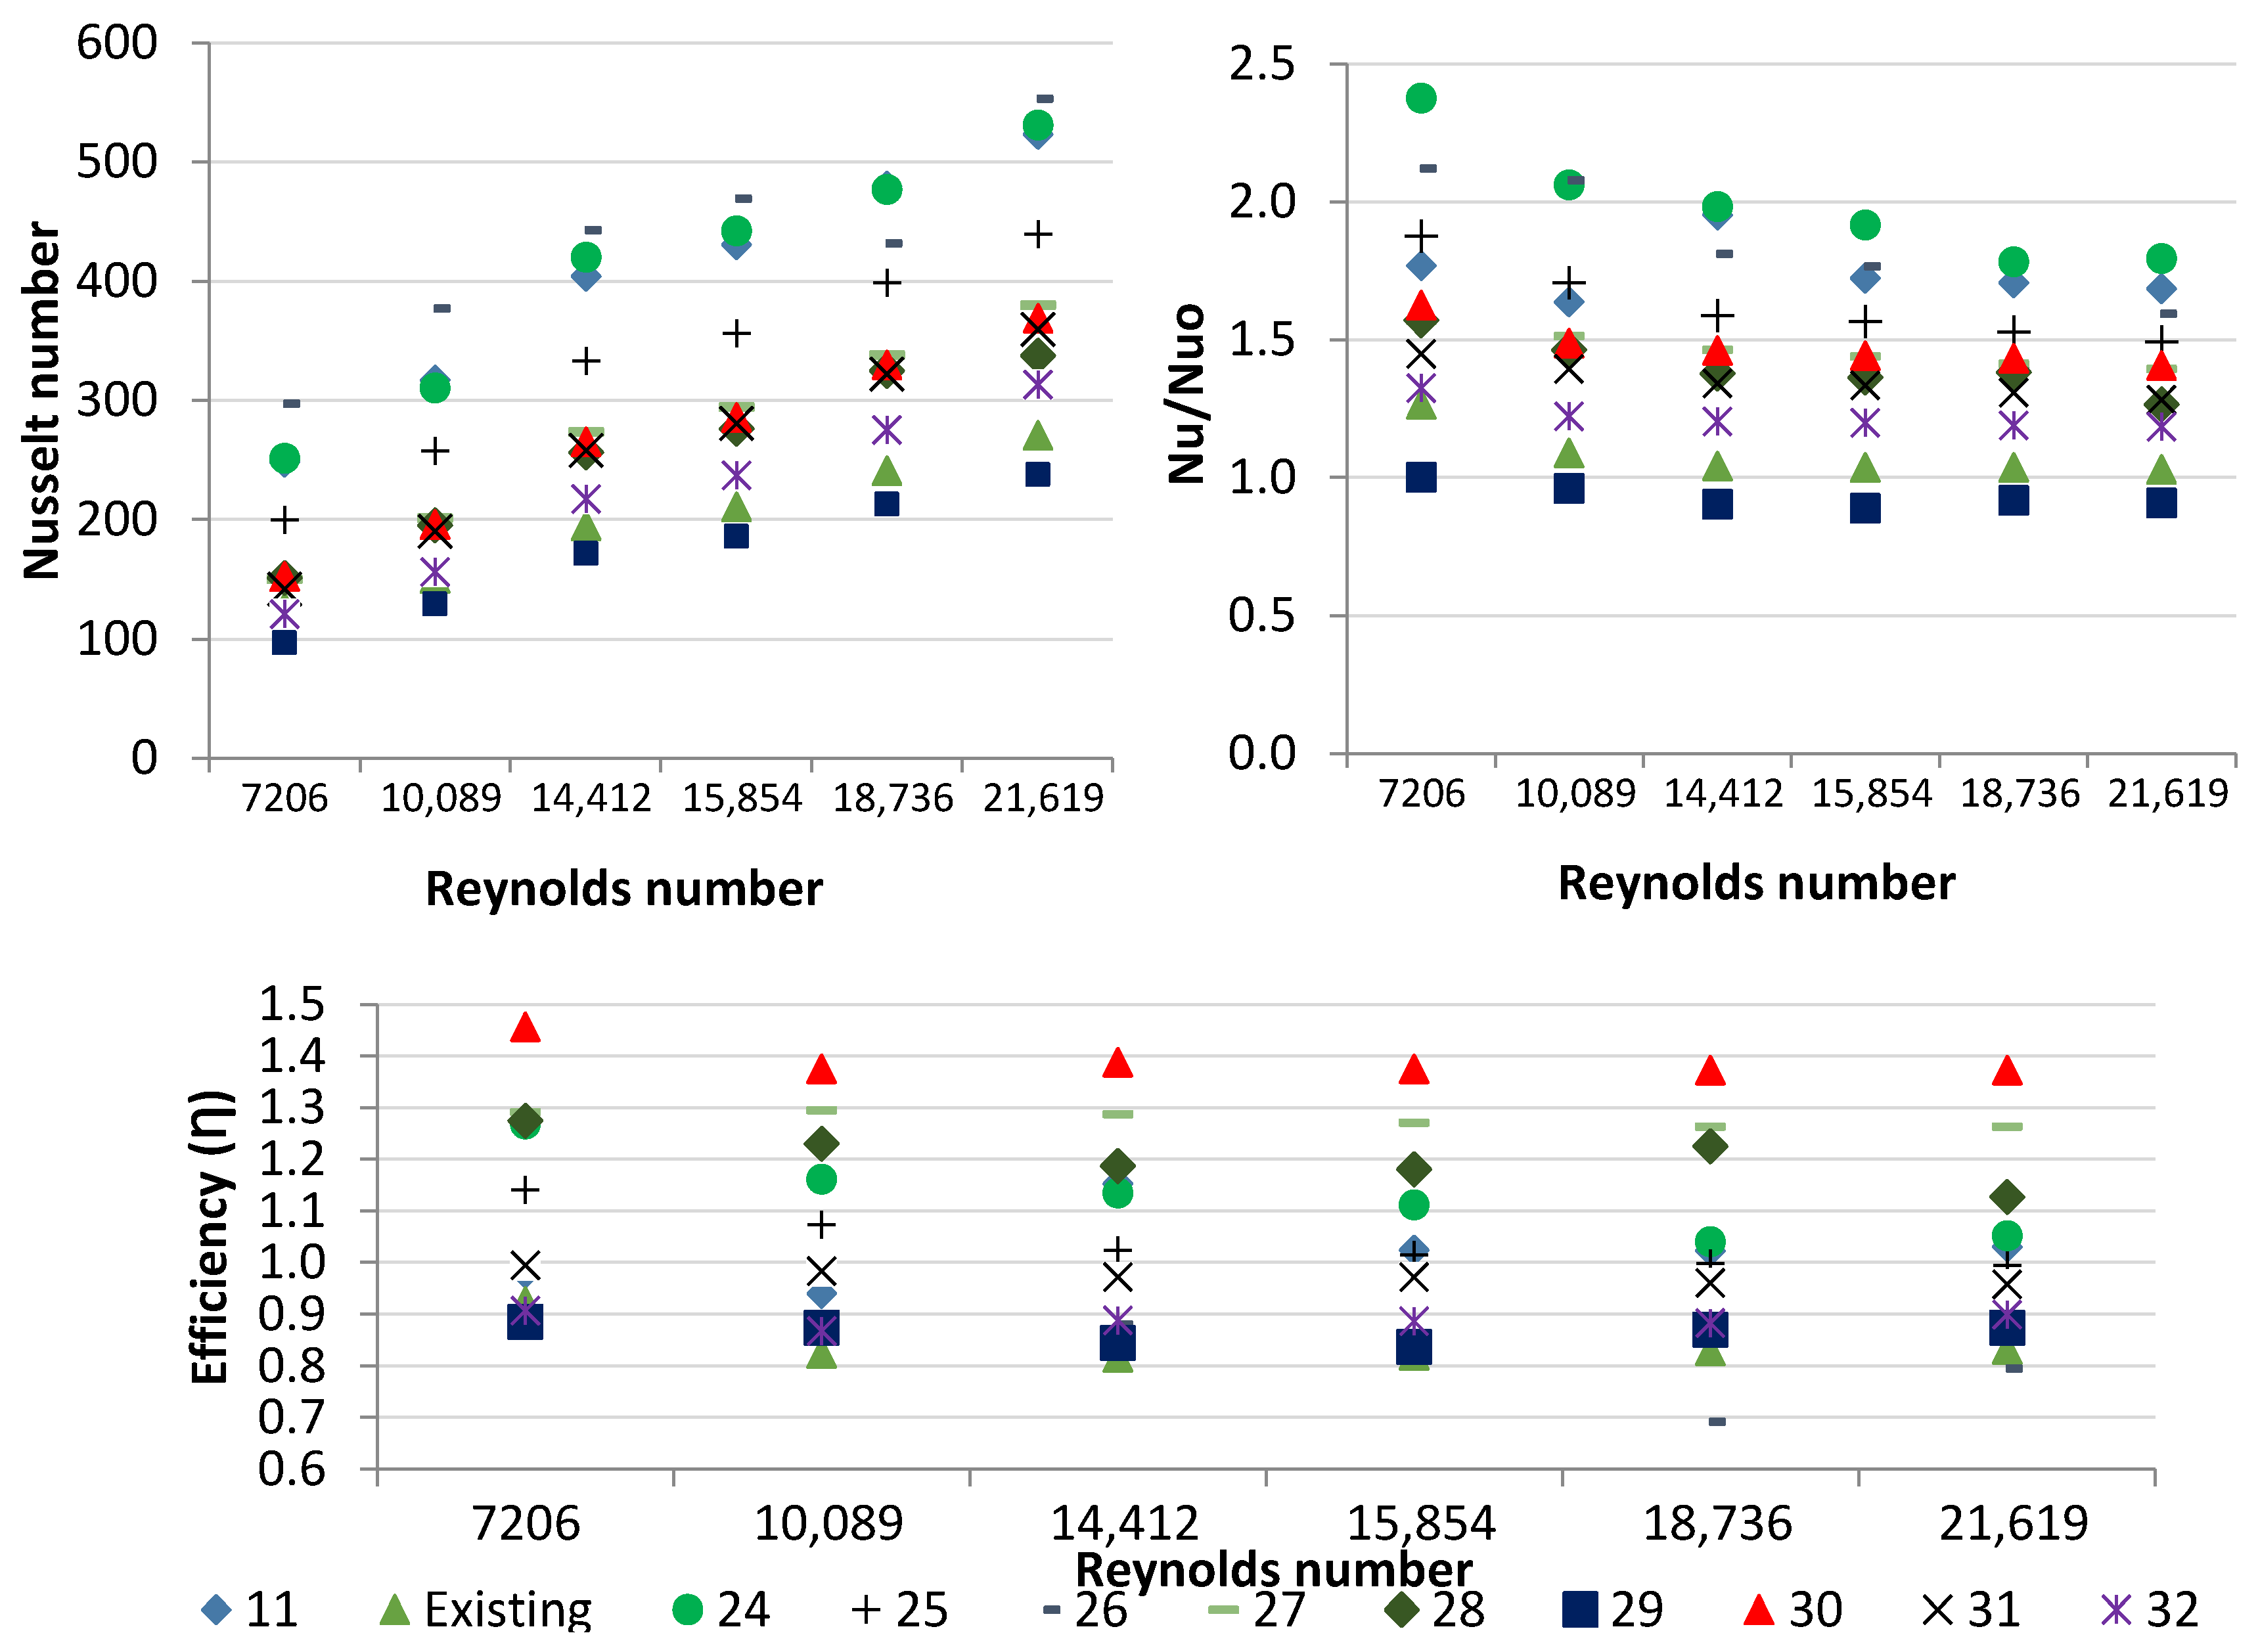
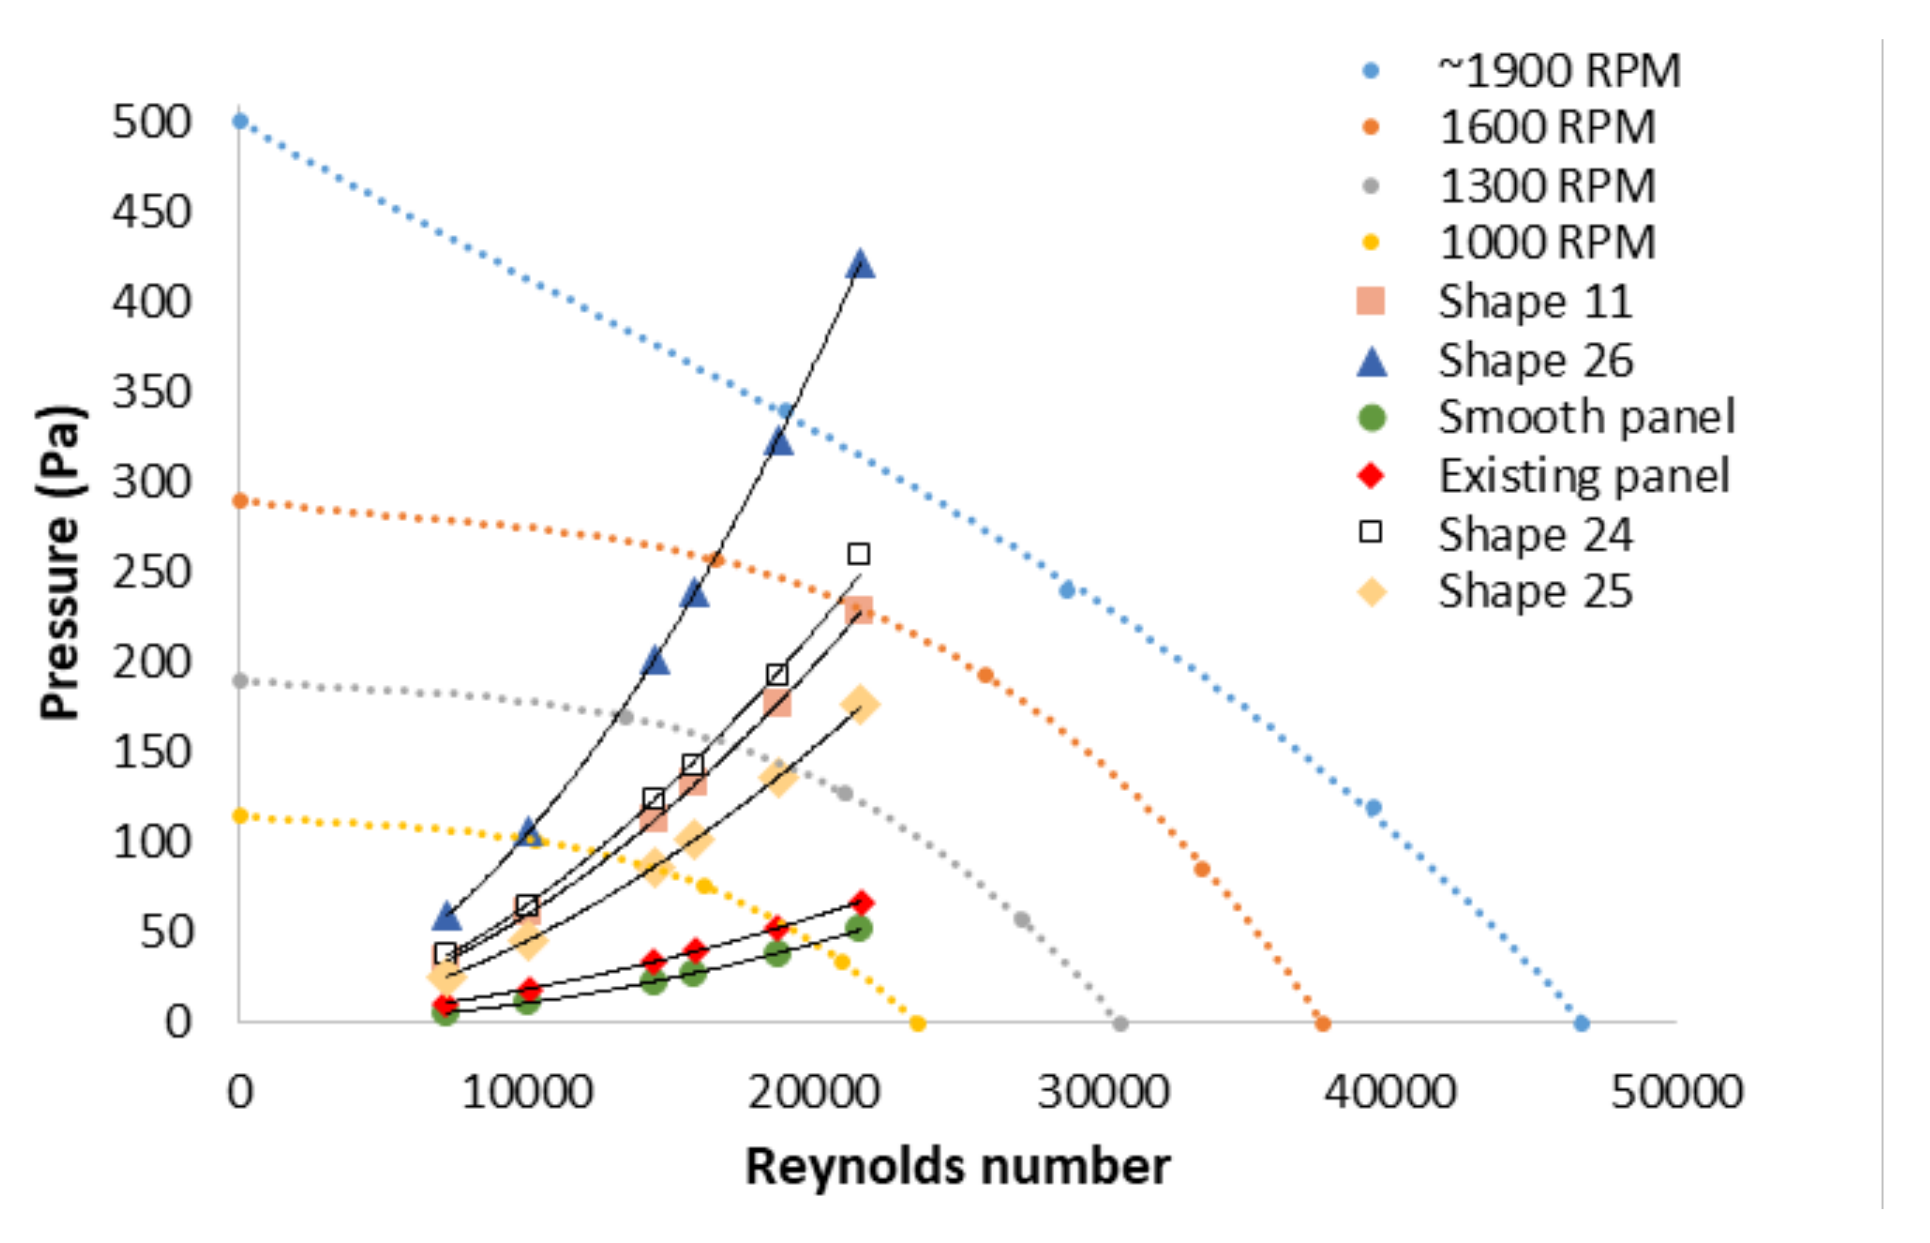
- 2D CFD simulations were carried out for 21 different geometries using a two-step approach. First, one panel was simulated in order to find the optimum panel dimensions (based on the five KPIs). Secondly, a refinement was carried out to select the optimum spacing between panels and the thickness of the panel. This is described in Section 2.1.3.
- Finally, the most promising panel was fabricated and further tested in the laboratory.
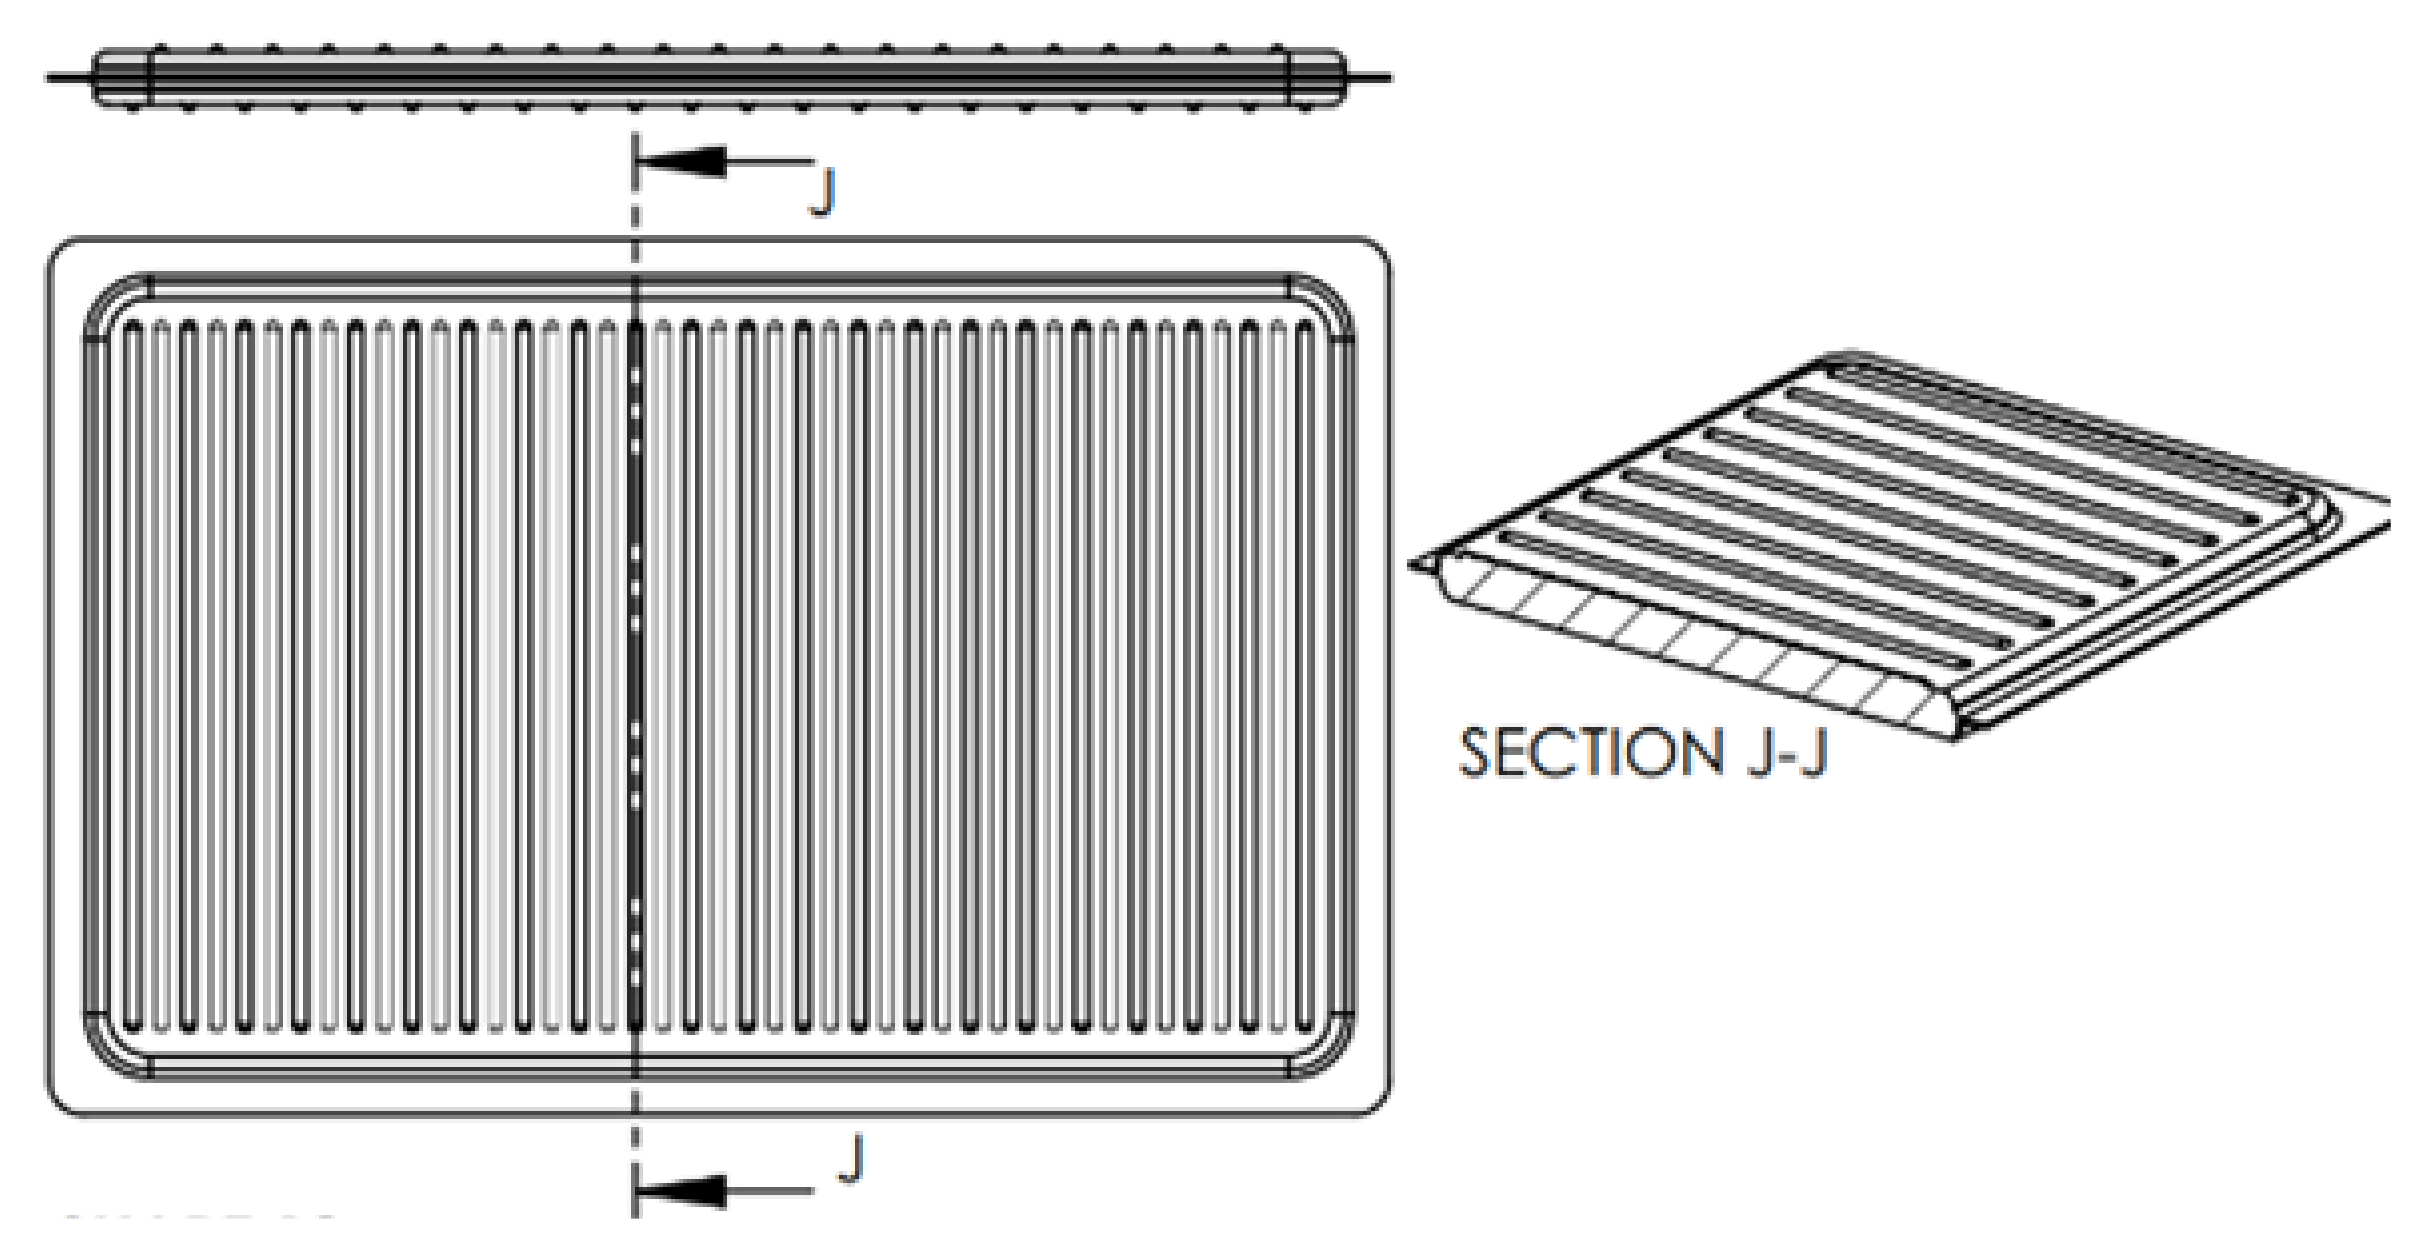
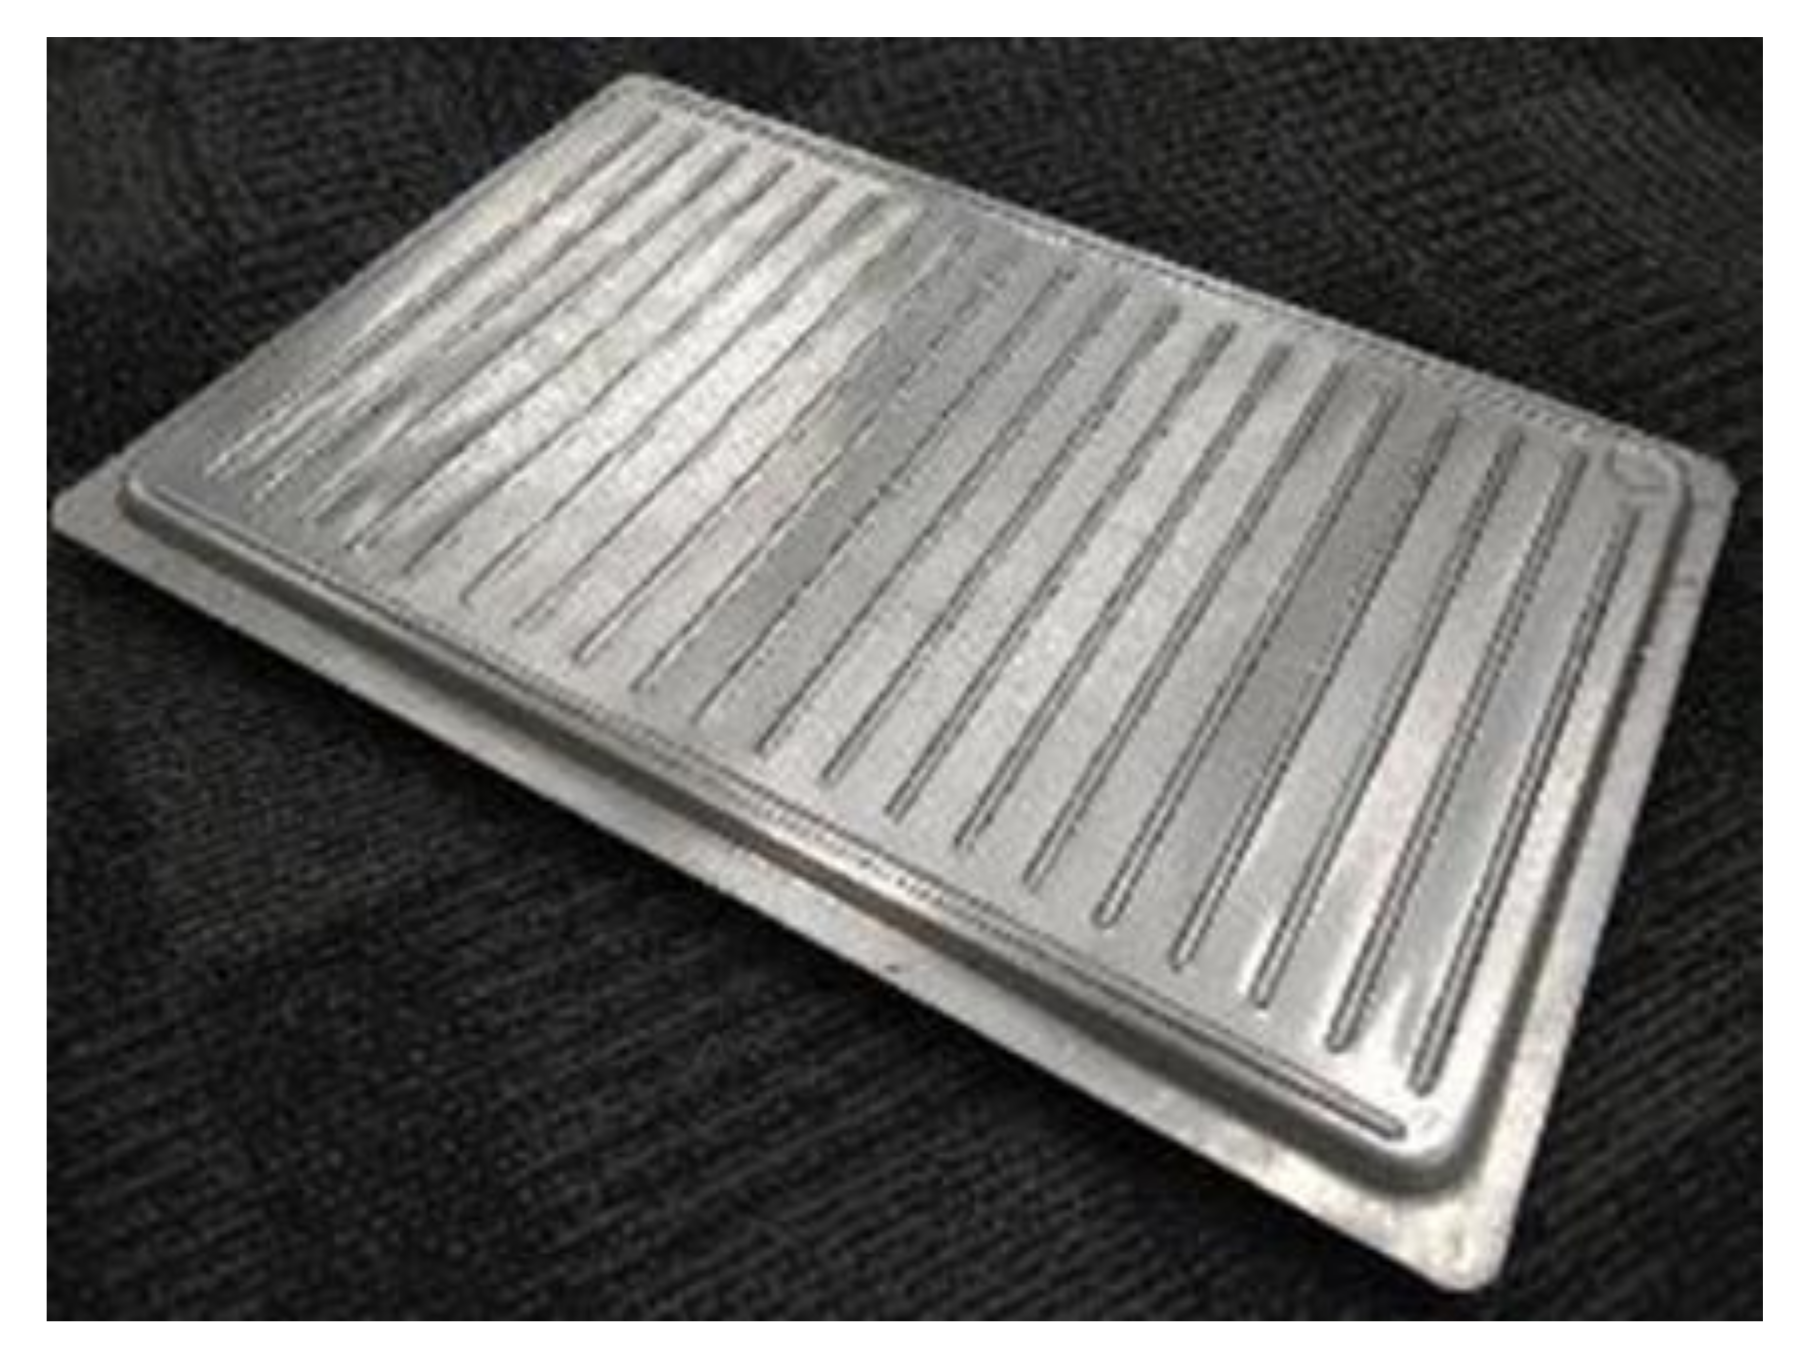
- Figure 2 presents some details of the panels. The dimensions presented on the right side show the radius, distance between ridges, panel thickness and height of the ridges used for the 2D simulations. These dimensions are represented as ratios with panel length, panel width, duct height and air gap with more design details shown in Table 1 and Table 2. Figure 3 presents the control volume, the boundary conditions and the dimensions used.
2.1.1. 3D Simulations
2.1.2. Numerical Validation
2.1.3. 2D Simulations
2.2. Data Reduction
2.2.1. Numerical Design
2.2.2. Laboratory Test
2.3. Laboratory Testing
- Laboratory test 1: Investigation of heat transfer and pressure drop of one panel with different gaps between panels.
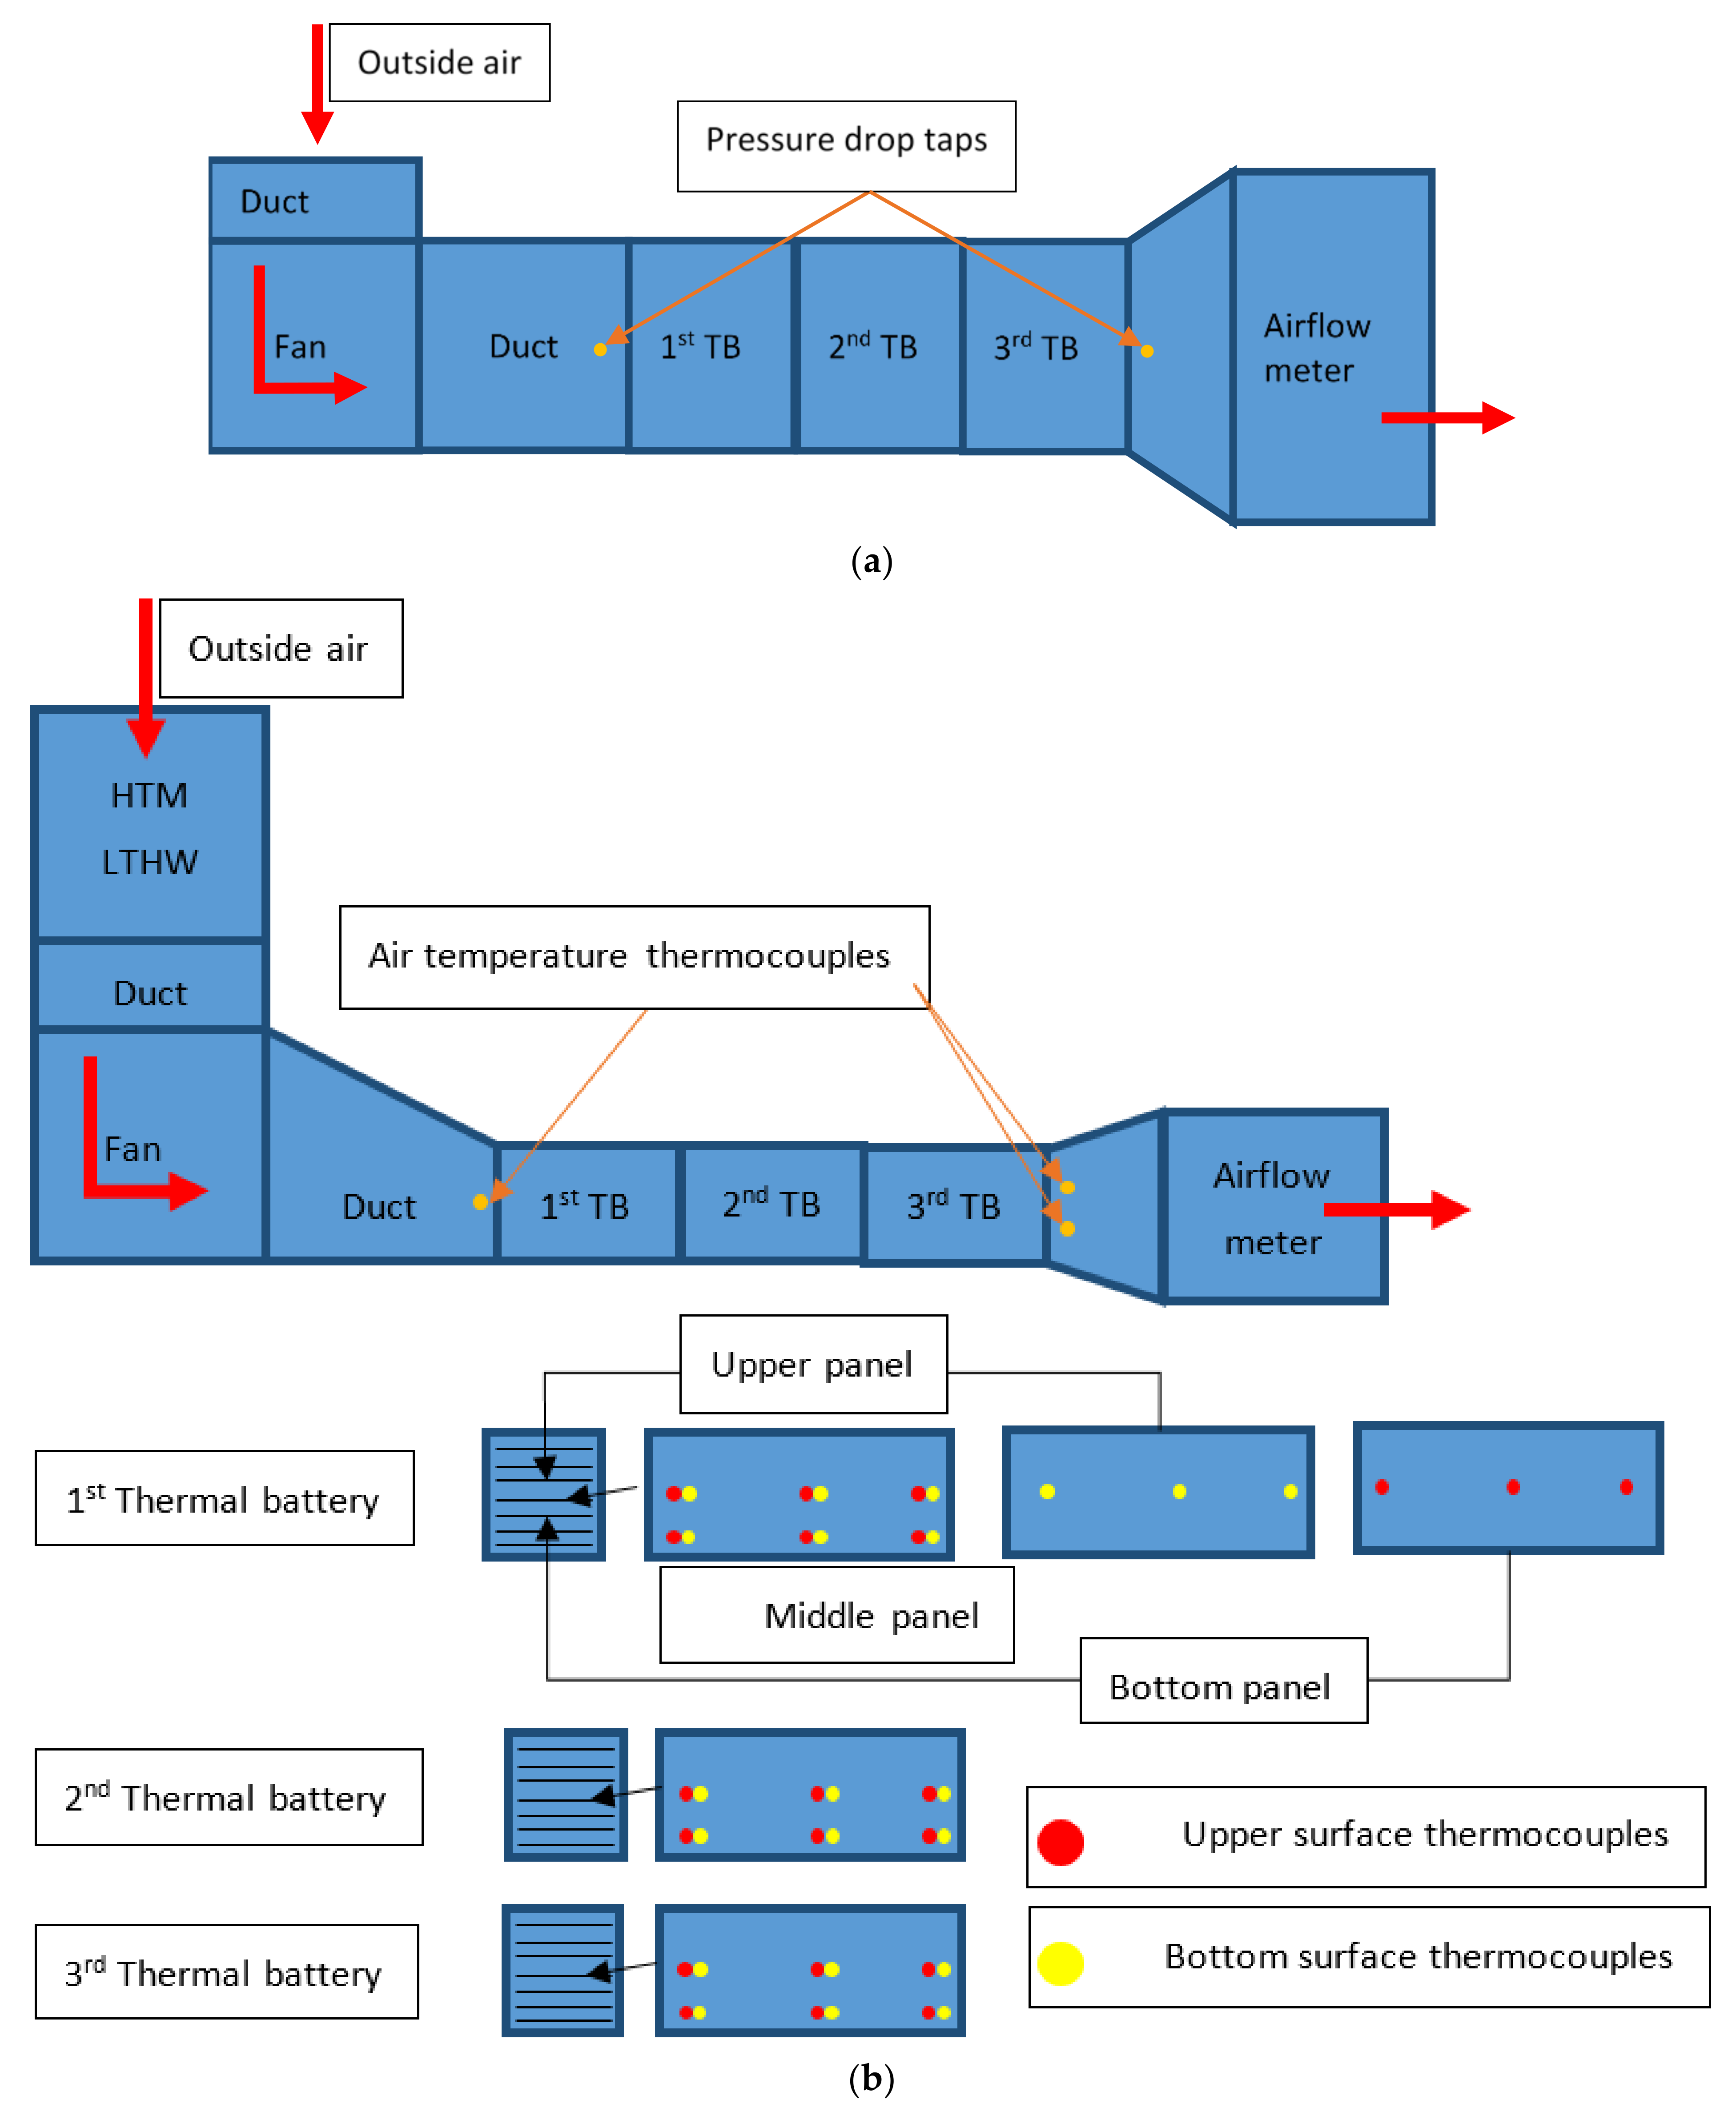
- A test rig consisting in a variable fan, rectangular ducts and a test section was mounted to evaluate the heat transfer of new and the existing panel, (Figure 2);
- Each half of panel was filled with a potting compound and a resistance wire;
- A power supply of 13.5 W heated each panel and 14 thermocouples measured the surface temperature of the panels every 10 s;
- One thermocouple before and 3 after the test section measured the increase in air temperature every 10 s;
- Three different airspeeds were tested (0.5, 1.0 and 1.5 m/s or Re ≅ 2000, 4100 and 6061, respectively) at three different gaps (8, 9 and 10 mm gap). Each test finished after the steady state was achieved for at least 30 min;
- With panel surface and air temperature data acquired, the heat of convection was calculated through energy balance and the Nusselt number was estimated.
- To validate the results acquired on the rig, a smooth panel with the same gaps and airspeed was simulated with ANSYS Fluent. The Nusselt number estimated in the test was validated by Gnielinski’s correlation (Equation (10);
- Results of pressure drop and heat transfer from the smooth panel were used to estimate the Thermal Enhancement Factor (TEF);
- The optimum configuration considering heat transfer and efficiency was used in the second experiment.
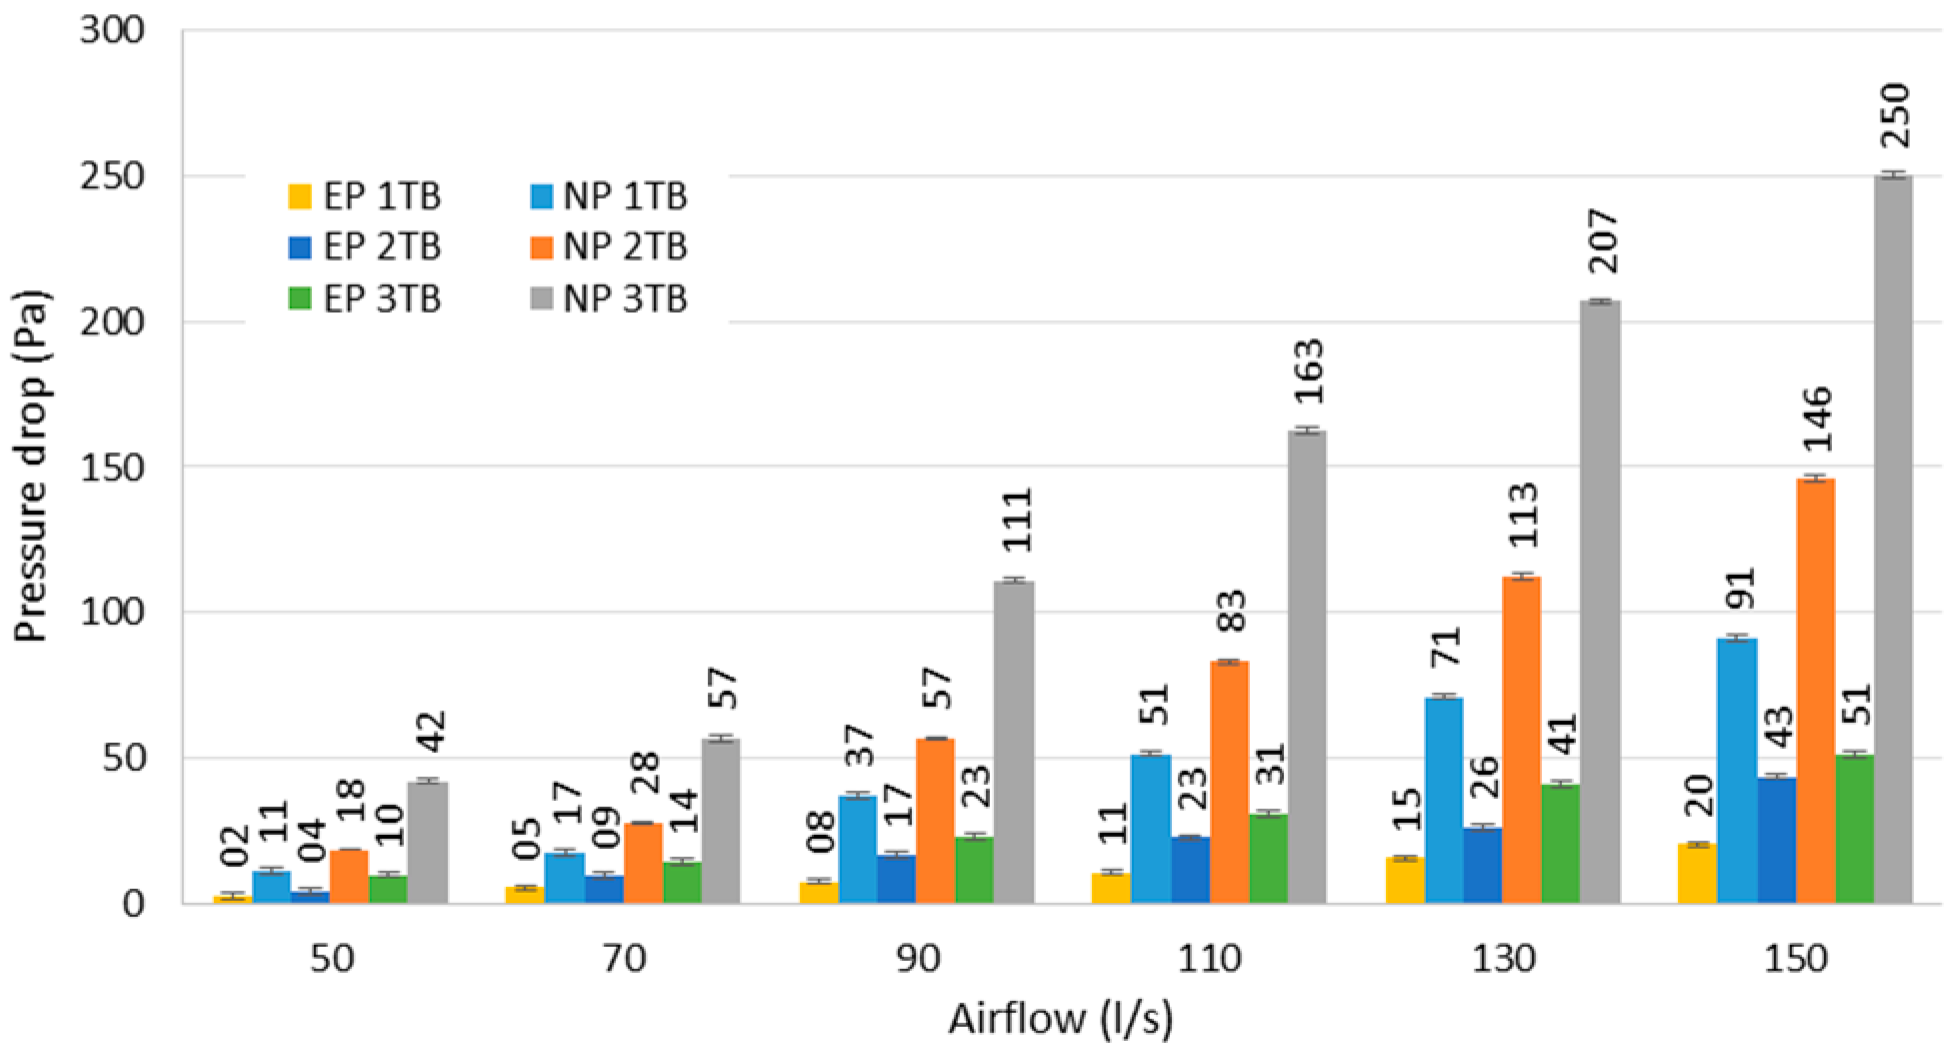
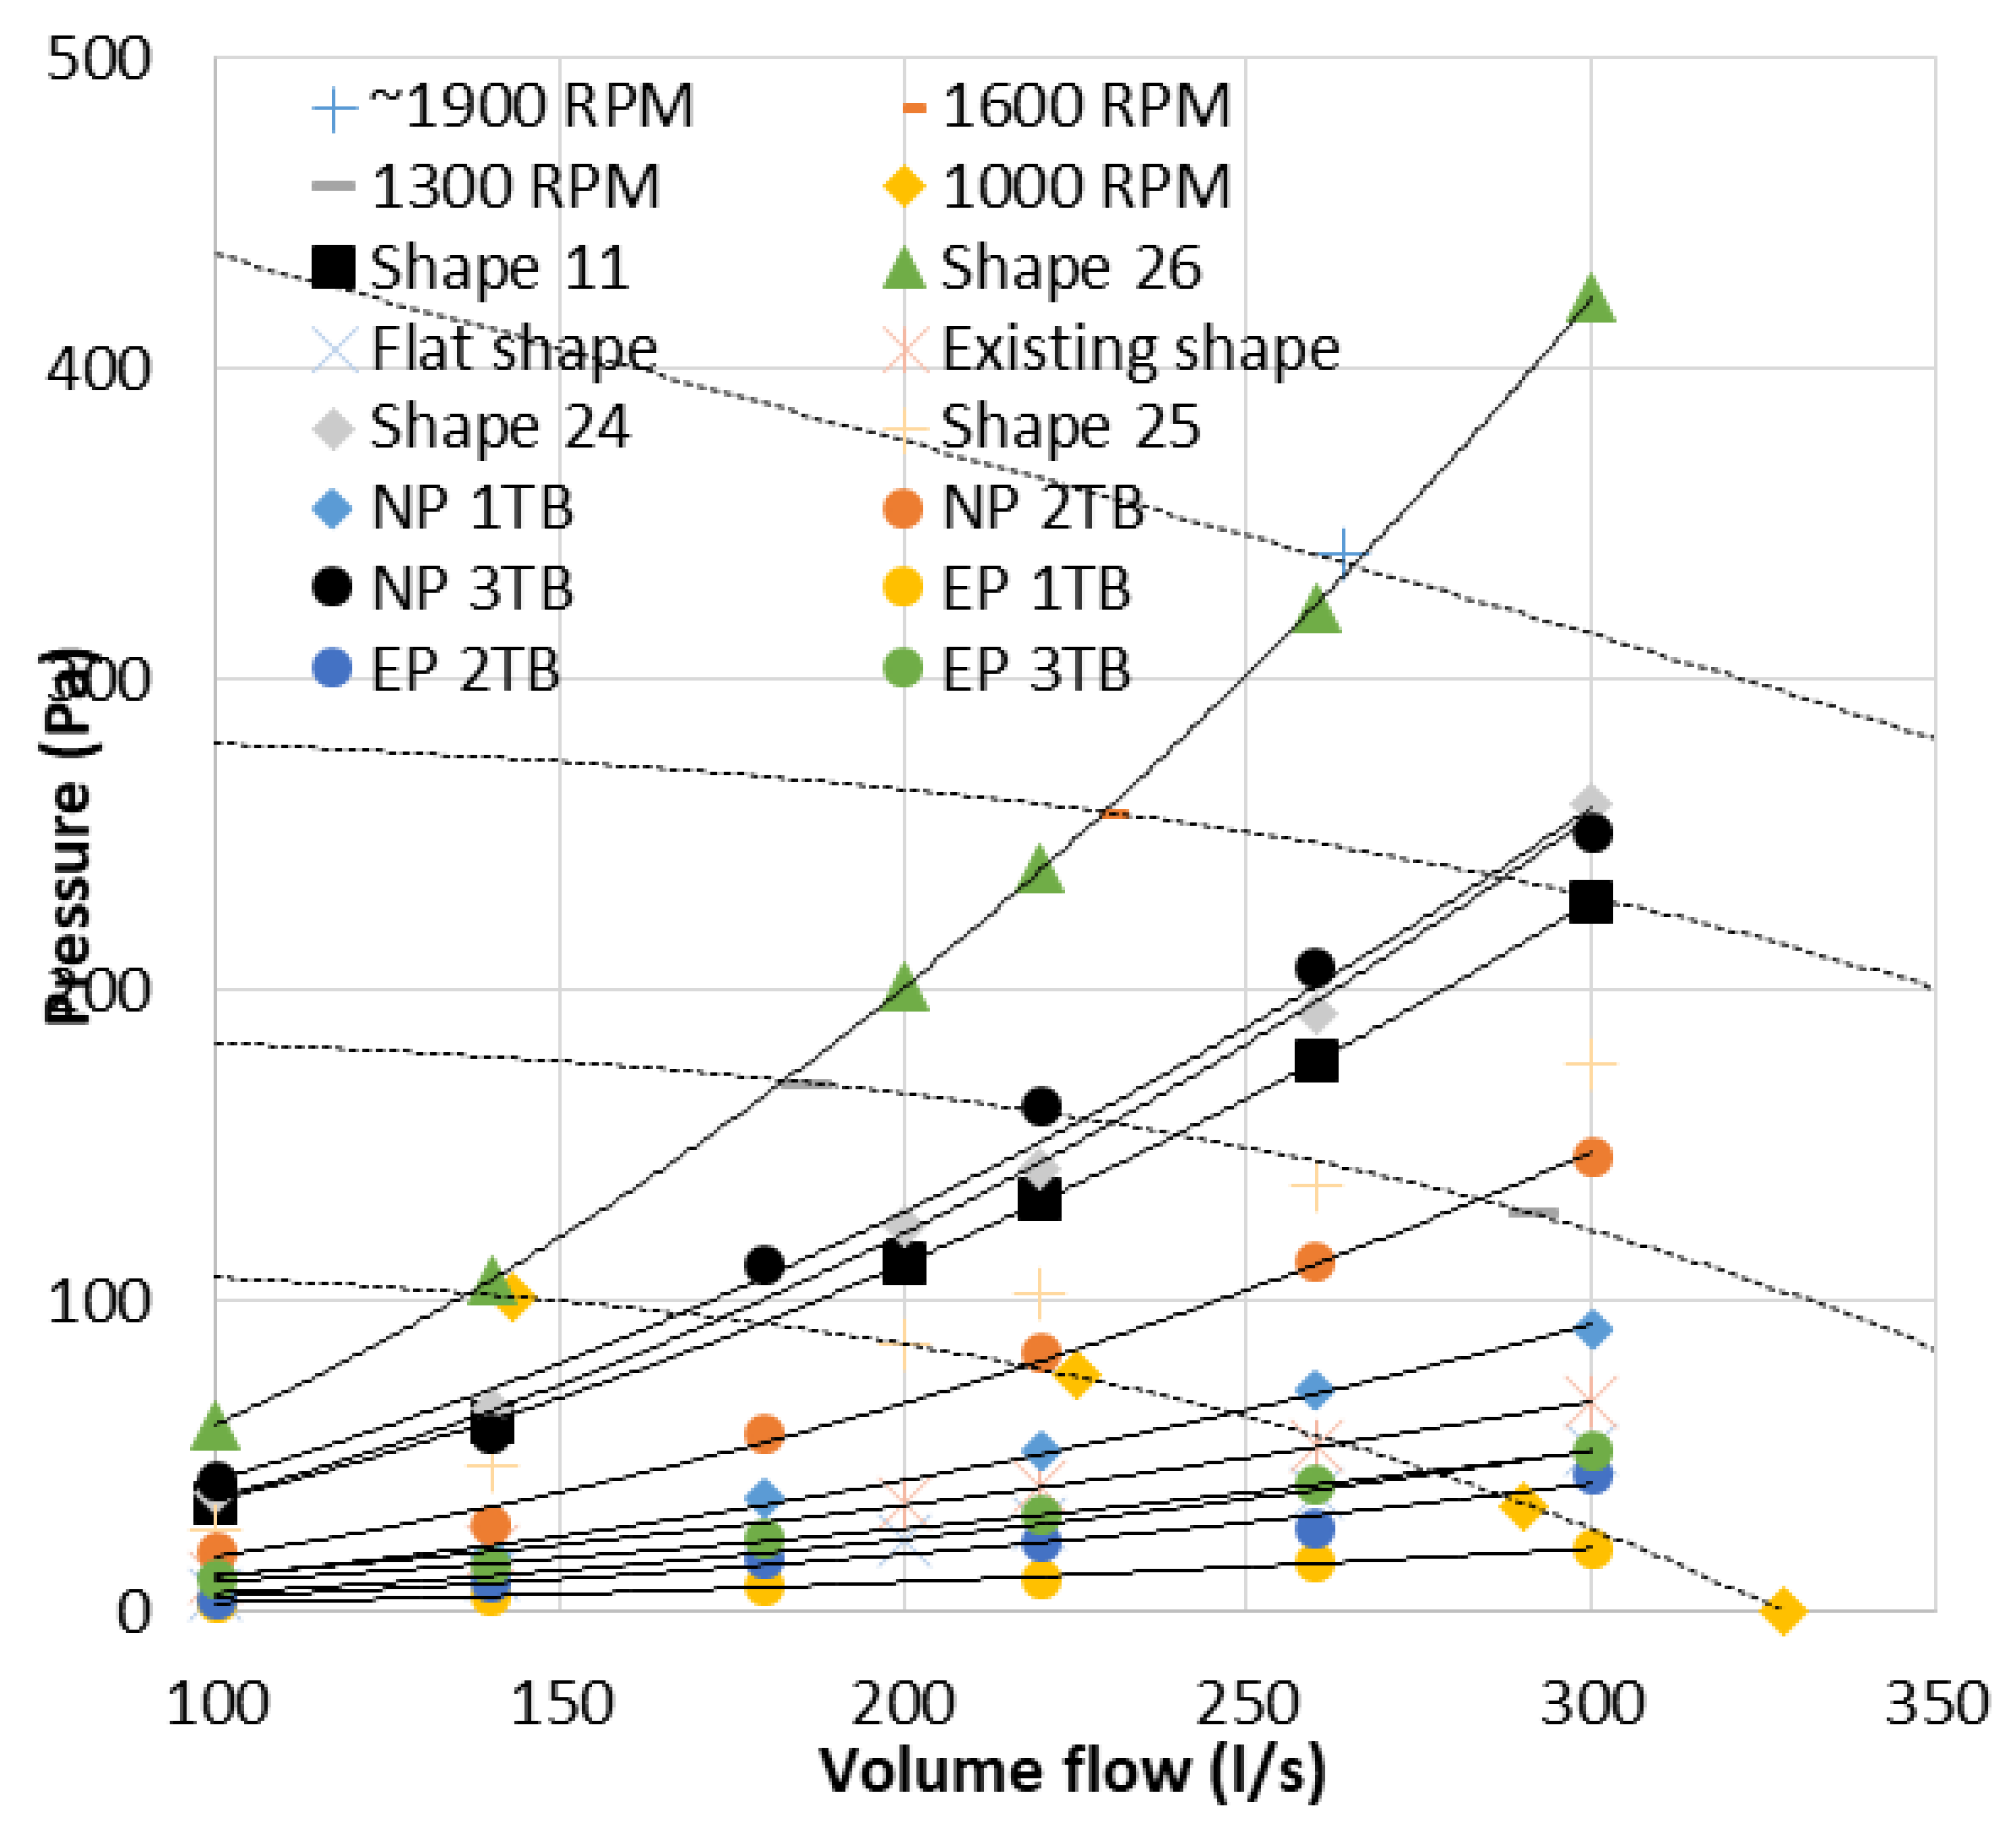
- Laboratory test 2 (Figure 6a): Pressure drop along 1, 2 and 3 TB
- A test rig consisting in a fan and rectangular ducts was mounted to measure the pressure drop of 1, 2 and 3 thermal batteries for existing and new TB.
- The airflow of the tests varied between 50–150 L/s with steps of 20 L/s;
- The test was concluded when the pressure drop for new and existing panels was tested for 1, 2 and 3 TB.
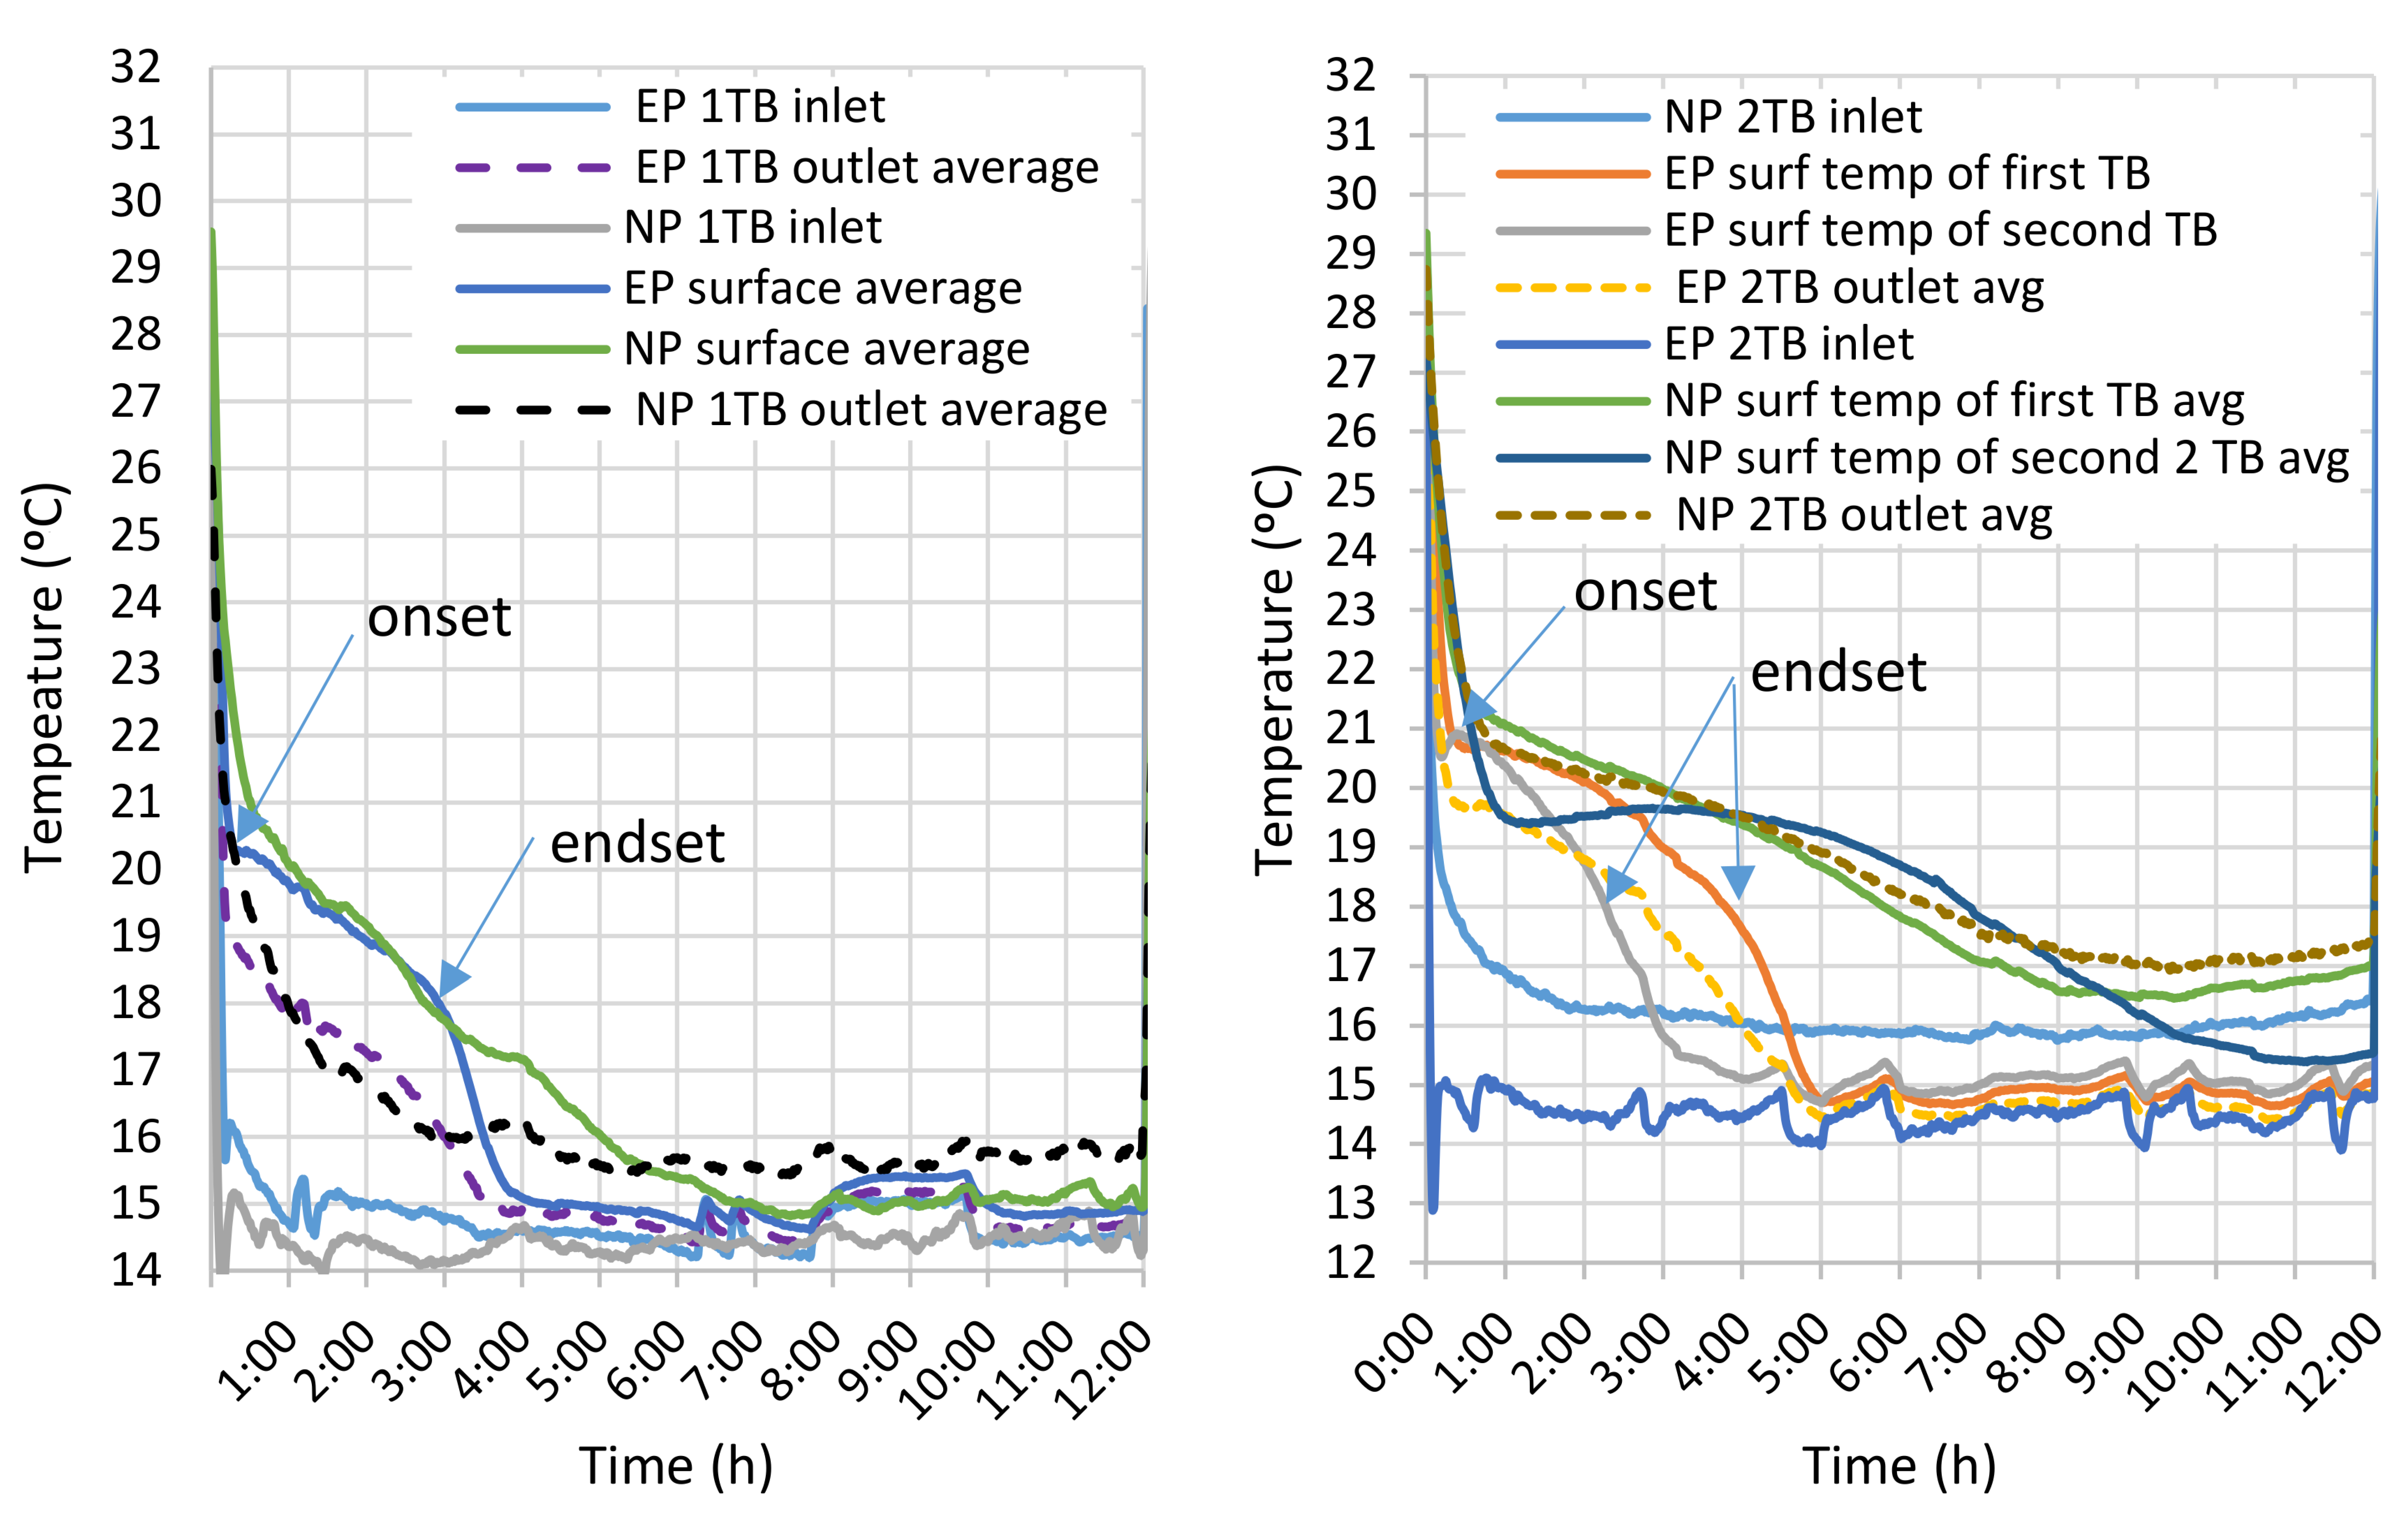
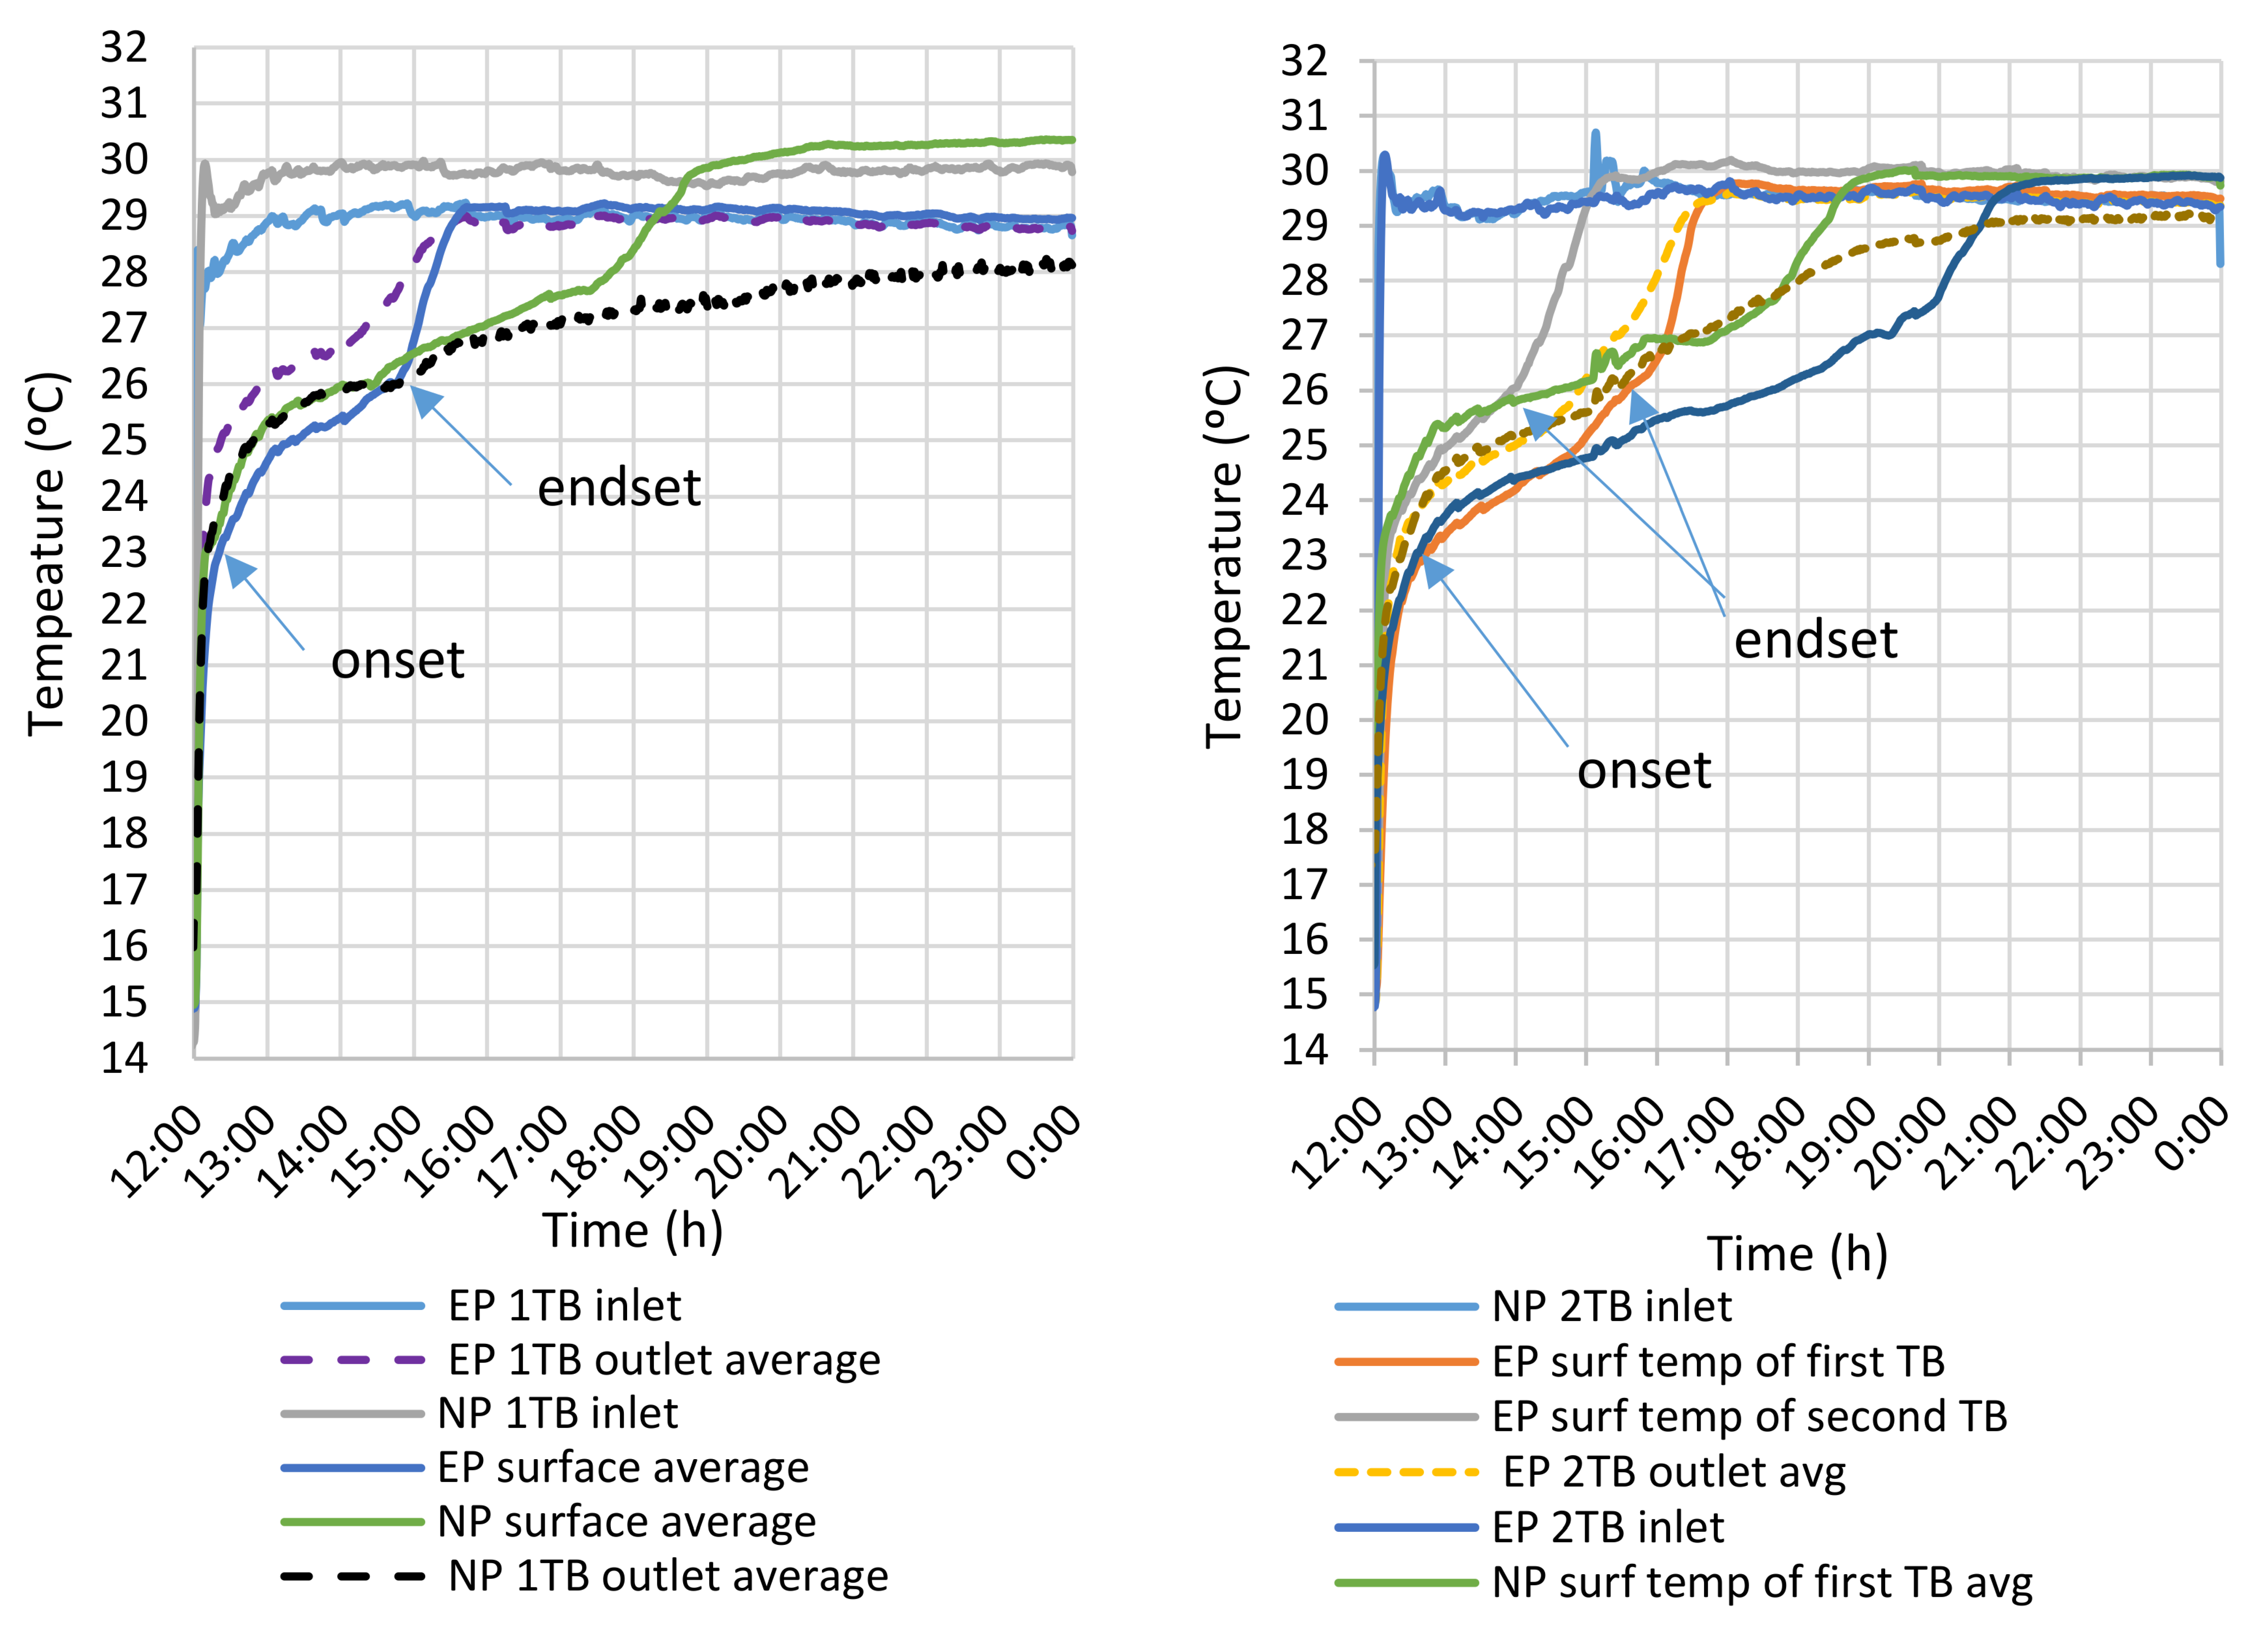
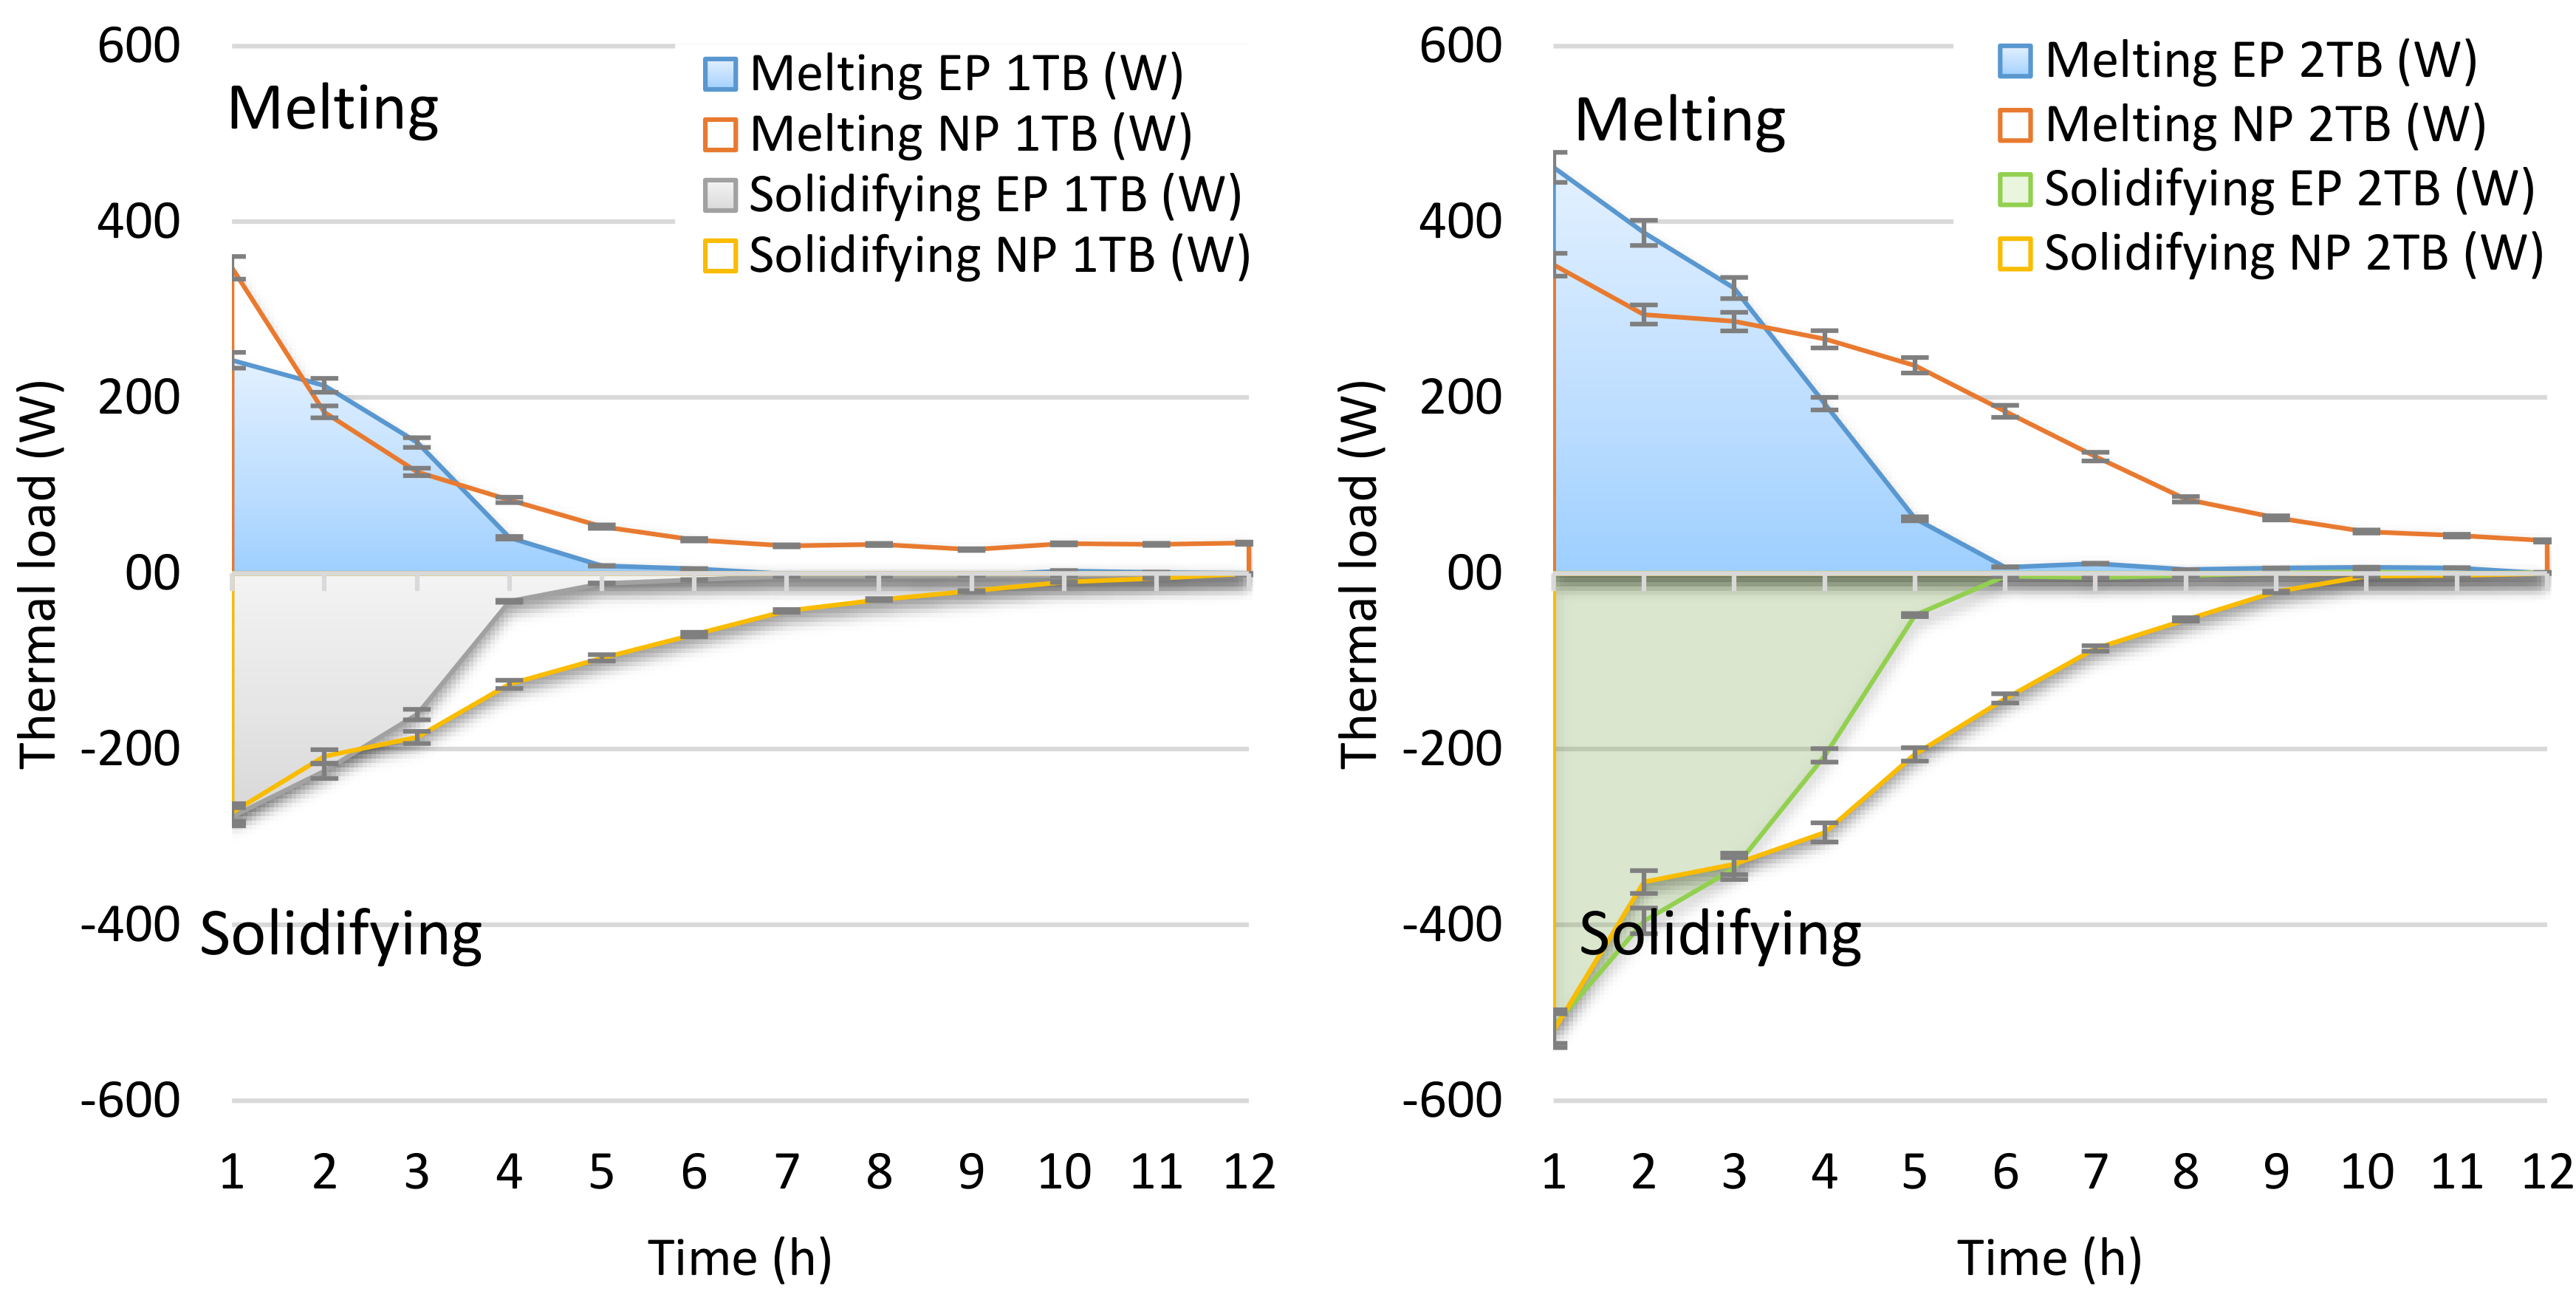
- Laboratory test 3 (Figure 6b): Melting and solidifying process of 1 and 2 TB Ws tested to compare the efficiency between the existing and the new panel. The energy balance from the airside was applied to evaluate the charging and discharging process as well as the time necessary.
- A test rig consisting in a fan, rectangular ducts and a cooling/heating source with a control system able to provide stable temperature during charging and discharging tests (charging setpoint of 15 °C and heating setpoint of 30 °C adjusted on the cooling/heating source (Hybrid Thermal Mixing Low Temperature Hot Water: HTM LTHW [27]));
- The existing and new panels were filled and sealed with the PCM CrodaTherm™ 24 [28];
- One thermocouple before and 2 after the test section measured the air temperature every 15 s; two thermocouples was judged to be enough as the variation between them was small.
- 12 thermocouples were attached on the panel surface located at the middle of the thermal battery (6 on the upper and 6 on the bottom surface) plus 6 thermocouples were attached on the panel located below and above the middle panel;
- The fixed airflow of 75 L/s for all tests was measured using the airflow meter Sensing Precision Balance Master 4250.
3. Results and Analysis
3.1. Numerical Design
3.1.1. 3D Simulations
3.1.2. 2D Simulations
3.2. Laboratory Test
3.2.1. Heat Transfer and Pressure Drop of One Panel with Different Gaps between Panels
3.2.2. Thermal Enhancement Factor (TEF)
3.2.3. Charging and Discharging Time
3.2.4. Thermal Load
4. Conclusions
Author Contributions
Funding
Institutional Review Board Statement
Informed Consent Statement
Data Availability Statement
Acknowledgments
Conflicts of Interest
Nomenclature
| Symbols | Subscripts | ||
| A | Area (m2) | air | |
| Specific heat of air (J/kg∙K) | i | Inlet | |
| Hydraulic diameter (m) | m | Fluid | |
| e | Ridge height (m) | o | Outlet |
| E | Sum of gaps (m) | s | Surface |
| h | Channel gap (m) | ||
| h | Heat convection coefficient (W/m2) | Greek symbols | |
| H | Total height (m) | Efficiency | |
| k | Thermal conductivity (W/m∙K) | Pressure difference (Pa) | |
| L | Length (m) | of a smooth surface (Pa) | |
| l | Total surface length (m) | ΔT | Temperature difference (K) |
| Mass flow (kg/s) | |||
| Nusselt number | Abbreviations | ||
| Nusselt number over a smooth surface | CCD | Charged Coupled Device | |
| CFD | Computational Fluid Dynamics | ||
| p | Pitch (m) | PCM | Phase Change Material |
| Heat Flux (W) | KPI | Key Performance Indicator | |
| Re | Reynolds number | LMDT | Log Mean Difference Temperature |
| r | Ridge radius (m) | TB | Thermal Battery |
| s | Ridge spacing (m) | TEF | Thermal Enhancement Factor |
| T | temperature (°C) | TES | Thermal Storage System |
| Sum of panel thickness (m) | 3LC | Three Layer Calorimeter | |
| W | Width (m) |
References
- Arzamendia Lopez, J.P.; Kuznik, F.; Baillis, D.; Virgone, J. Numerical modeling and experimental validation of a PCM to air heat exchanger. Energy Build. 2013, 64, 415–422. [Google Scholar] [CrossRef]
- Zalba, B.; Marín, J.M.; Cabeza, L.F.; Mehling, H. Free-cooling of buildings with phase change materials. Int. J. Refrig. 2004, 27, 839–849. [Google Scholar] [CrossRef]
- Dolado, P.; Lazaro, A.; Marin, J.M.; Zalba, B. Characterization of melting and solidification in a real-scale PCM-air heat exchanger: Experimental results and empirical model. Renew. Energy 2011, 36, 2906–2917. [Google Scholar] [CrossRef]
- Lazaro, A.; Dolado, P.; Marín, J.M.; Zalba, B. PCM–air heat exchangers for free-cooling applications in buildings: Experimental results of two real-scale prototypes. Energy Convers. Manag. 2009, 50, 439–443. [Google Scholar] [CrossRef]
- Alizadeh, M.; Sadrameli, S.M. Development of free cooling based ventilation technology for buildings: Thermal energy storage (TES) unit, performance enhancement techniques and design considerations—A review. Renew. Sustain. Energy Rev. 2016, 58, 619–645. [Google Scholar] [CrossRef]
- Santos, T.; Hopper, N.; Kolokotroni, M. Performance in practice of a ventilation system with thermal storage in a computer seminar room. In Proceedings of the CLIMA 2016, 12th CLIMA REHVA World Congress, Aalborg, Denmark, 22–25 May 2016. [Google Scholar]
- Kolokotroni, M.; Santos, T.; Hopper, N. Ventilative cooling of a seminar room using active PCM thermal storage. REHVA 2016, 53, 36–40. [Google Scholar]
- Santos, T.; Kolokotroni, M.; Hopper, N.; Yearley, K. A study of panel ridges effect on heat transfer and pressure drop in a ventilation duct. In Proceedings of the 38th AIVC-6th TightVent & 4th venticool Conference, Nottingham, UK, 13–14 September 2017. [Google Scholar]
- Moon, M.A.; Park, M.J.; Kim, K.Y. Evaluation of heat transfer performances of various rib shapes. Int. J. Heat Mass Transf. 2014, 71, 275–284. [Google Scholar] [CrossRef]
- Yang, W.; Xue, S.; He, Y.; Li, W. Experimental study on the heat transfer characteristics of high blockage ribs channel. Exp. Therm. Fluid Sci. 2017, 83, 248–259. [Google Scholar] [CrossRef]
- Tanda, G. Heat transfer in rectangular channels with transverse and V-shaped broken ribs. Int. J. Heat Mass Transf. 2004, 47, 229–243. [Google Scholar] [CrossRef]
- Kim, K.M.; Lee, H.; Kim, B.S.; Shin, S.; Lee, D.H.; Cho, H.H. Optimal design of angled rib turbulators in a cooling channel. Heat Mass Transf. Stoffuebertragung 2009, 45, 1617–1625. [Google Scholar] [CrossRef]
- Zhang, F.; Wang, X.; Li, J. Flow and heat transfer characteristics in rectangular channels using combination of convex-dimples with grooves. Appl. Therm. Eng. 2017, 113, 926–936. [Google Scholar] [CrossRef]
- Promvonge, P.; Thianpong, C. Thermal performance assessment of turbulent channel flows over different shaped ribs. Int. Commun. Heat Mass Transf. 2008, 35, 1327–1334. [Google Scholar] [CrossRef]
- Thianpong, C.; Chompookham, T.; Skullong, S.; Promvonge, P. Thermal characterization of turbulent flow in a channel with isosceles triangular ribs. Int. Commun. Heat Mass Transf. 2009, 36, 712–717. [Google Scholar] [CrossRef]
- Promvonge, P.; Chompookham, T.; Kwankaomeng, S.; Thianpong, C. Enhanced heat transfer in a triangular ribbed channel with longitudinal vortex generators. Energy Convers. Manag. 2010, 51, 1242–1249. [Google Scholar] [CrossRef]
- Iten, M.; Liu, S.; Shukla, A. A review on the air-PCM-TES application for free cooling and heating in the buildings. Renew. Sustain. Energy Rev. 2016, 61, 175–186. [Google Scholar] [CrossRef]
- Choi, E.Y.; Choi, Y.D.; Lee, W.S.; Chung, J.T.; Kwak, J.S. Heat transfer augmentation using a rib-dimple compound cooling technique. Appl. Therm. Eng. 2013, 51, 435–441. [Google Scholar] [CrossRef]
- Ligrani, P.M.; Mahmood, G.I.; Harrison, J.L.; Clayton, C.M.; Nelson, D.L. Flow structure and local Nusselt number variations in a channel with dimples and protrusions on opposite walls. Int. J. Heat Mass Transf. 2001, 44, 4413–4425. [Google Scholar] [CrossRef]
- SriHarsha, V.; Prabhu, S.V.; Vedula, R.P. Influence of rib height on the local heat transfer distribution and pressure drop in a square channel with 90° continuous and 60° V-broken ribs. Appl. Therm. Eng. 2009, 29, 2444–2459. [Google Scholar] [CrossRef]
- Liou, T.M.; Chang, S.W.; Huang, C.Y.; Chan, S.P.; Lan, Y.A. Particle image velocimetry and infrared thermography measurements in a two-pass 90-deg ribbed parallelogram channel. Int. J. Heat Mass Transf. 2016, 93, 1175–1189. [Google Scholar] [CrossRef]
- Liu, J.; Song, Y.; Xie, G.; Sunden, B. Numerical modeling flow and heat transfer in dimpled cooling channels with secondary hemispherical protrusions. Energy 2015, 79, 1–19. [Google Scholar] [CrossRef]
- Hwang, S.D.; Kwon, H.G.; Cho, H.H. Local heat transfer and thermal performance on periodically dimple-protrusion patterned walls for compact heat exchangers. Energy 2010, 35, 5357–5364. [Google Scholar] [CrossRef]
- ASHRAE. ASHRAE Fundamentals, SI ed.; ASHRAE: Atlanta, GA, USA, 2013; Volume 1, ISBN 9781933742557. [Google Scholar]
- Incropera, F.P. Fundamentals of Heat and Mass Transfer; John Wiley: Hoboken, NJ, USA, 2007; ISBN 0471457280. [Google Scholar]
- Tyagi, K.; Singh, P.; Pandit, J.; Ramesh, S.; Ekkad, S.V.; Tolpadi, A. Experimental study of heat transfer augmentation in high aspect-ratio channels featuring different dimple configurations. In Proceedings of the ASME Turbo Expo 2015: Turbine Technical Conference and Exposition, Montreal, QC, Canada, 15–19 June 2015; pp. 1–11. [Google Scholar]
- HTM F Hybrid Ventilation. Available online: https://www.monodraught.com/products/hybrid-ventilation/htm-f (accessed on 8 January 2021).
- CrodaThermTM Bio-based Phase Change Materials | Croda Phase Change Materials. Available online: https://www.crodatherm.com/en-gb (accessed on 8 January 2021).
- Moffat, R.J. Describing the uncertainties in experimental results. Exp. Therm. Fluid Sci. 1988, 1, 3–17. [Google Scholar] [CrossRef] [Green Version]
- Zhang, Z.; Zhang, W.; Zhai, Z.J.; Chen, Q.Y. Evaluation of Various Turbulence Models in Predicting Airflow and Turbulence in Enclosed Environments by CFD: Part 2—Comparison with Experimental Data from Literature. HVAC R Res. 2007, 13, 871–886. [Google Scholar]





| 3D Simulations | ||||
|---|---|---|---|---|
| Shape | Ridge Height/ Air Gap (e/h) | Ridge Pitch Length/Panel Length (s/l) | Ridge Width/ Panel Width (wr/w) | Ridge Radius (r) (mm) |
| Shape 0 dimpled | 0.250 | 0.058 | 0.033 | 6 |
| Shape 1 | 0.188 | 0.039 | 0.077 | 1.5 |
| Shape 2 | 0.188 | 0.039 | 0.083 | 1.5 |
| Shape 3 | 0.313 | 0.039 | 0.083 | 2.5 |
| Shape 4 | 0.125 | 0.039 | 0.077 | 1.5 |
| Shape 5 | 0.313 | 0.078 | 0.183 | 2.5 |
| Shape 6 | 0.250 | 0.039 | 0.093 | 5 |
| Shape 7 | 0.250 | 0.062 | 0.867 | 5 |
| Shape 8 teardrop | 0.313 | 0.039 | 0.029 | 5 |
| Shape 9 | 0.219 | 0.044 | 0.867 | 2.5 |
| Shape 10 | 0.313 | 0.056 | 0.867 | 2.5 |
| Existing | 0.125 | 0.033 | 0.033 | - |
| 2D Simulation of Shape 9 | |||
|---|---|---|---|
| Shape 9 Variations | Ridge Height/Panel Length (s/l) | Ridge Pitch/Panel Length (s/l) | Ridge Radius (r) (mm) |
| Shape 11 | 0.219 | 0.044 | 2.5 |
| Shape 12 | 0.063 | 0.022 | 7.5 |
| Shape 13 | 0.063 | 0.022 | 7.5 |
| Shape 14 | 0.188 | 0.044 | 2.5 |
| Shape 15 | 0.250 | 0.044 | 2.5 |
| Shape 17 | 0.188 | 0.033 | 2.5 |
| Shape 18 | 0.188 | 0.022 | 2.5 |
| Shape 19 | 0.219 | 0.044 | 2.5 |
| Shape 20 | 0.219 | 0.056 | 2.5 |
| Shape 21 | 0.281 | 0.044 | 3.0 |
| Shape 22 | 0.219 | 0.044 | 2.5 |
| Shape 23 | 0.281 | 0.044 | 2.5 |
| 2D Simulation Refinement | |||
| Shape 9 in Module | Gap between panels/Panels Duct Height (h/H) | Panel Thickness/Duct Height (h/H) | Number of Panels (p) |
| Shape 24 | 0.042 | 0.069 | 9 |
| Shape 25 | 0.042 | 0.079 | 8 |
| Shape 26 | 0.042 | 0.124 | 6 |
| Shape 27 | 0.048 | 0.101 | 6 |
| Shape 28 | 0.053 | 0.101 | 6 |
| Shape 29 | 0.063 | 0.121 | 5 |
| Shape 30 | 0.051 | 0.151 | 4 |
| Shape 31 | 0.034 | 0.080 | 8 |
| Shape 32 | 0.030 | 0.070 | 9 |
| Shapes | First Mesh | Adapted Mesh | ||
|---|---|---|---|---|
| Nodes | Elements | Nodes | Elements | |
| 1 module | 168,489 | 158,948 | 371,043 | 330,158 |
| 2 modules | 265,665 | 248,554 | 1,083,181 | 982,672 |
| 3 modules | 272,987 | 252,044 | 1,395,533 | 1,202,846 |
| Experiment Pressure Drop (Pa) | Pressure Drop Simulation in 2D (Pa) | Difference between Experiment and Simulation (Pa) | |||||||
|---|---|---|---|---|---|---|---|---|---|
| Air flow (Re) | 1 TB | 2 TB | 3 TB | 1 TB | 2 TB | 3 TB | 1 TB | 2 TB | 3 TB |
| 10089 | - | 10.30 | - | - | 11.07 | - | - | 0.77 | - |
| 18736 | 15.38 | 28.58 | 40.98 | 19.80 | 37.77 | 52.69 | 4.42 | 9.19 | 11.71 |
| 21600 | 20.20 | 43.47 | 51.24 | 25.51 | 45.92 | 67.29 | 5.32 | 2.44 | 16.05 |
| 11 | 24 | 25 | 26 | 27 | 28 | 29 | 30 | 31 | 32 | |
|---|---|---|---|---|---|---|---|---|---|---|
| 13.68% | 0.08% | 2.63% | 20.51% | −2.56% | −2.56% | −2.56% | −2.56% | 3.93% | 2.31% | |
| Panels/module | 7 | 9 | 8 | 6 | 6 | 6 | 5 | 4 | 8 | 9 |
| Reynolds Number | 8 mm Gap | 9 mm Gap | 10 mm Gap |
|---|---|---|---|
| 1954 | 20% | −5% | −26% |
| 4067 | 94% | 36% | 5% |
| 6061 | 124% | 72% | 77% |
| Reynolds Number | |||
|---|---|---|---|
| 1954 | −22% | −11% | −12% |
| 4067 | −9% | 21% | −25% |
| 6061 | 15% | 11% | 3% |
| Averaged Reynolds Number | 8 mm | 9 mm | 10 mm |
|---|---|---|---|
| 1954 | 5.9% | −15.1% | −29.8% |
| 4067 | 66.7% | 22.0% | −8.9% |
| 6061 | 84.4% | 48.9% | 49.9% |
| Pressure Drop Increase | |||
|---|---|---|---|
| Airflow | 1 TB | 2 TB | 3 TB |
| 50 | 230% | 200% | 300% |
| 70 | 390% | 240% | 380% |
| 90 | 390% | 270% | 430% |
| 110 | 360% | 330% | 410% |
| 130 | 350% | 240% | 390% |
| 150 | 350% | 270% | 370% |
| Average | 345% | 258% | 380% |
| Airflow (L/s) | Shape 11 | NP 3TB | % (Experiment/Design) | Difference (Pa) |
|---|---|---|---|---|
| 100 | 34.31 | 41.9 | 22.1% | 7.6 |
| 140 | 61.28 | 56.7 | −7.5% | −4.6 |
| 180 | 112.27 | 111.0 | −1.1% | −1.3 |
| 220 | 132.60 | 162.5 | 22.6% | 29.9 |
| 260 | 176.80 | 207.0 | 17.1% | 30.2 |
| 300 | 228.24 | 250.4 | 9.7% | 22.2 |
| Average | 10.5% | 14.00 | ||
| Standard Deviation (σ) | ±11.4% | ±14.15 | ||
| 1 Thermal Battery | 2 Thermal Batteries | ||||||||
|---|---|---|---|---|---|---|---|---|---|
| Melting | Solidifying | Melting | Solidifying | ||||||
| EP | NP | EP | NP | EP | NP | EP | NP | Average (σ) | |
| Laboratory test (Wh) | 831.8 | 1015.8 | −725.6 | −1066.0 | 1472.3 | 2029.1 | −1508.6 | −2336.0 | |
| 3LC (Wh) | 817.5 | 1059.7 | 828.8 | 1074.3 | 1635.0 | 2119.4 | 1657.5 | 2148.6 | |
| Difference (Wh) | −14.3 | 43.9 | 103.2 | 8.4 | 162.7 | 90.4 | 148.9 | −187.4 | 105.4 (±44.5) |
| Difference | −1.7% | 4.3% | 14.2% | 0.8% | 11.1% | 4.5% | 9.9% | −8.0% | 9.4% (±6.7%) |
| Time (h) | Increase (in%) | |||
|---|---|---|---|---|
| 1TB | Melting | EP 1TB | 3.5 | 86% |
| NP 1TB | 6.5 | |||
| Solidifying | EP 1TB | 4.0 | 38% | |
| NP 1TB | 5.5 | |||
| 2TB | Melting | EP 2TB | 4.5 | 100% |
| NP 2TB | 9.0 | |||
| Solidifying | EP 2TB | 5.0 | 70% | |
| NP 2TB | 8.5 |
Publisher’s Note: MDPI stays neutral with regard to jurisdictional claims in published maps and institutional affiliations. |
© 2021 by the authors. Licensee MDPI, Basel, Switzerland. This article is an open access article distributed under the terms and conditions of the Creative Commons Attribution (CC BY) license (http://creativecommons.org/licenses/by/4.0/).
Share and Cite
Santos, T.; Wrobel, L.C.; Hopper, N.; Kolokotroni, M. Numerical Design and Laboratory Testing of Encapsulated PCM Panels for PCM-Air Heat Exchangers. Appl. Sci. 2021, 11, 676. https://doi.org/10.3390/app11020676
Santos T, Wrobel LC, Hopper N, Kolokotroni M. Numerical Design and Laboratory Testing of Encapsulated PCM Panels for PCM-Air Heat Exchangers. Applied Sciences. 2021; 11(2):676. https://doi.org/10.3390/app11020676
Chicago/Turabian StyleSantos, Thiago, Luiz C. Wrobel, Nick Hopper, and Maria Kolokotroni. 2021. "Numerical Design and Laboratory Testing of Encapsulated PCM Panels for PCM-Air Heat Exchangers" Applied Sciences 11, no. 2: 676. https://doi.org/10.3390/app11020676
APA StyleSantos, T., Wrobel, L. C., Hopper, N., & Kolokotroni, M. (2021). Numerical Design and Laboratory Testing of Encapsulated PCM Panels for PCM-Air Heat Exchangers. Applied Sciences, 11(2), 676. https://doi.org/10.3390/app11020676


