1. Introduction
Flight comfort is greatly influenced by the noise level in the aircraft cabin. In this respect, it is always an important aim to reduce the level of noise in the cabin, which is produced by the propulsion system and aero-acoustic effects. However, as always in aviation, having a lightweight solution is crucial. Hence, the study of an effective vibration control system which offers a low weight is of significant interest for practical aircraft design. A smart exciter (SE) [
1] attached to the cabin sidewall panels can function as a new type of loudspeaker for emergency announcements in the aircraft cabin [
2]. Simultaneously, it may act as a semi-active system for the reduction of vibrations in aircraft structures. The advantages of using a SE as a vibration reduction device are: (i) it adds almost no additional weight to the cabin, (ii) it requires no additional power supply (if used for semi-active noise control) and (iii) several single systems can be used at the same time without cross-coupling effects (known from multiple-input-multiple-output (MIMO) systems applied for active control of sound) because noise reduction is obtained by dissipation of kinetic energy. In addition, it is easier to adapt to different problems than a purely active system, as described in [
3,
4], due to the missing cross-coupling as well as its low energy and cost requirements [
5,
6].
Semi-active systems are based on a semi-active damper whose normal force is adjustable to velocity or displacement control. Applications are known from semi-active vibration isolation [
7,
8]. Other examples of this concept can be found in the form of the Relaxation-Isolator (RI), Piezoelectric Shunt Damping (PSD) and Electromagnetic Shunt Damping (EMSD) [
9,
10].
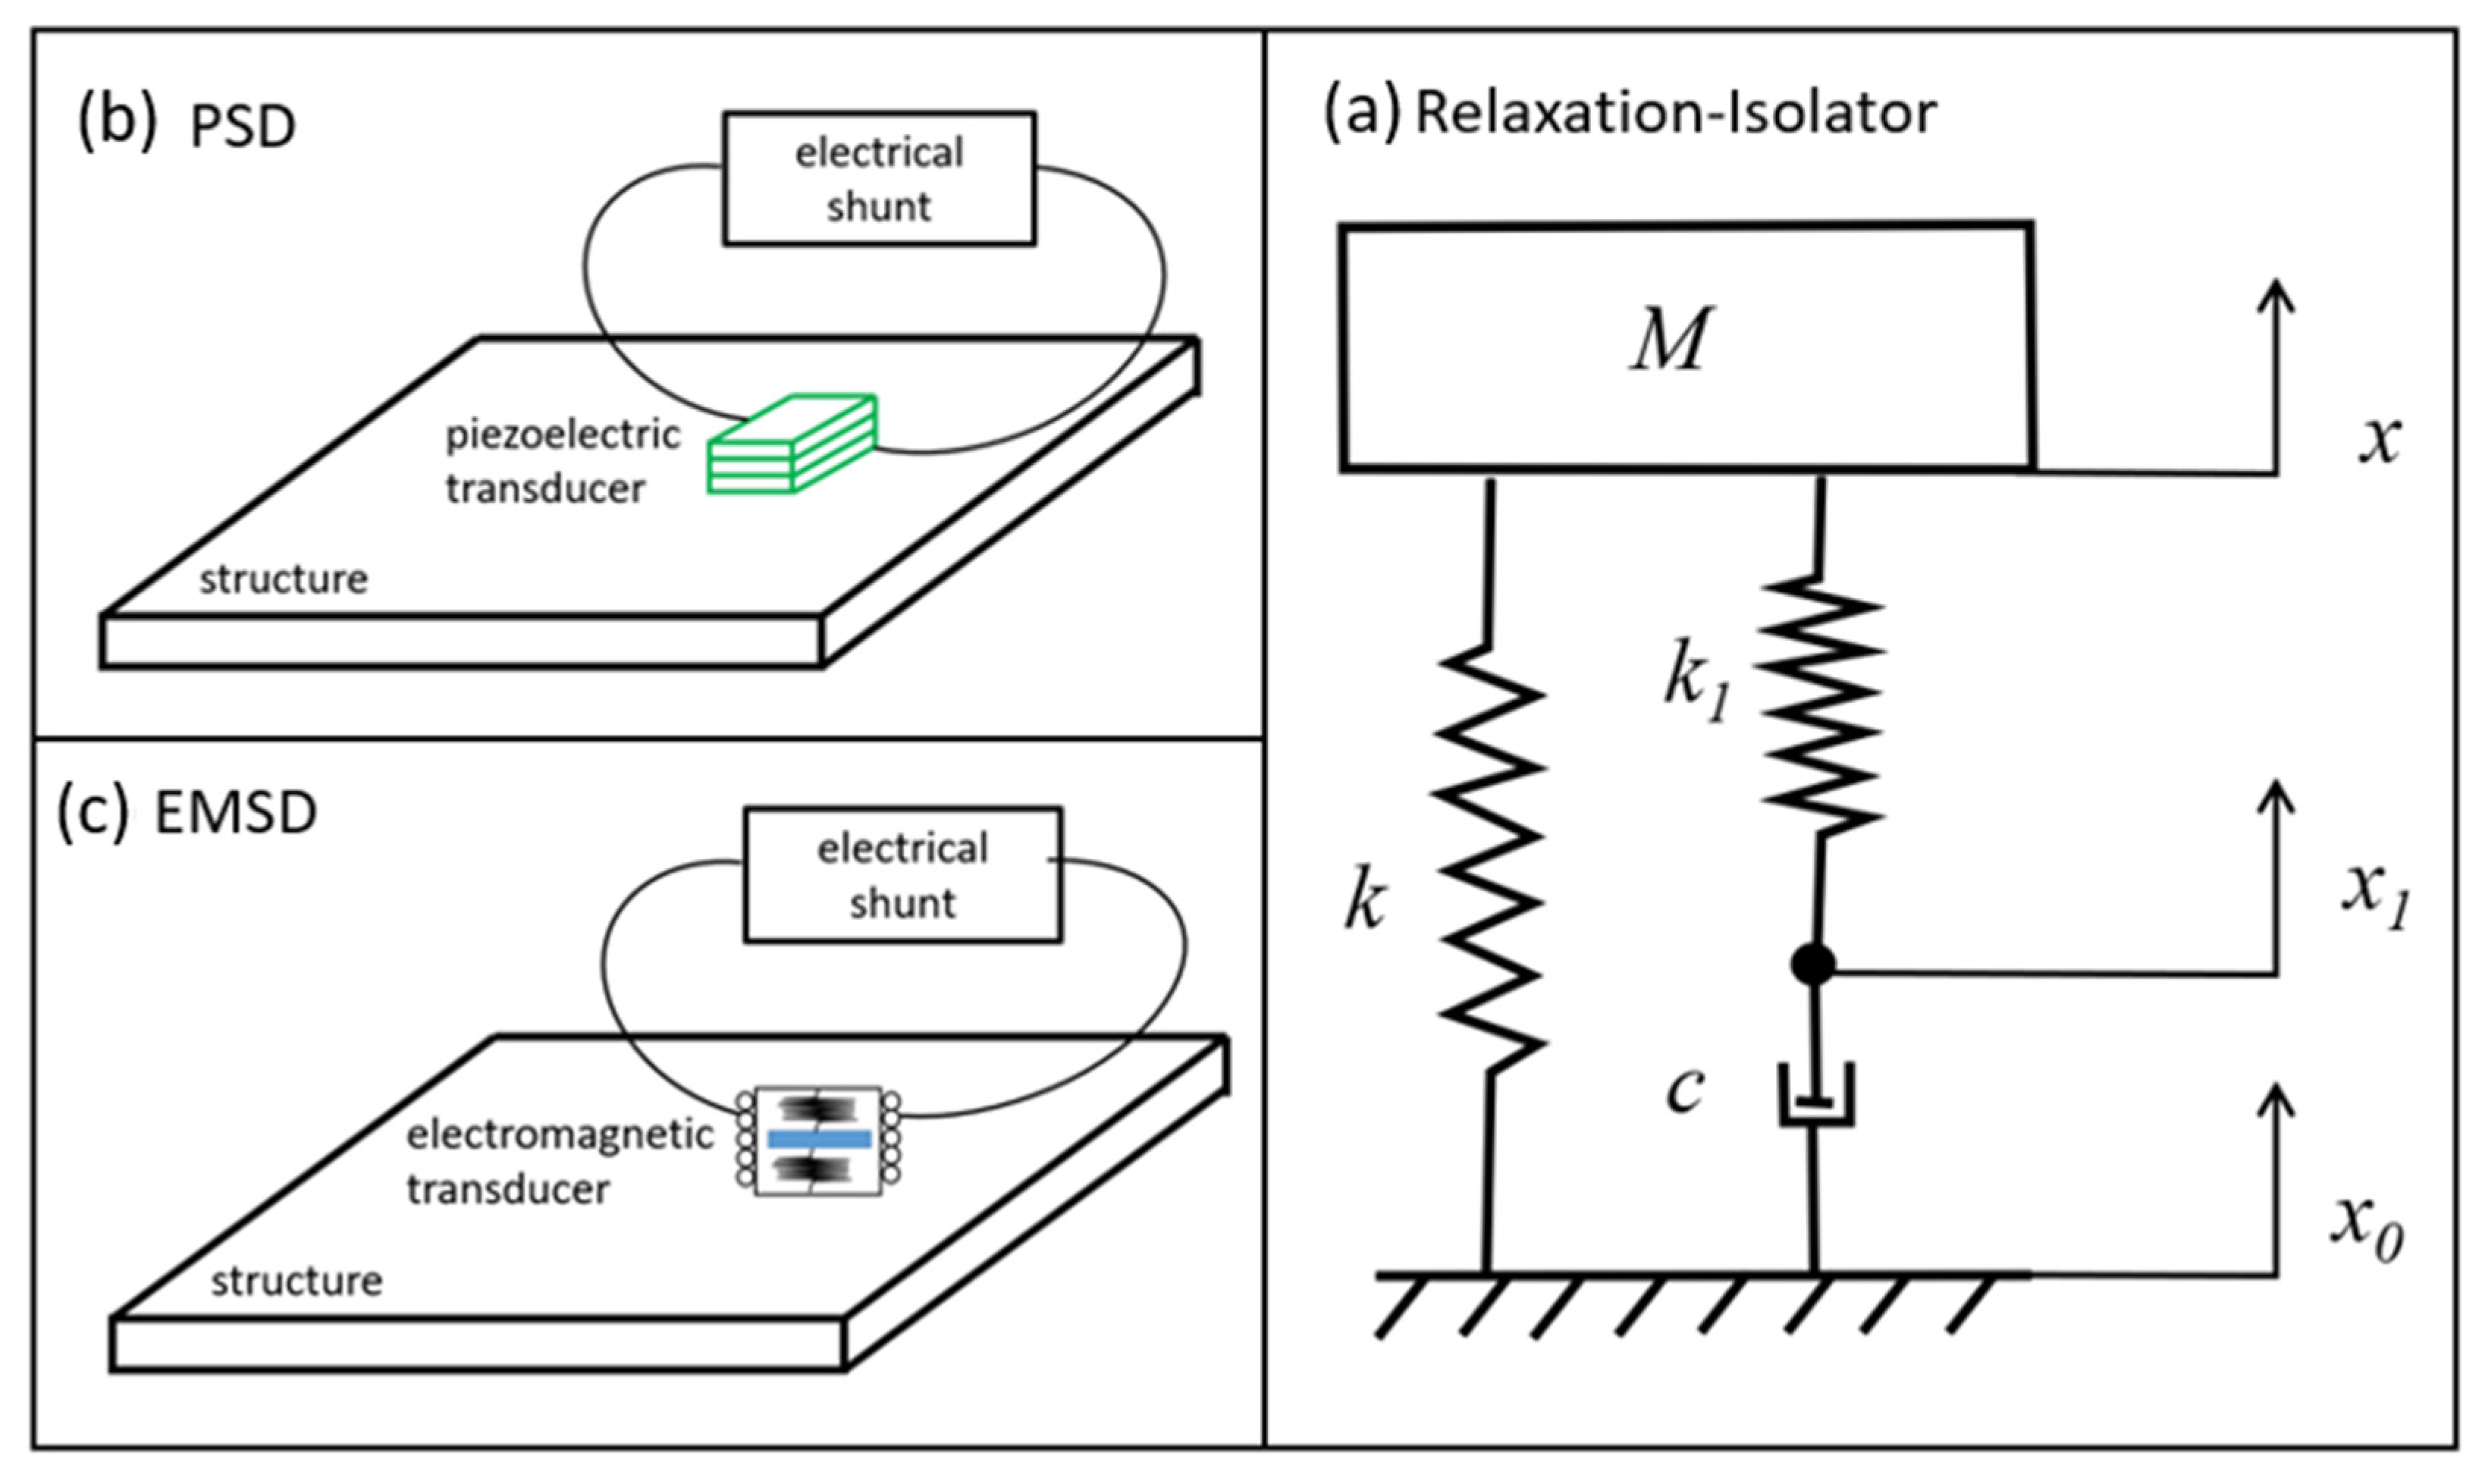
Figure 1a shows the mechanical model of a RI. In this system, the damper,
, and the spring,
, on the right-hand side are used to reduce the vibration of the object,
. The effect of damping is concentrated at the resonance of the system. In
Figure 1b,c, simplified models of a PSD and an EMSD are shown. Piezoelectric transducers [
9,
11,
12,
13] and electromagnetic transducers [
14,
15] function similarly. Both transform kinetic energy from the structure into electrical energy, which is then dissipated in an electrical shunt with a resistor that generates thermal energy. In this way, structural vibration as well as sound radiation are controlled. In recent years, the shunt damping has been widely studied because of its flexibility [
16,
17,
18,
19,
20].
In comparison with the PSD, the SE with electrical shunt (EMSD) can also be used as an emergency loudspeaker. Furthermore, it has better broad-range absorbing effectivity compared to the classical RI. For this reason, the vibration reduction potential of a SE acting in combination with an optimized damping shunt (a special case of EMSD) has been investigated.
The results of this investigation will be presented in this paper, which is organized as follows.
Section 2 describes the simplified SE with an electrical shunt. Results of numerical simulations of the SE with an electrical shunt attached to a lightweight panel (using MATLAB/Simulink and COMSOL) will be presented in
Section 3.
Section 4 reports on experiments that have been performed to experimentally verify the vibration reduction potential. Finally, the conclusion and an outlook on future research directions are summarized in
Section 5.
2. Electro-Mechanical Modeling of Smart Exciter with Shunt Network
This section describes the simplified and discrete model of the investigated SE with an extra electrical shunt. Linear and time-invariant behavior is assumed for all parts. The SE model consists of an electrical circuit coupled with a mechanical network. The electrical part of the SE can be represented as a series connection of a resistor and an inductor and is also known as a resistive-inductive (RL) shunt. Additionally, the suspension of the SE can be modeled as a mass-spring-damper system.
Figure 2 shows the simplified model of the SE, where
is mass of the SE,
,
and
are force factor, electric resistor and inductance of the voice coil of the SE respectively,
and
are the spring constant and damping constant of the SE suspension,
is the current in the coil,
and
are the base displacements of the panel and the SE respectively, and
and
represent an additional series connection of the resistor and inductor that can be used to match the mechanical impedance at the mounting position. Similar models can be found, for example in [
21].
According to
Figure 2, the equations of motion of the SE-RL-shunt system are given by:
Typical values of model parameters (taken from the literature) are shown in
Table 1.
3. Numerical Analysis of Vibration Reduction Potential
3.1. Simulation Framework
3.1.1. Modeling Structural Vibrations Using the Finite Element Method
In order to analyze the vibration reduction potential of a SE attached to a structure, numerical investigations have been performed. A flat panel has been used to represent a lightweight structure. To generate a state space model (SSM), a plate structure has been analyzed using the finite element method implemented in COMSOL 5.5. The panel has a size of 350 × 480 × 11.2 mm, and all edges are simply supported. In this model, three different coupling positions (P1, P2, P3—compare
Figure 3) for the SE have been selected, which also function as the input and output positions for the SSM. This model has then been exported to MATLAB/Simulink. The panel model is a 3D Shell model. It has been used for time-domain simulations. The panel material has been characterized by a density of 137.14 kg/m
3, a Young’s modulus of 650MPa and a Poisson’s ratio of 0.35. In addition, stiffness proportional Rayleigh damping, theory and new developments have been reported in [
22], and have been selected to model the damping effect of the panel material. This model parameter has been set to β = 0.0000032. Prescribed Displacement/Rotation boundary conditions (simply supported) have been applied.
To achieve the desired results, the input force setting in COMSOL has been selected as face loads. Hence, three circles have been created around P1, P2 and P3 (compare
Figure 3) to define the face load inputs. A mesh consisting of triangular elements has been used to discretize the panel. The resulting finite element model consists of 81 triangle elements with 1044 DOFs. The outputs of the SSM are displacements. To obtain these results, the centers of these three circles are defined as output positions. The outputs are defined by using the function Boundary Point Probe with the expression shell.disp. After successful mesh generation and calculation, the matrices of the SSM can be exported to MATLAB/Simulink via the function mphstate. The full MATLAB Code is shown in
Appendix A. AA, BB, CC and DD are the state (system) matrix, input matrix, output matrix and feedthrough matrix, respectively.
3.1.2. Modeling of Smart Exciter with Electric Shunt
After successful export of the state space matrices from COMSOL, the SE coupled with the electric shunt (series connected resistor and inductor) was modeled in MATLAB/Simulink. According to the Equations (1)–(3), the acceleration of the SE,
, and the electric current,
, can be described as follows:
The resulting Simulink model of the SE and the RL-shunt is shown in
Figure 4. As the blue sections show, the input signal to the SE is the displacement of the panel. The SE’s output signal is the exciter force. The black sections in
Figure 4 represent the relationship in Equation (4). The green (electrical components) and orange segments (mechanical components) represent Equation (5). For this model, the solver ode4 (Runge-Kutta) with a step size of 0.0001 s has been used.
3.1.3. Coupled Time-Domain Model for Panel with Smart Exciter
Following the steps outlined above, the state space matrices (for both the panel and SE) have been exported to MATLAB/Simulink. The state matrices have been used in the state space blocks shown in
Figure 4, and then the panel has been coupled with the SE model in MATLAB/Simulink. The complete panel-SE-RL-shunt system is shown in
Figure 5. The green rectangle represents the subsystem of the SE modelm which is the same as the one shown in
Figure 4. The orange rectangle shows the input signal of the model (step and sine wave blocks) which can be used to simulate the wideband and narrowband effect of the SE-RL-shunt coupling. The blue sections are scope blocks for expressing the results of the simulation.
3.2. Numerical Evaluation of Vibration Reduction Potential
3.2.1. Analysis of Wideband Effect by Simulation of Step Response Behavior
After modeling the panel-SE-RL-shunt system successfully, the vibration reduction effect has been simulated numerically. It turned out that both the series connection and the parallel connection of the resistor and inductor have a similar effect on vibration reduction. For this reason, only the results for the SE with the RL-shunt in series connection will be discussed in detail. A SE coupled at position P2 is taken into account. First, the wideband effect has been investigated by using a step signal as input for the Simulink model. The results from the scope blocks are shown in
Figure 6a,b.
Figure 6a shows displacement vs. time for the panel without the SE, and
Figure 6b represents the panel with the SE. The coordinates of the three positions used for evaluation are shown in
Figure 3.
In
Figure 6, the blue curves represent the displacement of position P2, which is the position with the greatest amplitude of displacement. The black curves show displacement of position P1, which has the smallest amplitude. The red curves are for position P3. The displacement amplitude at this position is between the amplitude observed at the positions P2 and P1. After comparing
Figure 6a,b, we find that the initial conditions at t = 1 s (time of step input) are identical for both systems. We also find that the SE with the RL-shunt can reduce the vibrations in a short period of time. Amplitude reduction seen in the curves in
Figure 6b occurs in almost 0.1 s, whereas in
Figure 6a, the same process takes almost 10 s. Comparing the results in the time intervals t = 1 s and t = 10 s, it is obvious that the amount of damping is significantly increased for the system with the SE.
Additionally, the frequency response of the panel has been observed. The amplitude response is shown in
Figure 7. According to the legend, the black curves are for position P1, and the blue and red curves are for positions P2 and P3. In
Figure 7a, we can find that 142.2, 290.5, 419.6 and 567.3 Hz are the first four dominating natural frequencies of the panel. A resonance at 540 Hz is of lower magnitude. After comparing
Figure 7a,b, we see that the vibration reduction effect is most significant at the first natural frequency, whilst at the other three natural frequencies, the amplitude remains nearly unchanged. This may be due to the coupling position of the SE at position P2 in the center of the panel. The displacement of the panel center point reaches a maximum in the dominant first eigenmode. Therefore, the maximum of vibration reduction (semi-active vibration damping) also occurs at this first natural frequency. In total, the magnitude is reduced from −101.6 dB down to −134.3 dB at position P2.
Naturally, the dynamical behavior of the panel with the SE differs from the behavior of the panel without the SE. As a consequence, the first natural frequency is reduced from 142.2 Hz down to 118.4 Hz, as shown in
Figure 7. Since the SE is attached at position P2, the mode shape associated with the first natural frequency is significantly suppressed.
3.2.2. Analysis of Narrowband Effect Due to Harmonic Excitation
The narrowband vibration reduction effect has been investigated using the sine wave block as the input for the Simulink model. The angular frequency under the block parameter is
rad/s, which corresponds to the first natural frequency of the panel without the SE. Therefore, the dominating mode shape is the first bending mode. The results obtained from this analysis are shown below.
Figure 8 shows the displacement of the three positions over time.
Figure 8a is for the panel without the SE and
Figure 8b for the panel with the SE. The blue curves represent the displacement of position P2, which has the greatest amplitude. The black curves are for position P1, which has the smallest amplitude. The red curves are for position P3, whose amplitude is between the amplitudes of positions P1 and P2. After reviewing
Figure 8a,b, we can observe that vibrations can be effectively reduced by the SE.
The maximum amplitude of the panel without the SE is reduced from m down to m. Hence, the vibration level has been reduced by 37.5 dB. A reduction of 32.4 dB would be found if the steady state is compared at t = 9 s.
In order to study more details of the harmonic oscillation and the influence of SE, the steady-state vibration between t = 9.95 s and t = 10 s has been analyzed.
Figure 9 shows the waveform of the panel at P1, P2 and P3.
Figure 9a is for the panel without the SE and
Figure 9b is for the panel with the SE and the RL-shunt. The wave amplitudes correspond to the amplitude in
Figure 8. In addition, the blue, black and red curves show no phase shift at P1, P2 and P3. After comparison of these figures, we can see that the SE does not change the waveform. In summary, the results of the simulation demonstrate the great vibration reduction potential of a SE with an RL-shunt.
4. Experimental Verification of Noise Reduction Potential
4.1. Experimental Setup
To verify the vibration reduction effects of the SE and RL-shunt, experiments have been conducted. In the experiment, an exciter Visaton ES 45 S, a panel (400 × 700 × 7 mm) and a RL-shunt box, produced by the Zentrum für Angewandte Luftfahrtforschung (ZAL) (Hamburg, Germany), have been used. The dimensions of the panel are not identical to the dimensions described in
Section 2. However, to experimentally prove the feasibility of the semi-active vibration control concept in the first step, it has not been necessary to match the parameter of the numerical model. All equipment is shown in
Figure 10,
Figure 11,
Figure 12.
Figure 10 shows the details of the RL-shunt box.
On the top side (
Figure 10a) are the controls, which are more clearly shown in
Figure 11.
and
are the inductance and resistance in the electrical shunt. Parallel and Series represent the connection types. In this box, 127 different types of inductances and resistances have been implemented. The values for
may be set to values between 12.216 and 299.8 Ω, and
may be set to values between 0.0132 and 2.15 mH. The black and white sockets on the right-hand side (
Figure 10b) are for USB connections for programming the device and the power supply. The red and black circles on the front (
Figure 10c) are sockets for the exciter, which are not affected by the accessing sequence.
Additionally, an impulse hammer (B&K type 8206), a microphone, a multi-input-frontend (B&K type 3050 using 5 kHz as the sampling frequency and an integrated digital high-pass filter with 0.7 Hz corner frequency for all inputs) and three accelerometers (B&K type 4508 B) have been used. The coupling positions of the SE and accelerometers (both sides of the panel) and the tapping positions of the hammer are marked on the panel. The positions of these points are shown in
Figure 13. Double-sided tape has been used to define the coupling positions for the SE and the accelerometers on both sides of the panel. The impulse hammer, all accelerometers and the microphone have been connected to the frontend.
The panel has been mounted with two pieces of tape. The microphone has been placed at a 1m distance in front of the panel’s center. Three accelerometers have been glued to the back of the board, as shown in
Figure 14a. Finally, the SE and RL-shunt have been coupled to the front of the panel, as shown in
Figure 14b. The SE was coupled at all positions, P1 to P3, successively. Simultaneously, the force of the impulse hammer, the acceleration and the sound pressure have been recorded and saved on the hard disk of the laptop, which has been connected to the frontend module.
4.2. Experimental Results
To verify the simulated results (shown in
Section 3.2), the acceleration over time has been recorded.
Figure 15 shows the acceleration of position P2 with the SE coupled at position P2. Moreover, for better and persuasive comparison, the input forces of the impulse hammer for different situations are shown in
Figure 16. In these two figures, the black curve represents the panel alone.
The blue curve is for the panel coupled with the SE but without the RL-shunt. The red and green curves are for the panel with the SE which was connected with series or parallel RL. As shown in
Figure 16, the impulse hammer acts on the panel in the time span of 0.020 to 0.025 s. The peaks after 0.03 s may be caused by slowly withdrawing the hammer. The biggest input force was at the panel without the SE, and the smallest at the panel with the SE and the parallel RL-shunt. In
Figure 15, the blue curve shows that the SE can control the vibrations effectively (acting as a classical dynamic absorber), even without an RL-shunt. Already after 0.04 s, the acceleration amplitude of the blue curve was significantly reduced. However, the SE with an RL-shunt performed even better. Between 0.04 and 0.06 s, the acceleration of the panel with the SE coupled with an RL-shunt was more reduced than the panel with an SE alone. This is due to the fact that the amplitude of the red and green curves is much smaller than amplitude of the blue curve.
To see the wideband vibration reduction effect of the SE and the RL-shunt more clearly, the sum of acceleration reduction and sound pressure reduction compared to the panel without a SE up to 400 and 800 Hz were calculated. Equations (6)–(8) show the calculation of the sum of acceleration reduction up to 400 or 800 Hz.
and
are the sums of the acceleration level of the panel without the SE and with the SE, respectively. The method which is shown in Equations (6) and (7) can also be used in all other situations (with the SE, with the SE and parallel RL-shunt, with the SE and series RL-shunt). Then, the differences of acceleration levels have been calculated using Equation (8).
The same method can be used to obtain the sum of sound pressure level reduction using
as a reference. The results are shown in
Figure 17a,b. The blue bars are for the panel with the SE but without an RL-shunt. The yellow and red bars are for the panel with the SE coupled with a series or parallel RL-shunt. Analysis of the two bar charts leads us to a similar conclusion as the one we obtained from the results shown in
Figure 15. A SE alone can reduce the acceleration very effectively.
The SE with an RL-shunt can dissipate more kinetic energy than the SE alone. As shown in
Figure 17, the maximum sum of the acceleration reduction level up to 400 Hz was 30.0 dB, which is at position P1 and with the SE and the RL-shunt. The minimum sum of the acceleration level reduction up to 400 Hz was 15.0 dB at position P2 without the RL-shunt. With the SE connected to the shunt, a reduction up to 25 dB is possible at this position. However, the acceleration reduction effectivity was better at a lower frequency, since the bars in
Figure 17b are lower than the bars in
Figure 17a. Meanwhile, the maximum sum of the sound pressure level reduction was 4.0dB, and the minimum was 2.8 dB. The lower blue bars indicate that the SE with the RL-shunt can reduce the sound pressure level more effectively than the SE alone. According to only small differences between the red and orange bars at sound pressure in
Figure 17a,b, the RL-shunts in series or parallel connection showed almost the same reduction effect.
5. Concluding Remarks and Outlook on Future Work
It has been found that vibration control with a SE-RL-shunt system can be realized very effectively. The SE alone can reduce vibration and sound pressure. However, its vibration reduction effectivity is significantly reduced in higher frequency ranges. After coupling the SE with an RL-shunt, the SE can reduce the acceleration and sound pressure more effectively. Simultaneously, it can reduce the vibrations much faster than it can without the RL-shunt. Whether the RL-shunt is connected in series or parallel makes little difference in its effectiveness.
The main findings according to the feasibility of the proposed semi-active damping approach can be summarized as follows. The results of the numerical investigations prove that the time span of the step response of a panel with the SE and RL-shunt is reduced by a factor of 10 compared to a panel without the semi-active damping device. Furthermore, it has been found that it is possible to reduce the steady-state response of the panel (excited in its first natural mode) down to 32.4 dB, if the proposed semi-active control approach is taken into account during time-harmonic simulations. The experimental results prove that the proposed approach is capable to reduce the overall vibration level in the frequency band 0–400 Hz down to nearly 8.5 dB, if the SE is placed in the center of the panel. Under free-field conditions, a reduction of the sound pressure level close to 2 dB has been detected at the position of a microphone that has been placed at a 1 m distance to the panel.
In the present paper, only RL-shunts have been investigated. For future studies, shunt combinations and the coupling positions of the SE should be investigated in more detail, in order to achieve more effective solutions for vibration reduction and sound pressure absorption. At the same time, the increases in weight should be carefully considered. In addition, non-isothermal behavior due to the heat generation in the resistor should also be investigated to consider regulations in aircraft design.
Author Contributions
Conceptualization, T.K. and Y.W.; methodology, T.K.; software, Y.W.; validation, T.K. and Y.W.; formal analysis, Y.W.; investigation, T.K. and Y.W.; resources, T.K.; data curation, T.K.; writing—original draft preparation, T.K. and Y.W.; writing—review and editing, T.K.; visualization, T.K. and Y.W.; supervision, T.K. and Y.W.; project administration, T.K.; funding acquisition, T.K. All authors have read and agreed to the published version of the manuscript.
Funding
This research was funded by the city of Hamburg in cooperation with Hamburg Innovation.
Institutional Review Board Statement
Not applicable.
Informed Consent Statement
Not applicable.
Data Availability Statement
No additional data available.
Acknowledgments
We thank the Zentrum für Angewandte Luftfahrtforschung GmbH (ZAL) for support and the manufacturing of the RL-shunt box. In the same manner, we acknowledge the Behörde für Wissenschaft, Forschung, Gleichstellung und Bezirke (BWFG) of the city of Hamburg.
Conflicts of Interest
The authors declare no conflict of interest.
Appendix A. MATLAB Code for Exporting State Space Matrices
| M = mphstate(model,’sol1’,’out’,{‘A’ ‘B’ ‘C’ ‘D’ ‘x0’}, |
| ‘input’,{‘Finput1’,’Finput2’,’Finput3’},’output’,{‘comp1.ppb1’,’comp1.ppb2’,’comp1.ppb3’}, |
| ‘keepfeature’,’on’); |
| save(‘matrices.mat’,’A’,’B’,’C’,’D’,’x0’); |
| %Create system in MATLAB |
| sys2= ss(M.A,M.B,M.C,M.D); |
| %Reduce order |
| Options = balredOptions(); |
| sys2Reduced2 = balred(sys2,40,Options); |
| [AA,BB,CC,DD] = ssdata(sys2Reduced2) |
Appendix B. Mode Shapes of the Panel
The mode shapes of the panel analyzed in
Section 2 are shown in
Figure A1a–e. Since the principal shape is (except for a constant multiplier) identical for the panel without and with the SE (even if the associated frequency can differ), only the mode shapes for the panel without the SE are presented.
Figure A1.
Total displacement for: (a) first natural mode shape of the panel, (b) second natural mode shape of the panel, (c) third natural mode shape of the panel, (d) fourth natural mode shape of the panel and (e) fifth natural mode shape of the panel.
Figure A1.
Total displacement for: (a) first natural mode shape of the panel, (b) second natural mode shape of the panel, (c) third natural mode shape of the panel, (d) fourth natural mode shape of the panel and (e) fifth natural mode shape of the panel.
References
- Becker, B.; Mejdi, A.; Caillet, A.; Kochan, K. Design-Methoden für Flachlautsprecher in der Flugzeugkabine. In Proceedings of the DAGA, Kiel, Germany, 6–9 March 2017. [Google Scholar]
- Misol, M. Active Sidewall Panels with Virtual Microphones for Aircraft Interior Noise Reduction. Appl. Sci. 2020, 10, 6828. [Google Scholar] [CrossRef]
- Fuller, C.R.; Elliott, S.J.; Nelson, P.A. Active Control of Vibration; Academic Press: London, UK; San Diego, CA, USA, 1997. [Google Scholar]
- Nelson, P.A.; Elliott, S.J. Active Control of Sound; Academic Press: London, UK; San Diego, CA, USA, 1992. [Google Scholar]
- Karnopp, D. Design Principles for Vibration Control Systems Using Semi-Active Dampers. J. Dyn. Syst. Meas. Control 1990, 112, 448–455. [Google Scholar] [CrossRef]
- Karnopp, D. A Review on Active, Semi-active and Passive Vibration Damping. J. Mech. Des. 1995, 117, 177–185. [Google Scholar] [CrossRef]
- Bankar, V.K.; Aradhye, A.S. Active and Semi-Active Vibration Isolation. Int. J. Curr. Eng. Technol. 2016, 6, 2187–2191. [Google Scholar]
- Liu, Y.; Matsuhisa, H.; Utsuno, H. Semi-Active Vibration Isolation System with Variable Stiffness and Damping Control. J. Sound Vib. 2008, 313, 16–28. [Google Scholar] [CrossRef] [Green Version]
- Gladwell, G.M.L.; Preumont, A. Vibration Control of Active Structures, 3rd ed.; Springer Netherlands: Dordrecht, The Netherlands, 2011. [Google Scholar]
- Yan, B.; Wang, K.; Hu, Z.; Wu, C.; Zhang, X. Shunt Damping Vibration Control Technology: A Review. Appl. Sci. 2017, 7, 494. [Google Scholar] [CrossRef]
- Niederberger, D. Smart Damping Materials Using Shunt Control. Ph.D. Thesis, ETH Zurich, Zurich, Switzerland, 2005. [Google Scholar]
- Liao, W.H.; Wang, D.H. Semiactive Vibration Control of Train Suspension Systems via Magnetorheological Dampers. J. Intell. Mater. Syst. Struct. 2003, 14, 161–172. [Google Scholar] [CrossRef]
- Liao, W.H.; Wang, D.H. Semi-Active Vibration Control Using Piezoelectric Actuators in Smart Structures. Front. Mech. Eng. 2009, 4, 242–251. [Google Scholar] [CrossRef]
- Niederberger, D.; Behrens, S.; Fleming, A.J.; Moheimani, S.; Morari, M. Adaptive electromagnetic shunt damping. IEEE/ASME Trans. Mechatron. 2006, 11, 103–108. [Google Scholar] [CrossRef]
- Yan, B.; Luo, Y.; Zhang, X. Structural multimode vibration absorbing with electromagnetic shunt damping. J. Vib. Control 2016, 22, 1604–1617. [Google Scholar] [CrossRef]
- Behrens, S.; Fleming, A.J.; Moheimani, S. Passive Vibration Control via Electromagnetic Shunt Damping. IEEE/ASME Trans. Mechatron. 2005, 10, 118–122. [Google Scholar] [CrossRef]
- Zhou, S.; Jean-Mistral, C.; Chesné, S. Electromagnetic shunt damping with negative impedances: Optimization and analysis. J. Sound Vib. 2019, 445, 188–203. [Google Scholar] [CrossRef]
- Behrens, S.; Fleming, A.J.; Moheimani, S.O.R. Electromagnetic shunt damping. In Proceedings of the 2003 IEEE/ASME International Conference on Advanced Intelligent Mechatronics (AIM 2003), Kobe, Japan, 20–24 July 2003; pp. 1145–1150. [Google Scholar]
- Cheng, T.H.; Xuan, D.J.; Li, Z.Z.; de Shen, Y. Vibration Control Using Shunted Electromagnetic Transducer. AMM 2010, 26–28, 905–908. [Google Scholar] [CrossRef]
- Yan, B.; Zhang, X.; Niu, H. Vibration isolation of a beam via negative resistance electromagnetic shunt dampers. J. Intell. Mater. Syst. Struct. 2012, 23, 665–673. [Google Scholar] [CrossRef]
- Zenker, B.S.S.; Rawoof, A.; Merchel, S.; Altionsoy, E. Optimized Exciter Positioning Based on Radiated Sound Power of a Flat Panel Loudspeaker. In Proceedings of the 146th AES Convention, Dublin, Ireland, 20–23 March 2019. [Google Scholar]
- Nakamura, N. Extended Rayleigh Damping Model. Front. Built Environ. 2016, 2, 1–13. [Google Scholar] [CrossRef] [Green Version]
Figure 1.
Simplified models of semi-active damping devices: (a) Relaxation-Isolator (RI), (b) Piezoelectric Shunt Damping (PSD) and (c) Electromagnetic Shunt Damping (EMSD).
Figure 1.
Simplified models of semi-active damping devices: (a) Relaxation-Isolator (RI), (b) Piezoelectric Shunt Damping (PSD) and (c) Electromagnetic Shunt Damping (EMSD).
Figure 2.
Simplified model of SE.
Figure 2.
Simplified model of SE.
Figure 3.
Geometry of a plate model with three coupling positions.
Figure 3.
Geometry of a plate model with three coupling positions.
Figure 4.
Block diagram representing the SE with the RL-shunt.
Figure 4.
Block diagram representing the SE with the RL-shunt.
Figure 5.
Fully coupled time-domain model for the panel with the smart exciter including the RL-shunt.
Figure 5.
Fully coupled time-domain model for the panel with the smart exciter including the RL-shunt.
Figure 6.
Displacement vs. time of the panel at positions P1, P2 and P3 (compare
Figure 3): (
a) without the SE and (
b) with the SE.
Figure 6.
Displacement vs. time of the panel at positions P1, P2 and P3 (compare
Figure 3): (
a) without the SE and (
b) with the SE.
Figure 7.
Displacement magnitude vs. frequency of panel: (a) without the SE and (b) with the SE.
Figure 7.
Displacement magnitude vs. frequency of panel: (a) without the SE and (b) with the SE.
Figure 8.
Displacement over time of the panel (a) without the SE and (b) with the SE.
Figure 8.
Displacement over time of the panel (a) without the SE and (b) with the SE.
Figure 9.
Displacement over time of the panel for 9.95 to 10 s: (a) without the SE and (b) with the SE.
Figure 9.
Displacement over time of the panel for 9.95 to 10 s: (a) without the SE and (b) with the SE.
Figure 10.
The box for different combinations of RL-shunts: (a) top, (b) right side and (c) front.
Figure 10.
The box for different combinations of RL-shunts: (a) top, (b) right side and (c) front.
Figure 11.
The operation interface of the RL-shunt box.
Figure 11.
The operation interface of the RL-shunt box.
Figure 12.
The experimental equipment: (a) smart exciter, (b) panel and (c) RL-shunt box.
Figure 12.
The experimental equipment: (a) smart exciter, (b) panel and (c) RL-shunt box.
Figure 13.
Coupling and tapping positions.
Figure 13.
Coupling and tapping positions.
Figure 14.
Experiment’s setup: (a) back, and (b) front, with the SE mounted on position P3.
Figure 14.
Experiment’s setup: (a) back, and (b) front, with the SE mounted on position P3.
Figure 15.
Acceleration vs. time at position P2 for different situations.
Figure 15.
Acceleration vs. time at position P2 for different situations.
Figure 16.
Input force of impulse hammer vs. time for different situations.
Figure 16.
Input force of impulse hammer vs. time for different situations.
Figure 17.
(a) Total reduction of acceleration and sound pressure up to 400 Hz for different situations. (b) Total reduction of acceleration and sound pressure up to 800 Hz for different situations.
Figure 17.
(a) Total reduction of acceleration and sound pressure up to 400 Hz for different situations. (b) Total reduction of acceleration and sound pressure up to 800 Hz for different situations.
Table 1.
Values of variables used in the simplified model [
21].
Table 1.
Values of variables used in the simplified model [
21].
| | | | | | | |
|---|
| 15.000 | 7.540 | 0.141 | 5.016 | 5.648 | 15.540 | 8.000 | 0.300 |
| Publisher’s Note: MDPI stays neutral with regard to jurisdictional claims in published maps and institutional affiliations. |
© 2021 by the authors. Licensee MDPI, Basel, Switzerland. This article is an open access article distributed under the terms and conditions of the Creative Commons Attribution (CC BY) license (https://creativecommons.org/licenses/by/4.0/).


