Article

The Readiness Index for Climate Change Adaptation in Africa: The Role of Climate and Adaptive Capacity Proxies

by
Terence Epule Epule
1,*,
Abdelghani Chehbouni
1,2,
Driss Dhiba
1 and
Mirielle Wase Moto
1
1
International Water Research Institute (UM6P), Mohammed VI Polytechnic University, Lot 660, Hay Moulay Rachid, Ben Guerir 43150, Morocco
2
Center for Remote Sensing and Applications (CRSA), Mohammed VI Polytechnic University, Lot 660, Hay Moulay Rachid, Ben Guerir 43150, Morocco
*
Author to whom correspondence should be addressed.
Appl. Sci. 2021, 11(20), 9413; https://doi.org/10.3390/app11209413
Submission received: 9 September 2021 / Revised: 28 September 2021 / Accepted: 1 October 2021 / Published: 11 October 2021

Abstract

:
As global changes continue, the repercussions in Africa remain profound. This is reflected notably in food and water crises across Africa. This work examines the readiness of Africa to climate change adaptation through a newly developed readiness index (ClimAdaptCap Index). In fact, this work shifts the readiness debate from emotional descriptions that currently flood academic scholarship to a more pragmatic evidence-based approach in assessing readiness. Readiness for climate change adaptation is driven by the intensity of climate forcing and adaptive capacity. The historical climate score data or precipitation and temperature for the period 1991–2016 were culled from the World Bank Climate Portal. The historical adaptive capacity score data included proxies such as poverty and literacy rates from 1991 to 2016 were collected from the World Bank and Macrotrends. The climate data were normalized using the normalization function to enhance interpretation, comparison, and fusion into the index. Missing poverty and literacy rate data were estimated by linear interpolation of the poverty and literacy rate data. The ClimAdaptCap Index was developed to compute readiness. This index is the first of its kind and will serve as a flagship for assessing readiness for climate change adaptation as it is highly adaptable to different contexts. This work’s first-ever maps of readiness show that North and Southern Africa are the readiest for climate change adaptation under historical climate and literacy and poverty conditions. West Africa is the least ready while Middle and East Africa are in the middle. Consistent is that readiness has a positive correlation with literacy rates and an inverse one with poverty rates. In addition, with readiness scores of between 0.35 and 0.39 for all the regions with a maximum potential score of 1, this work has shown that the level of readiness in Africa is generally low, and there is a very small variation between the different regions. In addition, climate change adaptation will highly be influenced by both climatic and non-climatic indicators. The developed readiness index adequately simulates readiness to climate change adaptation in Africa and complements previous frameworks of adaptation preparedness.

1. Introduction

Across Africa, there has been observations of an increase in near-surface temperatures by 0.5 °C or more during the last 50 to 100 years [1,2,3]. Regionally, North Africa has witnessed annual and seasonal observed increasing trends in mean surface temperatures that are significantly beyond the rates and ranges of change due to natural variability. In the warm season (March-August), an increase in near-surface temperatures is observed over North African, Algeria, and Morocco, not mainly due to natural variability. This region also experienced positive trends in terms of annual minimum and maximum temperatures [2]. West Africa, on the other hand, has also witnessed increased near-surface air temperatures over the last 50 years, while Southern Africa witnessed upwards trends as well in annual minimum and maximum temperatures in the last half of the 20th century [2,4]. In terms of temperature projections, it has been projected that temperatures across Africa will rise faster than what has been projected at the global scale during the 21st century. This is seen as global near-surface air temperatures across Africa are projected to move beyond the 20th-century projection by 2069 (±18 years) under the RCP4.5 pathway and by 2047 (±14 years) under the RCP8.5 pathway [2,3,5]. In West Africa, these changes will be unprecedented, and projections of increased temperatures are likely to occur about 1–2 decades earlier than the global average [2]. This is mainly attributed to relatively small variability in this region that generates narrow climate bounds that can be easily surpassed by relatively small changes in climate [2].
In terms of precipitation, North Africa, including the Atlas Mountains and along the Mediterranean coast of Morocco and Algeria, have shown a strong decrease in the amount of precipitation received in winter and spring. In addition, observed trends show greater than 330 dry days with less than 1 mm of precipitation per day for the period 1997–2008 [2,6]. West Africa and the Sahel also witnessed an average reduction in precipitation over the course of the 20th century due mainly to natural variability and increased aerial fertilization effects of carbon dioxide [7,8,9]. On the other hand, East Africa witnessed a deceased in precipitation over 30 years. In contrast, Southern Africa witnessed a reduction in precipitation in late summer from the western part extending to Namibia through Angola during the second half of the 20th century [2]. In terms of projections, precipitation is going to be more uncertain than temperature projections. Indeed, CIMIP5 ensemble projects a decline in mean annual precipitation across the Mediterranean region of North Africa in the mid and late 21st century based on the RCP8.5 pathway [2]. In Southern Africa, CIMIP5 further projects a decrease in mean precipitation over Southern Africa beginning from the mid to late 21st century based on the RCP8.5 pathway [2]. For West Africa, CMIP3 and CIMIP5 show projections of a wetter core rainy season; similar projections are held for most of East and Middle Africa with increased precipitation projected from the mid-21st century for the RCP8.5 pathway [2].
The repercussions of the above observations and projections in climate across Africa are likely to be severe due to the strong dependence on agriculture and the limited capacity to adapt [10]. Africa is the continent that will be hardest hit by climate change. This is already being marked by unpredictable rains, floods, prolonged droughts, and consequent crop failures amid rapid desertification [11,12]. This is also associated with amplifying extreme events such as droughts, floods, and sandstorms [11]. Despite this information on observed and projected climate across Africa, it is still uncertain how these different regions are ready for climate change adaptation. However, regions witnessing rising temperatures and low precipitation are more likely to be vulnerable to food shortages, droughts, and floods [12,13]. In fact, the level of adaptation will not be based on the magnitude of these climate shocks but on the key proxies of adaptive capacity. In other words, regions with higher adaptive capacity will be more able to cope with these climate shocks despite the higher magnitudes recorded [13,14,15,16].
Therefore, a region’s readiness for climate change adaptation is mitigated by climatic variables and adaptive capacity. It is challenging to measure adaptive capacity intrinsically; as such, this work has adopted the proxy-based approach used to quantify and measure adaptive capacity since it depends on an important set of variables. In this regard, in this work, a proxy-based approach is adopted to quantify and measure adaptive capacity. In the context of most African countries, proxies of adaptive capacity such as literacy and poverty rates offer an opportunity through which adaptive capacity can be investigated. These variables are invariably two of the essential proxies of adaptive capacity in Africa as they are most likely to affect other sectors of national and regional life in most countries and regions of Africa [14,17,18,19]. To the best of our knowledge, there are currently no studies that have evaluated the readiness of all the regions of Africa to climate change adaptation based on climate, adaptive capacity and through the index proposed in this study. The only other related study is by Ford and King [15] who developed a framework for assessing climate change adaptation in which adaptation readiness captures adaptive capacity, the strength and existence of governance, democracy, and policy structures responsible for whether adaptation occurs. In addition, Khan and Amelie [12] worked on adaptation readiness in Seychelles based on governance frameworks. Furthermore, Tilleard and Ford [20] focused on Mediterranean Europe, Middle East, North Africa, and sub-Saharan Africa capturing adaptation potential through adaptive capacity and adaptation preparedness or readiness. In addition, Lwasa [21] studied the role of institutional readiness and community resilience in climate change adaptation in Uganda. Finally, Hhamo [17] explored readiness in adopting a green economy in South Africa. In the latter work, the author notes that readiness is often interchanged with preparedness. Readiness is defined as a complex interaction of parameters and conditionalities required for the uptake of a phenomenon. Key readiness parameters for adopting a green economy include the level of commitment when stakeholders buy in, enhancing institutional setup, developing the necessary legislation, funding mechanisms, and having programs running on the ground. Invariably, these conditions provide the right conditions for the adoption of the green economy.
In the context of this current work, an assessment of readiness for climate change adaptation across different regions of Africa is performed through a newly developed readiness index and maps that integrate physical variables in a climate score and socioeconomic variables in an adaptive capacity score. Adaptive capacity is represented by the two proxies of literacy and poverty rates because it is highly representative of the realities in most African contexts and these proxies affect most other proxies. The index is mainly tested in Africa, but it can also be used in other parts of the world. With this index, it is possible to determine the more prepared regions for climate change adaptation. Therefore, this investigation has, as main objectives, the creation and testing of an index called ClimAdaptCap Index across Africa. This is followed by creating the first maps of the regional variation in readiness based on the selected parameters and a new data set that includes precipitation, temperature, literacy, and poverty rate data across Africa.

2. Materials and Methods

2.1. Data Collection

To assess the readiness of Africa to adapt to climate change, this study uses both climate and adaptive capacity proxy-based data. The data were collected for each country in Table 1 and compiled to provide regional averages for each of the five key regions of Africa, which include (North Africa, West Africa, Middle/Central Africa, East Africa, and Southern Africa. The climate data constitutes monthly average time series or historical precipitation (mm) and temperature (°C) data for 1991–2016. The precipitation and temperature data were collected from the Climate Change Knowledge Portal of the World Bank: https://climateknowledgeportal.worldbank.org (accessed on 12 March 2021) [22]. To download this data, this work keyed into the download climate data option, the historical data route, and then specified the climate data to be downloaded (either precipitation or temperature), specified the country and, the time frame (1991–2016). Alternatively, the climate data for any country/region can be easily downloaded if the longitude and latitude of the location are known and computed into the platform. For details on all the data used in this study, please see supplementary materials. The World Bank has made this data accessible to the public through its collaboration with three major partners, which are: The National Centre for Atmospheric Research, which assist in processing the data, The International Research Institute of the University of Colombia, which provides analytical support and development of mapRooms as well as the European Space Agency’s Earth Observation for access to earth observation datasets.
Once the climate data were collected, the next step was to gather data required for computing the adaptive capacity for the different countries of Africa. Since adaptive capacity is difficult to measure, this work has based its evaluation of adaptive capacity on essential proxies of adaptive capacity. Adaptive capacity is the ability of a system, farmers, or people, in general, to cope with climate stressors or shocks such as declining precipitation and rising temperatures and their resulting impacts [13]. A region with a higher adaptive capacity cas often be termed a region with higher readiness for adaptation because there is an inbuilt capacity to adjust and cope with climate stressors [23]. Therefore, for this work, we selected two proxies of adaptive capacity, which are literacy and poverty rates. We believe that these proxies are pertinent. Indeed, literacy rates used here represent the ability of the people to read, write, and therefore understand climate-related information or communications. It is evident that when people are literate, they are more likely to understand climate-related information and use it to adapt or cope when events of climate stress are reported. On the other hand, less literate people may lack the understanding and ability to apply climate-related information and communications in their adaptation decisions [24]. On the other hand, poverty rates are used here to represent the ability of the people concerned to adjust to climate stressors by obtaining alternative means of sustenance. Here, the poverty rate is based on household income. In other words, when poverty rates are high, farmers are less likely to cope and adapt by purchasing high-yielding varieties, investing in irrigation, or other farm inputs that can increase resilience [25]. Across Africa, these two proxies are very important representations of adaptive capacity because many other potential proxies are affected by these two proxies. This implies that changes in poverty and literacy rates are likely to impact the ability of different systems and people to cope and adjust to climate stressors [13]. This is because when you enhance literacy rates and reduce poverty in a continent where agriculture employs more than 65% of the population, people are more likely to witness increased resilience and adaptive capacity. The literacy and poverty rates time-series historical data for the period 1991–2016 for this study were collected from the World Bank: https://data.worldbank.org/indicator/SE.ADT.LITR.ZS?locations=DZ (accessed on 12 March 2021) [22] and from Macro Trends: https://www.macrotrends.net/countries/GHA/ghana/literacy–rate (accessed on 11 March 2021) [26].
From the data collection phase above, this work has created two types of data, one for climate and another for proxies of adaptive capacity. The climate data are precipitation and temperature, while the adaptive capacity proxies are poverty and literacy rates. All these data sets run from 1991 to 2016. However, it is essential to note that for some years, the adaptive capacity data were incomplete. To complete the range, we used the linear interpolation approach to estimate the missing data. Figure 1 below summarizes the methodological procedures that have been used to compute and analyze the data used in this study.
In summary, four main data types were used in this work. These include time-series data for 1991–2016 for each country in Africa’s various regions: North Africa, West Africa, East Africa, Middle Africa, and Southern Africa (Table 1). The data were collected for each country from which the regional averages were computed. This included precipitation data in mm per month and year for the entire time-series period. Graphs over time for the precipitation data for each region have also been drawn. The next type of data was temperature data in º C. Here also, a graph of the trends in temperature over time was drawn. In addition to the climate data, this work also included adaptive capacity proxies such as literacy rates and poverty rates in %. Graphs of the trends in these two proxies are also included. In addition, the data set also includes the first-ever maps of the spatial variations in the readiness index (ClimAdaptCap Index), the literacy and poverty rates across Africa. The data records described here are stored in figshare and are accessible through the following link: https://figshare.com/articles/dataset/Readiness_Index_Dataset_xlsx/16550109 (accessed on 31 August 2021) [27].

2.2. Data Analysis

The data analyses were performed using excel 2016 and IBM SPSS version 15. These software have inbuilt options for the calculation of most descriptive and inferential statistics. All the equations in this work were thus calibrated and written in excel and SPSS, from which the data variables were imported to come out with the results. Below, this work presents step-by-step details on how the data were analyzed (Figure 1).

2.2.1. Linear Interpolation

The linear interpolation method is often used to estimate the unknown values or missing data through the known values or available data.
Ylrpr = y1 + ((x − x1)/(x2 − x1)) × (y2 − y1)
where Ylrpr represents the unknown values or missing data for literacy and poverty rates, x represents the known values of literacy and poverty rates, x1 and y1 are the coordinates that are below the known x value, and x2 and y2 are the coordinates that are above the known x value.
Once linear interpolation was finalized, a complete data set for poverty and literacy rates was obtained from 1991 to 2016. Data for these two variables were mainly missing from 1991 to 1994 for most of the regions. It is important to note that this was performed for each region, country and a regional average for poverty and literacy rate (%) was computed (see online database).
The climate data were equally downloaded in the format of monthly precipitation and temperature for each country. A regional average was computed from these monthly and country-specific precipitation (mm) and temperature (°t) data. Since the goal is to assess readiness for climate change adaptation, it becomes necessary to normalize the regional monthly temperature and precipitation data to ease comparison.

2.2.2. Normalization of Data

This is a process of rescaling the data from the original to facilitate interpretation. Values are often within the range of 0–1. This is pertinent when using data that has input values and differing scales. In this study, we normalized temperature and precipitation data because they are in different scales and units of measurement. Normalization makes it easy for us to compare data that do not have the same scale and enhances the comparison of data that otherwise is not comparable due to differences in scale and units. It is also important to be able to identify the minimum and the maximum values. Normalization is computed as follows:
Ypt = (xptmin)/(maxmin)
where Ypt is the normalized output of precipitation or temperature, xpt is the average regional precipitation and temperature data to be normalized, max and min are the maximum and minimum average regional precipitation and temperature data of the time series.

2.2.3. Calibration of Readiness Index/ClimAdaptCap Index

Once the poverty and literacy rates data were subjected to linear interpolation to fill the gap of the missing data and the climate data were normalized. This investigation proceeded to develop an index called ‘’ClimAdaptCap Index’’. This index used both climate and adaptive capacity proxy data to determine the readiness of each region to climate change adaptation. This is the first time that this index is being developed and used to determine readiness for climate change adaptation in Africa. The uniqueness of this index is that it integrates both normalized temperature and precipitation data (climate score) and the adaptive capacity component through the proxies of the adaptive capacity (adaptive capacity score), which in this case are poverty and literacy rates. The only weakness of this index is that it uses only two proxies of adaptive capacity, which are poverty and literacy rates. It is, however, true that there are other proxies of adaptive capacity, but in the case of the African continent, these two proxies are very representative of the reality of the African continent. In addition, this index was developed within the frames of the African continent and therefore meant to test the readiness of African countries and regions to climate change adaptation. This index is scored on a scale of −1 to 1, and the higher the score, the higher the level of readiness for climate change adaptation. The weighting of all the indicators is equal, and this approach facilitates comparison and integration. The calibrated equation used to compute this index is given as follows:
ClimAdaptCap Index   =   1 + N t + 1 + N p p t + 10 2 P r 10 2 + L r 10 2 / 10
where ClimAdaptCap Index is the readiness Index for climate change adaptation, 1 is a constant that the maximum ClimAdaptCap Index is 1, Nt is the normalized average regional temperature, Nppt is the normalized average regional precipitation. The first part of the equation denotes the climate score. For the adaptive capacity score, Pr is the poverty rate, Lr is the literacy rate, and 102 denotes the fact that these proxies are expressed in percentages.

3. Results

3.1. Recent Climate Trends across Africa

Since this work aims at assessing Africa’s readiness for climate change adaptation, it sets off by exploring the historical climate data. When the precipitation trends over 1991–2016 are observed over Africa, West Africa witnesses higher mean monthly/annual rainfall over the period covered by the data. Middle Africa and Southern Africa follow this. The region with the lowest monthly/annual rainfall across Africa is North Africa, followed by East Africa (Figure 2a).
In terms of temperatures, North Africa, with the lowest precipitation, has the highest temperatures. West Africa and East Africa follow this with the second and third highest temperatures, respectively. In Southern Africa, the recorded average rainfall has the lowest temperatures compared to all the other regions of Africa (Figure 2b). From these analyses, it can be observed that the region with the lowest rainfall (North Africa) equally records the highest temperatures. West Africa, with the highest rainfall equally, records the second-highest temperature followed by Middle Africa. In addition, Southern Africa records median rainfall throughout the series and records the lowest temperatures compared to all the other regions. Interestingly, these results show that since the 1990s, rainfall has increased across most of the Sahel of Africa, over which most of the countries that constitute West Africa belong. On the other hand, North Africa continues to experience mainly higher temperatures and declining precipitations.

3.2. Recent Literacy and Poverty Rates across Africa

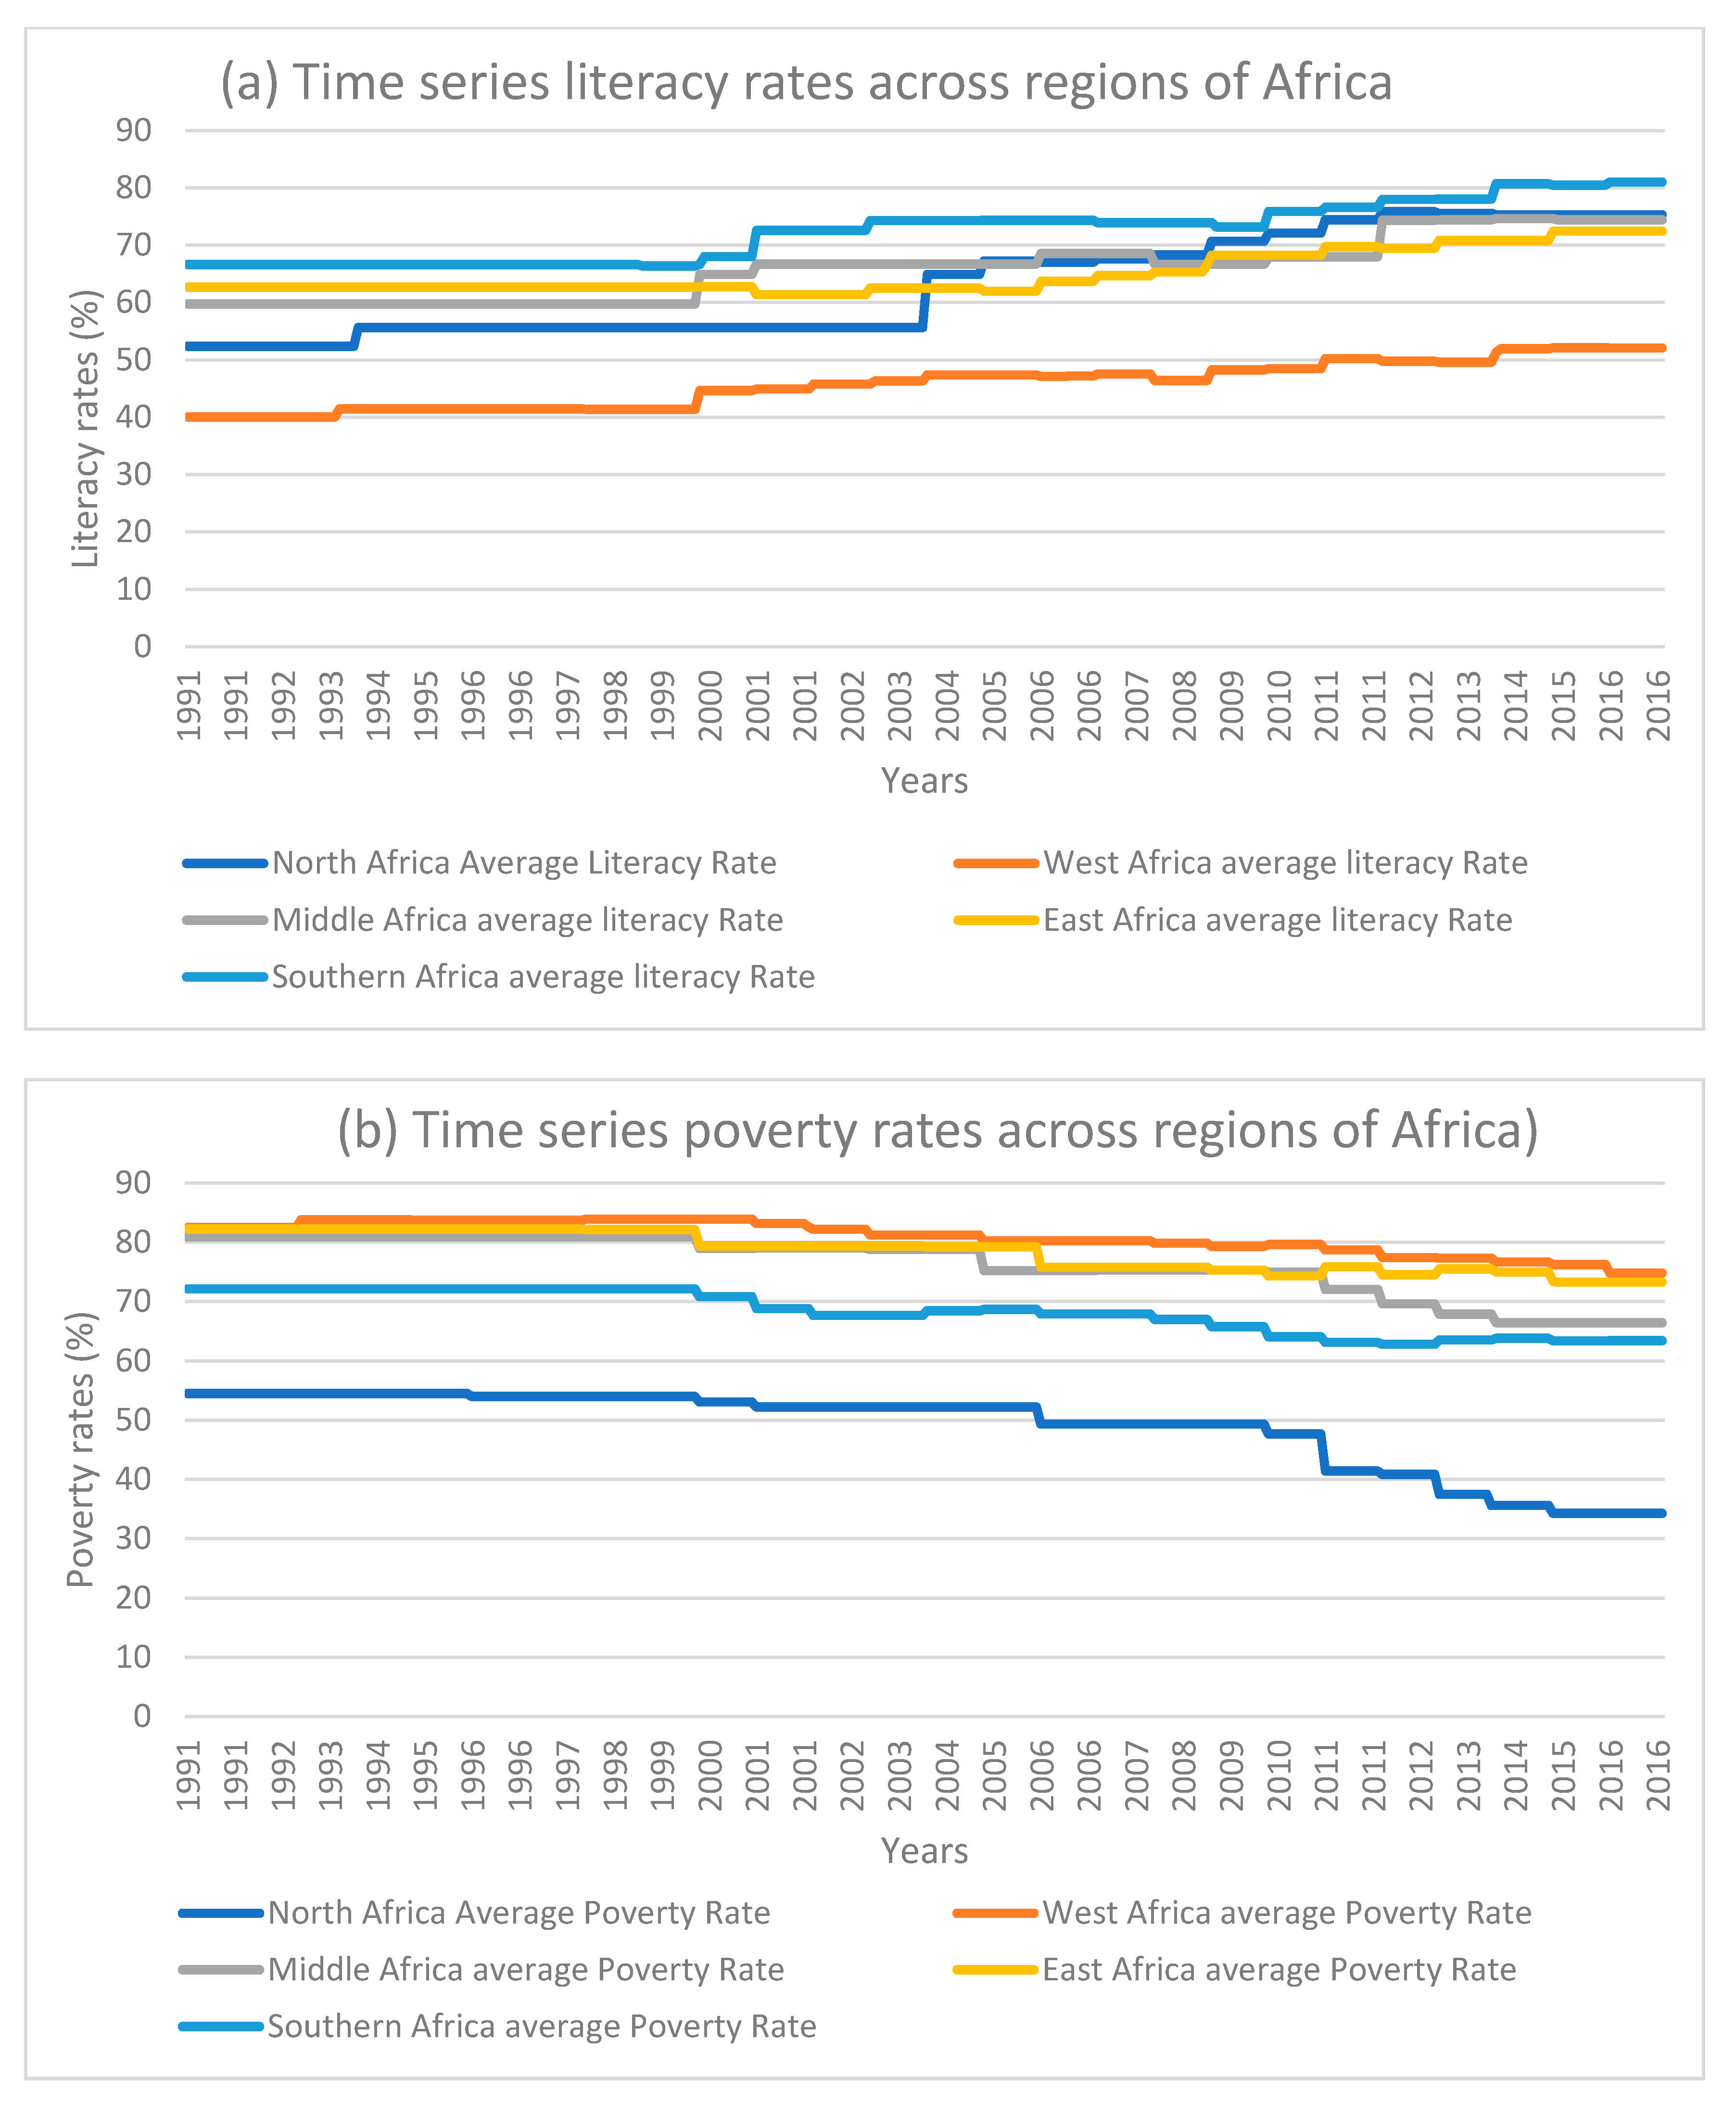
In the context of literacy rates, this work has found that between 1991 and 2016, Southern Africa recorded the highest literacy rates compared to other regions of Africa, followed by North Africa. For this same period, the regions with the lowest literacy level were West Africa and East Africa in order of importance, respectively (Figure 3a). This work has found out that West Africa has the highest poverty levels, followed by East Africa. On the other hand, North Africa recorded the lowest poverty levels, followed by Southern Africa (Figure 3b). The interesting observations here are that, while the literacy rate increased for all the regions between 1991 and 2016, the poverty rate decreased. Southern Africa recorded the highest literacy rates throughout the series, while West Africa recorded the lowest literacy rate. North Africa recorded the second-lowest literacy rates up to the early 2000s but stabilized at the second position after that. In addition, West Africa had the prevailing poverty rate throughout the series, while North Africa recorded the lowest poverty rate. Southern Africa also recorded the second-lowest poverty rate throughout the series. In a nutshell, the regions with the highest literacy rates (Southern Africa and North Africa) are equally the regions with the lowest poverty rates. In addition, the regions with the lowest literacy rates (West Africa and East Africa) are equally the regions with the highest poverty rates.

3.3. Readiness for Climate Change Adaptation across Africa

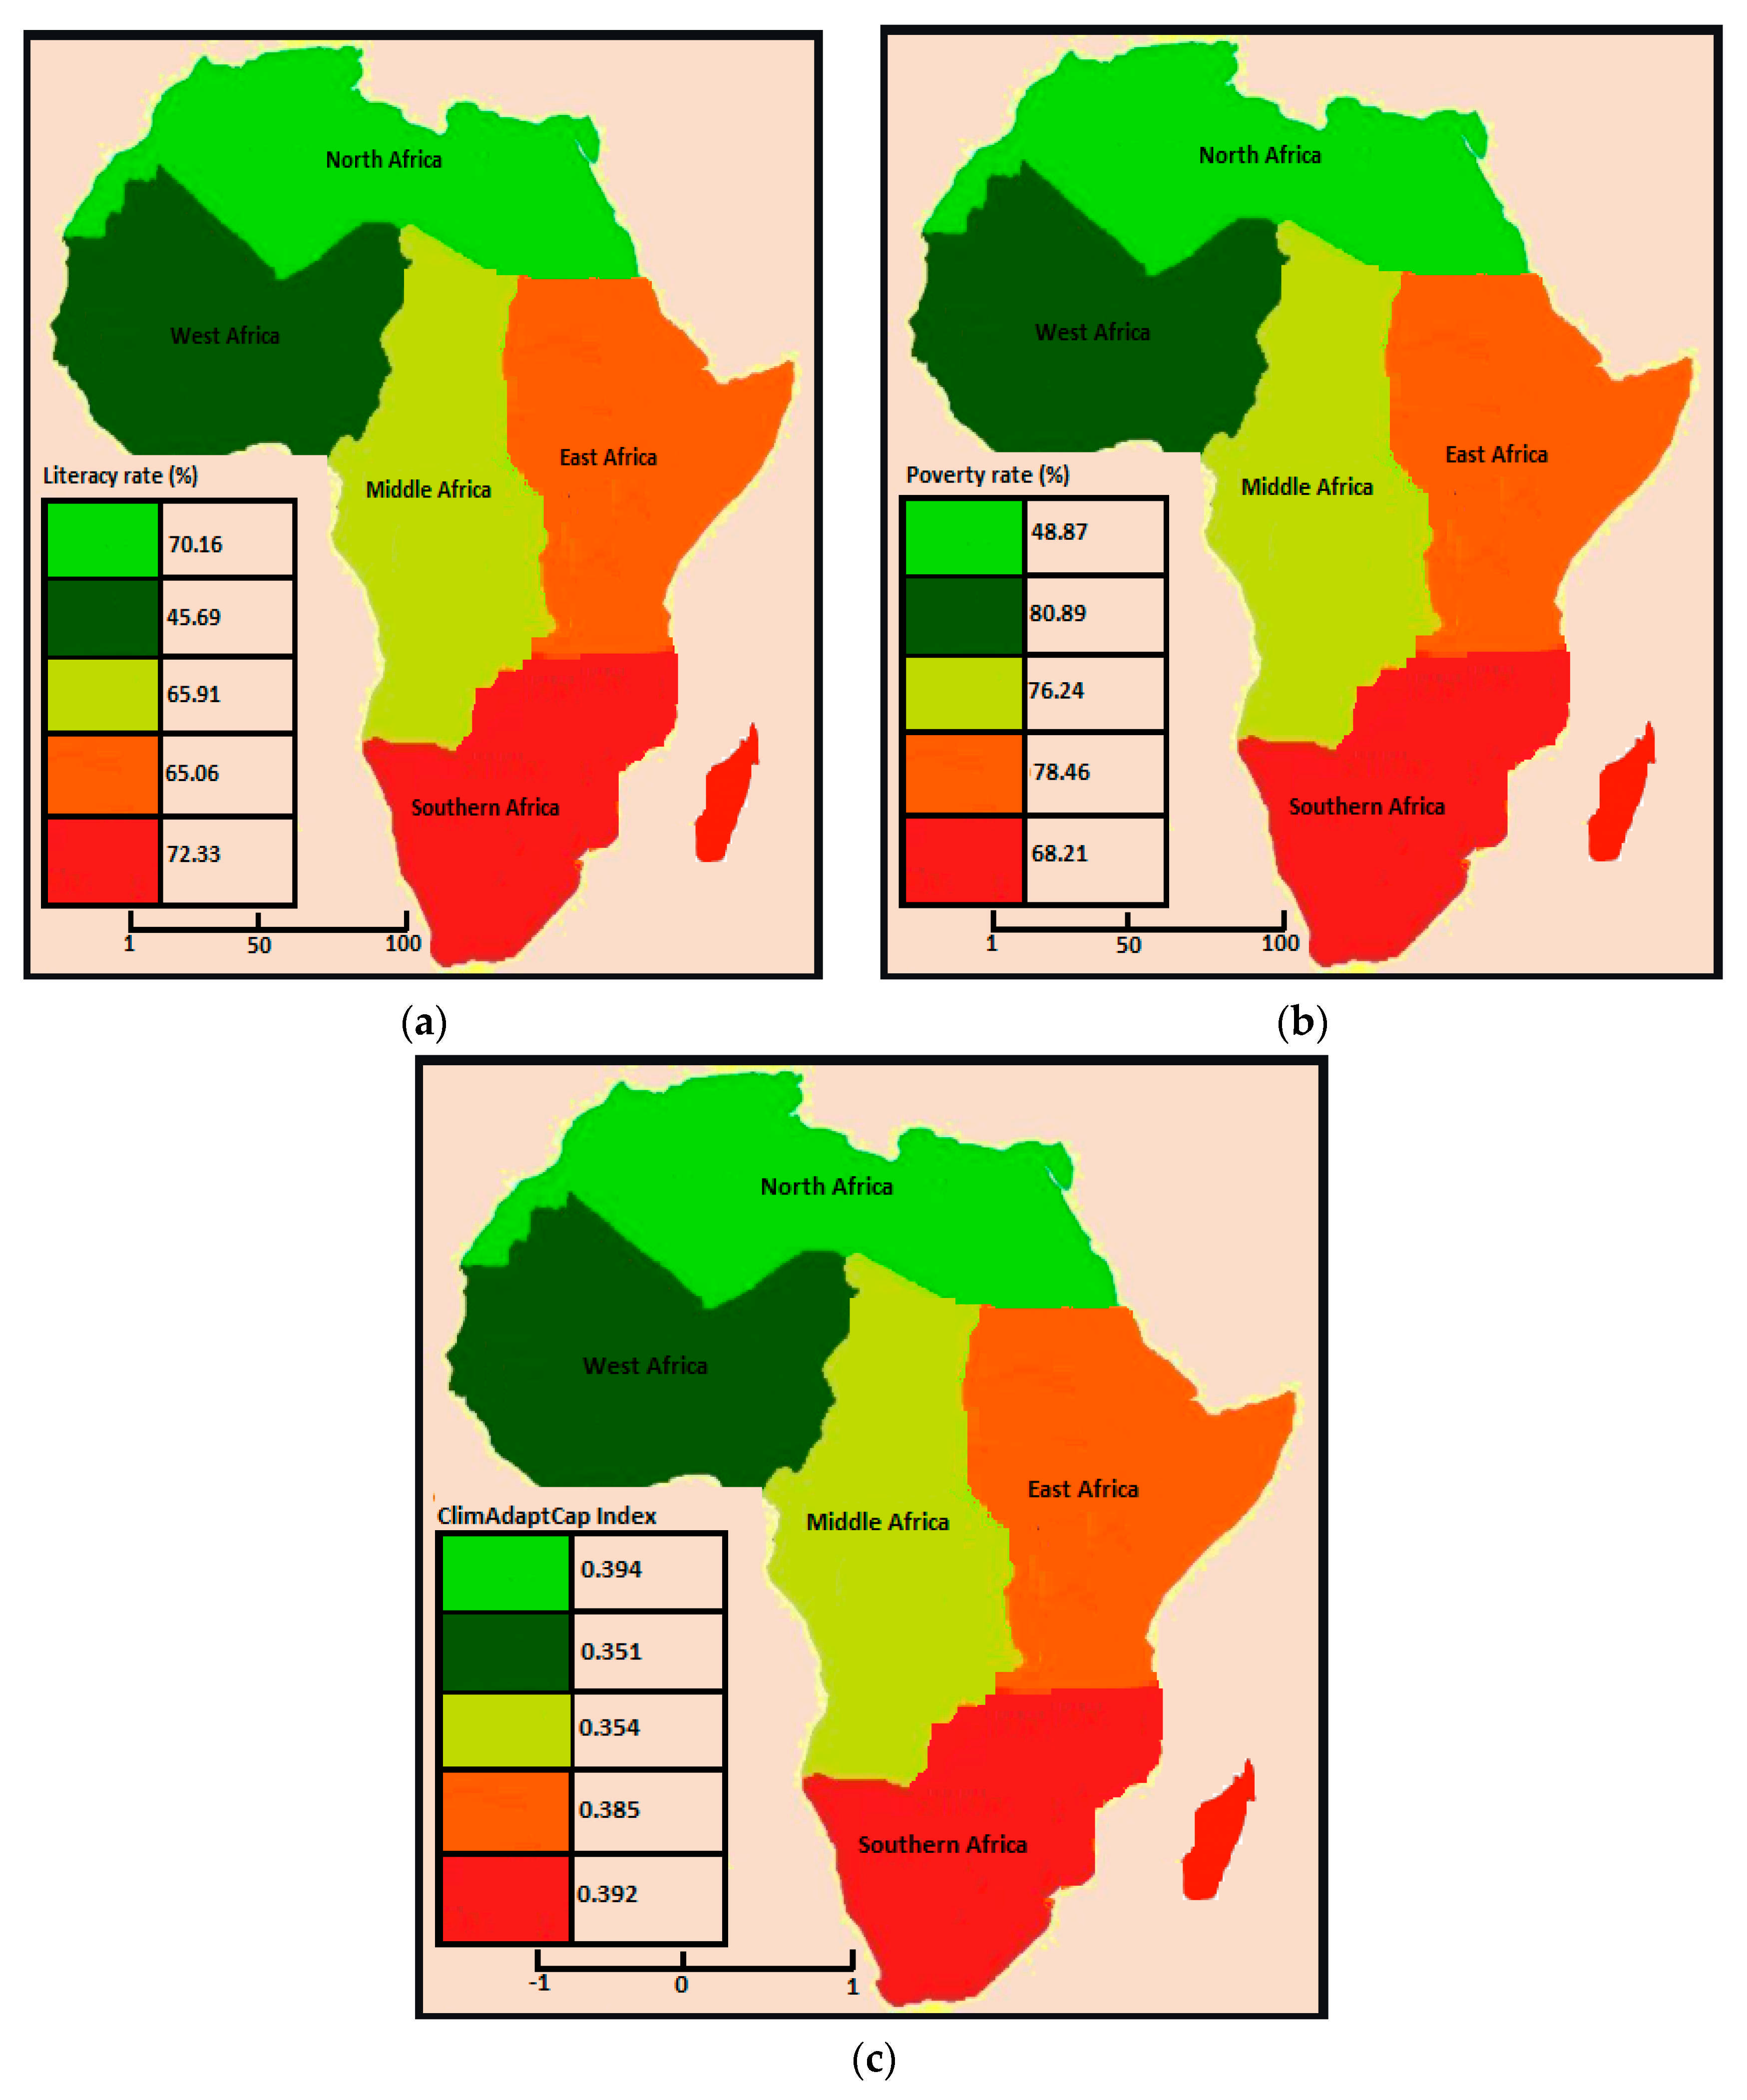
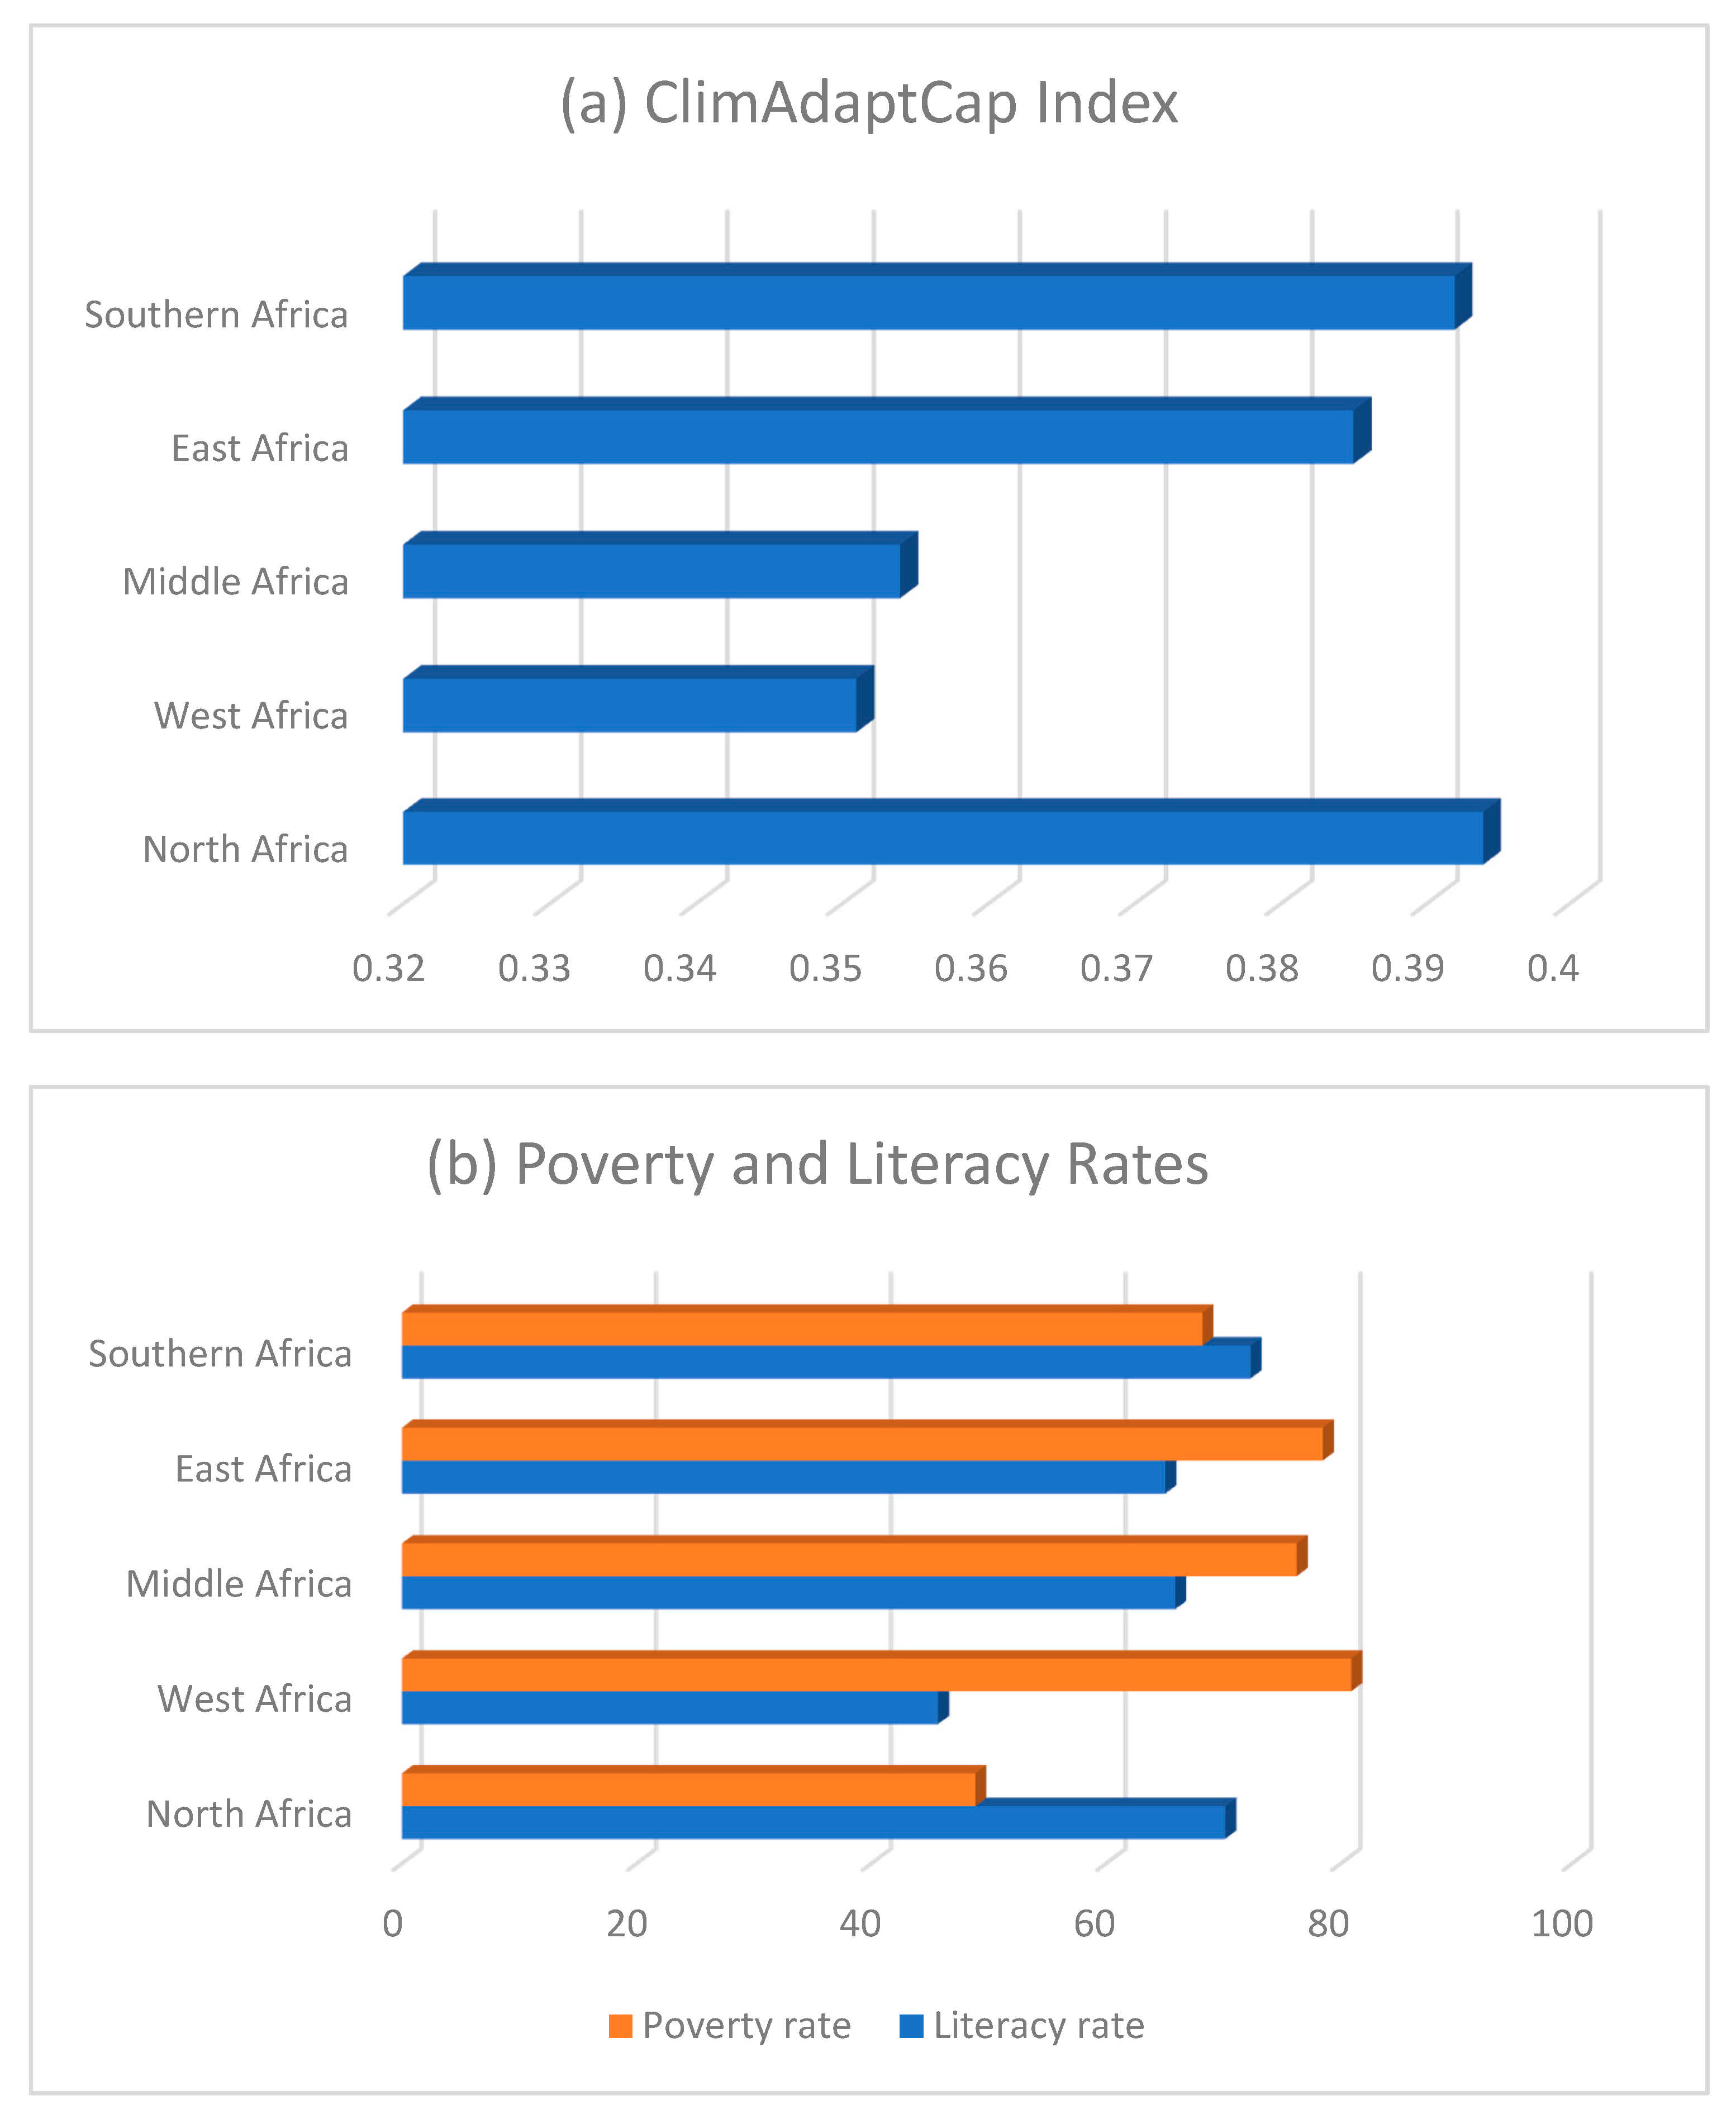
The readiness for climate change adaptation across Africa has been assessed by a newly parametrized index called ClimAdaptCap Index. The index is based on two scores, which are the climate score and the adaptive capacity score. The initial results show that North Africa had the highest ClimAdaptCap Index of about 0.394 and therefore is the readiest region in terms of climate change adaptation. This is followed by Southern Africa, which recorded a ClimAdapCap Index of 0.392. The region with the lowest ClimAdaptCap Index is West Africa, with an index of 0.351, implying a lower readiness for climate change adaptation. The second-lowest index is recorded in Middle Africa with a value of 0.3354 (Figure 4a–c).
Interestingly, North Africa, which had the highest ClimAdaptCap Index of 0.394, also had the lowest poverty rate of 48.87% and the second-highest literacy rate of 70.16% (Figure 3b). With the second-highest ClimAdaptCap Index of 0.392, Southern Africa records the second-lowest poverty rate of 68.21% (Figure 5b) and the highest literacy rate of 72.33% (Figure 5b). West Africa had the lowest ClimAdaptCap Index of 0.351, the highest poverty rate of 80.89%, and the lowest literacy rate of 45.69% (Figure 4a–c and Figure 5a,b). In general, these results have shown that the regions with higher ClimAdaptCap Indexes equally have higher literacy rates and lower poverty rates, while those with lower ClimAdaptCap Indexes equally have lower literacy rates and higher poverty rates. In the context of these results, it can then be concluded that North Africa and Southern Africa are the readiest regions for climate change adaptation. The least ready regions are West Africa and Middle Africa. Readiness for climate change adaptation is not often dependent only on the intensity of the climate forcing. This is seen as West Africa, which is witnessing increasing precipitation, is the least ready, while North Africa, with the highest temperatures and lowest precipitation, is the readiest region. However, being that the readiest region, which is North Africa, has a ClimAdaptCap Index of 0.394, the overall understanding is that change adaptation is still at a low rate for Africa in general, being that the scale range for this index is from -1 to 1 and the simulated index for North Africa is below the 0.50 mark.

4. Discussion

The results from this study have shown that West and Middle Africa have recorded increasing rainfall amounts since the 1990s, and, therefore, they are getting wetter and greener. These findings are consistent with several other previous observations across Africa. For example, Nicholson [28] used rainfall and atmospheric circulation to conclude that the years after the droughts that hit Africa in the 1970s and early 1980s witnessed increased rainfall in West Africa. The latter has been further consistent with another study by Nicholson [29]. Bichet and Diedhiou [30] noted further that the West African Sahel region extending to the Middle of Africa has become wetter during the last 30 years, with dry spells that are shorter and more frequent. Therefore, in addition to the region getting wetter and greener, dry spells are also a common phenomenon which impacts the distribution of rainfall. This is realistic as this study observed that in addition to having more rainfall, this region also records the second-highest temperatures across Africa. In addition, Herrmann and Tappan [31] have observed that the increased rainfall in the West African region of Central Senegal has resulted in improved greening of the landscape. They, however, argued that despite this impoverishment, the vegetation is generally impoverished due to high temperatures. Several other authors have had observations that are consistent with those of this current study as follows. Herrmann and Anyamba [32] and Ibrahim et al. [33] used NDIV as a proxy of greening and precipitation to show that most of the Sahel of West Africa began witnessing a positive correlation between these two variables since the 1990s following the end of the major drought era that affected most of Africa. The increased wetter conditions in West Africa are creating opportunities for new farming systems in this wetter tropical area [34]. In the context of future projections, Vizy et al. [35] have observed that projections of a wetter Sahel in the twenty-first century are likely to continue based on global and regional models. In attempting to explain the increased greening of the Sahel, Olsson et al. [36] add that increased rainfall in most of the Sahel after the 1990s, as well as increased land use management and the aerial fertilization effect of effect of atmospheric carbon dioxide, might be playing a role in the new greening trends observed in the Sahel. The result that Southern Africa is also witnessing intermediate rainfall and low temperatures is also consistent with the work of Johnson et al. [37], who argued that a progressively wetter climate has been observed in the Eastern parts of Southern Africa over the past 1.3 million years.
Furthermore, this work has further found that North Africa records the lowest rainfall amounts and highest temperatures across Africa. This finding is consistent with several previous studies. For example, Hazell et al. [38] note that the low rainfall areas of Africa are the Middle, East, and North Africa. Rowell et al. [39] note that the variability of summer rainfall over tropical North Africa from 1906 to 1992 shows declining precipitation and increasing temperatures in North Africa. Zittis [40] notes that precipitation and rainfall trends in East, Middle, and North Africa have been more dominant than other African regions. Precipitation in North Africa is likely to decrease between 10% and 20%, while temperatures are likely to rise between 2 and 3 °C by 2030. These trends are most pronounced in the Northwestern parts of Northern Africa (Schilling et al. [41]). Lelieveld et al. [42] support the results that North Africa has witnessed heat extremes in the 21st century. West and Middle Africa are witnessing increasing precipitation and temperatures, while North Africa is witnessing declining precipitation. Rising temperatures are valid, as several previous works have confirmed with similar observations.
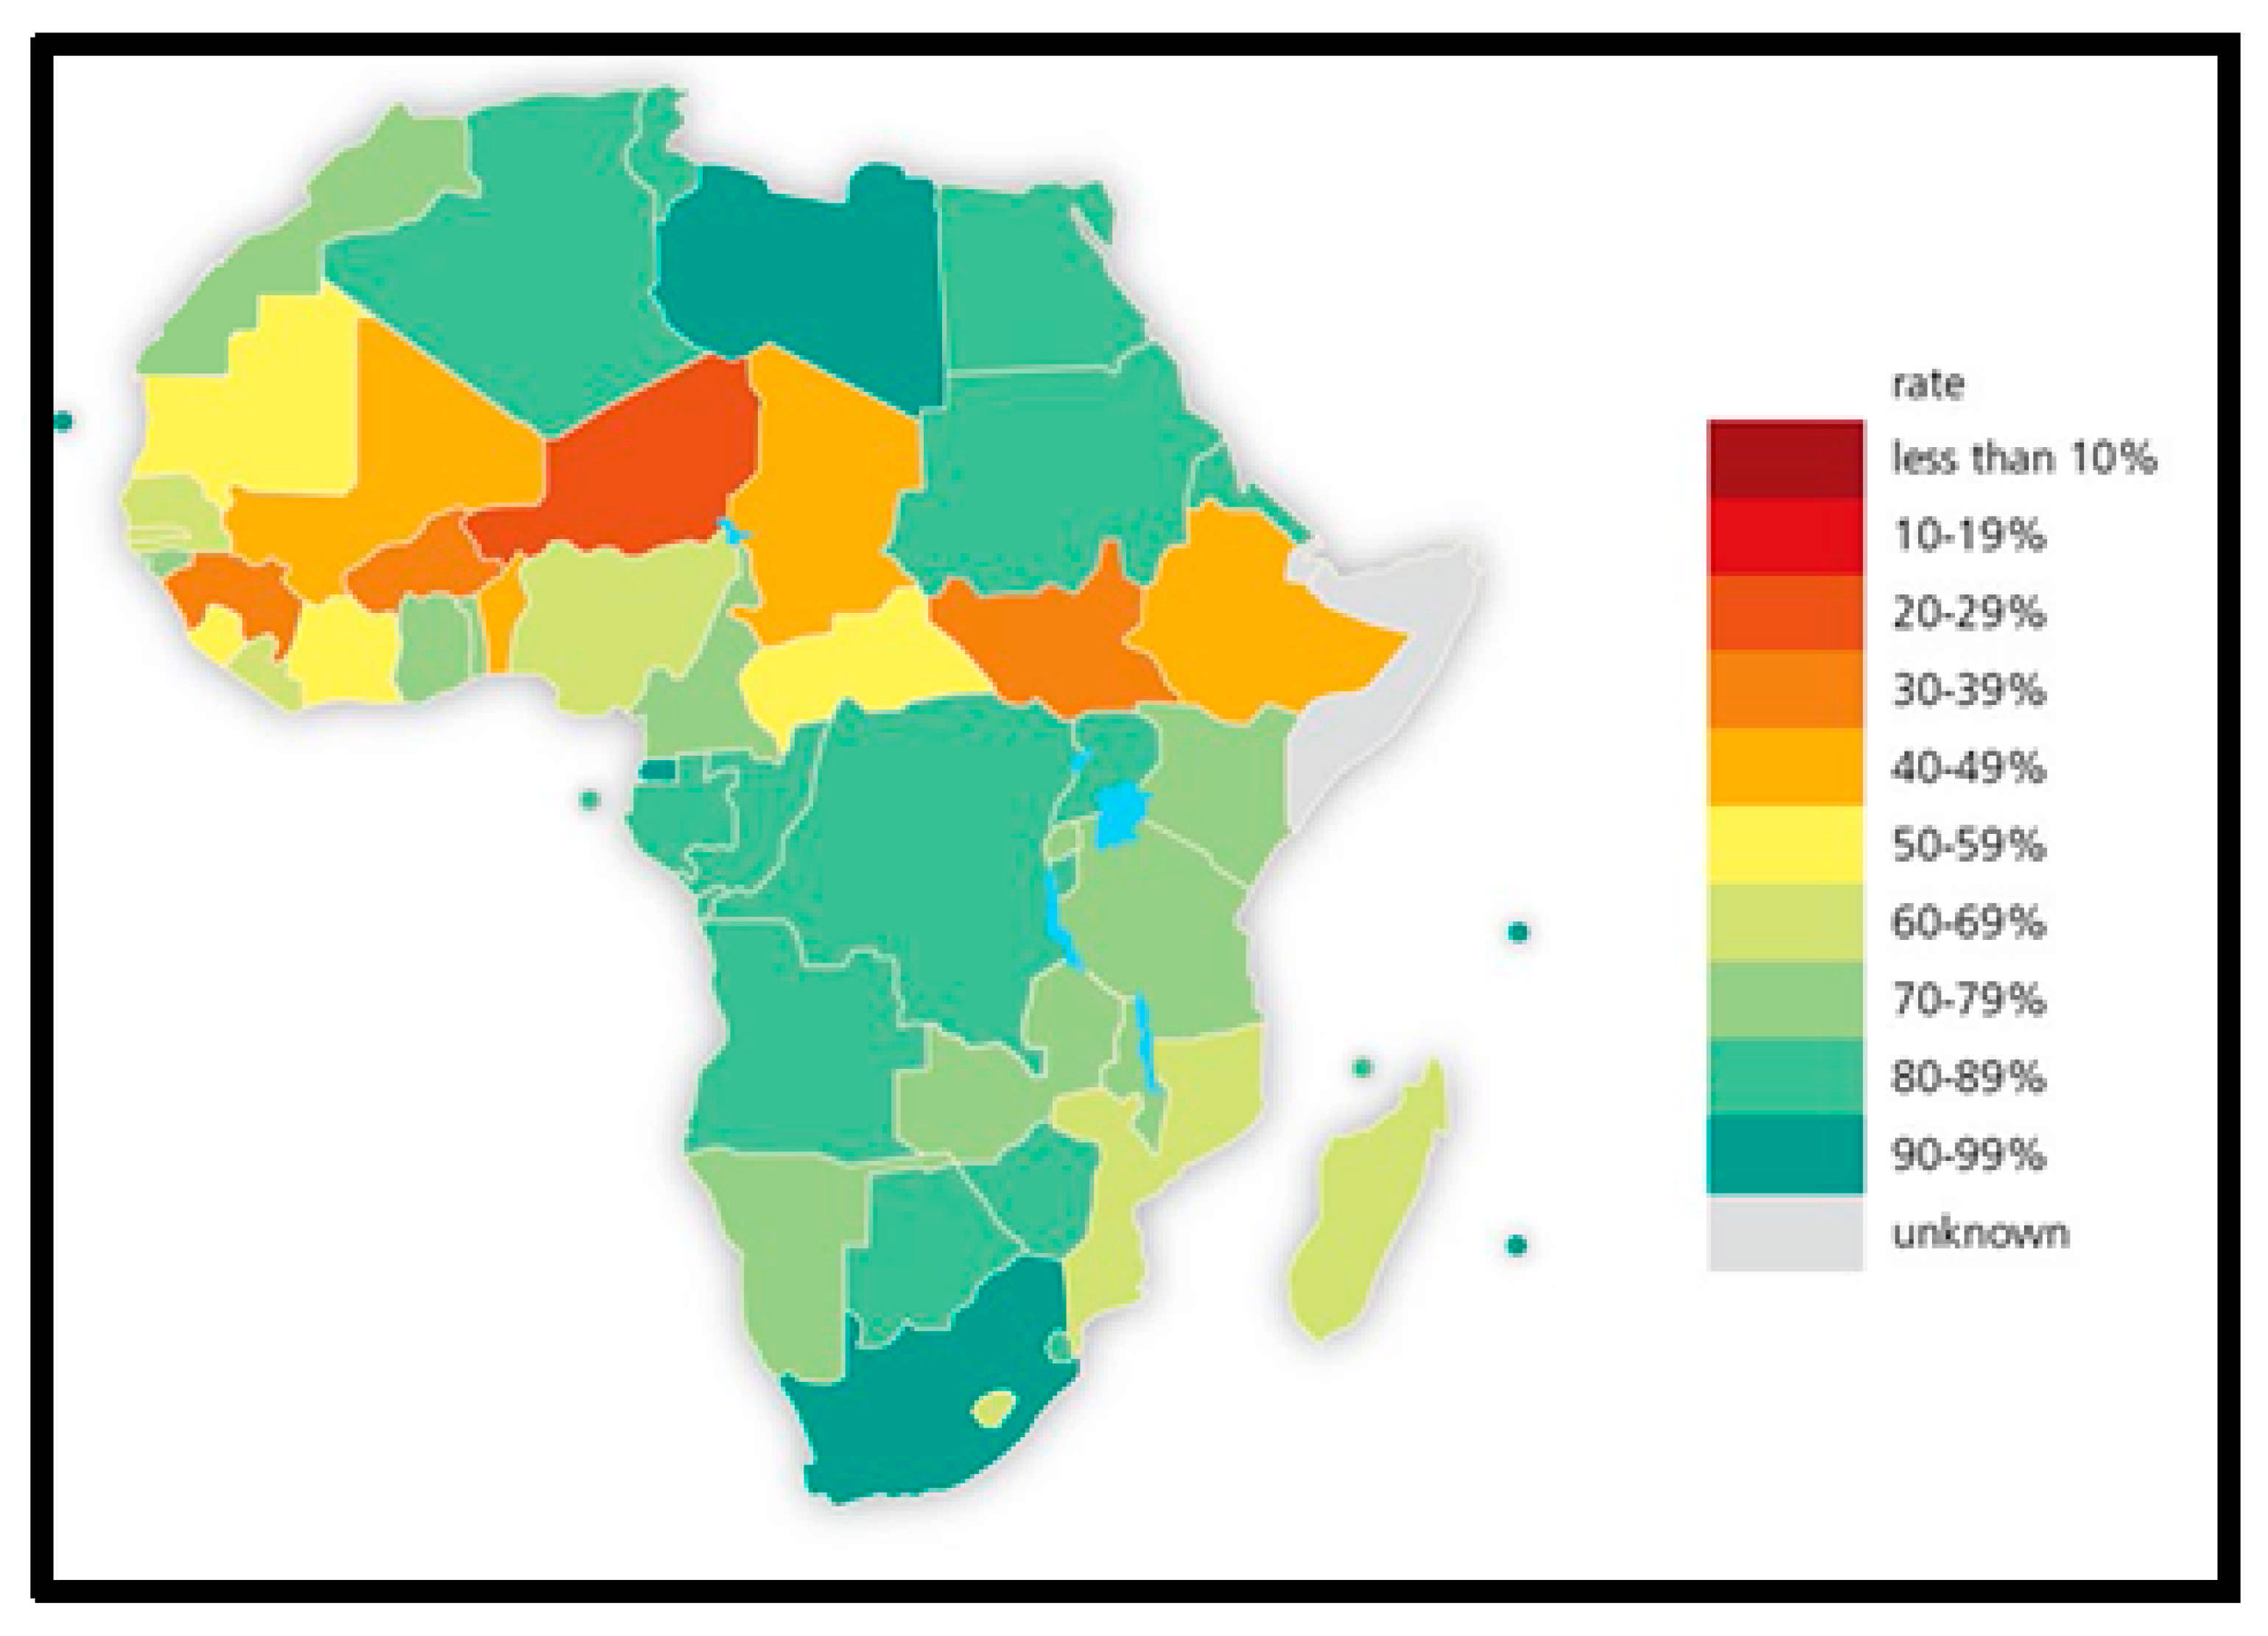
In terms of adaptive capacity, this work has shown that Southern Africa and North Africa have the highest literacy rates in importance, while West Africa has the lowest literacy rates. By implication, high literacy levels can be translated into higher access rates to primary education and, therefore, an ability to read or understand climate information or communications. Oomes et al. [43] have further confirmed the results of this current study by observing that across Africa, the regions with the highest literacy rates are around Southern and North Africa. As seen in Figure 6 below, the regions with the highest literacy rates are in green and fall with the sphere of influence of Southern and North Africa with rates between 80% and 99%. This viewpoint has also been supported by the authors of [44,45].
On the other hand, West Africa, Central Africa, and East Africa are essentially represented in yellow and brown in Figure 6, representing literacy rates of a maximum of 59%. Therefore, Southern and North Africa have the most literate populations in Africa is vital as it translates into a higher adaptive capacity in terms of their ability to read, understand, and apply climate-related information. For example, if there is news on changes in planting dates over the news media, literate people will comprehend that information and act accordingly by changing their planting dates. This partly justifies why Southern and Northern Africa record higher readiness for climate change adaptation through the ClimAdaptCap Index. According to Akkari [46], North Africa has a literacy rate of about 70% higher than sub-Saharan Africa because the region has reduced enrollment gaps and completion rates far more successfully than sub-Saharan. In the context of West Africa, Obikili [47] reports that the persistently low rates of literacy are an inheritance of colonization and slavery and that in the face of climate shocks, West Africa is less likely to adapt when climate information dissemination is the focus as people who are less educated are less likely to be able to understand climate-related information and implement climate-smart principles.
In terms of poverty rates, this work has found that West Africa has the highest rates while North and Southern Africa have the lowest poverty rates. These results are generally consistent as the regions with the lowest poverty rates, such as North and Southern Africa, equally have the highest literacy rates. West Africa, with the highest poverty rate, equally has the lowest literacy rate. These results are very consistent with reports from the World Bank Group [47], which holds that in terms of the dollar amount spent per day, North Africa has the lowest poverty rates (0.1–5%) across Africa, followed by Southern Africa (15–25%). West Africa has 5–75% of its population living in poverty. Poverty significantly affects readiness for climate change adaptation. When poverty is high, the people are less capable of coping by either adopting alternative livelihood means or diversifying their livelihood or better purchasing high-yielding varieties, irrigation systems, pesticides, fertilizers, etc., investing in farm technologies.
Even though these proxies are very representative representations of adaptive capacity in Africa and validate the assertion that low poverty rates and high literacy rates are linked to higher readiness for climate change adaptation, however, this should be viewed with caution as several other proxies affect readiness for climate change adaptation, such as health and nutritional status, physical infrastructure, governance and democracy, geographic and demographic factors, agriculture, type of ecosystem, technological capacity, and economic welling and inequality [48]. Despite these, it is crucial to observe that the two proxies selected for this current study cut across all other proxies, and to avoid collinearity, we focus on these two proxies. In their assessment of a framework for climate change adaptation, Ford and King [28] note that adaptation readiness captures adaptive capacity, which exhibits the strength and existence of governance and policy structures that are responsible for whether adaptation is taking place or not. The drivers of adaptive capacity identified in the latter study create an environment suitable for adaptation, and indeed, they affect the two proxies identified in this study. For example, governance and policies play an essential role in people’s poverty and literacy rates as safety nets put in place by the government through investments in education and poverty alleviation can invariably impact society’s readiness for climate change adaptation. Khan and Amelie [16] also used a similar approach in which they examined governance mechanisms and policy processes that could contribute to joint adaptation and economic planning, leadership, institutional mechanisms, science-policy nexus, decision-making structures, stakeholder involvement, and technological innovation.
An important observation from this study is that the readiness/ClimAdaptCap Index ranges from around 0.35–0.39, indicating that there is a very slight variation in the index. In addition, the level of readiness is generally low for Africa. This is evident as the regions that perform best such as North and Southern Africa, record scores of about 0.39 when compared to a maximum possible score of 1. This low variation between regions and the generally low performance in the context of readiness across Africa is an indication that adaptation efforts need to be enhanced across Africa. In addition, West Africa records the lowest readiness scores in Africa, and among other things, this can be explained by the fact that this region witnesses some of the highest rates of deforestation in Africa. In the presence of high temperatures and low precipitation levels, North Africa still records the highest scores, and this is partly explained by the relatively higher literacy rates and lower poverty rates.
The readiness index for climate change adaptation (ClimAdaptCap Index) developed by this investigation was developed mainly to evaluate and assess readiness for climate change adaptation within an African context. However, a major advantage that it has is that it can be adjusted to the realities of other regions of the world. The proxies of adaptive capacity might not be the same for non-African regions. The strength of this index is that it can integrate any adaptive capacity proxy. In fact, this index is known for its ability to simulate readiness based on any climatic and socioeconomic variables of interest under a given condition. The ability of the index to simulate both climatic and non-climatic variables brings the results very close to reality as often people are adapting to climate change. This new index will play a major role in adaptation mapping in Africa and in other parts of the world. This is evident as it provides an opportunity for various stakeholders to have discussions around the different options that can be used to enhance adaptive capacity and, therefore, readiness across Africa. The weaknesses of the index are that it focuses on only four indicators of readiness (precipitation, temperature, literacy, and poverty rates), all the indicators have equal weighting, and a plethora of several other potential indicators exist but cannot be used due to the difficulties associated with the quantification of proxies of adaptive capacity and the absence of reliable data. Most of the climate data used are based on major well-known climate data repositories such as the World Bank Climate Portal, which is informed by the CIMIP5 modeling initiatives. The absence of adequate real-time, reliable weather station data across Africa is also an issue. However, this work has made great strides in interpolating missing data and in using alternative data sources as well as proxies of adaptive capacity. This index has shown that climatic stressors are important, but building resilience will not only be based on the magnitude of these stressors but, most importantly, on the degree of readiness. Therefore, identifying key readiness indicators across different countries and simulating them using this approach or developing others is key for the future of climate change adaptation.

5. Conclusions

This study has shown that countries with higher literacy rates and lower poverty rates are likely to be more ready for climate change adaptation than those with lower literacy rates and higher poverty rates. In the context of Africa, North Africa and Southern Africa record the highest ClimAdaptCap Indexes while West Africa records the lowest. The higher ClimAdaptCap Indexes are associated with lower poverty rates and higher literacy rates and, therefore, potentially greater readiness for climate change adaptation. However, though this study focuses only on temperature, rainfall, and two proxies of adaptive capacity (literacy and poverty rates), it is important to argue that there are likely several other proxies of adaptive capacity. Despite this, through ground-truthing, this study observes that the two proxies used here are transversal and cut across the other proxies. The ClimAdaptCap Index used in this study is complementary to other similar approaches that have been used to assess readiness for adaptation, such as those proposed by Ford and King [25] and Khan and Amelie [12], focusing on frameworks for examining adaptation readiness and ecosystem-based adaptation for climate change readiness. However, the difference between this current approach and the two other previous approaches is that they both focus on the role of broad governance and policy regimes such as institutional and leadership mechanisms, access to technology, funding, and stakeholder aspects to develop frameworks for readiness while our study focuses on creating the readiness index as well as testing it across Africa. As stated earlier, the main weaknesses of this work are the difficulty associated with the measurement of readiness for climate change adaptation, for which there are ubiquitous number of indicators. Therefore, selecting indicators and proxies that are representative is very important. Secondly, the historical data spans the period 1991–2016 only while some of the proxy-based data were incomplete and therefore estimated mainly through linear interpolation. In the future, it will be necessary to test this index over individual African countries to see how readiness can be simulated at much finer scales; in addition, it could be vital to introduce other proxies of readiness and adaptive capacities such as soil types, soil texture, soil parent material and land use cover to verify whether the index will change or remain the same and finally, the use of time-series data that spans over several years beyond the range of this study and projections of likely future trends of readiness will go a long way to enhance monitoring.

Supplementary Materials

These are available on the data availability link on figshare below as well as attached as supplementary materials to this paper https://www.mdpi.com/article/10.3390/app11209413/s1.

Author Contributions

Conceptualization, T.E.E.; methodology, T.E.E.; software, T.E.E.; validation, T.E.E., A.C. and D.D.; formal analysis, T.E.E.; investigation, T.E.E.; resources, A.C.; data curation, T.E.E.; writing—original draft preparation, T.E.E. and M.W.M.; writing—review and editing, M.W.M.; visualization, D.D.; supervision, A.C.; project administration, T.E.E. and A.C.; funding acquisition, T.E.E. All authors have read and agreed to the published version of the manuscript.

Funding

This research was funded by Mohammed VI Polytechnic University, startup grant to professors.

Institutional Review Board Statement

Not Applicable.

Informed Consent Statement

Not Applicable.

Data Availability Statement

The data records described here are stored in figshare and is accessible through the following link: https://figshare.com/articles/dataset/Readiness_Index_Dataset_xlsx/16550109 accessed on 12 March 2021 [27] as well as in the supplementary materials section.

Acknowledgments

The authors would like to thank Mohammed VI Polytechnic University for providing the funding that led to the realization of this work. Thanks also go to all the authors whose works we have cited.

Conflicts of Interest

The authors declare no conflict of interest.

References

  1. New, G.M.; Hewitson, B.; Stephenson, D.B.; Tsiga, A.; Kruger, A.; Manhique, A.; Gomez, B.; Coelho, C.A.S.; Masisi, N.D.; Kululanga, E.; et al. Evidence of trends in daily climate extremes over southern and west Africa. J. Geophys. Res. D Atmos. 2016, 111, D14102. [Google Scholar] [CrossRef]
  2. Niang, I.; Ruppel, O.C.; Abdrabo, M.A.; Essel, A.; Lennard, C.; Padgham, J.; Urquhart, P. Africa. Climate Change 2014: Impacts, Adaptation, and Vulnerability. Part B: Regional Aspects. In Contribution of Working Group II to the Fifth Assessment Report of the Intergovernmental Panel on Climate Change; Barros, V.R., Field, C.B., Dokken, D.J., Mastrandrea, M.D., Mach, K.J., Bilir, T.E., Chatterjee, M., Ebi, K.L., Estrada, Y.O., Genova, R.C., et al., Eds.; Cambridge University Press: Cambridge, UK; New York, NY, USA, 2014; pp. 1199–1265. Available online: https://www.ipcc.ch/site/assets/uploads/2018/02/WGIIAR5-Chap22_FINAL.pdf (accessed on 12 August 2021).
  3. IPCC. Climate Change 2007: The Physical Science Basis. In Contribution of Working Group I to the Fourth Assessment Report of the Intergovernmental Panel on Climate Change; Solomon, S., Qin, D., Manning, M., Marquis, M., Averyt, K.B., Tignor, M., Miller, H., Chen, Z., Eds.; IPCC: Geneva, Switzerland; Cape Town, South Africa, 2007. [Google Scholar]
  4. James, R.; Washington, R. Changes in African temperature and precipitation associated with degrees of global warming. Clim. Chang. 2013, 117, 859–872. [Google Scholar] [CrossRef]
  5. Mora, C.F.; Frazier, A.G.; Longman, R.J.; Dacks, R.S.; Walton, M.M.; Tong, E.J.; Sanchez, J.J.; Kaiser, L.R.; Stender, Y.O.; Anderson, J.M.; et al. The projected timing of climate departure from recent variability. Nature 2013, 502, 183–187. [Google Scholar] [CrossRef]
  6. Benkenstein, A. Climate Change Adaptation Readiness: Lessons from the 2015/2016 El Niño for Climate Readiness in Southern Africa; JSTOR: New York, NY, USA, 2017. [Google Scholar]
  7. Biasutti, M.; Giannini, A. Robust Sahel drying in response to late 20th century forcings. Geophys. Res. Lett. 2006, 33, L11706. [Google Scholar] [CrossRef] [Green Version]
  8. Greene, A.M.; Giannini, A.; Zebiak, S.E. Drought return times in the Sahel: A question of attribution. Geophys. Res. Lett. 2009, 36, L12701. [Google Scholar] [CrossRef] [Green Version]
  9. IPCC. Climate Change 2014: Synthesis Report. In Contribution of Working Groups I, II and III to the Fifth Assessment Report of the Intergovernmental Panel on Climate Change; Pachauri, R.K., Meyer, L.A., Eds.; IPCC: Geneva, Switzerland, 2014; pp. 1–151. [Google Scholar]
  10. Collier, P.; Conway, G.; Venables, T. Climate change and Africa. Oxf. Rev. Econ. Policy 2008, 24, 337–353. [Google Scholar] [CrossRef]
  11. Toulmin, C. Climate Change in Africa; Zed Books Ltd.: London, UK, 2009. [Google Scholar]
  12. Khan, A.; Amelie, V. Assessing climate change readiness in Seychelles: Implications for ecosystem-based adaptation mainstreaming and marine spatial planning. Reg. Environ. Chang. 2015, 15, 721–733. [Google Scholar] [CrossRef]
  13. Simelton, E.; Fraser, E.D.G.; Termansen, M.; Foster, P.M.; Dougill, A.J. Typologies of crop-drought vulnerability: An empirical analysis of the socioeconomic factors that influence the sensitivity and resilience to drought of three major food crops in China (1961–2001). Environ. Sci. Policy 2009, 12, 438–452. [Google Scholar] [CrossRef]
  14. Epule, T.E.; Ford, J.D.; Lwasa, S.; Lepage, L. Vulnerability of maize yields to droughts in Uganda. Water 2017, 9, 181. [Google Scholar] [CrossRef] [Green Version]
  15. Department of Disaster Management, Office of the Prime Minister. The 2010–2011 Integrated Rainfall Variability Impacts, Needs Assessment and Drought Risk Management Strategy; Office of Prime Minster of Uganda: Kampala, Uganda, 2012.
  16. Herrmann, S.M.; Tappan, G.G. Vegetation impoverishment despite greening: A case study from central Senegal. J. Arid Environ. 2013, 90, 55–66. [Google Scholar] [CrossRef]
  17. Nhamo, G. Green economy readiness in South Africa: A focus on the national sphere of government. Int. J. Afr. Renaiss. Stud. Multi Inter. Transdiscipl. 2013, 8, 115–142. [Google Scholar] [CrossRef]
  18. World Bank Group. Indicators. 2021. Available online: https://data.worldbank.org/indicator/SE.ADT.LITR.ZS?locations=DZ (accessed on 11 March 2021).
  19. Nicholson, S.E. Rainfall and atmospheric circulation during drought periods and wetter years in West Africa. Mon. Weather Rev. 1981, 109, 2191–2208. [Google Scholar] [CrossRef] [Green Version]
  20. Tilleard, S.; Ford, J. Adaptation readiness and adaptive capacity of transboundary river basins. Clim. Chang. 2016, 137, 575–591. [Google Scholar] [CrossRef]
  21. Lwasa, S. Adapting urban areas in Africa to climate change: The case of Kampala. Curr. Opin. Environ. Sustain. 2010, 2, 166–171. [Google Scholar] [CrossRef]
  22. World Bank Group. Download Historical Data. 2021. Available online: https://climateknowledgeportal.worldbank.org (accessed on 12 March 2021).
  23. Epule, T.E.; New, M.G. Vulnerability of crop yields to variations in growing season precipitation in Uganda. SN Appl. Sci. 2019, 1, 1–13. [Google Scholar] [CrossRef] [Green Version]
  24. Antwi-Agyei, P.; Fraser, E.D.G.; Dougill, A.; Stringer, A.J.; Simelton, E. Mapping the vulnerability of crop production to drought in Ghana using rainfall, yield, and socioeconomic data. Appl. Geogr. 2012, 32, 324–334. [Google Scholar] [CrossRef]
  25. Sherman, M.; Ford, J.D. Market engagement and food insecurity after a climatic hazard. Glob. Food Sec. 2013, 2, 144–155. [Google Scholar] [CrossRef]
  26. Macro Trends. 2021. Available online: https://www.macrotrends.net/ (accessed on 11 March 2021).
  27. Epule, T.E. Readiness Index_Dataset.xlsx. Figshare. Dataset. 2021. Available online: https://figshare.com/articles/dataset/Readiness_Index_Dataset_xlsx/16550109 (accessed on 31 August 2021).
  28. Ford, J.D.; King, D. A framework for examining adaptation readiness. Mitig. Adapt. Strateg. Glob. Chang. 2015, 20, 505–526. [Google Scholar] [CrossRef]
  29. Nicholson, S.E. A multi-century history of drought and wetter conditions in Africa. Palgrave Handb. Clim. Hist. 2018, 225–236. [Google Scholar]
  30. Bichet, A.; Diedhiou, A. West African Sahel has become wetter during the last 30 years, but dry spells are shorter and more frequent. Clim. Res. 2018, 75, 155–162. [Google Scholar] [CrossRef] [Green Version]
  31. Herrmann, S.M.; Anyamba, A.; Tucker, C.J. Recent trends in vegetation dynamics in the African Sahel and their relationship to climate. Glob. Environ. Chang. 2005, 15, 394–404. [Google Scholar] [CrossRef]
  32. Ibrahim, Y.Z.; Balzter, H.; Kaduk, J.; Tucker, C.J. Land degradation assessment using residual trend analysis of GIMMS NDVI3g, soil moisture and rainfall in Sub-Saharan West Africa from 1982 to 2012. Remote Sens. 2015, 7, 5471–5494. [Google Scholar] [CrossRef] [Green Version]
  33. Juo, A.S.R. New farming systems development in the wetter tropics. Exp. Agric. 1989, 25, 145–163. [Google Scholar] [CrossRef]
  34. Vizy, E.K.; Cook, K.H.; Crétat, J.; Neupane, N. Projections of a wetter Sahel in the twenty-first century from global and regional models. J. Clim. 2013, 26, 4664–4687. [Google Scholar] [CrossRef]
  35. Olsson, L.; Eklundh, L.; Ardö, J. A recent greening of the Sahel—trends, patterns, and potential causes. J. Arid Environ. 2005, 63, 556–566. [Google Scholar] [CrossRef]
  36. Johnson, T.C.; Werne, J.P.; Brown, E.T.; Abbott, A.; Berke, M.; Steinman, B.A.; Halbur, J.; Contreras, S.; Grosshuesch, S.; Deino, A.; et al. A progressively wetter climate in southern East Africa over the past 1.3 million years. Nature 2016, 537, 220–224. [Google Scholar] [CrossRef] [PubMed]
  37. Hazell, P.B.; Oram, P.A.; Chaherli, N.M. Managing Droughts in the Low-Rainfall Areas of the Middle East and North Africa (No. 581-2016-39495); International Food Policy Research Institute: Washington, DC, USA, 2001. [Google Scholar]
  38. Rowell, D.P.; Folland, C.K.; Maskell, K.; Ward, M.N. Variability of summer rainfall over tropical North Africa (1906–92): Observations and modelling. Q. J. R. Meteorol. Soc. 1995, 121, 669–704. [Google Scholar]
  39. Zittis, G. Observed rainfall trends and precipitation uncertainty in the vicinity of the Mediterranean, Middle East, and North Africa. Theor. Appl. Climatol. 2018, 134, 1207–1230. [Google Scholar] [CrossRef]
  40. Schilling, J.; Freier, K.P.; Hertig, E.; Scheffran, J. Climate change, vulnerability, and adaptation in North Africa with focus on Morocco. Agric. Ecosyst. Environ. 2012, 156, 12–26. [Google Scholar] [CrossRef]
  41. Lelieveld, J.; Proestos, Y.; Hadjinicolaou, P.; Tanarhte, M.; Tyrlis, E.; Zittis, G. Strongly increasing heat extremes in the Middle East and North Africa (MENA) in the 21st century. Clim. Chang. 2016, 137, 245–260. [Google Scholar] [CrossRef] [Green Version]
  42. Oomes, N.; Heyma, A.; Belt, T.; Berthiaume, N.; Bisschop, P.; Jongerius, D.; Spanikova, V.; Kaag, M.M.A. Dutch labour market shortages and potential labour supply from Africa and the Middle East: Is there a match? Exec. Summ. Main Rep. 2019. [Google Scholar]
  43. Posel, D. Adult literacy rates in South Africa: A comparison of different measures. Lang. Matters 2011, 42, 39–49. [Google Scholar] [CrossRef]
  44. UNESCO Institute for Statistics. Adult and Youth Literacy: National, Regional, and Global Trends, 1985–2015; UNESCO Institute for Statistics: Montreal, QC, Canada, 2013. [Google Scholar]
  45. Akkari, A. Education in the Middle East and North Africa: The current situation and future challenges. Int. Educ. J. 2004, 5, 144–153. [Google Scholar]
  46. Obikili, N. The impact of the slave trade on literacy in West Africa: Evidence from the colonial era. J. Afr. Econ. 2016, 25, 1–27. [Google Scholar] [CrossRef] [Green Version]
  47. World Bank Group. Reversal of Fortunes: Poverty and Shared Prosperity. 2020. Available online: https://openknowledge.worldbank.org/bitstream/handle/10986/34496/9781464816024.pdf (accessed on 21 May 2021).
  48. Brooks, N.; Adger, W.N.; Kelly, P.M. The determinants of vulnerability and adaptive capacity at the national level and the implications for adaptation. Glob. Environ. Chang. 2005, 15, 151–163. [Google Scholar] [CrossRef]
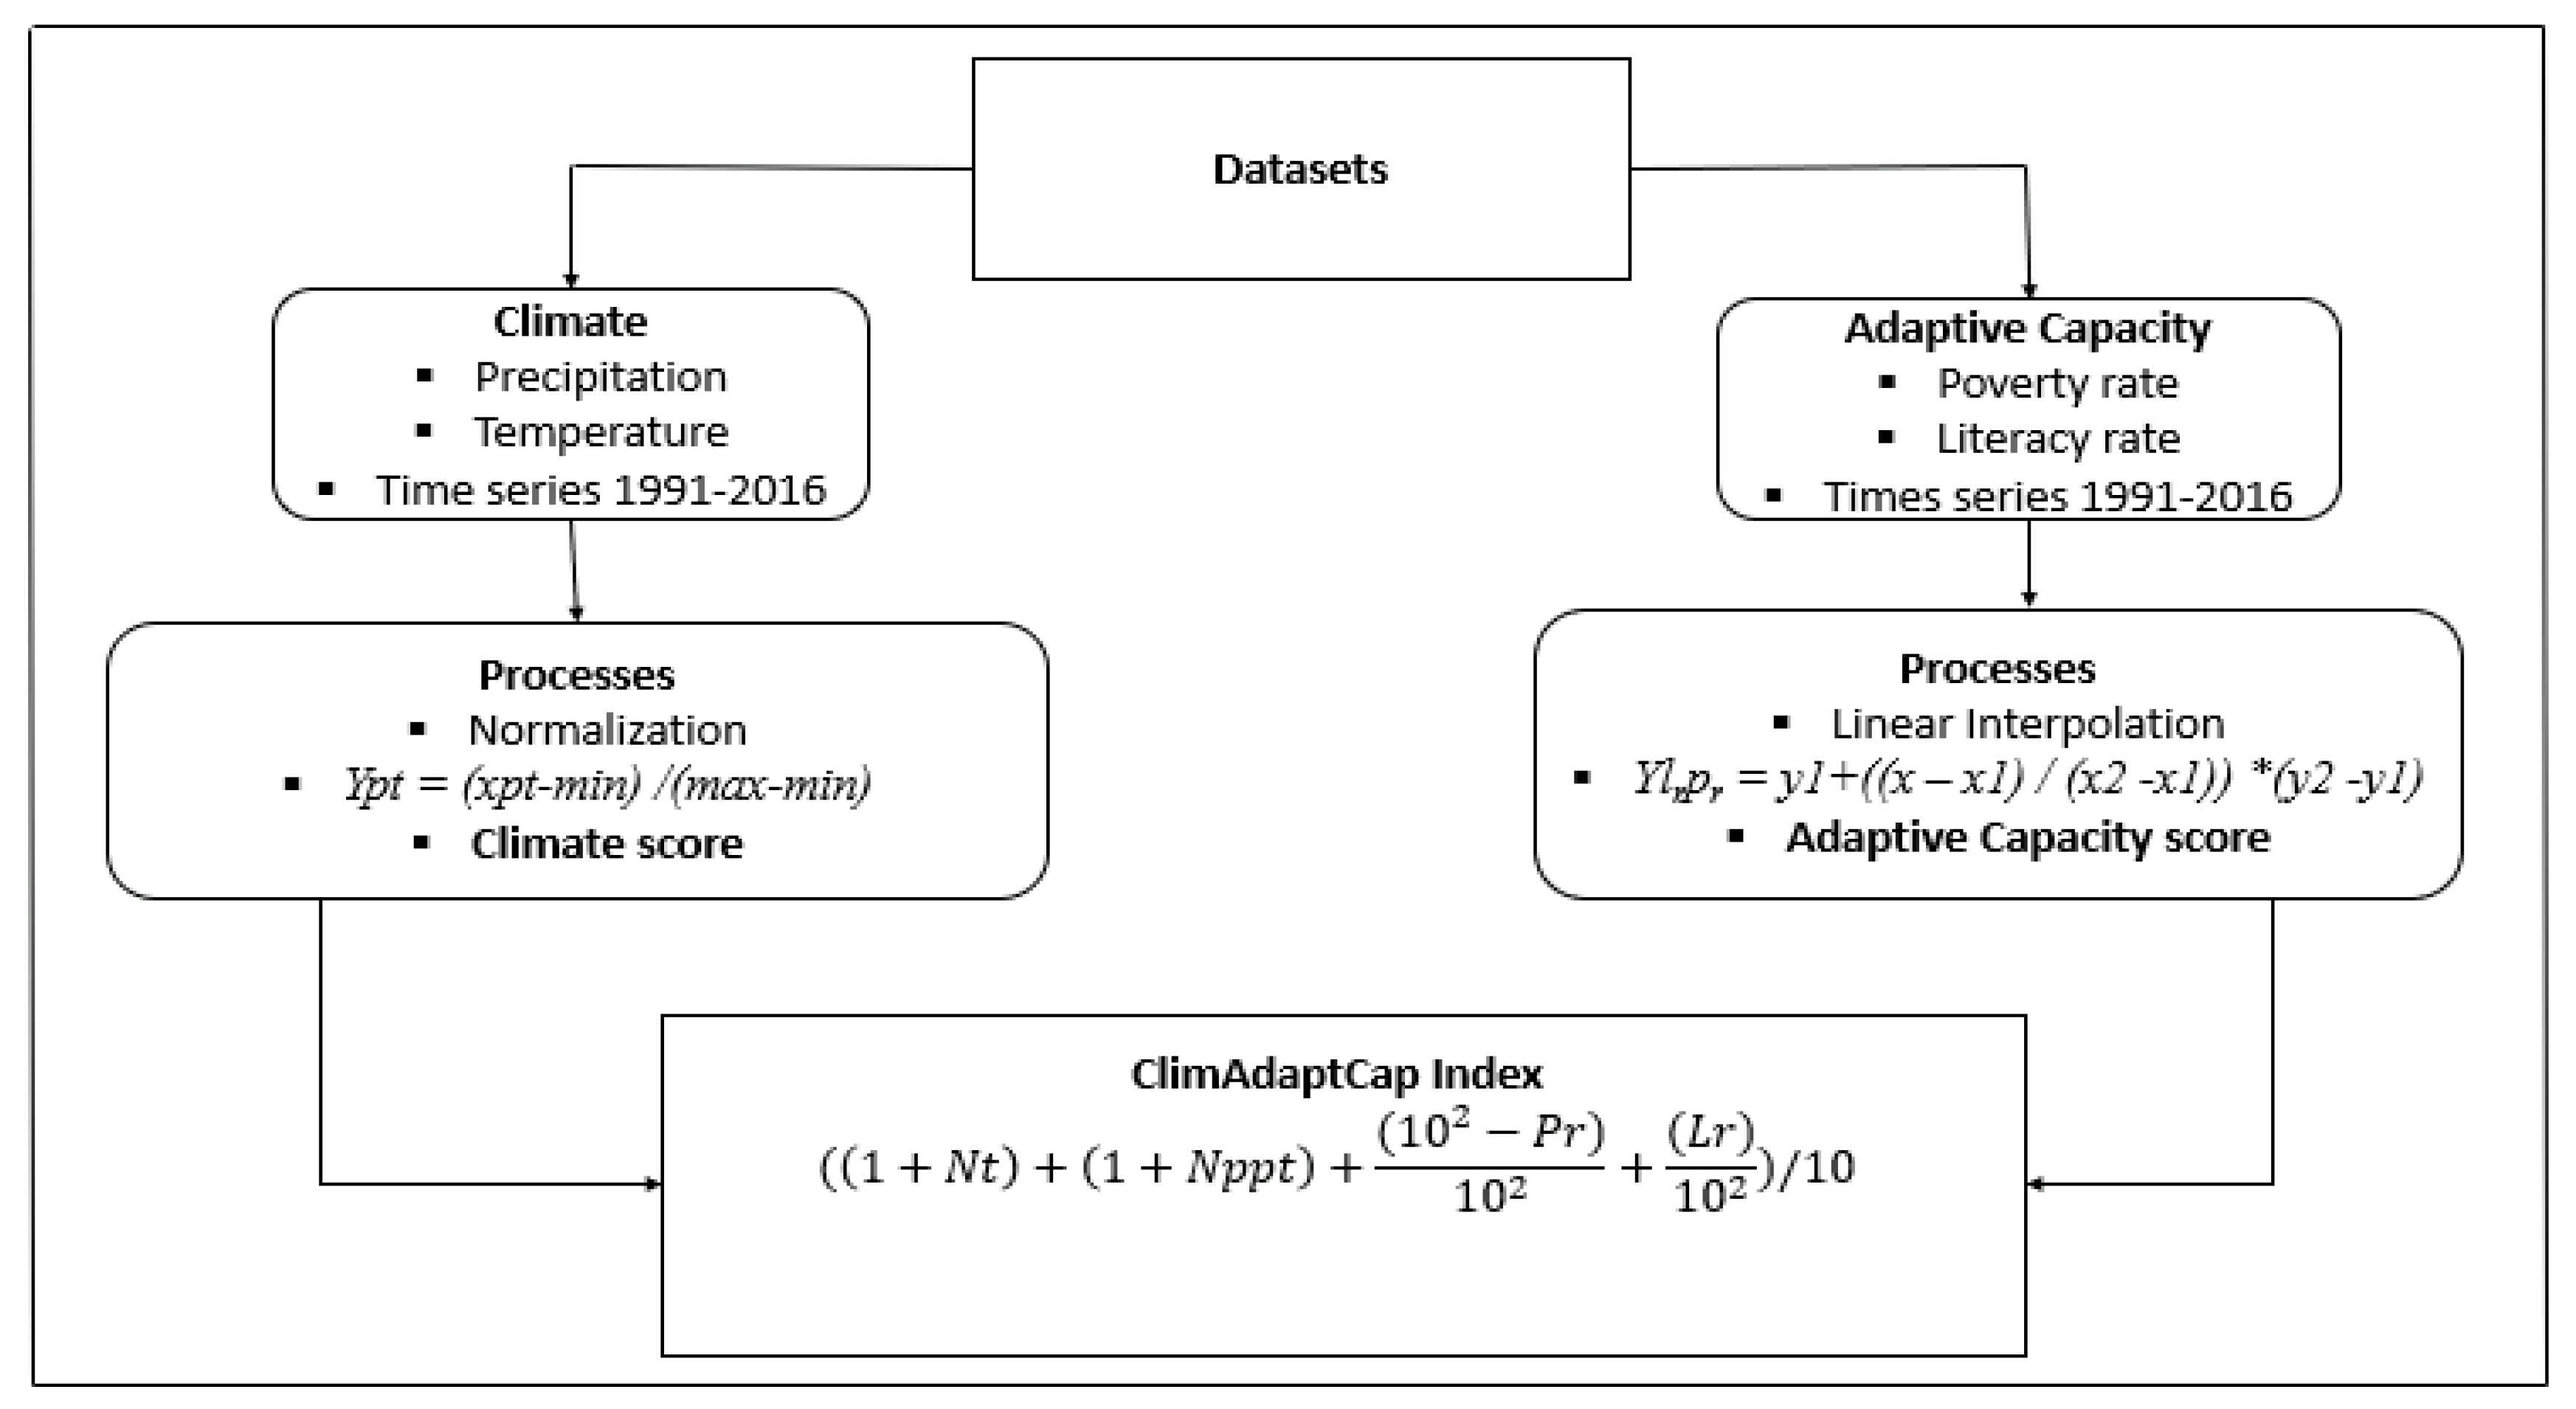
Figure 1. Methodological procedures used in this study. Source: author’s conceptualization.
Applsci 11 09413 g001
Figure 2. Recent trends in (a) mean annual precipitation (b) mean annual temperatures across Africa. Source: author’s conceptualization.
Applsci 11 09413 g002
Figure 3. Recent trends in (a) literacy and (b) poverty rates across Africa. Source: author’s conceptualization.
Applsci 11 09413 g003
Figure 4. (a) Literacy Rates (b) Poverty Rates and (c) ClimAdaptCap Indexes across Africa. Source: author’s conceptualization.
Applsci 11 09413 g004
Figure 5. (a) ClimAdaptCap Indexes and (b) poverty and literacy rates across Africa. Source: author’s conceptualization.
Applsci 11 09413 g005
Figure 6. Literacy rates in Africa. Source: modified from Oomes et al. [43].
Applsci 11 09413 g006
Table 1. Countries included in the data set.
North AfricaWest AfricaMiddle AfricaEast AfricaSouthern Africa
MoroccoMauritaniaCameroonSudanNamibia
AlgeriaSenegalCentral African RepublicEritreaZambia
TunisiaGambiaCongoEthiopiaMalawi
LibyaGuinea BissauDemocratic Republic of CongoSomaliaZimbabwe
EgyptGuineaAngolaUgandaBotswana
Sierra LeoneGabonKenyaMozambique
LiberiaSao Tome and PrincipeTanzaniaLesotho
Cote D’Ivoire RwandaSwaziland
Ghana BurundiSouth Africa
Togo DjiboutiMadagascar
Benin SeychellesMauritius
Nigeria
Niger
Mali
Burkina Faso
Chad
Cape Verde
Publisher’s Note: MDPI stays neutral with regard to jurisdictional claims in published maps and institutional affiliations.