Article

Chitosan Beads Incorporated with Graphene Oxide/Titanium Dioxide Nanoparticles for Removing an Anionic Dye

by
Moisés A. Solano
1,
Johanna Galan
2,
William Vallejo
1,
Victoria A. Arana
2 and
Carlos David Grande-Tovar
1,*
1
Grupo de Investigación de Fotoquímica y Fotobiología, Programa de Química, Universidad del Atlántico, Carrera 30 No. 8-49, Puerto Colombia 081007, Colombia
2
Grupo de Investigación Ciencias, Educación y Tecnología-CETIC, Programa de Química, Universidad del Atlántico, Carrera 30 No. 8-49, Puerto Colombia 081007, Colombia
*
Author to whom correspondence should be addressed.
Appl. Sci. 2021, 11(20), 9439; https://doi.org/10.3390/app11209439
Submission received: 30 August 2021 / Revised: 2 October 2021 / Accepted: 7 October 2021 / Published: 11 October 2021
(This article belongs to the Special Issue New Materials and Technology for Waste Water Treatment)

Abstract

:
Dyes present in industrial effluents have been treated by many methods, among which adsorption stands out for its high efficiency, low costs, simple operation processes, and the absence of hazardous byproducts. In this research, two adsorbents were obtained from chitosan beads (CS) cross-linked with glutaraldehyde (GLA), graphene oxide (GO), and titanium dioxide nanoparticles (TiO2) for the adsorption of the anionic dye FD&C Red 40 used as a model pollutant. The optimum removal conditions of FD&C Red 40 dye using CS-TiO2-GLA beads were determined (pH = 1.73, TiO2 amount =279.77 mg, and initial dye concentration = 55.23 mg L−1) with a central composite design with surface response methodology (RSM). The effect of the graphene oxide (GO) in the adsorption properties of CS-TiO2-GLA beads was evaluated, showing a considerable improvement in the removal efficiency of the model dye. The intraparticle diffusion mechanism best described the adsorption kinetics for the two adsorbents. This research demonstrates the potential of chitosan beads incorporated with graphene oxide and titanium dioxide nanoparticles to remove anionic contaminants from wastewater.

1. Introduction

The food, cosmetic, pharmaceutical, paper, and textile industries produce approximately 800,000 tons of dyes annually, and 20% end up as effluents that can be discharged into water bodies, creating persistence, bioaccumulation, and toxicity [1]. Most dyes present very stable molecular structures which are resistant to chemical degradation [2]. Likewise, they present xenobiotic properties that affect biological processes such as the interruption of photosynthesis in aquatic flora [3], mutagenic diseases in organisms present in bodies of water, and carcinogenic affectations in humans [4,5].
Consequently, there has been a trend towards protecting the ecosystem and effluent treatment with less environmental impact in recent years. Methods such as contaminant adsorption are preferred since they are simple, low-cost, highly efficient, and recyclable [6]. In dye removal, both organic and inorganic materials can be used. For example, activated carbon is a conventional adsorbent used due to its excellent adsorption performance [7]. However, its application has been limited by its high operating cost and complex regeneration process [8].
Consequently, low-cost adsorbent alternatives and high adsorption capacities have been developed, which can be used in voluminous quantities with minimal effects of damage to nature [9,10]. Therefore, special attention has been paid to the various bio-adsorbents, such as fungi, bacterial biomass, agricultural solid waste, and biopolymers [11]. Among which, researchers have recently focused on the study of biopolymers such as chitosan (CS), which are polysaccharides extracted from non-living organisms that are characterized by being biodegradable, biocompatible, and easy to modify chemically; in addition, it has low production costs and good properties as an adsorbent for removing dyes thanks to its active use of adsorption groups (-NH2 and -OH). However, it presents high solubility only in acidic media, low mechanical resistance, and low surface area, limiting its use in water treatment [12]. Fortunately, these limitations can be overcome by chemically cross-linking CS with agents such as glutaraldehyde (GLA) and nanofillers such as graphene oxide (GO) and titanium dioxide (TiO2) nanoparticles, which improve the adsorption properties of CS [13,14,15].
CS-GO-TiO2-GLA beads can present advantages such as improving the mechanical resistance by the GO [16] and a better surface area by adding TiO2 nanoparticles [17]. In addition, GO can provide adequate thermal stability in the environment and offer additional mechanical stability to the processed composite due to its high strength [16]. To the best of our knowledge, CS-GO-TiO2-GLA beads for removing an anionic dye have not been reported. Therefore, the objective of this work consisted of elaborating a hybrid material from CS-GO-TiO2-GLA composites and the removal of the anionic dye FD&C Red 40 as a green environmentally and economic adsorption process.

2. Materials and Methods

2.1. Materials

CS (deacetylation ≥ 75%; medium molecular weight, Merck KGaA, Darmstadt, Germany), graphite (325 mesh, Alfa-Aesar, Tewksbury, MA, USA) was used for GO synthesis following the methodology of Marcano et al. [18], Titanium isopropoxide (TTIP; reagent grade, 99%, Aldrich, Palo Alto, CA, USA) was used for TiO2 nanoparticles synthesis following a previously reported method [19,20]. GLA was purchased from Fischer Chemical (Philadelphia, PA, USA). FD&C Red 40 dye was obtained from Sigma-Aldrich (Palo alto, CA, USA). Acetic acid, ethanol absolute, sodium hydroxide (NaOH), and hydrochloric acid (HCl) were obtained from Merck Company (Burlington, MA, USA). Table 1 shows the composition of the synthesized beads.

2.2. Synthesis of the Cross-Linking Chitosan Beads

2.2.1. Synthesis of the CS-GLA and CS-TiO2-GLA Beads

CS-GLA beads were prepared and characterized according to our previous report by FTRI, TGA, and XRD [21].
The bead’s surface morphologies were studied at 20 kV on secondary backscattered electrons using a scanning electron microscope (SEM) (JEOL JSM-6490LA, Musashino, Tokyo, Japan).
A central composite design (CCD) with response surface methodology (RSM) was performed to optimize the synthesis conditions of CS-TiO2-GLA beads. The dependent variable (removal efficiency of dye FD&C Red 40) was related to the independent variables (TiO2 amount, initial dye concentration, and pH). The regression coefficients and the mathematical model error were determined. Subsequently, analysis of variance (ANOVA) was performed to determine the confidence of the model through the coefficient of determination (R2) and the 3D surface plot was obtained in order to evaluate the main and interactive effects between the dependent and independent variables [15]. Thirty-two randomized experiments were performed, including one replication. Table 2 shows the levels of the selected factors in this CCD. Statgraphics Centurion XVI statistical software (Statgraphics Technologies, Inc., Old Tavern Rd, The Plains, VA, USA) was used.
Second-order mathematical models were created to optimize the factors studies, according to Equation (1).
y = β 0 + i = 1 k β i x i + i = 1 k β i i x i 2 + i = 1 < j = 1 β i j x i x j + ϵ
where y is the adjusted response variable, i and j are linear and quadratic coefficients, β is the regression coefficient, k is the number of optimized factors, and ε is the experimental error.
One gram of CS was dissolved in 49 mL of 1% (v/v) acetic acid using a disperser (ULTRATURRAX IKA T-25, Merck-kGaA, Darmstadt, Germany) until a homogeneous solution was obtained. Various amounts of TiO2 nanoparticles (31.8 mg; 100 mg; 200 mg; 300 mg; and 368 mg) were added to the previous solution according to each run of the experimental design [14]. Then, the dispersion was shaken vigorously and allowed to stand for 24 h to release air bubbles.
A phase inversion technique was used to form the beads [22]. For the synthesis of the beads, a 25 mL pipette was used, and the previously prepared CS-TiO2 solution was poured dropwise into a NaOH (0.5 M) to form the CS-TiO2 beads. The obtained beads were washed with distilled water until a neutral pH was reached. The beads formed were introduced in a 25 mL Erlenmeyer with a 1.7% (v/v) solution of GLA for 12 h to cross-link the beads at room temperature [23]. Finally, the beads were washed with plenty of distilled water to remove the remaining GLA and oven-dried at 60 °C for 24 h.

2.2.2. Synthesis of the Beads, including Graphene Oxide

CS-GO-TiO2 solutions were prepared according to our previously reported work [21] by adding various amounts of GO concerning TiO2 (1%, 3%, and 10% w/w) to the CS-TiO2 mixture. It was supplemented with 1% (v/v) acetic acid to 50 g of solution. It was then stirred to homogeneity and allowed to stand for 24 h at room temperature to release air bubbles. From this point and the phase inversion technique, the procedures previously mentioned in Section 2.2.1 were performed to obtain the CS-GO-TiO2-GLA beads.

2.3. Adsorption Experiments

For the adsorption experiments, 0.3 g of the prepared beads was mixed with 25 mL of FD&C Red 40 dye at different initial concentrations and pH (according to each run of the experimental design). For each run, the solution was left in the dark long enough (varying for each type of bead, no longer than 12 h) to establish the adsorption-desorption equilibrium, which was achieved by obtaining consistent absorbance measurements consecutively. The pH of the dye solution was adjusted using NaOH and HCl 0.1 M. The suspension was stirred during the adsorption experiments at 400 rpm. Once equilibrium was reached, the FD&C Red 40 dye concentration was determined using a previously prepared calibration curve (Figure S1) by UV-vis spectrophotometry at λmax = 500 nm corresponding to the absorbance maximum of FD&C Red 40 dye [24]. The equipment used was a visible spectrophotometer (Iris H1801, Mexico City, Mexico). The removal efficiency was calculated.

2.4. Effect of Graphene Oxide on the FD&C Red 40 Dye Removal

Three CS-GO-TiO2-GLA systems were prepared to evaluate the effect of GO when added to CS-TiO2-GLA beads. The amounts of GO in the beads were varied, and this variable’s effect on the dye removal efficiency was evaluated. The prepared beads were used as adsorbents taking as reference three CCD combinations where the FD&C Red 40 dye removal efficiency were low (<30%), intermediate (≈50%), and high (100%). The amount of TiO2 for the preparation of all beads was 300 mg.

2.5. Swelling Test of Cross-Linked Beads

A modest and fast technique, known as a swelling percentage, can estimate the porous structure in the cross-linked CS beads. Once the different beads were obtained, a certain amount of beads (0.1 g, W0) were weighed and dispersed (separately) in 25 mL of distilled water at room temperature. After 24 h, the dispersion was filtered, the surface water residue was dried with rice paper, and the wet weight of each bead (W1) was taken. The percent swelling was calculated using Equation (2) [25].
swelling   degree   ( % ) = ( W 1 W 0 ) W 0 × 100
where W0 (g) is dry mass and W1 (g) is the wet mass of the beads.
The effect of pH on swelling was evaluated and performed in duplicate by carrying out the same procedure described above, replacing the distilled water with a 0.1 M solution of HCl.

2.6. Kinetic Experiments

An experiment was performed for each type of bead to determine the adsorption kinetic model that best fitted each adsorbent prepared. Initially, 0.3 g of a given adsorbent was added to an FD&C Red 40 dye solution with an initial concentration of 45 mg L−1 adjusted to a pH of 3.0 under constant agitation of 400 rpm and in dark conditions (temperature = 25 °C). Once the beads were added to the solution, the FD&C Red 40 dye concentration was calculated by taking small aliquots every specific time until a constant absorbance was reached. The adsorption capacity over time (qt) was calculated.
The kinetic models studied for fitting were the linear pseudo-first-order, pseudo-second-order, intraparticle diffusion, and Elovich. Pearson’s correlation coefficient (R2) was determined for each model, becoming the selection criterion [26].

3. Results and Discussion

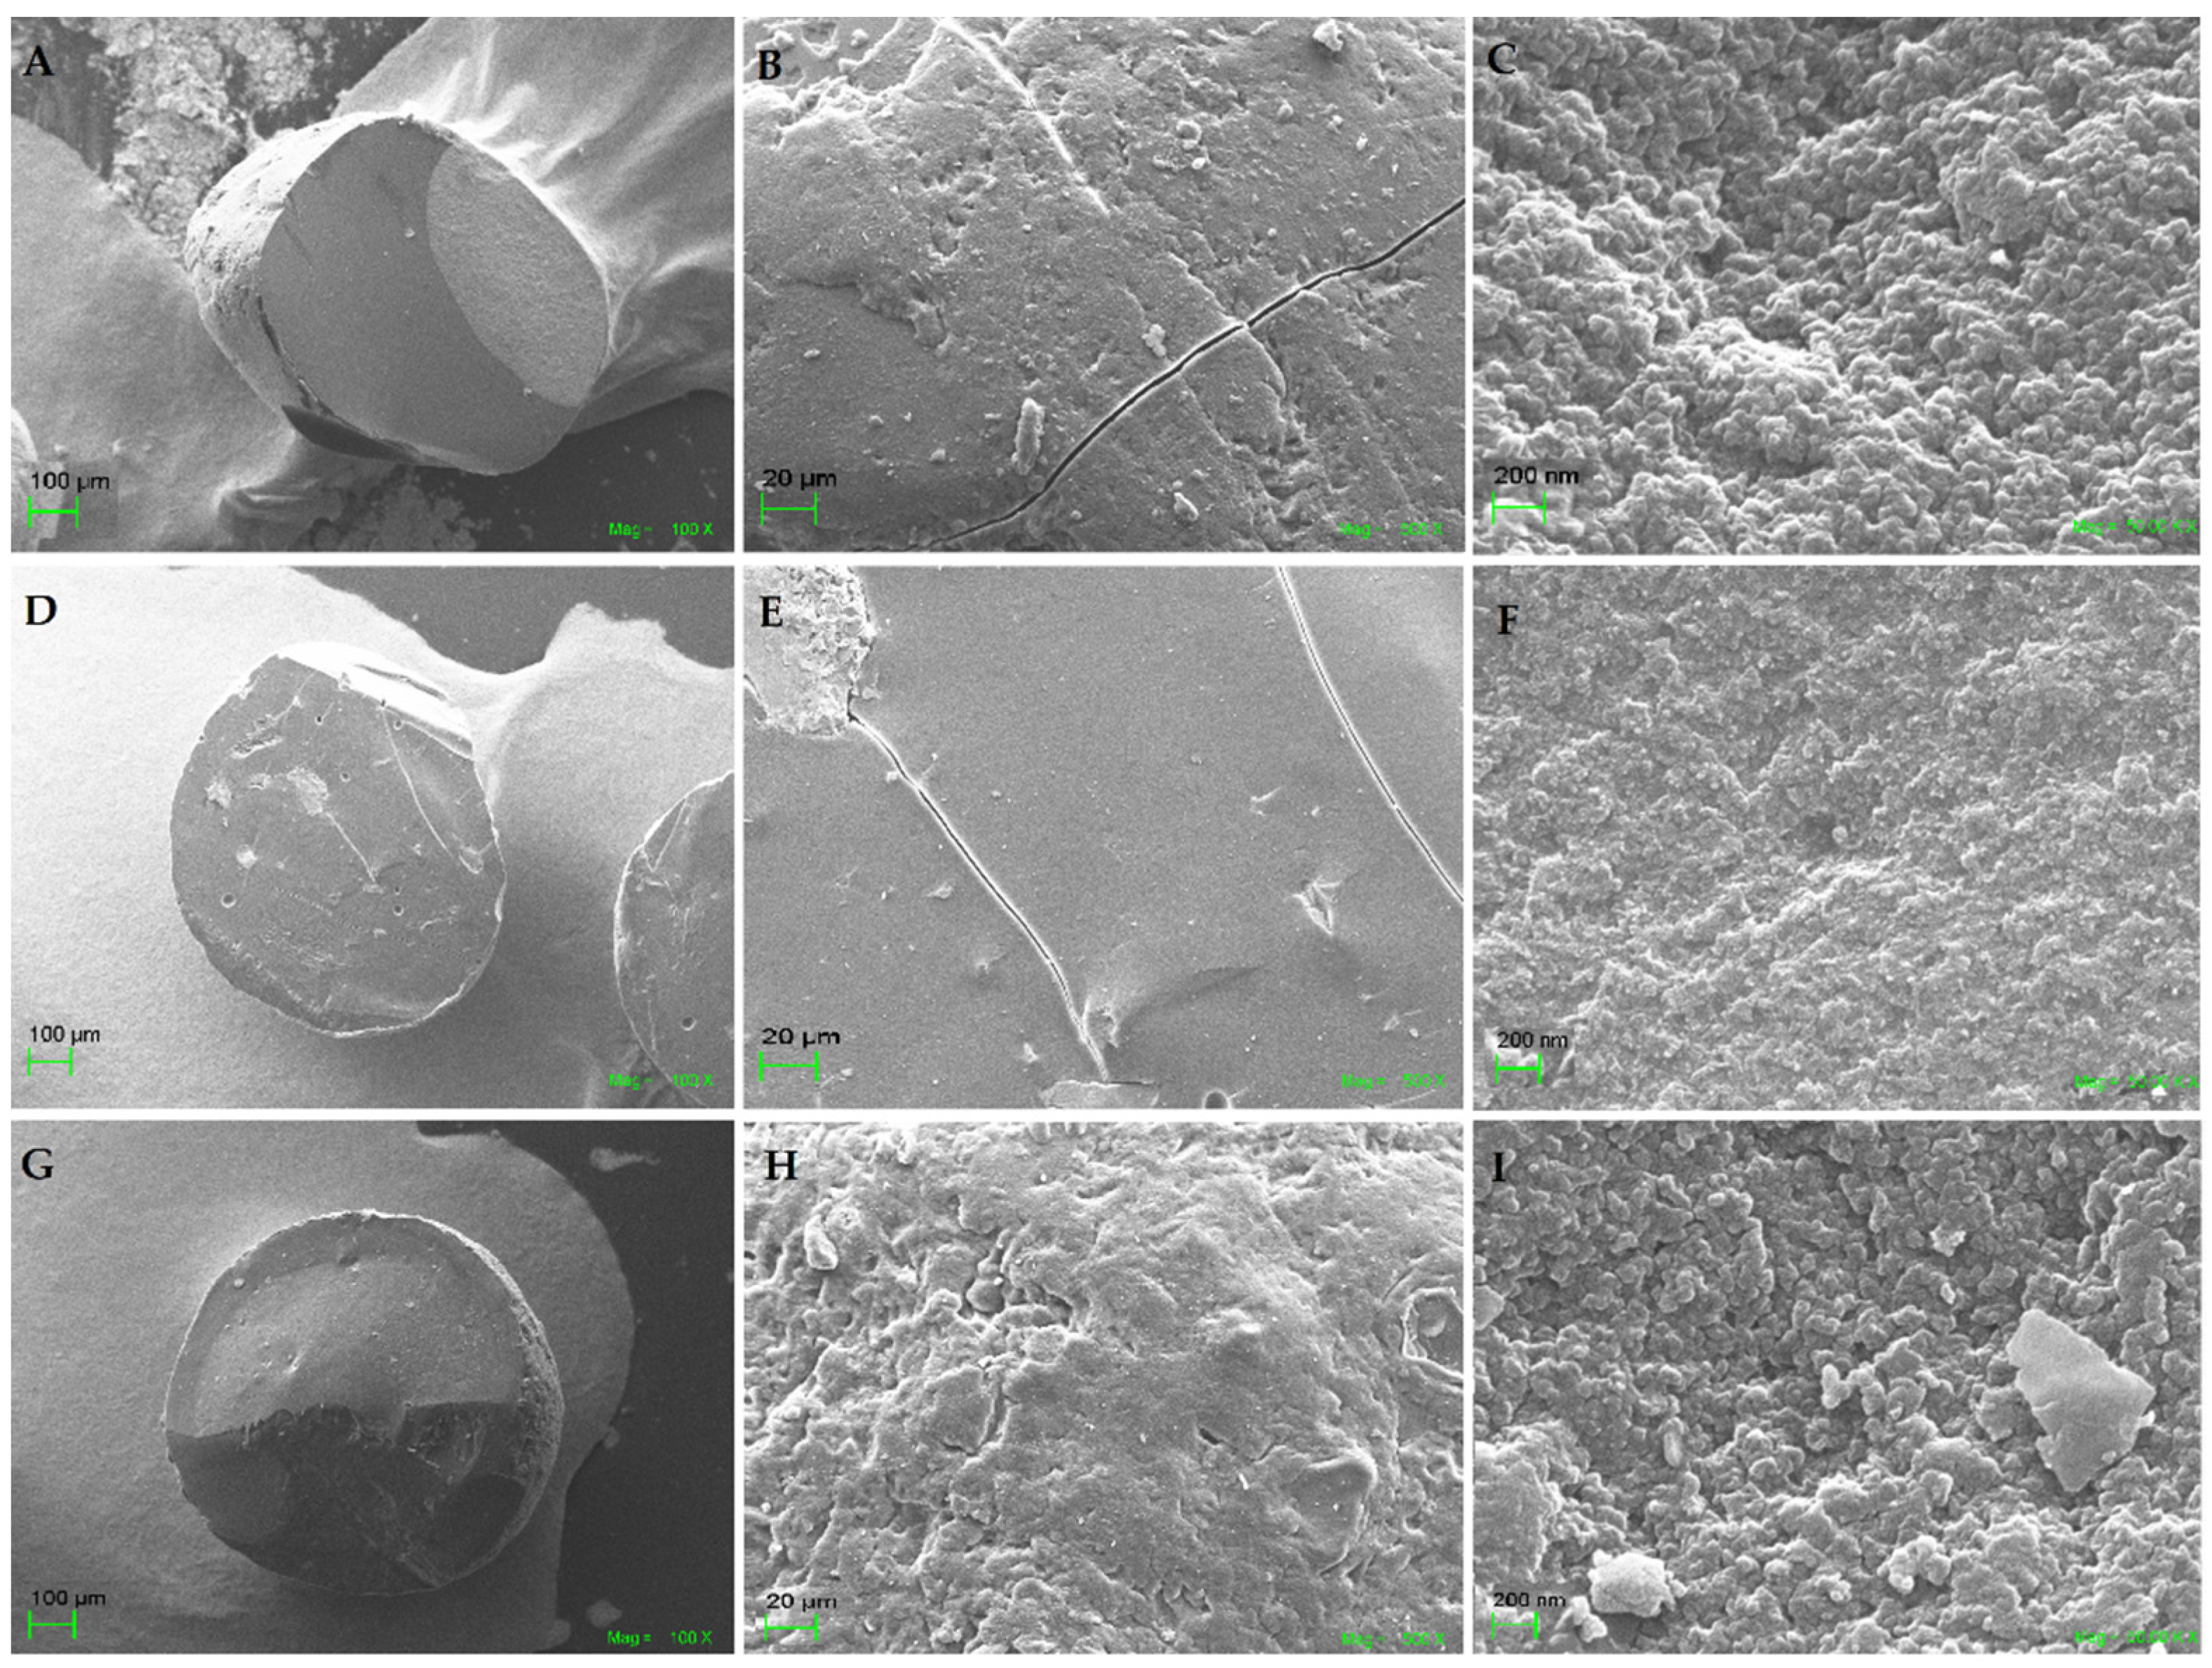
3.1. Characterization of the Cross-Linked Chitosan Beads

In order to obtain better efficiency in the FD&C Red 40 dye removal process, the effect of each component (GO and TiO2) was evaluated by incorporating them into CS-GLA beads previously synthesized and characterized in a recently published work where were discussed the FT-IR, XRD, SEM, and TGA characterization of CS-GLA, CS-TiO2-GLA, and CS-GO-TiO2-GLA beads [21]. FT-IR spectrum highlights the cross-linking reaction of CS with GLA due to the stretching band presented at 1641 cm1 due to the imine-like bond from the amino groups of CS and the carbonyl groups of GLA. Similarly, the existence of amorphous regions and the signals obtained from XRD for the CS-GO-TiO2-GLA sample at angles 2θ = 25°, 38°, 48°, 54°, 62°, 68°, 74°, and 82°, corresponds to the tetragonal crystalline planes of the anatase phase of TiO2 [14]. The CS-GO-TiO2-GLA beads presented a small peak at 2θ = 13°, corresponding to the presence of the dispersed GO sheets. SEM analysis (Figure 1) demonstrated the changes in roughness when GO and TiO2 were added to the CS-GLA beads due to the cross-linking and intercalation of the nanomaterials with the polymeric chains.

3.2. Optimization for the Removal of the FD&C Red 40 Dye in an Aqueous Solution

Table 3 shows the matrix of the CCD experimental variables and FD&C Red 40 dye removal efficiency responses using the CS-TiO2-GLA beads. The range of parameters was determined based on preliminary experiments. The concentrations of the solutions were calculated from a previously prepared calibration curve (Figure S1).
The interactions and effects between the independent variables in the removal efficiency were determined by ANOVA, as shown in Table 4. The effectiveness of the model and its predictive ability were evaluated based on the R2 and adjusted R2 coefficients (R2adj) for removal efficiency. The model presented significant variability with an R2 of 0.7555 and an R2adj of 0.6391, where the R2adj is the most appropriate parameter for comparing models with different independent variables [27].
For a confidence level of 95% (p < 0.050), it was observed that the main effects (B: initial dye concentration and C: pH) and the interaction effect BC are significantly different from zero. The mean square of the total error is much smaller or very different from the mean square of the effects, so they introduce variability to the response, and the alternative hypothesis is approved. On the other hand, factor A, the amount of TiO2, has a p > 0.050, indicating that TiO2 in the beads does not significantly influence dye removal efficiency. Consequently, the mathematical model that best fits the removal percentage with a significance level of 95% is verified in Equation (3).
R e m o v a l   e f f i c i e n c y   ( % ) = 91.063 + 0.161854 A 0.726989 B + 3.55169 C 0.00036359 A 2 + 0.00175667 A B 0.0208 A C + 0.0327055 B 2 0.423125 B C + 0.456848 C 2

3.2.1. Titanium Dioxide Amount Effect

Upon the addition of TiO2 nanoparticles, oxygen atoms are added across the surface of the CS beads [14]. These can be chemically transformed into oxonium ions in acidic media, which become active adsorption sites due to the positive charge density they bring to the material’s surface [28].
The contribution of TiO2 nanoparticles to the removal efficiency of FD&C Red 40 dye is hardly noticeable. This low contribution is because the efficiency of the adsorption mechanism of FD&C Red 40 dye involves, to a greater extent, the amino groups of the CS, which are hindrance by the interaction between them and the titanium (IV) cation (Ti4+) [14]. Moreover, it tends to decrease as more TiO2 is added in the processing of the beads.
On the other hand, Jawad et al. [14] found that optimal removal of the active dye Red 120 (anionic in nature) using CS-TiO2-GLA beads is not necessarily obtained by incorporating more metal oxide into the beads. There must be a balance between materials’ surface area and the available amino groups for removing the dye, variables that depend on the dose of TiO2 used to elaborate the material.

3.2.2. Effect of pH

The pH is one of the most critical parameters affecting the adsorption processes since it influences the degree of ionization of the dye and the surface charge of the adsorbent [29]. The experimental design results show that decreasing the initial pH of the aqueous solution (from 7.0 to 3.0) increases the removal efficiency of FD&C Red 40 dye. This effect can be explained by taking into account the surface charge of the CS-TiO2-GLA beads. The primary amino groups of CS are protonated in acidic environments, increasing the interaction capacity between beads and dye molecules with negative net charges [12]. It is possible to state that FD&C Red 40 dye molecules are negatively charged in the pH range used in this study (1.64 to 8.36) [30].
The decrease in pH results in a greater electrostatic attraction force that occurs mainly between the positively charged protonated amino groups (−NH3+) and the negatively charged sulfonate groups (-SO3−) of FD&C Red 40 dye [28], without neglecting the contribution of the oxonium ions coming from TiO2 in the interaction with the dye [14].
On the other hand, increasing the pH favors the formation of dye molecules with negative net charges. However, simultaneously the deprotonation of the positively charged amino groups of the CS occurs, decreasing the number of adsorption active groups in the beads, so the final effect is a decrease in the removal percentage of the dye.

3.2.3. Effect of the Initial Concentration of FD&C Red 40 Dye

The variation in the initial concentration of FD&C Red 40 dye is of great importance as it allows for evaluating the performance of the CS-TiO2-GLA beads in their role as adsorbents [31]. The dye molecules diffuse through the solution to the surface of the beads, where they adsorb and gradually penetrate the boundary layer [32].
At low initial dye concentrations, the ratio between the number of available adsorption active sites on the beads is higher than the number of molecules in solution so that the material can rapidly adsorb FD&C Red 40 dye (with a high percentage of removal). However, as the initial concentration increases, the number of adsorption active sites decreases concerning the amount of adsorbate in solution, reducing the removal percentage [32]. In turn, the higher the FD&C Red 40 dye concentration, the greater the electrostatic repulsion between the molecules (due to the dissociated sulfonate groups) when they enter the surface of the beads. Therefore, some dye molecules are not adsorbed and remain in the aqueous phase [31]. As a final effect, the percentage of removal decreases.

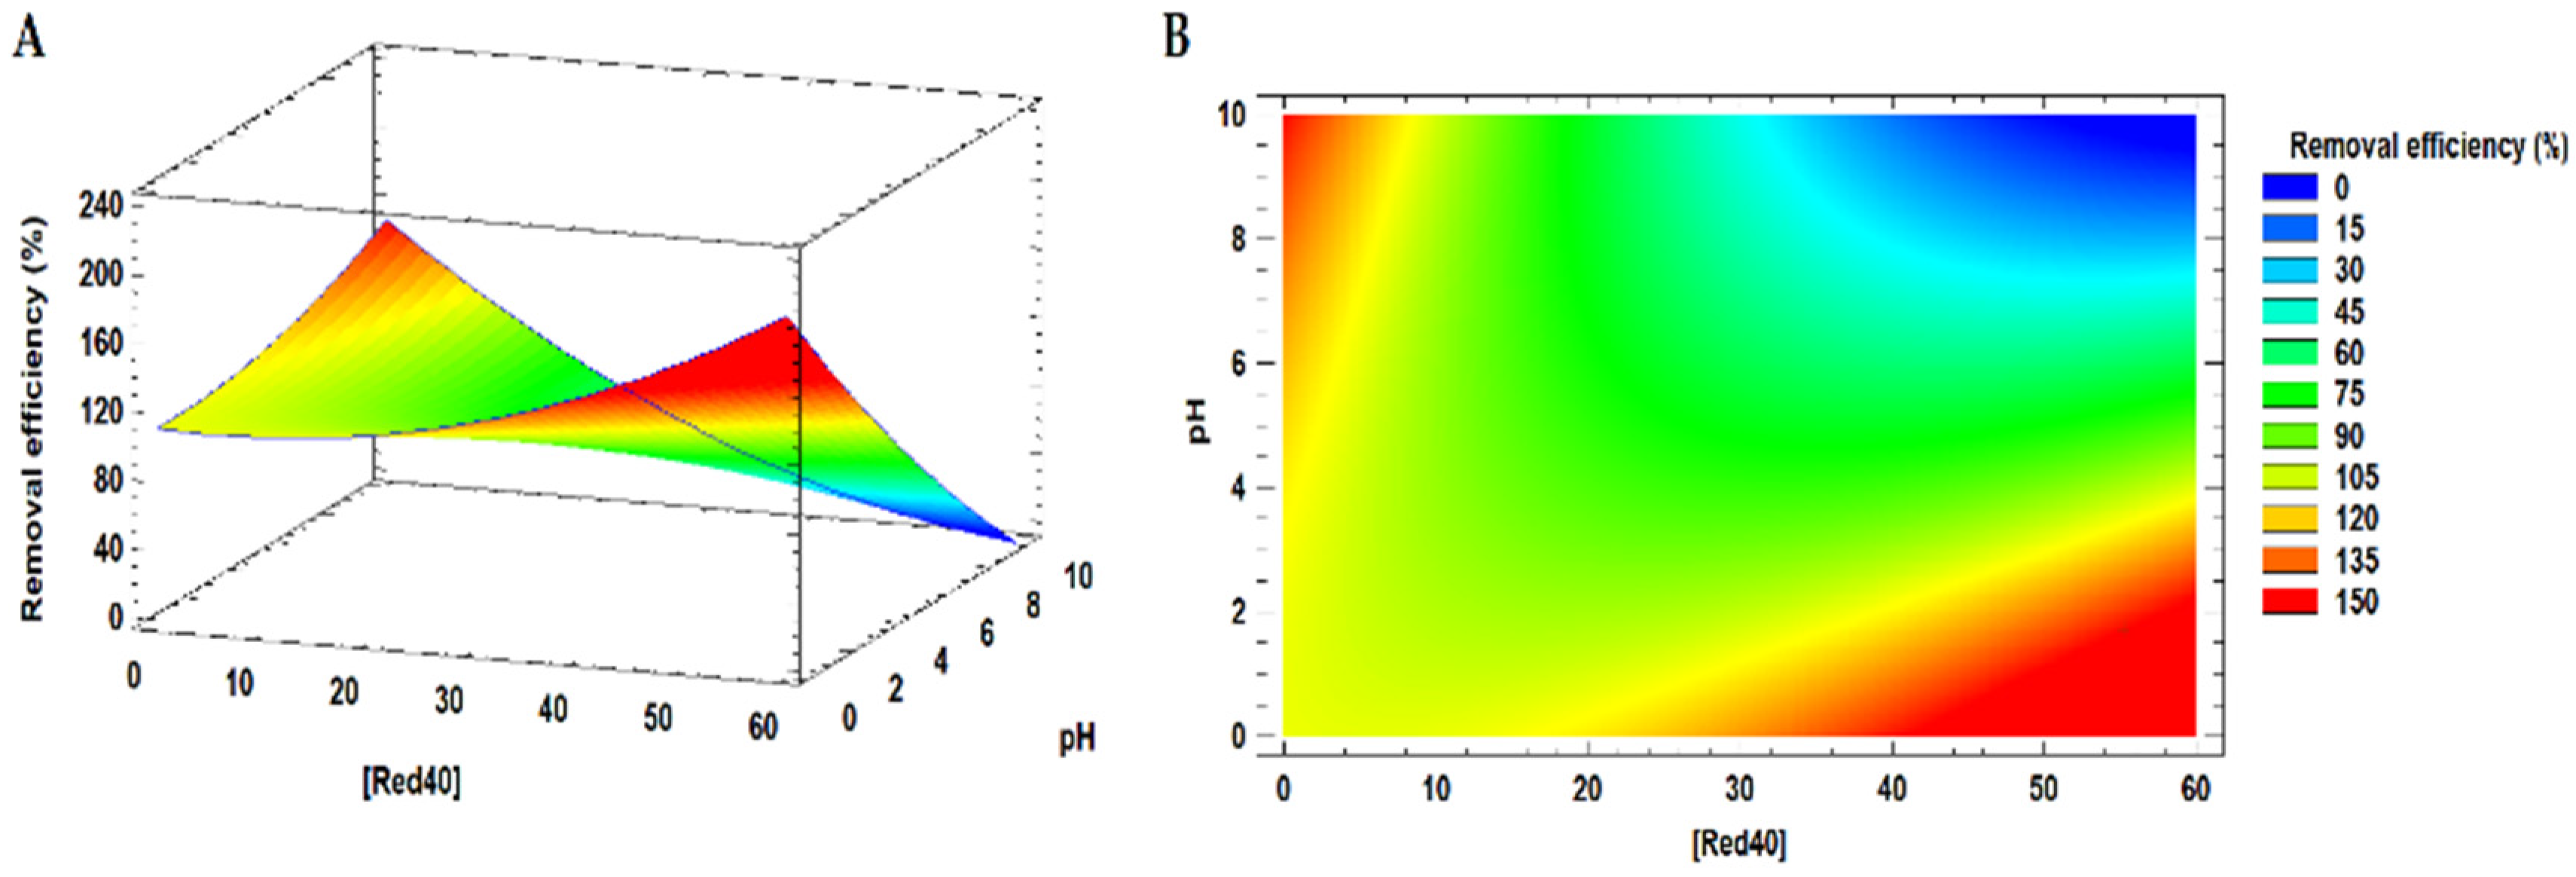
3.2.4. Interaction Effects on Response and Process Optimization

The mathematical model’s 3D surface response plot and 2D contour plot for the pH and dye concentration interaction (Figure 2A,B) show that decreasing the pH of the solution from 10 to 1 causes an increase in the percentage removal of FD&C Red 40 dye from 0 to 100%. The contour diagram shows that the optimum pH has a value of 1.73, and the optimal amount of TiO2 was 279.77 mg.
As the concentration and pH levels decrease, the removal efficiency of the dye increases since the number of active adsorption sites will be more significant. Additionally, these molecules will have a net negative charge at the optimum pH (since the sulfonate groups of the FD&C Red 40 dye molecules are dissociated at this value [30], a result that coincides with the main effects analysis.
On the other hand, the mathematical model predicts that the optimal initial concentration of the dye is 55.23 mg L−1 at low pH levels, with the removal of 151.69% (which corresponds to a complete removal under experimental conditions) observed in the contour plot. This result highlights the more significant impact of the solution’s initial pH than its initial concentration on the percentage of dye removal. The removal was almost zero at the same concentration level in a highly alkaline medium (pH > 10).

3.2.5. Effect of the Addition and Dose of Graphene Oxide on the Removal Efficiency of FD&C Red 40 Dye

Despite the optimal value of TiO2 (279.77 mg) in the CCD, we used 300 mg of TiO2 for the CS-GO-TiO2-GLA beads to replicate the same experimental conditions of runs 6, 13, and 15 of the CCD and to study the effect of GO on the dye removal efficiency.
Table 5 shows the pH solution effect and the initial dye concentration when comparing the results obtained between experimental runs 6 and 13 of the CCD (whose pH values are equal) for the beads with 1 wt.% of GO, where an increase in the removal efficiency from 83.5% to 98.5% due to the decrease in the initial concentration of the dye from 45 mg L−1 to 15 mg L−1. In addition, an improvement in removal from 83.5% to 100.0% is observed between samples 6 and 15, where the pH value drops from 7 to 3. On the other hand, it can be observed that the addition of a more significant amount of GO does not have a greater influence on the removal of the dye. However, removal results show that beads with 3wt.% of GO (96.7%) were more efficient than 1 wt.%. For that reason, we selected this percentage for subsequent experiments.
Table 6 compares the removal efficiency of FD&C Red 40 dye between CS-TiO2-GLA and CS-GO-TiO2-GLA beads (with 3 wt.% GO). Adding GO to CS-TiO2-GLA beads can efficiently enhance FD&C Red 40 Dye removal, independent of pH and initial dye concentration. The modification of GO with CS is possible due to the existence of oxygenated groups through the nanosheet, which can interact with the polymeric matrix through supramolecular interactions [33]. In this way, the GO aligns itself between the CS chains, where it establishes an interlocking interaction that clings to the CS chains by hydrogen bonds. [34]. The improvement in adsorption capacity is due to GO’s own characteristics (large surface area, good chemical stability, and a flat basal structure) and its role in the dye adsorption mechanism [35]. GO molecules play a role within the synthesized beads as new adsorption active sites where three possible types of interactions with the dye can occur (electrostatic, hydrogen bonds, and π-π interactions) [36]. The system’s adsorption mechanism is discussed in more detail in the adsorption kinetics section.

3.3. Swelling Test

For this test, uncrosslinked CS beads were also obtained to evaluate the swelling capacity and the cross-linking effect with GLA. The swelling of the beads was measured in a neutral aqueous medium and an acid medium (0.1 M HCl) in duplicate. Table 7 shows the results of swelling of the synthesized cross-linking chitosan beads (%).
The swelling test studies the porous expansion of the synthesized beads, and although it is related to the adsorption capacity, it is not the variable that affects it to a greater extent, such as the pH and the initial concentration of the dye [13,37].
The swelling mechanism involves the adsorption of water molecules through hydrogen bonds by the polar groups of the CS. Table 7 shows that the uncrosslinked CS beads show the highest swelling compared to the synthesized beads. However, CS is not stable and eventually solubilizes in the acidic media. On the other hand, the swelling decreases considerably with GLA incorporation. An alteration occurs throughout the entire CS structure during the cross-linking process, significantly affecting its adsorption capacity [38]. The decrease in the swelling degree is explained by the existence of fewer nitrogen atoms available for water adsorption since GLA chemically reacts with CS to form the imine-type covalent bond [39]. The effect of TiO2 nanoparticles on swelling agrees with the previously reported by Yadollahi et al. [40], where the addition of zinc oxide (ZnO) nanoparticles to CS hydrogels decreases the swelling capacity. This swelling decreasing can be attributed to the metal oxide nanoparticles, which restrict the expansion of the polymeric chains by “strong knot tightening” through chelation with some amino and hydroxyl groups of CS.
The study of Jawad et al. [14] indicates that there is a decrease (from 22.54% to 14.49%) in NH2 groups of CS for two CS-TiO2-GLA bead systems (25 and 50 wt.%) due to the interaction between the titanium atom of the nanoparticles (acting as Lewis acid) and the free electron pair of the CS nitrogen (Lewis base). In the present work, 10 wt.% TiO2 was used and could be assumed a decrease in the amount of NH2 groups available.
By adding the GO to the CS-TiO2-GLA system, the degree of swelling decreased only by 2.5% (Table 7), probably due to an electrostatic interaction between GO and TiO2, decreasing its capacity to capture water molecules [41], so the change in porous expansion is minimal. However, the CS-GO-TiO2-GLA showed better adsorption, demonstrating the influence of GO for the uptake of dye molecules, as shown by the results of Table 6, where the % removal efficiency of runs 6 and 13 of the CCD significantly increased by adding GO to the CS-TiO2-GLA system.
The swelling mechanism by adjusting the medium surrounding the CS beads to an acidic environment involves increasing the concentration of hydronium ions (H3O+), resulting in more protonated amino groups along the CS chain. The acidic medium produces the diffusion of a proton with water molecules inside the beads, causing an intramolecular electrostatic repulsion and an increase in swelling percentages [40].

3.4. Kinetic Modeling

The fitting results are illustrated in Figure 3 and Table 8 for the CS-TiO2-GLA, and CS-GO-TiO2-GLA systems, respectively.
The equilibrium times for dye adsorption are reflected in Table S1, and these were 540 min and 240 min for the CS-TiO2-GLA and CS-GO-TiO2-GLA systems, respectively. The pseudo-first-order (PPO) and pseudo-second-order (PSO) models were fitted to the experimental kinetics data to obtain more information about the dye adsorption mechanism and the limiting step in the process. Generally, the PPO model explains the adsorption processes by physisorption, while the PSO model explains it by chemisorption [42]. On the other hand, the PSO model can explain the adsorption mechanism by electrostatic interactions between the positively charged active sites on the adsorbent and the negatively charged molecules of the dye. Thus, electrostatic attraction plays an essential role in the adsorption of FD&C Red 40 dye by the two systems [42].
The diffusion mechanism was investigated by fitting the intraparticle diffusion model by Weber-Morris [43]. Considering the R2 values reflected in Table 8, it is possible to state that this model better explains the adsorbents’ adsorption processes, which occur in different stages. The first stage is the transport of FD&C Red 40 dye molecules from within the solution to the external surface of the material, followed by diffusion within the pores of the adsorbents (intraparticle diffusion) and adsorption of the dye on the surface of the material through electrostatic, n-π stagnation, hydrogen bonding, and π- π stagnation interactions (for the system with GO) [36].
On the other hand, Ki constants increase with the addition of GO to the system of CS-TiO2-GLA. That means the diffusion rate of the dye increased towards their surface [15,44]. Additionally, the values of the C constants of this model provide information about the thickness of the boundary layer, being equal for the three systems. Since C ≠ 0, intraparticle diffusion is not the only step controlling the rate of dye adsorption [28].
The Elovich equation is one of the most effective kinetic models to explain the chemisorption of adsorption processes and finds practical application when the adsorbent surface presents heterogeneous adsorption sites [45]. The constant α (mg g−1 min−1) of the model is related to the initial adsorption rate and the constant β (g mg−1) to the degree of adsorbent surface coverage and the activation energy of the chemisorption process [46]. From Table 8, an increase in the initial adsorption rate is observed upon addition of GO to the beads of CS-TiO2-GLA, while the β constant decreases, which may be an indication of the decrease of the activation energy for the adsorption of FD&C Red 40 dye on the adsorbent surface by chemisorption interactions [43]. Both results agree with the experimental observations, where adding the GO to the CS-TiO2-GLA beads decreases the dye removal time at the same initial conditions.

3.5. Adsorption Mechanism of FD&C Red 40 Dye

The adsorption mechanism of FD&C Red 40 dye on the surface of CS-TiO2-GLA beads can be proposed based on the adsorption sites available on the adsorbent surface. Different interactions can occur at the solid-liquid interface, and electrostatic interactions are considered the main form of adsorption. These can occur between the positively charged groups (−TiOH2+, −NH3+, and −OH2+) on the surface of the beads and the negatively charged sulfonate groups (−SO3) of the dye. Two types of interactions involving hydrogen atoms can be included: dipole-dipole interactions and Yoshida-type hydrogen bonding. Dipole-dipole interactions can occur between the nitrogen and oxygen atoms of the dye and the hydrogen atoms on the surface of the beads, while Yoshida interactions can occur between the -OH groups of the beads and the aromatic rings FD&C Red 40 dye. Additionally, an n-π interaction may exist by delocalizing the free electron pair of the oxygen and nitrogen atoms in the polymer matrix with the π orbital of an aromatic ring of the dye [17,28,42].
The GO-compact systems can perform hydrogen bonding via the carboxylic and hydroxyl groups present on its surface with the oxygen and nitrogen atoms of FD&C Red 40 dye. As far as electrostatic interactions are concerned (in the pH range of 3 to 7), the oxygenated groups of GO (carboxylic and hydroxyl) are in their neutral or protonated form so that at acidic pH, the number of positive charges on GO increases, which favors the adsorption of FD&C Red 40 dye by the attractive electrostatic force [36]. In turn, the π electrons of GO can undergo strong π-π interactions with the benzene rings of FD&C Red 40 dye [47], increasing the removal of the dye from 17.3% to 96.7% even at pH 7.

4. Conclusions

For removing FD&C Red 40 dye with the CS-TiO2-GLA beads, ANOVA analysis showed a good fit for a 95% confidence level. The optimal operating conditions had values of 55.23 mg L1 for the initial dye concentration, 1.73 for the initial pH, and 279.77 mg for the TiO2 dose, treatment for which the maximum removal was obtained, demonstrating the usefulness of experimental designs involving surface response methodologies as valuable tools to optimize the independent variables and analyze the effect on the response variable.
The kinetics evaluation for the two systems showed an adequate fit of the intraparticle diffusion model, evidenced by the correlation coefficient R2 > 0.9661. The parameters α (related to the initial adsorption rate) and β (related to the activation energy of the chemisorption process) obtained from the Elovich model highlighted the decrease in the activation energy β in the initial adsorption process upon addition of GO to the beads; thus chemisorption interactions predominated in the adsorption mechanism. Similarly, the time required to remove FD&C Red 40 dye decreases when introducing the GO to the beads of CS-TiO2-GLA. Finally, the obtained removal results for CS-GO-TiO2-GLA beads suggest using these beads as possible candidates for removing neutral and cationic pollutants in water bodies with pH values reaching multiple levels of alkalinity and acidity since the GO improved the removal efficiency of the CS-TiO2-GLA beads (run 6 of the CCD) independently of the pH.

Supplementary Materials

The following are available online at https://www.mdpi.com/article/10.3390/app11209439/s1, Figure S1. Calibration curve for FD&C Red 40 dye measured at 500 nm. Table S1. Effect of contact time for the adsorption of FD&C Red 40 dye on the various adsorbents.

Author Contributions

Conceptualization, C.D.G.-T.; Data curation, M.A.S., J.G., W.V. and V.A.A.; Formal analysis, M.A.S., V.A.A. and C.D.G.-T.; Investigation, M.A.S., W.V. and C.D.G.-T.; Methodology, M.A.S., J.G., W.V. and C.D.G.-T.; Project administration, C.D.G.-T.; Resources, C.D.G.-T.; Supervision, W.V.; Validation, V.A.A.; Writing—original draft, M.A.S. and J.G.; Writing—review & editing, M.A.S., J.G., V.A.A. and C.D.G.-T. All authors have read and agreed to the published version of the manuscript.

Funding

This research was funded by la Vicerrectoria de Investigaciones of the Universidad del Atlántico (Project number CB92-TGI2018).

Institutional Review Board Statement

Not applicable.

Informed Consent Statement

Not applicable.

Data Availability Statement

Data available under request to the corresponding author.

Conflicts of Interest

The authors declare no conflict of interest.

References

  1. Alcocer, S.; Picos, A.; Uribe, A.R.; Pérez, T.; Peralta-Hernández, J.M. Comparative study for degradation of industrial dyes by electrochemical advanced oxidation processes with BDD anode in a laboratory stirred tank reactor. Chemosphere 2018, 205, 682–689. [Google Scholar] [CrossRef]
  2. Esteves, M.F.; Silva, J.D. Electrochemical degradation of reactive blue 19 dye in textile wastewater. In Proceedings of the 4th AUTEX World Textile Conference, Roubaix, France, 22–24 June 2004; pp. 1–6. [Google Scholar]
  3. Robinson, T.; Chandran, B.; Nigam, P. Removal of dyes from a synthetic textile dye effluent by biosorption on apple pomace and wheat straw. Water Res. 2002, 36, 2824–2830. [Google Scholar] [CrossRef]
  4. Weisburger, J.H. Comments on the history and importance of aromatic and heterocyclic amines in public health. Mutat. Res. Mol. Mech. Mutagen. 2002, 506–507, 9–20. [Google Scholar] [CrossRef]
  5. Alves de Lima, R.O.; Bazo, A.P.; Salvadori, D.M.F.; Rech, C.M.; de Palma Oliveira, D.; de Aragão Umbuzeiro, G. Mutagenic and carcinogenic potential of a textile azo dye processing plant effluent that impacts a drinking water source. Mutat. Res. Genet. Toxicol. Environ. Mutagen. 2007, 626, 53–60. [Google Scholar] [CrossRef]
  6. Wang, X.; Wang, Y.; Hou, H.; Wang, J.; Hao, C. Ultrasonic method to synthesize Glucan-g-poly(acrylic acid)/Sodium Lignosulfonate Hydrogels and Studies of Their Adsorption of Cu2+ from Aqueous Solution. ACS Sustain. Chem. Eng. 2017, 5, 6438–6446. [Google Scholar] [CrossRef]
  7. Gupta, V.K. Suhas Application of low-cost adsorbents for dye removal—A review. J. Environ. Manag. 2009, 90, 2313–2342. [Google Scholar] [CrossRef] [PubMed]
  8. Silva, T.L.; Ronix, A.; Pezoti, O.; Souza, L.S.; Leandro, P.K.T.; Bedin, K.C.; Beltrame, K.K.; Cazetta, A.L.; Almeida, V.C. Mesoporous activated carbon from industrial laundry sewage sludge: Adsorption studies of reactive dye Remazol Brilliant Blue R. Chem. Eng. J. 2016, 303, 467–476. [Google Scholar] [CrossRef]
  9. Kyzas, G.Z.; Bikiaris, D.N.; Lazaridis, N.K. Low-swelling chitosan derivatives as biosorbents for basic dyes. Langmuir 2008, 24, 4791–4799. [Google Scholar] [CrossRef] [PubMed]
  10. Lazaridis, N.K.; Kyzas, G.Z.; Vassiliou, A.A.; Bikiaris, D.N. Chitosan derivatives as biosorbents for basic dyes. Langmuir 2007, 23, 7634–7643. [Google Scholar] [CrossRef]
  11. Vakili, M.; Rafatullah, M.; Salamatinia, B.; Abdullah, A.Z.; Ibrahim, M.H.; Tan, K.B.; Gholami, Z.; Amouzgar, P. Application of chitosan and its derivatives as adsorbents for dye removal from water and wastewater: A review. Carbohydr. Polym. 2014, 113, 115–130. [Google Scholar] [CrossRef]
  12. Huang, X.-Y.; Bin, J.-P.; Bu, H.-T.; Jiang, G.-B.; Zeng, M.-H. Removal of anionic dye eosin Y from aqueous solution using ethylenediamine modified chitosan. Carbohydr. Polym. 2011, 84, 1350–1356. [Google Scholar] [CrossRef]
  13. Galan, J.; Trilleras, J.; Zapata, P.A.; Arana, V.A.; Grande-Tovar, C.D. Optimization of Chitosan Glutaraldehyde-Crosslinked Beads for Reactive Blue 4 Anionic Dye Removal Using a Surface Response Methodology. Life 2021, 11, 85. [Google Scholar] [CrossRef] [PubMed]
  14. Jawad, A.H.; Shazwani, N.; Mubarak, A.; Abdulhameed, A.S. Tunable Schiff & base-cross-linked chitosan composite for the removal of reactive red 120 dye: Adsorption and mechanism study. Int. J. Biol. Macromol. 2019, 142, 732–741. [Google Scholar] [PubMed]
  15. Naicker, C.; Nombona, N.; Zyl, W.E. Van Fabrication of novel magnetic chitosan/graphene-oxide/metal oxide nanocomposite beads for Cr (VI) adsorption. Chem. Pap. 2019, 74, 529–541. [Google Scholar] [CrossRef]
  16. Grande-Tovar, C.D.; Mangadlao, J.; Fan, J.; De Leon, A.; Delgado-Ospina, J.; Rojas, J.G.; Rodrigues, D.F.; Advincula, R. Chitosan Cross-Linked Graphene Oxide Nanocomposite Films with Antimicrobial Activity for Application in Food Industry. Macromol. Symp. 2017, 374, 1–8. [Google Scholar]
  17. Mohammad, A.; Saud, A.; Jawad, A.H. International Journal of Biological Macromolecules Box-Behnken design to optimize the synthesis of new cross-linked chitosan-glyoxal/TiO2 nanocomposite: Methyl orange adsorption and mechanism studies. Int. J. Biol. Macromol. 2019, 129, 98–109. [Google Scholar] [CrossRef]
  18. Marcano, D.C.; Kosynkin, D.V.; Berlin, J.M.; Sinitskii, A.; Sun, Z.; Slesarev, A.; Alemany, L.B.; Lu, W.; Tour, J.M. Improved Synthesis of Graphene Oxide. ACS Nano 2010, 4, 183–191. [Google Scholar] [CrossRef]
  19. Zapata, P.A.; Palza, H.; Delgado, K.; Rabagliati, F.M. Novel Antimicrobial Polyethylene Composites Prepared by Metallocenic In Situ Polymerization with TiO 2 -Based Nanoparticles. J. Polym. Sci. Part A Polym. Chem. 2012, 50, 4055–4062. [Google Scholar] [CrossRef]
  20. Mahshid, S.; Askari, M.; Ghamsari, M.S. Synthesis of TiO2 nanoparticles by hydrolysis and peptization of titanium isopropoxide solution. J. Mater. Process. Technol. 2007, 189, 296–300. [Google Scholar] [CrossRef]
  21. Grande-Tovar, C.D.; Castro, J.I.; Valencia, C.H.; Zapata, P.A.; Solano, A.M.; Lopez Florez, E.; Chaur, M.N.; Eliana, M.; Zapata, M.E.V.; Hernandez, J.H.M. Synthesis of Chitosan Beads Incorporating Graphene Oxide/Titanium Dioxide Nanoparticles for In Vivo Studies. Molecules 2020, 25, 2308. [Google Scholar] [CrossRef]
  22. Zhao, F.; Yu, B.; Yue, Z.; Wang, T.; Wen, X.; Liu, Z.; Zhao, C. Preparation of porous chitosan gel beads for copper (II) ion adsorption. J. Hazard. Mater. 2007, 147, 67–73. [Google Scholar] [CrossRef]
  23. Dhanya, A.; Aparna, K. Synthesis and Evaluation of TiO2/Chitosan Based Hydrogel for the Adsorptional Photocatalytic Degradation of Azo and Anthraquinone Dye under UV Light Irradiation. Procedia Technol. 2016, 24, 611–618. [Google Scholar] [CrossRef] [Green Version]
  24. Piccin, J.S.; Dotto, G.L.; Vieira, M.L.G.; Pinto, L.A.A. Kinetics and Mechanism of the Food Dye FD & C Red 40 Adsorption onto Chitosan. J. Chem. Eng. Data 2011, 56, 3759–3765. [Google Scholar]
  25. Dotto, G.L.; Moura, J.M.; Cadaval, T.R.S.; Pinto, L.A.A. Application of chitosan films for the removal of food dyes from aqueous solutions by adsorption. Chem. Eng. J. 2013, 214, 8–16. [Google Scholar] [CrossRef]
  26. Senthilkumaar, S.; Varadarajan, P.R.; Porkodi, K.; Subbhuraam, C.V. Adsorption of methylene blue onto jute fiber carbon: Kinetics and equilibrium studies. J. Colloid Interface Sci. 2005, 284, 78–82. [Google Scholar] [CrossRef] [PubMed]
  27. Angel, M.; Edison, G.; Izabela, D. Coagulation- flocculation sequential with Fenton or Photo-Fenton processes as an alternative for the industrial textile wastewater treatment. J. Environ. Manag. 2017, 191, 189–197. [Google Scholar]
  28. Saud, A.; Jawad, A.H.; Mohammad, A. Bioresource Technology Synthesis of chitosan-ethylene glycol diglycidyl ether/TiO2 nanoparticles for adsorption of reactive orange 16 dye using a response surface methodology approach. Bioresour. Technol. 2019, 293, 122071. [Google Scholar]
  29. Fan, L.; Luo, C.; Sun, M.; Qiu, H.; Li, X. Colloids and Surfaces B: Biointerfaces Synthesis of magnetic-cyclodextrin –chitosan/graphene oxide as nanoadsorbent and its application in dye adsorption and removal. Colloids Surf. B Biointerfaces 2013, 103, 601–607. [Google Scholar] [CrossRef]
  30. Bevziuk, K.; Chebotarev, A.; Snigur, D.; Bazel, Y.; Fizer, M.; Sidey, V. Spectrophotometric and theoretical studies of the protonation of Allura Red AC and Ponceau 4R. J. Mol. Struct. 2017, 1144, 216–224. [Google Scholar] [CrossRef]
  31. Salem, M.A.; Elsharkawy, R.G.; Ayad, M.I.; Elgendy, M.Y. Silver nanoparticles deposition on silica, magnetite, and alumina surfaces for effective removal of Allura red from aqueous solutions. J. Sol-Gel Sci. Technol. 2019, 91, 523–538. [Google Scholar] [CrossRef]
  32. Saha, T.K.; Bishwas, R.K.; Karmaker, S.; Islam, Z. Adsorption Characteristics of Allura Red AC onto Sawdust and Hexadecylpyridinium Bromide-Treated Sawdust in Aqueous Solution. ACS Omega 2020, 5, 13358–13374. [Google Scholar] [CrossRef]
  33. Sahraei, R.; Sekhavat Pour, Z.; Ghaemy, M. Novel magnetic bio-sorbent hydrogel beads based on modified gum tragacanth/graphene oxide: Removal of heavy metals and dyes from water. J. Clean. Prod. 2017, 142, 2973–2984. [Google Scholar] [CrossRef]
  34. Pan, Y.; Wu, T.; Bao, H.; Li, L. Green fabrication of chitosan films reinforced with parallel aligned graphene oxide. Carbohydr. Polym. 2011, 83, 1908–1915. [Google Scholar] [CrossRef]
  35. Fan, J.; Shi, Z.; Lian, M.; Li, H.; Yin, J. Mechanically strong graphene oxide/sodium alginate/polyacrylamide nanocomposite hydrogel with improved dye adsorption capacity. J. Mater. Chem. A 2013, 1, 7433–7443. [Google Scholar] [CrossRef]
  36. Konicki, W.; Aleksandrzak, M.; Moszyński, D.; Mijowska, E. Adsorption of anionic azo-dyes from aqueous solutions onto graphene oxide: Equilibrium, kinetic and thermodynamic studies. J. Colloid Interface Sci. 2017, 496, 188–200. [Google Scholar] [CrossRef] [PubMed]
  37. Crini, G.; Badot, P.-M. Application of chitosan, a natural aminopolysaccharide, for dye removal from aqueous solutions by adsorption processes using batch studies: A review of recent literature. Prog. Polym. Sci. 2008, 33, 399–447. [Google Scholar] [CrossRef]
  38. Sharma, P.; Singh, A.K.; Shahi, V.K. Selective Adsorption of Pb (II) from Aqueous Medium by Cross- linked Chitosan-Functionalized Graphene Oxide Adsorbent. ACS Sustain. Chem. Eng. 2018, 7, 1427–1436. [Google Scholar] [CrossRef]
  39. Mahaninia, M.H.; Wilson, L.D. Cross-linked chitosan beads for phosphate removal from aqueous solution. J. Appl. Polym. Sci. 2016, 133, 42949. [Google Scholar] [CrossRef]
  40. Yadollahi, M.; Farhoudian, S.; Barkhordari, S.; Gholamali, I.; Farhadnejad, H.; Bezar, H.M. Facile synthesis of chitosan/ZnO bio-nanocomposite hydrogel beads as drug delivery systems. Int. J. Biol. Macromol. 2015, 82, 273–278. [Google Scholar] [CrossRef]
  41. Yu, S.; Wang, X.; Ai, Y.; Liang, Y.; Ji, Y.; Li, J.; Hayat, T.; Alsaedi, A.; Wang, X. Spectroscopic and theoretical study on the counterion effect of Cu(II) ions and graphene oxide interaction with titanium dioxide. Environ. Sci. Nano 2016, 3, 1361–1368. [Google Scholar] [CrossRef]
  42. Saud, A.; Mohammad, A.; Jawad, A.H. Application of response surface methodology for enhanced synthesis of chitosan tripolyphosphate/TiO2 nanocomposite and adsorption of reactive orange 16 dye. J. Clean. Prod. 2019, 232, 43–56. [Google Scholar]
  43. Wang, H.; Shen, H.; Shen, C.; Li, Y.; Ying, Z.; Duan, Y. Kinetics and Mechanism Study of Mercury Adsorption by Activated Carbon in Wet Oxy-Fuel Conditions. Energy Fuels 2019, 33, 1344–1353. [Google Scholar] [CrossRef]
  44. Cheng, C.S.; Deng, J.; Lei, B.; He, A.; Zhang, X.; Ma, L.; Li, S.; Zhao, C. Toward 3D graphene oxide gels based adsorbents for high-efficient water treatment via the promotion of biopolymers. J. Hazard. Mater. 2013, 263, 467–478. [Google Scholar] [CrossRef]
  45. Madala, S.; Nadavala, S.K.; Vudagandla, S.; Boddu, V.M.; Abburi, K. Equilibrium, kinetics and thermodynamics of Cadmium (II) biosorption on to composite chitosan biosorbent. Arab. J. Chem. 2017, 10, S1883–S1893. [Google Scholar] [CrossRef] [Green Version]
  46. Ghaneian, M.T.; Bhatnagar, A.; Ehrampoush, M.H.; Amrollahi, M.; Jamshidi, B.; Dehvari, M.; Taghavi, M. Biosorption of hexavalent chromium from aqueous solution onto pomegranate seeds: Kinetic modeling studies. Int. J. Environ. Sci. Technol. 2017, 14, 331–340. [Google Scholar] [CrossRef]
  47. Li, Y.; Du, Q.; Liu, T.; Peng, X.; Wang, J.; Sun, J.; Wang, Y.; Wu, S.; Wang, Z.; Xia, Y.; et al. Comparative study of methylene blue dye adsorption onto activated carbon, graphene oxide, and carbon nanotubes. Chem. Eng. Res. Des. 2012, 91, 361–368. [Google Scholar] [CrossRef]
Figure 1. SEM morphology images for the nanocomposite beads CS-GLA: (A) 100×, (B) 500×, (C) 50,000×; CS-TiO2-GLA: (D) a 100×, (E) 500×, (F) 50,000× and CS-GO-TiO2-GLA: (G) a 100×, (H) 500×, (I) 50,000×.
Applsci 11 09439 g001
Figure 2. Three-dimensional response surface plot (A) and contour plot (B) of the removal efficiency of FD&C Red 40 dye.
Applsci 11 09439 g002
Figure 3. Adsorption kinetics fitted to the different models for FD&C Red 40 dye. (Initial dye concentration = 45 mg L−1; pH = 3.0; adsorbent dosage = 0.3 g; solution volume = 25 mL; stirring speed = 400 rpm; temperature 25 °C).
Applsci 11 09439 g003
Table 1. Different formulations for the nanocomposite beads prepared.
SystemFormulation
CS-GLAChitosan, glutaraldehyde
CS-TiO2-GLAChitosan, titanium dioxide nanoparticles, glutaraldehyde
CS-GO-TiO2-GLAChitosan, grapheme oxide, titanium dioxide nanoparticles, glutaraldehyde
Table 2. Independent variable ranges and levels for synthesis of CS-TiO2-GLA beads.
TiO2 (mg) (X1)Initial Dye Concentration (mgL−1) (X2)pH
(X3)
Code Levels
31.84.81.6−1.7
100153.0−1.0
200305.00.0
300457.01.0
368558.31.7
Table 3. Experimental design matrix and response matrix in the removal optimization of FD&C Red 40 dye with CS-TiO2-GLA beads.
RunTiO2 (mg)Initial Dye Concentration (mgL−1)pHRemoval Efficiency (%)
12
1100153.0100.0100.0
22004.85.0100.0100.0
3100157.090.083.6
4200305.072.077.2
5200308.3676.870.7
6300457.017.320.9
7300153.0100.0100.0
8200305.069.665.5
9100457.028.721.8
1020055.25.0100.092.3
11368.2305.055.369.9
1231.8305.071.870.9
13300157.054.364.8
14200301.6482.1100
15300453.0100.0100
16100453.099.999.8
Table 4. ANOVA results for the optimization of the removal efficiency of FD&C Red 40 dye with CS-TiO2-GLA beads.
FactorsSum of Squaresdf aMean SquareFValue-p b
A: TiO2332.351332.351.400.25
B: Red 401719.4611719.467.250.01
C: pH8333.4618333.4635.120.00
AA244.941244.941.030.32
AB111.091111.090.470.50
AC276.901276.901.170.30
BB1003.3211003.324.230.05
BC2578.1012578.1010.860.00
CC61.87161.870.260.61
Blocks13.06113.060.260.82
Total error4983.5821237.31
Total20.385.4031
R20.75
D2adj0.64
Adequate Precision8.56
a degree of freedom, b considered significant when p < 0.050.
Table 5. GO effect in the removal efficiency of FD&C Red 40 dye.
GO (wt.% Relative to TiO2)Run
CCD
Initial Dye Concentration (mg L−1)pHRemoval Efficiency (%)
1%6457.083.5
13157.098.5
15453.0100.0
3%6457.096.7
13157.099.3
15453.0100.0
10%6457.091.3
13157.098.2
15453.099.0
Table 6. Comparison of the removal efficiency of dye between the two adsorbent systems prepared (Amount of TiO2 for all beads was 300 mg and 3 wt.% GO relative to TiO2).
Run
CCD
Initial Dye Concentration (mg L−1)pHRemoval Efficiency (%)
CS-TiO2-GLACS-GO-TiO2-GLA
6457.017.396.7
13157.054.399.3
15453.0100.0100.0
Table 7. Swelling percentages of the nanocomposite beads.
BeadsSwelling (%)
Distilled WaterHCl 0.1 M
CS139.8Soluble
CS-GLA39.563.0
CS-TiO2-GLA36.274.3
CS-GO-TiO2-GLA33.744.9
Table 8. Calculated parameters of the different kinetic models for the adsorption of FD&C Red 40 dye on the two adsorbent systems.
Pseudo First Order
qe(mg·g−1)k1(min−1)R2
CS-TiO2-GLA2.050.0030.7823
CS-GO-TiO2-GLA4.960.0210.8979
Pseudo Second Order
qe(mg·g−1)k1(min−1)R2
CS-TiO2-GLA9.390.00010.6844
CS-GO-TiO2-GLA5.880.00130.9888
Elovich
β(mg·g−1)α(mg·g−1·min−1)R2
CS-TiO2-GLA1.220.05330.8225
CS-GO-TiO2-GLA1.010.14080.9504
Intraparticular Diffusion
CKi(mg·g−1·min1/2)R2
CS-TiO2-GLA−0.570.17210.9661
CS-GO-TiO2-GLA−0.230.27090.9828
Publisher’s Note: MDPI stays neutral with regard to jurisdictional claims in published maps and institutional affiliations.

