Article

Detoxification of Molasses and Production of Mycelial Mass and Valuable Metabolites by Morchella Species

by
Marianna Dedousi
1,
Katerina Fourtaka
1,2,
Eirini-Maria Melanouri
1,
Dimitrios Argyropoulos
3,
Charoula Psallida
3,
Ilias Diamantis
1,2,
Seraphim Papanikolaou
2 and
Panagiota Diamantopoulou
1,*
1
Laboratory of Edible Fungi, Institute of Technology of Agricultural Products (ITAP), Hellenic Agricultural Organization—Demeter, 1 Sofokli Venizelou Street, 14123 Lycovryssi, Attici, Greece
2
Laboratory of Food Microbiology and Biotechnology, Department of Food Science and Human Nutrition, Agricultural University of Athens, 75 Iera Odos Street, 11855 Athens, Greece
3
Genetic and Indetification Laboratory, Institute of Technology of Agricultural Products (ITAP), Hellenic Agricultural Organization—Demeter, 1 Sofokli Venizelou Street, 14123 Lycovryssi, Attici, Greece
*
Author to whom correspondence should be addressed.
Appl. Sci. 2021, 11(20), 9481; https://doi.org/10.3390/app11209481
Submission received: 17 September 2021 / Revised: 6 October 2021 / Accepted: 8 October 2021 / Published: 12 October 2021
(This article belongs to the Special Issue Bioactive Compounds by Higher and Lower Fungi)

Abstract

:
Edible wild ascomycetes Morchella rotunda, M. vulgaris and M. conica were cultivated in liquid static and agitated flasks of sucrose and molasses substrates with a C/N ratio of 20 and 25. The impact of four substrates on the production and quality characteristics of morels was examined. Evaluation included determination of the dry mycelial mass, intra-cellular (IPS) and extra-cellular (EPS) polysaccharides, total phenolic (TPC) and antioxidant (TAC) components, proteins, as well as the degree of phenolic content reduction and decolorization of molasses. The influence of agitation conditions was also evaluated. Results showed that substrate consumption, biomass formation and secondary metabolites production were substrate, species, and C/N ratio dependent. Among species, M. conica achieved the maximum biomass (18.16 g/L) and IPS (4.8 g/L) production and significant phenolic reduction (56.6%) and decolorization (26.7%). The maximum EPS (3.94 g/L) was noted by M. rotunda, whereas TPC (32.2 mg/g), TAC (6.0 mg/g) and cellular protein (7.6% w/w) were produced in sufficient amounts. These results strongly support the use of Morchella mushrooms as a biological detoxification agent of molasses in liquid fermentations and indicate their nutritional and medicinal value.

1. Introduction

Edible fungi consumed fresh or processed are becoming more and more vital in the human diet due to their unique dietary and medical properties. High carbohydrate, protein, low-fat content and the composition of dietary fiber along with the taste and aroma make edible mushrooms an ideal source of nutrition, rich in minerals and vitamins [1,2,3,4,5]. Furthermore, edible mushrooms are characterized by antitumor, cardiovascular, anti-inflammatory and anti-allergenic properties due to their variety of secondary metabolites in their fruiting bodies including polysaccharides, phenolic compounds and antioxidants [6,7]. Morels (Morchella spp., Pezizales, Ascomycota) are among the most known edible wild ascomycetes and they have attracted research interest due to their commercial value, medicinal properties, and unique taste and flavor [8]. Their habitat in combination with various biochemical pathways and the mycelial mass are responsible for their appearance, mainly their black or yellow color [9], which also affects their growth and metabolite production [10]. The difficulties on the cultivation of morels in lignocellulosic wastes like saprophytic mushroom species (e.g., Pleurotus spp.) have led some researchers on their growth in liquid cultures aiming at the production of edible mycelium and the synthesis of secondary metabolites like polysaccharides, proteins, lipids, etc. [10,11,12,13]. Particularly of wild mushrooms Morchella, could be considered as a rapid and alternative process to produce abundant, high-quality fungal biomass and secondary metabolites (polysaccharides, phenolic compounds, antioxidant and protein components) that could be used in the food and medicine industry [14]. In parallel, valorization of important agro-industrial renewable resources as substrates could satisfy such needs along with positive environmental impact by achieving their detoxification. Liquid agro-industrial waste streams such as molasses, olive-mill wastes bio-diesel derived glycerol could be used as a potential substrate for mycelial mass and valuable metabolites production [13,15,16,17]. Especially, molasses, the liquid agro-industrial waste streams from the sugar treatment contain the dark-brown-colored, high molecular weight polymer melanoidin and its release into the environment without appropriate previous treatment, may lead to inhibition of seed germination and depletion of vegetation by reducing the soil alkalinity and manganese availability and when discharged to water may cause eutrophication phenomena [18,19]. According to literature results in submerged cultures, the production of mycelial mass, the secondary metabolites, as well as substrate consumption are largely affected by multiple cultivation parameters, including the medium composition (carbon and nitrogen sources used, C/N ratio) [17,20,21,22,23], cultivation conditions (temperature, pH, agitation) [23,24,25,26,27] and also the type of species [10,21].
The aim of the current study was to achieve detoxification (phenolic content reduction and decolorization) of the molasses contained in the nutrient substrate of the submerged cultures and due to their high content in sugars to examine their effect on the cell growth of the edible wild ascomycetes Morchella, along with the production of intracellular (endopolysaccharides, total phenolic and antioxidant components, protein compound) and extracellular (exopolysaccharides) compounds of high nutritional, medicinal and gastronomical value. The effect of agitation (or non-agitation) conditions and of different C/N ratios upon the kinetic behavior of three Morchella species was also assessed.

2. Materials and Methods

2.1. Fungal Species, Substrates and Culture Conditions

The mushroom species were deposited at the Athens Mushroom Research Laboratory (AMRL) fungal culture collection of the Laboratory of Edible Fungi (ITAP). Three ascomycetes, two species of the yellow morels, Morchella rotunda strain AMRL 12, M. vulgaris strain AMRL 36 and one of the black morels, M. conica strain AMRL 78 were used in the experiments. Species were maintained in potato dextrose agar (PDA; Merck, Darmstadt, Germany) at 5 ± 0.5 °C.
The principal carbon source utilized in growing media was beet molasses (M; Hellenic Industry of Sugar S.A., Orestiada, Greece) or sucrose (S; control cultures, Merck, Darmstadt, Germany), as this sugar constitutes 50% of the total sugars in molasses. The nitrogen sources used in the experiments were yeast extract (Fluka, Steinheim, Germany) and peptone (Merck, Darmstadt, Germany). To compare the impact of different molasses/sucrose concentrations on fungal growth, two C/N ratios were determined, by calculating the total amount of carbon and nitrogen so that a final C/N ratio = 20 (the most common for mushroom cultivation) [13,28,29] be applied. Further experiments were conducted on higher carbohydrate concentration and C/N = 25. The initial total sugars concentration (TS) of the culture media with C/N = 20 was (in g/L): sucrose 17 (S-20), molasses 53.41 (M-20; TS0 = 22 g/L) and for these with ratio C/N 25 was (in g/L): sucrose 20 (S-25), molasses 89.02 (M-25; TS0 = 41 g/L). By mixing the above-mentioned raw material with the appropriate quantity of nitrogen source and water, media having C/N molar ratios of 20 and 25 were prepared. The initial pH for all media after sterilization (121 ± 1 °C, 20 min) was 6.5–7.0.
Either static (surface) or agitated (submerged) cultures were performed in 100 mL Erlenmeyer flasks containing 30 ± 1 mL of growth medium. Flasks were autoclaved for 20 min at 121 ± 1 °C, allowed to cool and inoculated with 9 mm agar plugs cut from a growing colony in a PDA Petri dish, aged 5–10 days depending on the fungus [30]. Agitation took place at 120 ± 5 rpm in a rotary shaker (ZHICHENG ZHWY 211B, Shanghai, China). The incubation temperature was 26 ± 1 °C. Sampling every 2–7 days depending on the substrate consumption was conducted.

2.2. Analytical Methods

2.2.1. Characteristics and Specifications of Molasses

The physicochemical composition of molasses used in these experiments was determined by the following measurements which contributed to the final C/N ratio of the substrates. For moisture, a specific quantity of sample weighed on a four-digit balance (Kern AGB, Breisgau, Germany), it was dried at 105 ± 1 °C (Elvem, Athens, Greece) and after reaching the ambient temperature, it was weighed again. The difference in weight was the moisture content of the sample. Total nitrogen was determined according to the Kjeldahl method (total Kjeldahl nitrogen, TKN) [31], which expresses the sum of the organic and ammoniacal nitrogen of molasses. According to Sparks et al. [32], organic matter is calculated by the method of loss on ignition (LOI). Total sugars-TS (g/L) were determined according to [33] and were expressed as glucose equivalents according to 3.5-dinitrosalicylic acid (DNS) assay [34]. Phenolic compounds were determined using the Folin–Ciocalteu (FC) method, as described by Slinkard and Singleton [35] and was measured at 760 nm. Total phenolic compounds (TPC, g/L) were expressed as gallic acid equivalents per liter of molasses. A Crison (Barcelona, Spain) GLP 21 pH-meter was used for pH measurements. Volumetric roller and a four-digit balance (Kern AGB, Germany) were used for molasses density.

2.2.2. Broth and Mycelial Analyses

A Crison (Barcelona, Spain) GLP 21 pH-meter was used for pH measurements. Mycelial mass was collected by filtration under vacuum (using No.2 Whatman filters, Buckinghamshire, UK), washed twice with distilled water and dried at 60 ± 2 °C until constant weight. Dry weight (X, g/L) was gravimetrically determined. Total consumed sugars (TScon, g/L) were determined in the same way of molasses TS above and were expressed as glucose equivalents per liter. Free amino nitrogen (FAN, mg/L) concentration was determined according to Lie [36] and was expressed as ninhydrin equivalents.
Regarding exopolysaccharides concentration (EPS, g/L), it was assayed as follows: the culture filtrate was mixed with four volumes of 95% v/v ethanol (Merck) and maintained at 4 ± 0.5 °C for 12 h to precipitate the crude polysaccharides. The precipitated EPS was collected by centrifugation (6000 rpm, 20 min, 4 ± 0.5 °C; Micro 22R, Hettich, Kirchlengern, Germany) and the supernatant was discarded. The precipitate of EPS was then dried at 50 ± 1 °C to remove residual ethanol and the EPS content was determined by phenol-sulphuric acid assay according to Dubois et al. [37] and expressed as glucose equivalent [38]. Total concentration of endopolysaccharides (IPS, g/L and %, w/w) was determined according to Diamantopoulou et al. [29] and Liang et al. [39] and was expressed as glucose equivalents. The composition of IPS was examined by HPLC as described by Diamantopoulou et al. [29]; filtered aliquots of the neutralized liquid containing the hydrolyzed polysaccharides were analyzed by a Waters Association 600E apparatus at a 30.0 cm × 7.8 mm column Aminex HPX-87H (Bio-Rad, Hercules, CA, USA). The mobile phase used was H2SO4 at 0.005 M with a flow rate of 0.6 mL/min and the column temperature was 65 ± 1 °C. Sugars and polyols were detected by a RI detector (differential refractometer 410-Waters).
To extract the total phenolic (TPC, mg/g) and antioxidant (TAC, mg/g) compounds, 50 mg of fresh colonized substrate were extracted with 1 mL of methanol using an ultrasonic bath (15 min, room temperature) followed by vortex and centrifugation (3500 rpm, 15 min, ambient temperature; Micro 22R, Hettich, Kirchlengern, Germany). The same extraction was repeated three times and the supernatants were used for further analysis, stored at 4 ± 0.5 °C. TPC was determined using the FC method [35] and was expressed as mg of gallic acid equivalents per g of dry biomass. Furthermore, the scavenging ability on DPPH• free radicals is used to estimate antioxidant activity according to Bondet et al. [40], Molyneux et al. [41] and Musa et al. [42]. Another method to measure the antioxidant activity was the scavenging activity of ABTS˙+ radical, 2.2-azino-bis(3-ethylbenzothiazoline-6-sulfuric acid) according to Re et al. [43] with some modifications. TAC was expressed as mg of Trolox equivalents per g of dry biomass and %, w/w. The crude protein content was extracted from the dry biomass with ethylenediaminetetraacetic acid (EDTA), was determined using the Bradford method [44] and was expressed as mg of bovine serum albumin (BSA) equivalents per g of dry biomass and %, w/w. The phenolic content reduction in the culture media was determined according to the FC method measured at 760 nm and expressed as gallic acid equivalent. The reduction of medium color was performed according to Sayadi and Ellouz [45] protocol. In order to determine the percentage of phenolic compounds’ reduction and decolorization of molasses waste, the concentration of phenolic compounds and color absorption values measured each day, species (M. rotunda, M. vulgaris, M. conica) and culture method (static or agitated) in sucrose substrates (blank experiments in which no molasses had been added) were subtracted from the corresponding values of molasses medium.
Within experiments, three non-agitated and three agitated flasks were used to generate each data point. In the tables, values are given as the mean and the standard deviations are calculated (also depicted as error bars in figures).

3. Results and Discussion

3.1. Beet Molasses

Data concerning characteristics and specifications of molasses used in experiments of this study are shown in Table 1. The most important characteristic was TS that ranged between 510–530 g/L and a total phenolic compound of 33.25 g/L.

3.2. Biomass Production, Sugars and Nitrogen Consumption

Kinetic data for total sugars and nitrogen assimilation and the biomass increase of Morchella species as a function of time at the four substrates with different carbon sources and C/N ratio (S-20, S-25, M-20, M-25), agitated or not, is presented in Table 2a–c. Biomass (X, g/L) production was significantly enhanced when Morchella species were cultivated on molasses. Although the main component of molasses is sucrose, its effect on mycelium synthesis was weaker than that of molasses, probably due to its various nutrients (macronutrients, trace elements) other than sucrose [13,46], as the Xmax values in sucrose substrates were 7.29–12.15 g/L when in molasses they were as high as 12.01–18.16 g/L. In addition, all Xmax values were recorded in agitated cultures on the last day of fermentation. Likewise, agitation favored biomass formation for the tested ascomycetes to a greater or lesser degree, in combination with the substrate, C/N ratio and kind of species (Table 2a–c). These results are in agreement with the perception that aeration favors mycelial growth in liquid media [28,47,48,49]. Diamantopoulou et al. [28] indicated that Morchella elata (black morel) achieved Xmax value 7.1 g/L at the 20th day of agitated culture in glucose-based media (C/N ~20; Glc0 = 30 g/L), instead of 5.2 g/L in static culture. Also, when Morchella esculenta (yellow morel) was cultivated in glucose substrate (C/N ~20; Glc0 = 30 g/L), agitation presented a small positive effect on produced Xmax values (13.59 g/L), compared with static culture (12.70 g/L) [29]. Concerning the difference between yellow and black morels, the species which achieved the highest Xmax values on four substrates was the black one, M. conica (10.85 g/L; S-20, 12.15 g/L; S-25, 18.16 g/L; M-20, 18.10 g/L; M-25). Results of Kaul et al. [21] in cultures with different carbon sources were similar, as yellow morels (M. esculenta and M. angusticeps) produced less biomass than black species (M. crassipes and M. conica). In parallel, Xing et al. [50] reported high biomass production (12.6 g/L) by the black morel M. conica grown on a synthetic sucrose-based medium. Between yellow morels, M. vulgaris produced the second highest Xmax values (8.40 g/L; S-20, 11.05 g/L; S-25, 16.81 g/L; M-20, 16.92 g/L; M-25), following by M. rotunda (7.95 g/L; S-20, 9.69 g/L; S-25, 16.15 g/L; M-20, 16.27 g/L; M-25). According to Papadaki et al. [10], yellow (M. vulgaris, M. crassipes) and black (M. elata, M. conica) morels were cultivated in batch cultures under static conditions in glucose substrate (Glc0 = 30 g/L) and the produced biomass was between 9.3–11.1 g/L for the yellow morels and 9.4–14.2 g/L for the black ones, identical values obtained in the present experiments.
As for the C/N ratio, its raise from 20 to 25 had a positive effect in X formation and TS consumption for sucrose substrates, either agitated or not. Xmax values in S-20 were from 7.29 to 10.85 g/L and 80.5–99.5% of TScon, whereas in S-25 were observed higher Xmax values, 7.39–12.15 g/L and TScon rates show little or no further increase, 82.1–99.5%. On the contrary, in molasses substrates, X production was reduced at C/N = 25 (12.01–14.45 g/L) compared to the trials with C/N = 20 in static cultures (13.46–16.02 g/L). Also, between Xmax values in agitated cultures of M-20 (16.15–18.16 g/L) and M-25 (16.27–18.10 g/L) presented almost no or small growth, dependent on species (Table 2a–c). Similarly, Sarris et al. [13] indicated a significant reduction in X production and TS consumption at C/N = 50 compared to the trials with C/N = 20 for static cultures of M. elata in molasses substrates. In our cultures, although notable X production ocurred in M-25, a significant portion of substrate remained unconsumed, as TS assimilation reached 59.0–80.3%. As it turns out, the increase in the initial concentration of total sugars in the molasses substrates, from 22 g/L (C/N = 20; M-20) to 41 g/L (C/N = 25; M-25) did not push the species to consume higher percentages of sugars. The trend of decreasing substrate consumption (up to 25.2%) in increasing initial sugars concentration could be attributed to possible substrate inhibition due to increased sugar quantities—high osmotic pressure of the culture substrate that resulted in metabolic shift and partial utilization of the assimilated sugars for requirements of energy maintenance. A similar trend has been also reported by Diamantopoulou et al. [17] in glucose-based shake-flask cultures of Volvariella volvacea, in glucose agitated cultures of Coprinus comatus [51], in fermentations of Ganoderma lucidum in glucose or lactose in shake-flasks and batch bioreactors [25,52], during Tuber sinense fermentation in a sucrose-based medium under agitation [53], as well as in other higher or lower fungi cultivated on several agro-industrial residues or renewable resources in shake-flask experiments [54]. Besides, the high biomass yield on sugars consumed YX/S (g/g) values achieved by three Morchella species, (e.g., ≥0.5 g/g and in some cases up to 0.8 g/g) indicate the potentiality for bio-valorization and de-pollution of sugar-rich residues or wastes for the production of nutritious fungal biomass.
Concerning FAN consumption, the three Morchella species consumed the highest percentage of them, regardless of the type of culture. In detail, Morchella species consumed almost the whole quantity of initial FAN, up to 95.0% in sucrose substrates, whereas slightly lower reduction rates were observed in molasses substrates (85.0–94.1%; M-20, 68.8–85.8%; M-25). Similar results have been also reported by Haque et al. [55] in glucose-based cultures of Monascus purpureus. The lower FAN consumption rates in molasses media are probably due to their higher initial nitrogen concentration (expressed in glycine equivalents). In addition, nitrogen is the second most important nutrient in fungal fermentations, as it is essential for cellular metabolism. Macrofungi choose initially to consume carbon sources to control their energy needs (which were in larger amounts in molasses nutrients) and then the nitrogen sources.

3.3. Extracellular Polysaccharides Production

Data concerning the EPS production are given in Table 2a–c. EPS were synthesized in various amounts, with the maximum values ranging between 0.3–1.2 g/L (sucrose substrates; S-20, S-25) and 0.95–3.94 g/L (molasses substrates; M-20, M-25). Comparing EPS biosynthesis performed in the different media, it seems that the most suitable substrates for all Morchella species were those with molasses addition. It is worth mentioning that EPS produced by Morchella species in molasses substrate with the highest C/N ratio (M-25) reached the greatest concentration of 3.0–4.0 g/L. There are reports stating that a high C/N ratio enhances EPS production by means of supplying to the culture higher concentrations of carbon source. Lower EPS values were recorded by Sarris et al. [13] when M. vulgaris and M. elata were cultivated on molasses (1.17, 1.61 g/L), rice cereal hydrolysate (1.67, 2.17 g/L) and wheat cereal hydrolysate (0.59, 1.34 g/L) with ratio C/N = 20 and when they were examined on the same substrates with C/N ratio = 50, EPS accumulation by M. elata was two-fold higher suggesting that its raise enhanced this process, as in this research. On the contrary, in sucrose substrates, the C/N ratio raise led to a slight drop. As about agitation, it had no significant effect upon EPS production as also Diamantopoulou et al. [28,29] reported for M. elata (0.80 g/L; static, 1.06 g/L; agitated) and M. esculenta (0.70 g/L; static, 0.65 g/L; agitated) EPS production on glucose substrate (C/N ~20; Glc0 = 30 g/L).
Additionally, higher EPS quantities were synthesized at the relatively early growth phase (5th–12th day after inoculation), suggesting that the concentration of EPS was remarkably reduced as the fermentation proceeded, with the notable exception of M. rotunda and M. vulgaris in molasses substrates which EPS production was higher at the last day of fermentation. As at the early growth stages the biomass production is limited and sugars concentration rather high, this EPS reduction probably happened due to bio-degradation of previously produced EPS compounds. This phenomenon on liquid cultures has been also detected in other studies for many mushroom fungi including Morchella spp. EPS of the basidiomycetes Flammulina velutipes, Ganoderma applanatum, Pleurotus pulmonarius and ascomycota M. esculenta were produced at an early growth phase (8th–12th day after inoculation) and they were notably reduced as the fermentation proceeded [29]. M. esculenta EPS production was the fastest between the 2nd and 3rd day of incubation, after the third day of incubation their increase showed a reduction in total EPS concentrations [56]. Also, M. vulgaris and M. elata presented higher EPS synthesis on the 8th day after inoculation, but the amount of EPS was reduced at the 14th day after inoculation, on all used substrate (glucose, molasses and waste flour-rich hydrolysates) [13].

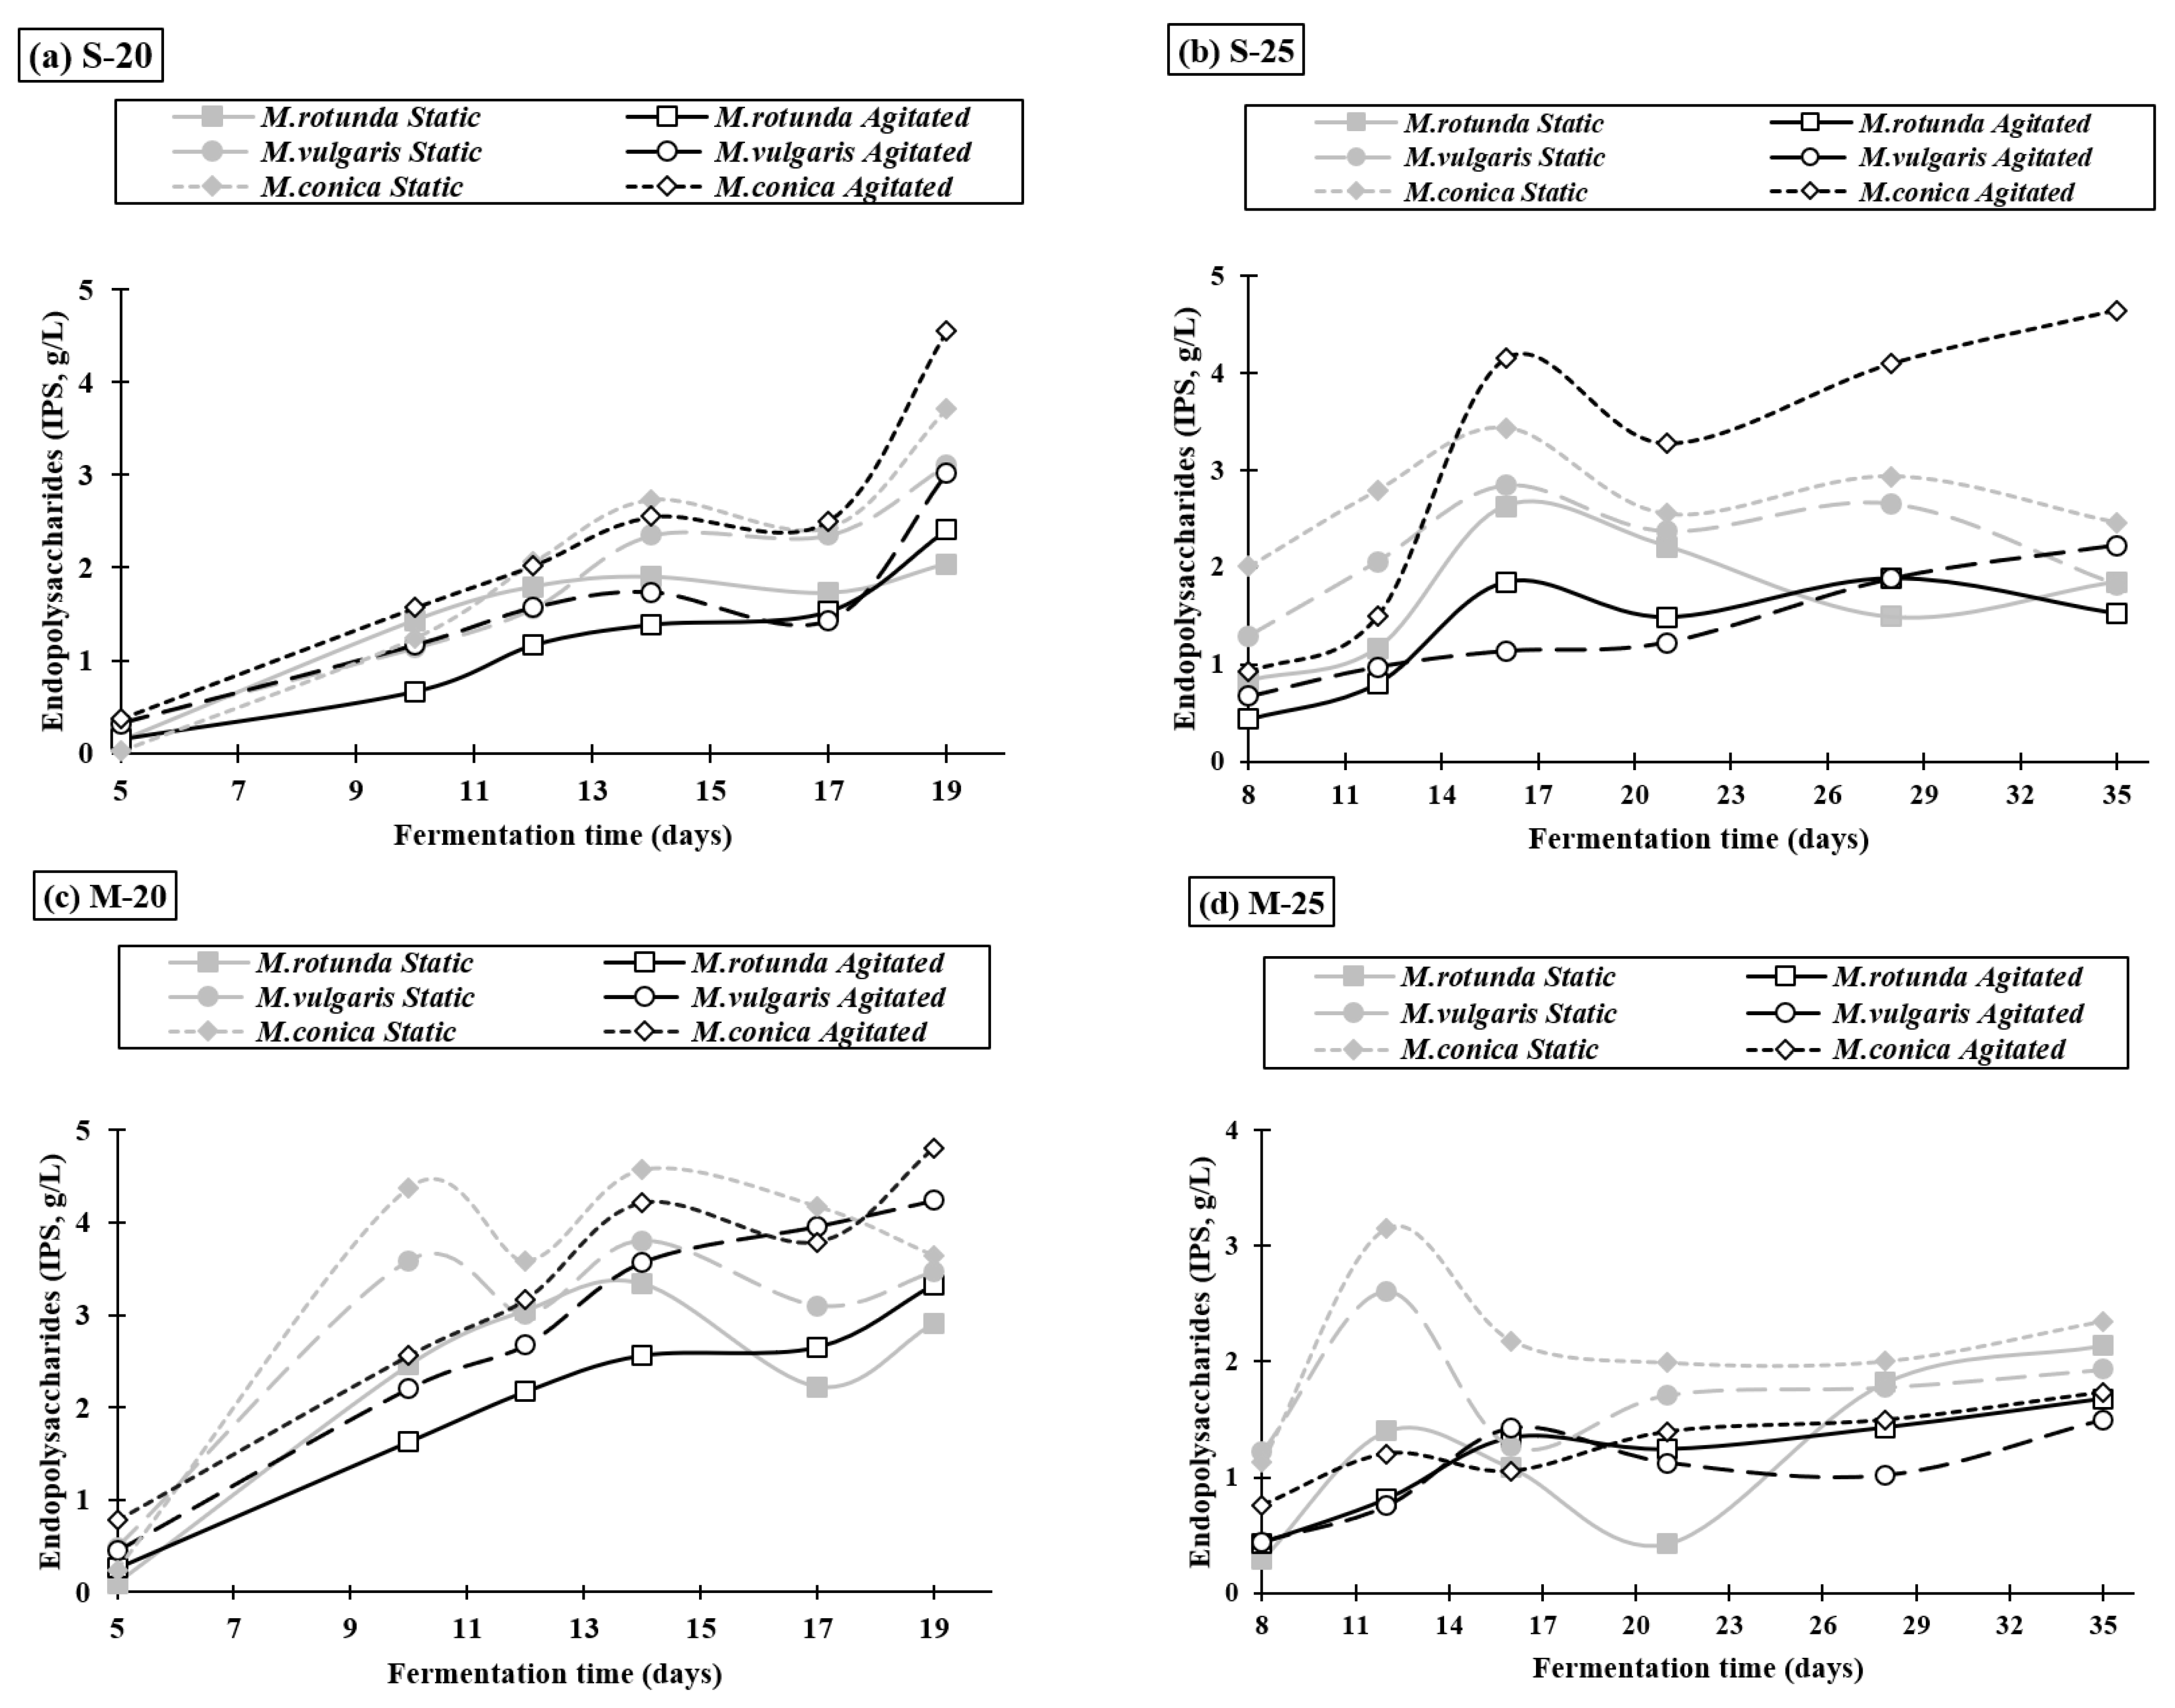
3.4. Intracellular Polysaccharide Synthesis and Composition

The data given in Table 2a–c demonstrate the highest values of cellular carbohydrates in both absolute (g/L) and relative (%, w/w) values. IPS values (in g/L and %, w/w) constantly increased as a function of the fermentation time for Morchella species when they were cultivated on S-20 (Figure 1a), both in static and agitated cultures and agitation seemed to have a positive impact. Even so, the kinetic profiles of produced IPS absolute values on S-25, M-20, M-25 (Figure 1b–d, respectively) showed that there was a notable difference between agitated and static cultures, as IPS constantly increased until the end of the fermentation on agitated flasks, whereas a reduction in the IPS (g/L) values was detected towards the end of static cultures. This fact showed that agitation may contribute to the adequate supply of nutrients to cells and facilitated the removal of gases and other by-products of catabolism from the microenvironment of cells until the end of the fermentation [57]. Moreover, agitation also had positive or no impact upon the biosynthesis of IPS on these substrates, depending on species and kind of substrate. Most of the highest relative IPS values (%, w/w) were observed in the intermediate days of cultivation. Among species, M. conica achieved the highest values in all nutrition media (4.8 g/L; M-20, 4.6 g/L; S-20 and S-25, 3.1 g/L; M-25), corresponding to quantities up to 21% and even reached 51.8%, w/w of IPS in dry mycelial mass-produced. The most suitable medium for fungal IPS production was molasses substrate M-20, but when the C/N ratio increased (M-25) there was a significant decrease in IPS production (in both g/L and %, w/w values). Lee et al. [58] showed that an increase in the (C/N) ratio of the medium caused the reduction of IPS concentration in the media.
In the current investigation, the results concerning the high amounts of IPS achieved reflect the high ability of Morchella polysaccharide synthesis and the potential to be used as functional foods. The concentration of IPSmax produced by Morchella species in both agitated and static- flask cultures (2.0–4.6 g/L and ~28–44%; S-20, 3.3–4.8 g/L and ~20–35%; M-20, 1.8–4.6 g/L and ~26–52%; S-25, 1.5–3.1 g/L and ~17–33%; M-25) may be compared with those reported in the literature; the yellow morel M. esculenta produced IPSmax quantities of ~3.8 g/L in glucose-based static and shake-flask cultures proving that they were not significantly affected by agitation [29]. This is very interesting as mushroom polysaccharides. Also, G. applanatum in shake-flasks sucrose-based cultures presented IPSmax concentration of 1.5% [58], while Cordyceps pruinosa on media composed of molasses in shake-flasks produced IPSmax quantities of ~5 g/L [59]. In contrast, when Diamantopoulou et al. [17] cultivated V. volvacea in a glucose-based medium under agitation, the amount of IPS presented a three-fold decrease by the end of cultivation and the highest value was 5.49 g/L (C/N = 20).
The carbohydrate composition of IPS depends on the growth medium and it could be changed by manipulating submerged culture’s factors [17]. So, in this study, not only the medium used, but also different species, the impact of agitation and the influence of initial sugars’ concentration on the composition of IPS were investigated. IPS composition during fungi cultivation seemed to increase or decrease depending on strain and agitation imposed (Table 3) and in all cases, glucose was the most abundant individual sugar identified and quantified in the produced polysaccharides (40–70%, w/w). Mannitol was found in equal or smaller quantity than glucose (20–41%, w/w), whereas fructose was detected in relatively small concentrations (up to 10%, w/w). The only exception was the cultivation of M. rotunda on agitated culture of M-25 where mannitol was detected in the highest quantity (43%, w/w), following glucose (37%, w/w) and fructose (20%, w/w). Similarly with the data of this study, glucose was the most abundant carbohydrate in the mycelium of M. esculenta [29,60] and other mushrooms; G. applanatum [29,58], P. pulmonarius [29,61] and Agrocybe aegerita, F. velutipes [29]. Likewise, Diamantopoulou et al. [29] indicated that mannitol was produced in significant amounts in M. esculenta, compared to other species that produced more fructose. Glucose was the principal monosaccharide detected in the mycelia of Morchella species regardless of the carbon source utilized, sucrose or molasses. Furthermore, with an increased C/N ratio, glucose percentage decreased and fructose percentage increased, those of mannitol decreased in static cultures and increased in agitated cultures.

3.5. Removal of Phenolic Compounds–Decolorization

Morchella species reduced satisfactory phenolic compounds of molasses. The overall maximum reduction ranged between 22.6–56.6% for M-20 (C/N = 20; 53.41 g/L molasses) and between 26.4–49.6% for M-25 (C/N = 25; 89.02 g/L molasses; Figure 2). The most capable species were M. conica followed by M. rotunda and at last M. vulgaris. In general, agitation enhanced the phenolic compounds’ reduction. Regarding the ability of Morchella species in decolorization of molasses content, only M. conica in M-20 achieved it by 26.7% in static culture and 20.3% in the corresponding agitated culture, while in M-25, which contained a larger amount of waste, decolorization was not achieved. This lower (or no) percentage of color removal suggests the occurrence of another type of compound, different from the phenols that are not eliminated by the fungi assayed [62]. Compared to other studies, basidiomycete Flavodon flavus removed 70% of the color from raw molasses spent wash, used at 10% concentration and when its concentration increased to 50%, w/w, about 60% decolorization was achieved [63]. Jiménez et al. [62] carried out aerobic degradation of beet molasses (wastewater diluted to 50%) in shaking-flasks using Penicillium sp., Penicillium decumbens, Penicillium lignorum and Aspergillus niger. Phenolic compounds’ removal was similar for the four microorganisms, P. decumbens showing a maximum value of 74% after three days of treatment. The highest decolorization was achieved 4th–5th day of treatment, with P. decumbens achieving the best results, 41% after four days of treatment. The ability of Saccharomyces cerevisiae MAK-1 to detoxify blends of molasses and olive mill wastewaters under aerated and non-aerated conditions was studied by Sarris et al. [64]. Noticeable decolorization, 60% and moderate removal of phenolic compounds up to 28% was observed. The results of this study are very interesting as there are no studies in which Morchella species were used to examine the reduction of wastes’ pollutant load (reduction of phenolic compounds and decolorization) and in particular in nutrient media with molasses. Also, most of the studies used molasses after great dilution, but in our experiments, they were used in high concentrations.

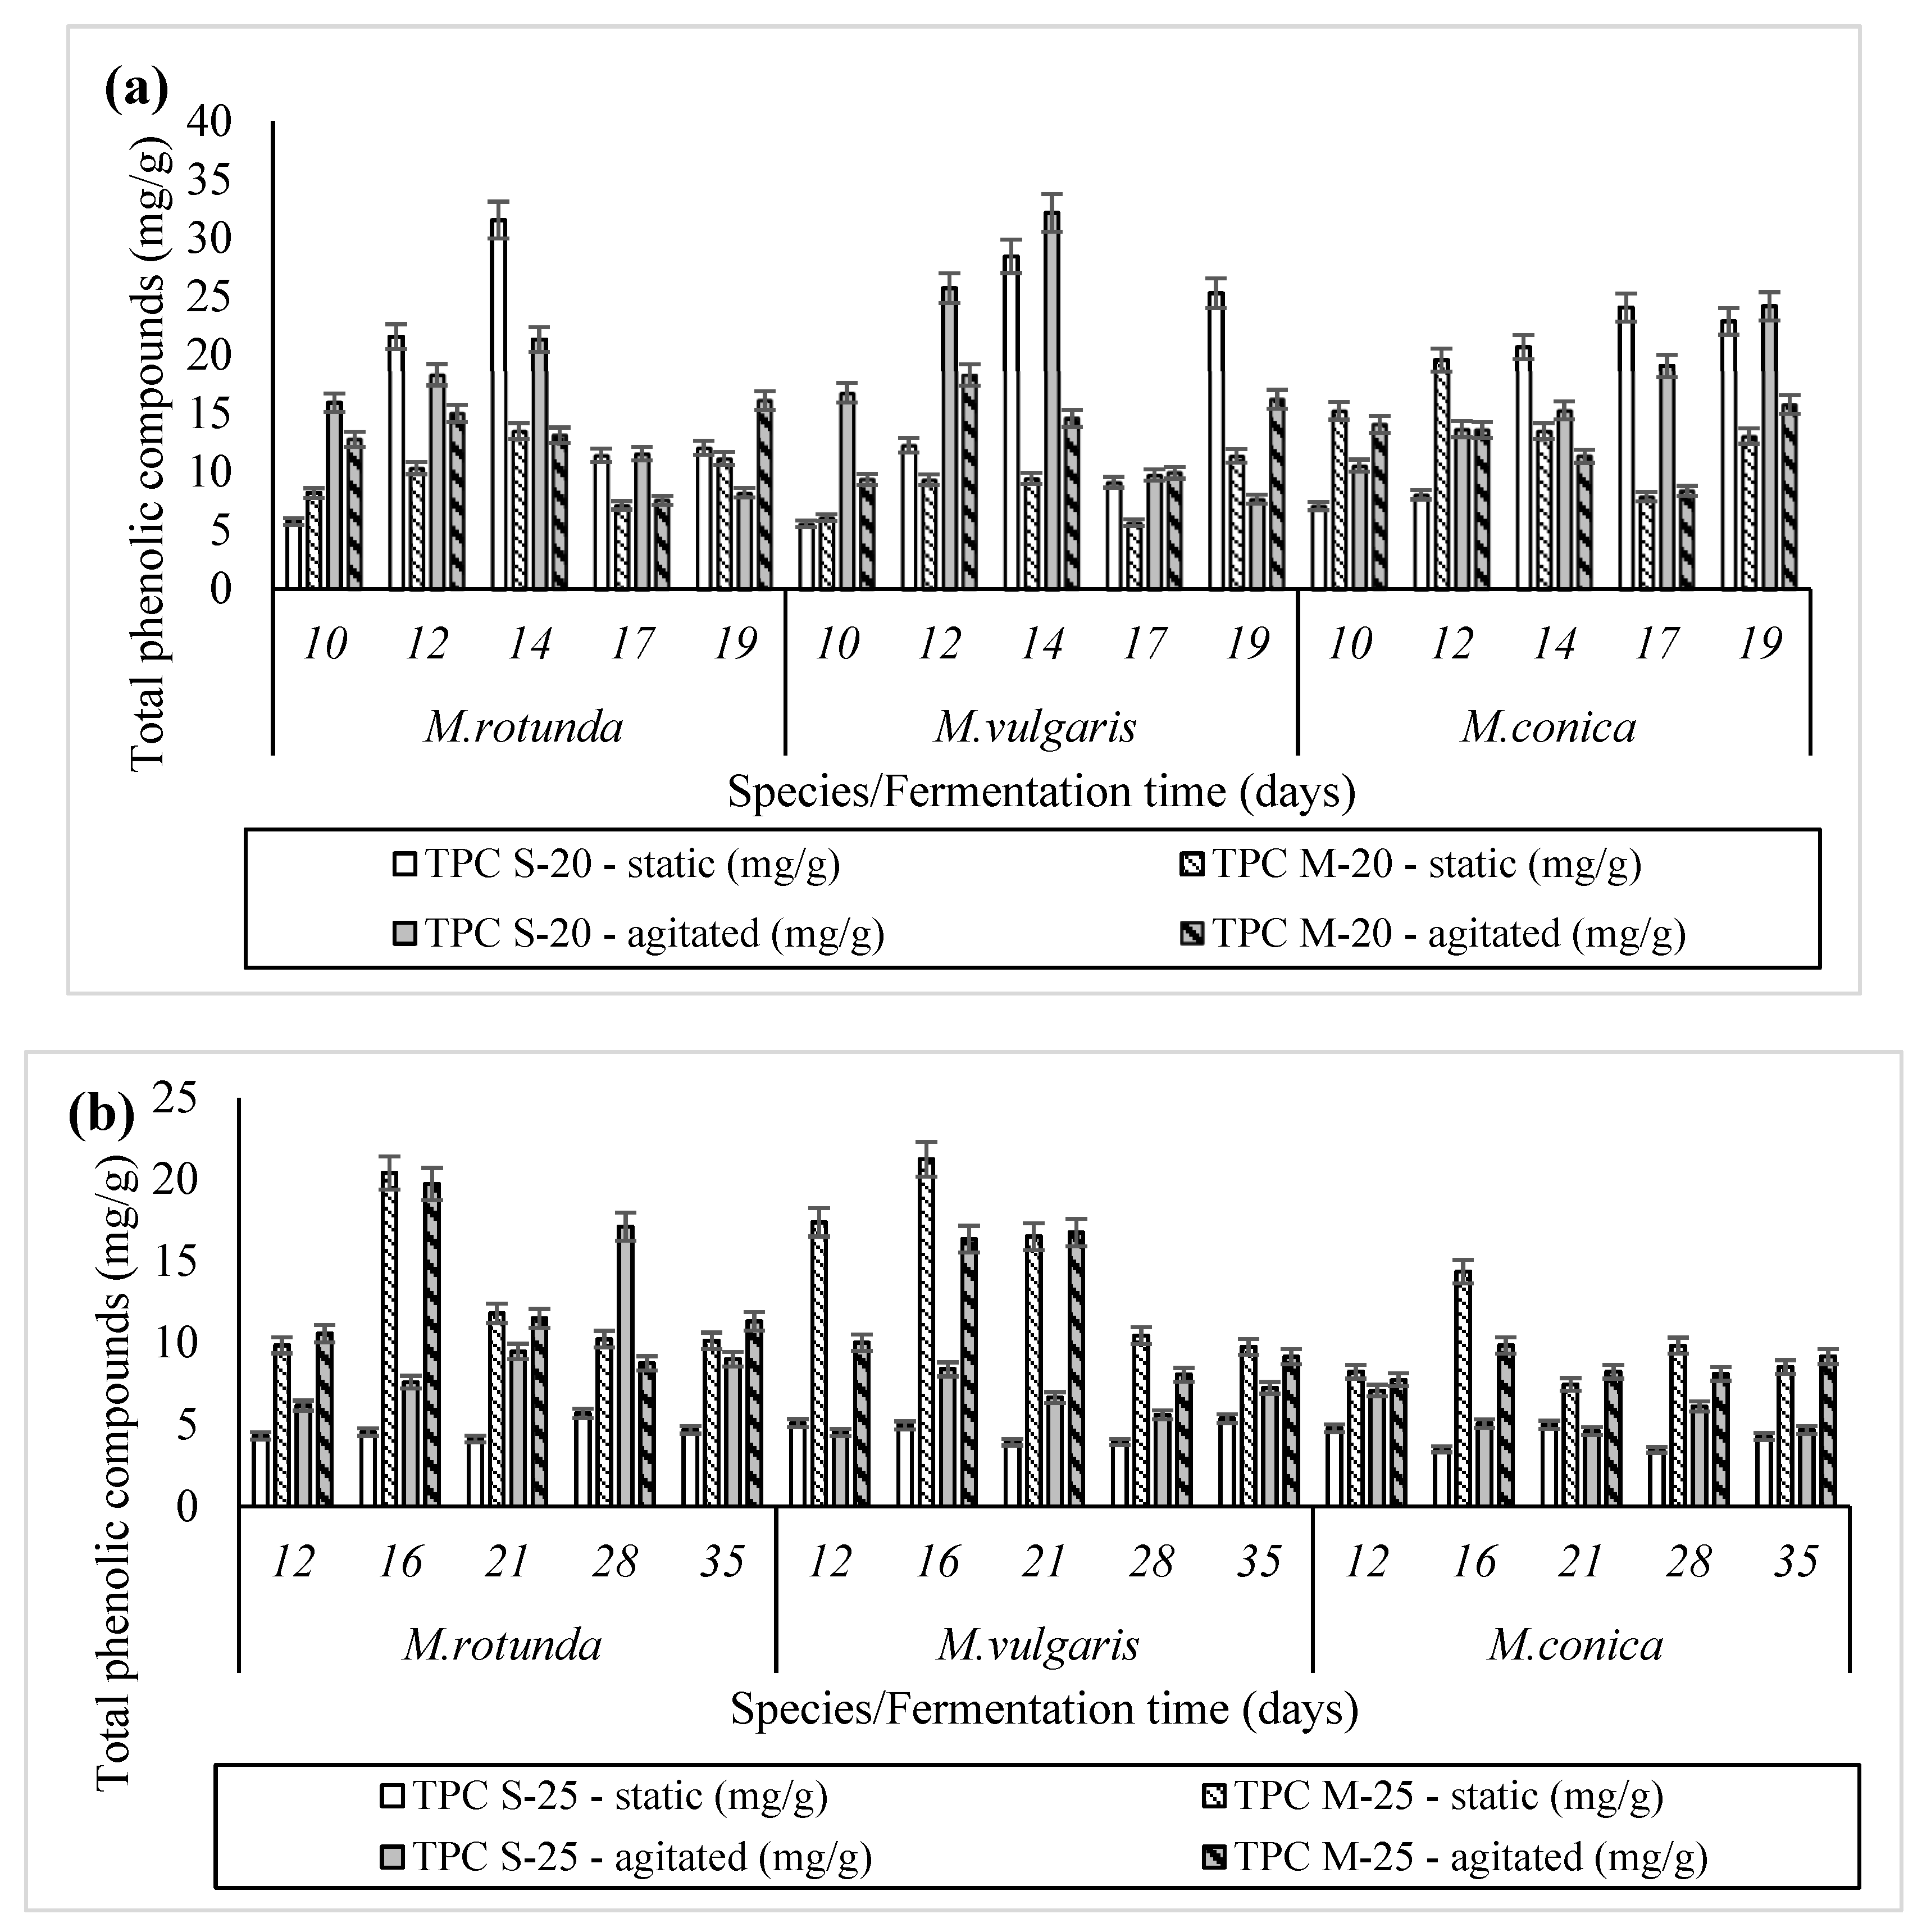
3.6. Fungal Phenolic Compounds—Antioxidant Components Synthesis
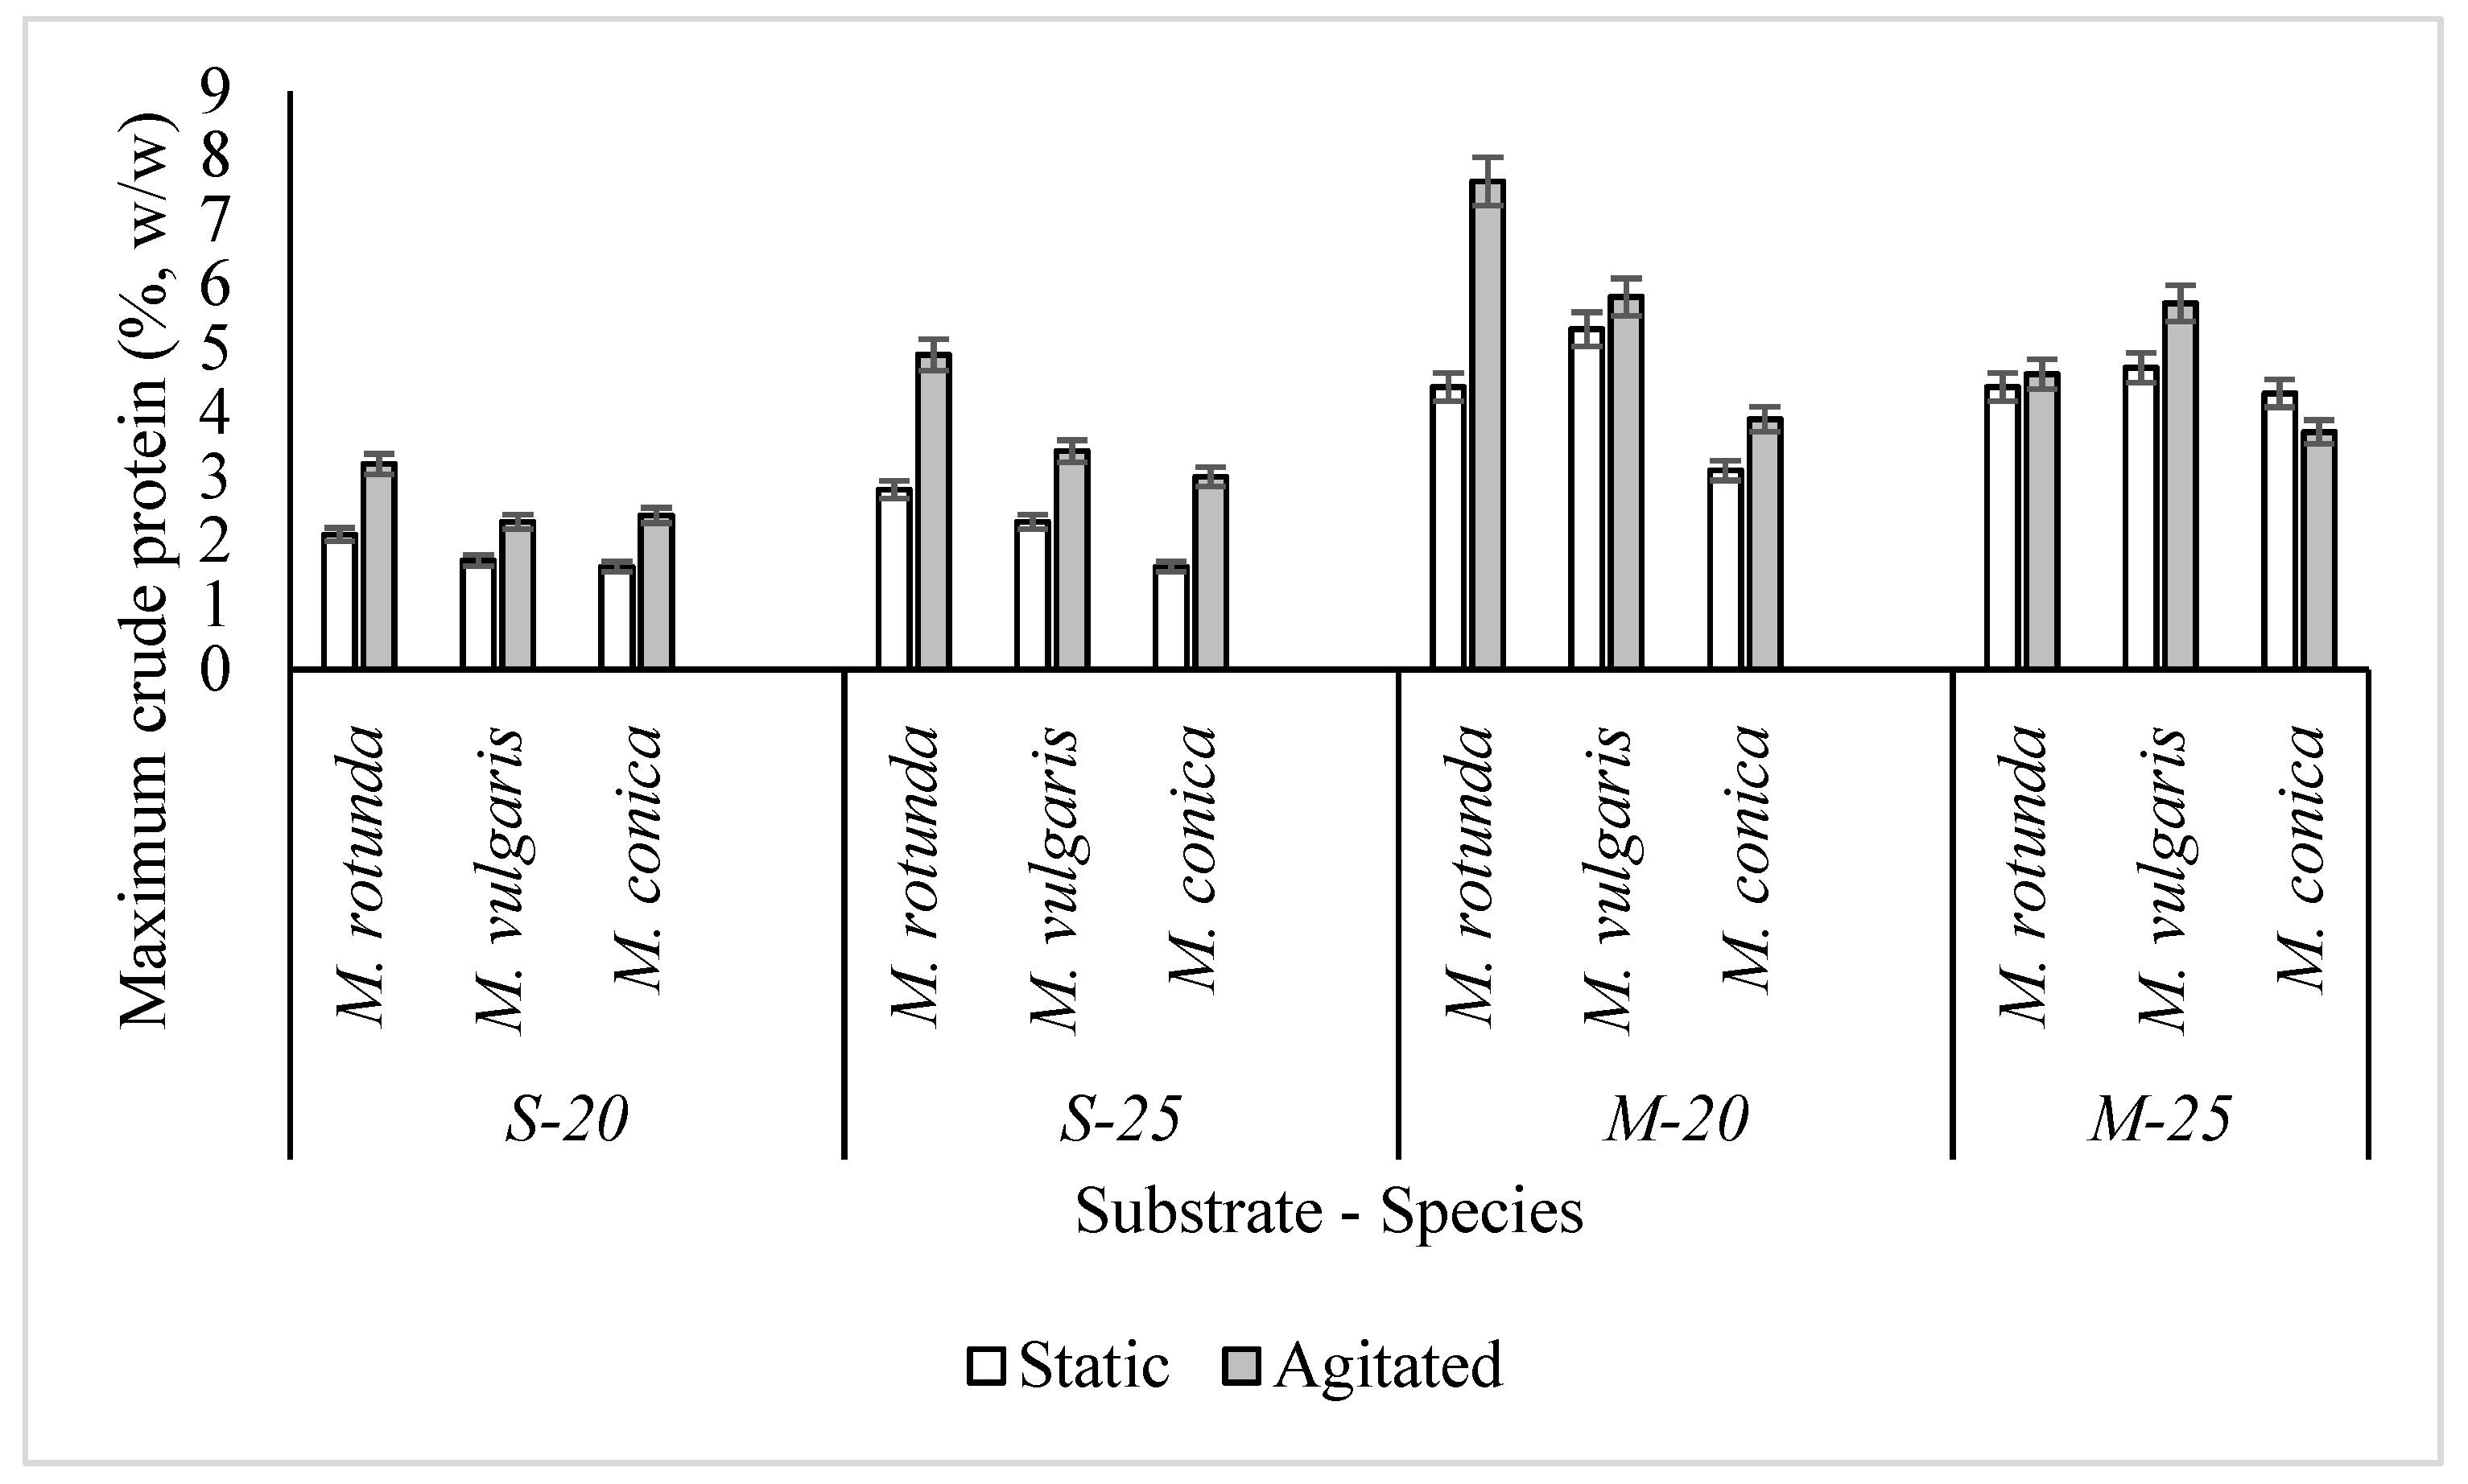
The production of TPC (Figure 3) and TAC (Figure 4) differed considerably depending on the growth medium and species. In the four nutrient substrates, the kinetics of TPC and TAC did not have a specific tendency and fluctuated during the fermentation, in both static and agitated cultures. The TPCmax values (expressed as mg of gallic acid equivalents per g of dry biomass) were really impressive in the S-20 nutrient medium for all ascomycetes (21.3–32.2 mg/g). The results were also satisfactory in two molasses substrates (9.8–21.2 mg/g), in contrast to the production of TPC in the S-25 medium (5.0–8.4 mg/g) that was considerably reduced, except M. rotunda agitated culture (17.1 mg/g). The wide range of values and inconsistency between the results are attributed to the different species, origins, the environmental conditions, the maturity stage and the extraction method. This phenomenon is also mentioned by many authors in the following studies; Turkoglu et al. [65] determined a fairly high TPCmax value in black morel M. conica ethanolic extracts (41.9 μg pyrocatechol/mg dw), although in many studies about M. conica methanol extracts by Puttaraju et al. [66], Gursoy et al. [67], Ozturk et al. [68], Vieira et al. [69], TPCmax values (expressed as an amount of gallic acid equivalents per dry biomass) agree with results of the present study in some substrates (4.6 mg/g; 25.38 μg GAE/mg; 20.64 μg/mg; 26.4 or 32.8 μg/mg depending on the origin). In addition, Gursoy et al. [67] studied the TPCmax of yellow morel M. rotunda (16.98 μg/mg), which was significantly lower than the TPCmax achieved in nutrient medium S-20 (31.5 mg/g) and relatively close to the values for M-20 and M-25 substrates (16.1 and 20.4 mg/g). Antioxidant activity of methanol extracts was measured as their scavenging capacity to reduce the DPPH• radical, a stable free radical, which accepts an electron or hydrogen radical to become a stable diamagnetic molecule [70]. Our results showed that in the substrate with the greatest molasses concentration, the highest TACmax values were recorded (expressed as mg of Trolox equivalents per g of dry biomass and %, w/w; 2.7–6.0 mg/g, 47.6–70.6% w/w; M-25, 2.0–2.9 mg/g, 43.6–49.7% w/w; M-20). The opposite was observed in sucrose substrates, where the increase of sucrose concentration did not favor further TACmax production (2.3–6.0 mg/g, 45.5–70.6%; S-20, 2.7–4.4 mg/g, 47.8–59.5%; S-25). Another method for free radical scavenging capacity evaluation uses ABTS˙+ as the free radical. In this method, yellow morels in sucrose substrates recorded higher TACmax (expressed as mg of Trolox equivalents per g of dry biomass and %, w/w; ~7 mg/g, up to 90%; S-20, 4.3–6.2 mg/g, 61.7–88.0%; S-25). Also, in molasses substrate with ratio C/N = 25, yellow morels achieved satisfactory TACmax values (~6 mg/g, up to 80%). In the other molasses media (M-20), all species presented reduced TACmax values (3.6–4.6 mg/g, 60.7–65.3%). The free radical scavenging activity of M. conica and M. anguisticeps was reported 0.9 and 0.7 mg BHA/g in methanol extracts, respectively [66]. In another study, the anti-radical activity of M. conica was determined to 43.8% [68]. Gursoy et al. [67] reported the scavenging effects of Morchella species at different concentrations, varying from 4 to 14% at 0.5 mg/mL for M. deliciosa and to 40.6–85.4% at 4.5 mg/mL for M. conica.

3.7. Protein

Total protein synthesis of Morchella species was studied for both static and agitated cultures in three intervals. In some cases, non-negligible quantities of total protein values (in relative; %, w/w) were produced by the fungal species tested (e.g., 7.6%, w/w–Figure 5) principally in the agitated cultures. The lowest protein quantity (less than 2%, w/w) synthesized by M. conica in static conditions of sucrose substrates, demonstrated that (a) agitation had positive effect in most of the cultures, increasing significantly protein synthesis (b) addition of molasses led to protein increase and (c) yellow morels produce higher protein values than the black ones. In general, in most of the performed trials, maxima of cellular protein values were recorded at the beginning (5th or 8th day) or in the middle (12th or 21st day) of fermentation, regardless of the imposition or not of agitation. Additionally, the C/N ratio increase in molasses substrates did not give a boost to increase protein production (3.1–7.6%, w/w; Μ-20, 3.7–5.7%, w/w; M-25), in contrast to sucrose substrates in which higher protein values were recorded (1.6–3.2%, w/w; S-20, 1.6–4.9%, w/w; S-25). There has been few or no report on the production of mushroom mycelium protein on Morchella spp. in submerged cultures of these complex media. Petre and Petre. [71] studied continuous cultivation of medicinal mushrooms by using the submerged fermentation of natural wastes resulted from the industrial processing of cereals and grapes. The whole process of mushroom mycelia growing lasts for a single cycle in bioreactor and the maximum mycelial crude protein content of Lentinula edodes (0.5–0.8%, w/w), Ganoderma lucidum (0.6–0.7%, w/w) and Pleurotus ostreatus (0.6–0.8%, w/w) was appreciably lower than values of this study. Mshandete and Mgonja [72] studied mycelia from five species of higher fungi of genera Ganoderma, Pleurotus and Laetiporus. After 15 days of submerged fermentation in YAD (yam peel extract and dextrose) the crude protein content of mushroom mycelium ranged from 31 to 55%, w/w and varied considerably among the mushroom species (G. lucidum 34%, w/w; L. sulphureus 39%, w/w; P. flabellatus 31%, w/w; Pleurotus HK-37 41%, w/w; Pleurotus spp. 55% w/w). These values are really higher than those in this study. The wide range of protein values between the results is attributed to the different species, the environmental conditions, the fermentation time and extraction method. Finally, Pandey and Budhathoki [73] used the Bradford method to determine the protein of 35 Nepalese mushrooms, among them M. conica (0.59 mg/mL). Although, they did not study the mycelium but the fruit body, their results (0.27–1.57 mg/mL) are close enough to ours (0.53–2.53 mg/mL).

4. Conclusions

The results of the present study are very interesting as there are no studies in which edible wild ascomycetes as those of morels or tuber spp. are examined and finally achieve biological detoxification of liquid wastes’ pollutant load (reduction of phenolic compounds and decolorization) and in particular of molasses that was used without further processing. Apart from ecological waste treatment, M. rotunda, M. vulgaris and M. conica took advantage of the high sugars content of molasses and produced a significant amount of mycelial mass with simultaneous biosynthesis of antioxidant components, as well as polysaccharides and proteins that are important metabolites with great nutritional and commercial value used in both food and pharmaceutical industry.

Author Contributions

M.D.: Writing—original draft preparation; K.F.: verified the analytical methods, performed the analysis, processed the experimental data, contributed to the interpretation of the results; E.-M.M.: performed the analysis, processed the experimental data; D.A. and C.P.: processed the experimental data and verified the analytical methods; I.D.: contributed to the interpretation of the results; S.P.: conceived of the presented idea, verified the analytical methods and contributed to the interpretation of the results and to the writing of the manuscript, P.D.: conceived and planned the experiments, supervised the findings of this work and took the lead in writing the manuscript. All authors have read and agreed to the published version of the manuscript.

Funding

This research received no external funding.

Institutional Review Board Statement

Not applicable.

Informed Consent Statement

Not applicable.

Conflicts of Interest

The authors declare no conflict of interest.

References

  1. Barros, L.; Cruz, T.; Baptista, P.; Estevinho, L.M.; Ferreira, I.C. Wild and Commercial Mushrooms as Source of Nutrients and Nutraceuticals. Food Chem. Toxicol. 2008, 46, 2742–2747. [Google Scholar] [CrossRef]
  2. Liu, C.; Sun, Y.; Mao, Q.; Guo, X.; Li, P.; Liu, Y.; Xu, N. Characteristics and Antitumor Activity of Morchella esculenta Polysaccharide Extracted by Pulsed Electric Field. Int. J. Mol. Sci. 2016, 17, 986. [Google Scholar] [CrossRef] [Green Version]
  3. Usman, M.; Murtaza, G.; Ditta, A. Nutritional, Medicinal, and Cosmetic Value of Bioactive Compounds in Button Mushroom (Agaricus bisporus): A Review. Appl. Sci. 2021, 11, 5943. [Google Scholar] [CrossRef]
  4. Xu, N.; Lu, Y.; Hou, J.; Liu, C.; Sun, Y. A Polysaccharide Purified from Morchella conica Pers. Prevents Oxidative Stress Induced by H2O2 in Human Embryonic Kidney (HEK) 293T Cells. Int. J. Mol. Sci. 2018, 19, 4027. [Google Scholar] [CrossRef] [Green Version]
  5. Yang, C.; Zhou, X.; Meng, Q.; Wang, M.; Zhang, Y.; Fu, S. Secondary Metabolites and Antiradical Activity of Liquid Fermentation of Morchella sp. Isolated from Southwest China. Molecules 2019, 24, 1706. [Google Scholar] [CrossRef] [PubMed] [Green Version]
  6. Wasser, S.P. Medicinal Mushrooms as a Source of Antitumor and Immunomodulating Polysaccharides. Appl. Microbiol. Biotechnol. 2002, 60, 258–274. [Google Scholar] [PubMed]
  7. Barros, L.; Ferreira, M.-J.; Queiros, B.; Ferreira, I.C.; Baptista, P. Total Phenols, Ascorbic Acid, β-Carotene and Lycopene in Portuguese Wild Edible Mushrooms and Their Antioxidant Activities. Food Chem. 2007, 103, 413–419. [Google Scholar] [CrossRef]
  8. Prasad, P.; Chauhan, K.; Kandari, L.S.; Maikhuri, R.K.; Purohit, A.; Bhatt, R.P.; Rao, K.S. Morchella esculenta (Guchhi): Need for Scientific Intervention for Its Cultivation in Central Himalaya. Curr. Sci. 2002, 82, 1098–1100. [Google Scholar]
  9. Jacobs, M.E. Beta-Alanine and Tanning Polymorphisms. Comp. Biochem. Physiol. B 1982, 72, 173–177. [Google Scholar] [CrossRef]
  10. Papadaki, A.; Diamantopoulou, P.; Papanikolaou, S.; Philippoussis, A. Evaluation of Biomass and Chitin Production of Morchella Mushrooms Grown on Starch-Based Substrates. Foods 2019, 8, 239. [Google Scholar] [CrossRef] [Green Version]
  11. Güler, P.; Arkan, O. Cultural Characteristics of Morchella esculenta Mycelium on Some Nutrients. Turk. J. Biol. 2000, 24, 783–794. [Google Scholar]
  12. Winder, R.S. Cultural Studies of Morchella elata. Mycol. Res. 2006, 110, 612–623. [Google Scholar] [CrossRef] [PubMed]
  13. Sarris, D.; Philippoussis, A.; Mallouchos, A.; Diamantopoulou, P. Valorization of Low-Cost, Carbon-Rich Substrates by Edible Ascomycetes and Basidiomycetes Grown on Liquid Cultures. FEMS Microbiol. Lett. 2020, 367, fnaa168. [Google Scholar] [CrossRef]
  14. Fazenda, M.L.; Seviour, R.; McNeil, B.; Harvey, L.M. Submerged Culture Fermentation of “Higher Fungi”: The Macrofungi. Adv. Appl. Microbiol. 2008, 63, 33–103. [Google Scholar]
  15. Gang, J.; Fang, Y.; Wang, Z.; Liu, Y. Fermentation Optimization and Antioxidant Activities of Mycelia Polysaccharides from Morchella esculenta Using Soybean Residues. Afr. J. Biotechnol. 2013, 12, 1239–1249. [Google Scholar]
  16. Mukhopadhyay, R.; Guha, A.K. A Comprehensive Analysis of the Nutritional Quality of Edible Mushroom Pleurotus Sajor-Caju Grown in Deproteinized Whey Medium. LWT-Food Sci. Technol. 2015, 61, 339–345. [Google Scholar] [CrossRef]
  17. Diamantopoulou, P.; Papanikolaou, S.; Aggelis, G.; Philippoussis, A. Adaptation of Volvariella volvacea Metabolism in High Carbon to Nitrogen Ratio Media. Food Chem. 2016, 196, 272–280. [Google Scholar] [CrossRef]
  18. Kumar, P.; Chandra, R. Decolourisation and Detoxification of Synthetic Molasses Melanoidins by Individual and Mixed Cultures of Bacillus spp. Bioresour. Technol. 2006, 97, 2096–2102. [Google Scholar] [CrossRef]
  19. Silván, J.M.; van de Lagemaat, J.; Olano, A.; del Castillo, M.D. Analysis and Biological Properties of Amino Acid Derivates Formed by Maillard Reaction in Foods. J. Pharm. Biomed. Anal. 2006, 41, 1543–1551. [Google Scholar] [CrossRef]
  20. Brock, T.D. Studies on the Nutrition of Morchella esculenta Fries. Mycologia 1951, 43, 402–422. [Google Scholar] [CrossRef]
  21. Kaul, T.N. Physiological Studies on Morchella Species. I. Carbon Util. Bull. Bot. Soc. Ben. 1977, 31, 35–42. [Google Scholar]
  22. Philippoussis, A. Study of the fungi morphogenesis of the genus Morchella. Ph.D. Thesis, Agricultural University of Athens, Athens, Greece, May 2003. [Google Scholar]
  23. Meng, F.; Liu, X.; Jia, L.; Song, Z.; Deng, P.; Fan, K. Optimization for the Production of Exopolysaccharides from Morchella esculenta SO-02 in Submerged Culture and Its Antioxidant Activities in Vitro. Carbohydr. Polym. 2010, 79, 700–704. [Google Scholar] [CrossRef]
  24. Gomes, J.; Menawat, A.S. Precise Control of Dissolved Oxygen in Bioreactors—A Model-Based Geometric Algorithm. Chem. Eng. Sci. 2000, 55, 67–78. [Google Scholar] [CrossRef]
  25. Tang, Y.-J.; Zhong, J.-J. Fed-Batch Fermentation of Ganoderma lucidum for Hyperproduction of Polysaccharide and Ganoderic Acid. Enzym. Microb. Technol. 2002, 31, 20–28. [Google Scholar] [CrossRef]
  26. Wagner, R.; Mitchell, D.A.; Lanzi Sassaki, G.; Lopes de Almeida Amazonas, M.A.; Berovič, M. Current Techniques for the Cultivation of Ganoderma lucidum for the Production of Biomass, Ganoderic Acid and Polysaccharides. Food Technol. Biotechnol. 2003, 41, 371–382. [Google Scholar]
  27. Papagianni, M. Fungal Morphology and Metabolite Production in Submerged Mycelial Processes. Biotechnol. Adv. 2004, 22, 189–259. [Google Scholar] [CrossRef]
  28. Diamantopoulou, P.; Papanikolaou, S.; Kapoti, M.; Komaitis, M.; Aggelis, G.; Philippoussis, A. Mushroom Polysaccharides and Lipids Synthesized in Liquid Agitated and Static Cultures. Part I: Screening Various Mushroom Species. Appl. Biochem. Biotechnol. 2012, 167, 536–551. [Google Scholar] [CrossRef]
  29. Diamantopoulou, P.; Papanikolaou, S.; Komaitis, M.; Aggelis, G.; Philippoussis, A. Patterns of Major Metabolites Biosynthesis by Different Mushroom Fungi Grown on Glucose-Based Submerged Cultures. Bioprocess Biosyst. Eng. 2014, 37, 1385–1400. [Google Scholar] [CrossRef]
  30. Kim, S.W.; Hwang, H.J.; Park, J.P.; Cho, Y.J.; Song, C.H.; Yun, J.W. Mycelial Growth and Exo-biopolymer Production by Submerged Culture of Various Edible Mushrooms under Different Media. Lett. Appl. Microbiol. 2002, 34, 56–61. [Google Scholar] [CrossRef] [Green Version]
  31. APHA; AWWA; WEF. Standard Methods for the Examination of Water and Wastewater, 20th ed.; Amer Public Health Assn: Washington, DC, USA, 1998. [Google Scholar]
  32. Sparks, D.L.; Fendorf, S.E.; Toner IV, C.V.; Carski, T.H. Kinetic Methods and Measurements. In Methods of Soil Analysis: Part 3 Chemical Methods; Soil Science Society of America, Inc.: Madison, WI, USA; American Society of Agronomy, Inc.: Madison, WI, USA, 1996; Volume 5, pp. 1275–1307. [Google Scholar]
  33. Roukas, T. Ethanol Production from Non-Sterilized Beet Molasses by Free and Immobilized Saccharomyces cerevisiae Cells Using Fed-Batch Culture. J. Food Eng. 1996, 27, 87–96. [Google Scholar] [CrossRef]
  34. Miller, G.L. Use of Dinitrosalicylic Acid Reagent for Determination of Reducing Sugar. Anal. Chem. 1959, 31, 426–428. [Google Scholar] [CrossRef]
  35. Slinkard, K.; Singleton, V.L. Total Phenol Analysis: Automation and Comparison with Manual Methods. Am. J. Enol. Vitic. 1977, 28, 49–55. [Google Scholar]
  36. Lie, S. The EBC-ninhydrin Method for Determination of Free Alpha Amino Nitrogen. J. Inst. Brew. 1973, 79, 37–41. [Google Scholar] [CrossRef]
  37. Dubois, M.; Gilles, K.A.; Hamilton, J.K.; Rebers, P.T.; Smith, F. Colorimetric Method for Determination of Sugars and Related Substances. Anal. Chem. 1956, 28, 350–356. [Google Scholar] [CrossRef]
  38. Hsieh, C.; Hsu, T.-H.; Yang, F.-C. Production of Polysaccharides of Ganoderma lucidum (CCRC36021) by Reusing Thin Stillage. Process Biochem. 2005, 40, 909–916. [Google Scholar] [CrossRef]
  39. Liang, Y.; Sarkany, N.; Cui, Y.; Blackburn, J.W. Batch Stage Study of Lipid Production from Crude Glycerol Derived from Yellow Grease or Animal Fats through Microalgal Fermentation. Bioresour. Technol. 2010, 101, 6745–6750. [Google Scholar] [CrossRef]
  40. Bondet, V.; Brand-Williams, W.; Berset, C. Kinetics and Mechanisms of Antioxidant Activity Using the DPPH^* Free Radical Method. Food Sci. Technol. 1997, 30, 609–615. [Google Scholar]
  41. Molyneux, P. The Use of the Stable Free Radical Diphenylpicrylhydrazyl (DPPH) for Estimating Antioxidant Activity. Songklanakarin J. Sci. Technol. 2004, 26, 211–219. [Google Scholar]
  42. Musa, K.H.; Abdullah, A.; Kuswandi, B.; Hidayat, M.A. A Novel High Throughput Method Based on the DPPH Dry Reagent Array for Determination of Antioxidant Activity. Food Chem. 2013, 141, 4102–4106. [Google Scholar] [CrossRef]
  43. Re, R.; Pellegrini, N.; Proteggente, A.; Pannala, A.; Yang, M.; Rice-Evans, C. Antioxidant Activity Applying an Improved ABTS Radical Cation Decolorization Assay. Free Radic. Biol. Med. 1999, 26, 1231–1237. [Google Scholar] [CrossRef]
  44. Bradford, M.M. A Rapid and Sensitive Method for the Quantitation of Microgram Quantities of Protein Utilizing the Principle of Protein-Dye Binding. Anal. Biochem. 1976, 72, 248–254. [Google Scholar] [CrossRef]
  45. Sayadi, S.; Ellouz, R. Decolourization of Olive Mill Waste-Waters by the White-Rot Fungus Phanerochaete Chrysosporium: Involvement of the Lignin-Degrading System. Appl. Microbiol. Biotechnol. 1992, 37, 813–817. [Google Scholar] [CrossRef]
  46. Chang, M.-Y.; Tsai, G.-J.; Houng, J.-Y. Optimization of the Medium Composition for the Submerged Culture of Ganoderma lucidum by Taguchi Array Design and Steepest Ascent Method. Enzym. Microb. Technol. 2006, 38, 407–414. [Google Scholar] [CrossRef]
  47. Lee, B.C.; Bae, J.T.; Pyo, H.B.; Choe, T.B.; Kim, S.W.; Hwang, H.J.; Yun, J.W. Submerged Culture Conditions for the Production of Mycelial Biomass and Exopolysaccharides by the Edible Basidiomycete Grifola frondosa. Enzym. Microb. Technol. 2004, 35, 369–376. [Google Scholar] [CrossRef]
  48. Xu, C.-P.; Yun, J.W. Influence of Aeration on the Production and the Quality of the Exopolysaccharides from Paecilomyces tenuipes C240 in a Stirred-Tank Fermenter. Enzym. Microb. Technol. 2004, 35, 33–39. [Google Scholar] [CrossRef]
  49. Diamantopoulou, P.; Papanikolaou, S.; Katsarou, E.; Komaitis, M.; Aggelis, G.; Philippoussis, A. Mushroom Polysaccharides and Lipids Synthesized in Liquid Agitated and Static Cultures. Part II: Study of Volvariella volvacea. Appl. Biochem. Biotechnol. 2012, 167, 1890–1906. [Google Scholar] [CrossRef]
  50. Xing, Z.; Sun, F.; Liu, J. Studies on the Submerge-Cultured Conditions of Morchella conica. Shi Yong Jun Xue Bao Online 2004, 11, 38–43. [Google Scholar]
  51. Ding, Z.; Wang, W.; Wang, F.; Wang, Q.; Zhang, K. Polysaccharides Production by Submerged Fermentation of Coprinus comatus and Their Inhibitory Effects on Non-Enzymatic Glycosylation. J. Med. Plants Res. 2012, 6, 1375–1381. [Google Scholar]
  52. Fang, Q.-H.; Zhong, J.-J. Submerged Fermentation of Higher Fungus Ganoderma lucidum for Production of Valuable Bioactive Metabolites—Ganoderic Acid and Polysaccharide. Biochem. Eng. J. 2002, 10, 61–65. [Google Scholar] [CrossRef]
  53. Tang, Y.-J.; Zhu, L.-L.; Li, D.-S.; Mi, Z.-Y.; Li, H.-M. Significance of Inoculation Density and Carbon Source on the Mycelial Growth and Tuber Polysaccharides Production by Submerged Fermentation of Chinese Truffle Tuber sinense. Process Biochem. 2008, 43, 576–586. [Google Scholar] [CrossRef]
  54. Fakas, S.; Galiotou-Panayotou, M.; Papanikolaou, S.; Komaitis, M.; Aggelis, G. Compositional Shifts in Lipid Fractions during Lipid Turnover in Cunninghamella echinulata. Enzym. Microb. Technol. 2007, 40, 1321–1327. [Google Scholar] [CrossRef]
  55. Haque, M.A.; Kachrimanidou, V.; Koutinas, A.; Lin, C.S.K. Valorization of Bakery Waste for Biocolorant and Enzyme Production by Monascus purpureus. J. Biotechnol. 2016, 231, 55–64. [Google Scholar] [CrossRef]
  56. Taskin, M.; Ozkan, B.; Atici, O.; Aydogan, M.N. Utilization of Chicken Feather Hydrolysate as a Novel Fermentation Substrate for Production of Exopolysaccharide and Mycelial Biomass from Edible Mushroom Morchella esculenta. Int. J. Food Sci. Nutr. 2012, 63, 597–602. [Google Scholar] [CrossRef] [PubMed]
  57. Oh, J.-Y.; Cho, E.-J.; Nam, S.-H.; Choi, J.-W.; Yun, J.-W. Production of Polysaccharide–Peptide Complexes by Submerged Mycelial Culture of an Entomopathogenic Fungus Cordyceps sphecocephala. Process Biochem. 2007, 42, 352–362. [Google Scholar] [CrossRef]
  58. Lee, W.Y.; Park, Y.; Ahn, J.K.; Ka, K.H.; Park, S.Y. Factors Influencing the Production of Endopolysaccharide and Exopolysaccharide from Ganoderma applanatum. Enzym. Microb. Technol. 2007, 40, 249–254. [Google Scholar] [CrossRef]
  59. Xiao, J.; Chen, D.; Wan, W.; Hu, X.; Qi, Y.; Liang, Z. Enhanced Simultaneous Production of Mycelia and Intracellular Polysaccharide in Submerged Cultivation of Cordyceps jiangxiensis Using Desirability Functions. Process Biochem. 2006, 41, 1887–1893. [Google Scholar] [CrossRef]
  60. Ruiz-Herrera, J.; Osorio, E. Isolation and Chemical Analysis of the Cell Wall of Morchella sp. Antonie Van Leeuwenhoek 1974, 40, 57–64. [Google Scholar] [CrossRef]
  61. Smiderle, F.R.; Olsen, L.M.; Ruthes, A.C.; Czelusniak, P.A.; Santana-Filho, A.P.; Sassaki, G.L.; Gorin, P.A.J.; Iacomini, M. Exopolysaccharides, Proteins and Lipids in Pleurotus pulmonarius Submerged Culture Using Different Carbon Sources. Carbohydr. Polym. 2012, 87, 368–376. [Google Scholar] [CrossRef] [Green Version]
  62. Jiménez, A.M.; Borja, R.; Martın, A. Aerobic–Anaerobic Biodegradation of Beet Molasses Alcoholic Fermentation Wastewater. Process Biochem. 2003, 38, 1275–1284. [Google Scholar] [CrossRef]
  63. Raghukumar, C.; Rivonkar, G. Decolorization of Molasses Spent Wash by the White-Rot Fungus Flavodon flavus, Isolated from a Marine Habitat. Appl. Microbiol. Biotechnol. 2001, 55, 510–514. [Google Scholar] [CrossRef]
  64. Sarris, D.; Matsakas, L.; Aggelis, G.; Koutinas, A.A.; Papanikolaou, S. Aerated vs Non-Aerated Conversions of Molasses and Olive Mill Wastewaters Blends into Bioethanol by Saccharomyces cerevisiae under Non-Aseptic Conditions. Ind. Crop. Prod. 2014, 56, 83–93. [Google Scholar] [CrossRef]
  65. Turkoglu, A.; Kivrak, I.; Mercan, N.; Duru, M.E.; Gezer, K.; Turkoglu, H. Antioxidant and Antimicrobial Activities of Morchella conica Pers. Afr. J. Biotechnol. 2006, 5, 1146–1150. [Google Scholar] [CrossRef]
  66. Puttaraju, N.G.; Venkateshaiah, S.U.; Dharmesh, S.M.; Urs, S.M.N.; Somasundaram, R. Antioxidant Activity of Indigenous Edible Mushrooms. J. Agric. Food Chem. 2006, 54, 9764–9772. [Google Scholar] [CrossRef]
  67. Gursoy, N.; Sarikurkcu, C.; Cengiz, M.; Solak, M.H. Antioxidant Activities, Metal Contents, Total Phenolics and Flavonoids of Seven Morchella Species. Food Chem. Toxicol. 2009, 47, 2381–2388. [Google Scholar] [CrossRef] [PubMed]
  68. Ozturk, I.; Sahan, S.; Sahin, U.; Ekici, L.; Sagdic, O. Bioactivity and Mineral Contents of Wild-Grown Edible Morchella conica in the Mediterranean Region. J. Für Verbrauch. Und Lebensm. 2010, 5, 453–457. [Google Scholar] [CrossRef]
  69. Vieira, V.; Fernandes, Â.; Barros, L.; Glamočlija, J.; Ćirić, A.; Stojković, D.; Martins, A.; Soković, M.; Ferreira, I.C. Wild Morchella conica Pers. from Different Origins: A Comparative Study of Nutritional and Bioactive Properties. J. Sci. Food Agric. 2016, 96, 90–98. [Google Scholar] [CrossRef] [PubMed] [Green Version]
  70. Tietel, Z.; Masaphy, S. True Morels (Morchella)—Nutritional and Phytochemical Composition, Health Benefits and Flavor: A Review. Crit. Rev. Food Sci. Nutr. 2018, 58, 1888–1901. [Google Scholar] [CrossRef]
  71. Petre, M.; Petre, V. Environmental Biotechnology for Bioconversion of Agricultural and Forestry Wastes into Nutritive Biomass. In Environmental Biotechnology: New Approaches and Prospective Applications; InTech: London, UK, 2013. [Google Scholar]
  72. Mshandete, A.M.; Mgonja, J.R. Submerged Liquid Fermentation of Some Tanzanian Basidiomycetes for the Production of Mycelial Biomass, Exopolysaccharides and Mycelium Protein Using Wastes Peels Media. J. Agric. Biol. 2009, 4, 1–13. [Google Scholar]
  73. Pandey, N.; Budhathoki, U. Protein Determination through Bradford’s Method of Nepalese Mushroom. Sci. World 2007, 5, 85–88. [Google Scholar] [CrossRef] [Green Version]
Figure 1. Production rate of intracellular polysaccharides (IPS) in absolute (g/L) values during the cultivation of Morchella rotunda, M. vulgaris and M. conica in media containing sucrose (S-20; (a), S-25; (b)) and molasses (M-20; (c), M-25; (d)) in static and agitated (120 ± 5 rpm) flask liquid cultures of C/N molar ratio 20 and 25.
Applsci 11 09481 g001
Figure 2. Phenolic compounds removal (%) of two molasses substrates (M-20; C/N = 20, M-25; C/N = 25) during the cultivation of M. rotunda, M. vulgaris and M. conica in static and agitated (120 ± 5 rpm) cultures.
Applsci 11 09481 g002
Figure 3. Total phenolic compounds (TPC, mg/g) produced during the cultivation of M. rotunda, M. vulgaris and M. conica in static and agitated (120 ± 5 rpm) cultures in sucrose (S-20) and molasses (M-20) substrates with ratio C/N = 20 (a) and in sucrose (S-25) and molasses (M-25) substrates with ratio C/N = 25 (b).
Applsci 11 09481 g003
Figure 4. Antioxidant components produced using DPPH and ABTS (mg Trolox/g) during the cultivation of M. rotunda, M. vulgaris and M. conica in static and agitated (120 ± 5 rpm) cultures in sucrose (S-20) and molasses (M-20) substrates with ratio C/N = 20 (a) and in sucrose (S-25) and molasses (M-25) substrates with ratio C/N = 25 (b).
Applsci 11 09481 g004
Figure 5. Maximum relative values of crude protein (BSA; %, w/w) produced from three Morchella species in static and agitated (120 ± 5 rpm) cultures in sucrose (S-20) and molasses (M-20) substrates with ratio C/N = 20 and in sucrose (S-25) and molasses (M-25) substrates with ratio C/N = 25.
Applsci 11 09481 g005
Table 1. Characteristics and specifications of molasses.
Molasses Characteristics
Moisture27.0% w/w
Total nitrogen1.8% w/w
Organic matter44.8% w/w
Total sugars510-530 g/L
Phenolic compounds33.25 g/L
pH5.50
Density1.2438 g/mL
Table 2. Data originated from kinetics on sucrose and molasses substrates in static-flask and agitated (120 ± 5 rpm) cultures for M. rotunda (a), M. vulgaris (b) and M. conica (c). Representation of dry biomass (X, g/L), total sugars consumed (TScon, %), consumed free amino nitrogen (Ncon, %), biomass yield (YX/S, g/g) and total extracellular (EPS, g/L) and intracellular (IPS, g/L and % w/w) polysaccharides at different fermentation points of each trial: (a) when the maximum biomass (Xmax, g/L) was produced; (b) when the maximum substrate quantity was consumed (TSconmax, Nconmax, %); (c) when the maximum biomass yield (YX/S, g/g) value was achieved; (d) when the maximum total exopolysaccharide amount (EPSmax, g/L) was produced and (e) when the maximum total endopolysaccharide amount (IPSmax, g/L, % w/w) was synthesized. Each point is the mean value of at least three independent measurements.
(a) M. rotunda
SubstrateTime XTSconNconYX/SEPSIPSIPS
(Days) (g/L)(%)(%)(g/g)(g/L)(g/L)(%, w/w)
Static
S-205d0.87 ± 0.0121.0 ± 0.115.3 ± 0.10.24 ± 0.010.94 ± 0.010.13 ± 0.0215.0 ± 0.3
10c5.67 ± 0.7349.1 ± 0.061.6 ± 2.10.68 ± 0.050.67 ± 0.061.43 ± 0.0625.3 ± 0.9
19a, b, e, f7.29 ± 0.1680.5 ± 1.497.4 ± 0.20.53 ± 0.160.28 ± 0.012.04 ± 0.0328.0 ± 0.4
S-258c, d5.22 ± 0.0645.9 ± 082.4 ± 0.10.57 ± 0.060.87 ± 0.220.84 ± 0.0616.0 ± 0.6
16e, f6.24 ± 0.0565.6 ± 1.390.2 ± 2.10.48 ± 0.050.37 ± 0.012.63 ± 0.1442.1 ± 2.2
35a, b7.39 ± 0.2785.2 ± 1.197.5 ± 0.10.43 ± 0.270.13 ± 0.011.85 ± 0.0425.0 ± 0.5
M-205d0.62 ± 0.0516.9 ± 1.311.7 ± 0.10.17 ± 0.061.66 ± 0.030.09 ± 0.1115.0 ± 1.1
10c9.69 ± 0.0150.2 ± 1.756.7 ± 0.20.88 ± 0.011.37 ± 0.082.46 ± 0.1125.4 ± 1.1
14e, f12.65 ± 0.3877.5 ± 1.083.5 ± 0.90.74 ± 0.050.97 ± 0.063.34 ± 0.0926.4 ± 0.7
19a, b13.46 ± 0.0295.2 ± 0.888.9 ± 0.30.64 ± 0.270.42 ± 0.062.92 ± 0.0621.7 ± 0.4
M-258d1.80 ± 0.2317.0 ± 1.723.3 ± 1.90.26 ± 0.063.94 ± 0.070.29 ± 0.1016.0 ± 1.2
12c7.93 ± 0.1028.9 ± 2.437.2 ± 2.10.67 ± 0.013.77 ± 0.031.40 ± 0.0517.7 ± 0.6
35a, b, e, f12.01 ± 0.0459.0 ± 1.969.8 ± 0.30.50 ± 0.273.26 ± 0.112.14 ± 0.2217.8 ± 1.8
Agitated
S-205d0.90 ± 0.0130.4 ± 0.025.4 ± 2.20.17 ± 0.011.09 ± 0.050.15 ± 0.0716.7 ± 0.2
17c7.71 ± 0.1385.3 ± 1.373.1 ± 0.10.53 ± 0.130.27 ± 0.011.53 ± 0.0119.8 ± 0.2
19a, b, e, f7.95 ± 0.6590.0 ± 1.297.4 ± 0.40.52 ± 0.650.25 ± 0.012.40 ± 0.0230.2 ± 0.3
S-258c,d3.37 ± 0.4718.3 ± 0.141.4 ± 0.00.92 ± 0.470.64 ± 0.030.44 ± 0.0213.0 ± 0.23
16f6.26 ± 0.1770.8 ± 2.975.1 ± 0.80.44 ± 0.170.42 ± 0.041.85 ± 0.1429.5 ± 2.3
28e8.63 ± 0.7580.4 ± 0.996.9 ± 1.10.54 ± 0.750.34 ± 0.011.88 ± 0.0621.8 ± 0.7
35a, b9.69 ± 0.1382.1 ± 1.897.9 ± 0.10.59 ± 0.130.30 ± 0.201.52 ± 0.0515.7 ± 0.5
M-2012d12.23 ± 0.5282.7 ± 2.578.3 ± 2.70.67 ± 0.171.15 ± 0.032.17 ± 0.0617.7 ± 0.5
19a–c, e, f16.15 ± 0.5895.1 ± 0.690.1 ± 0.10.77 ± 0.130.52 ± 0.013.33 ± 0.0920.6 ± 0.6
M-2516f7.79 ± 0.2448.1 ± 2.441.3 ± 0.90.39 ± 0.172.86 ± 0.131.34 ± 0.0617.2 ± 0.7
35a–c, d, e16.27 ± 0.0162.5 ± 0.268.8 ± 0.30.64 ± 0.133.69 ± 0.101.68 ± 0.0110.3 ± 0.1
(b) M. vulgaris
SubstrateTime XTSconNconYX/SEPSIPSIPS
(Days) (g/L)(%)(%)(g/g)(g/L)(g/L)(%, w/w)
Static
S-205d2.34 ± 0.0231.9 ± 0.037.9 ± 2.40.43 ± 0.021.20 ± 0.040.33 ± 0.0214.0 ± 0.2
10c7.35 ± 0.1472.5 ± 2.173.6 ± 2.10.60 ± 0.141.07 ± 0.031.14 ± 0.0115.5 ± 0.1
19a, b, e, f8.39 ± 0.2688.8 ± 0.196.3 ± 0.00.56 ± 0.260.06 ± 0.013.10 ± 0.0937.0 ± 1.1
S-258d6.78 ± 0.3970.0 ± 0.587.4 ± 0.60.48 ± 0.390.34 ± 0.021.29 ± 0.0019.0 ± 1.2
12c7.61 ± 0.0672.5 ± 1.589.7 ± 0.80.53 ± 0.060.31 ± 0.032.05 ± 0.0327.0 ± 0.8
16e, f7.89 ± 0.0180.1 ± 0.192.6 ± 0.80.49 ± 0.010.26 ± 0.072.84 ± 0.0136.0 ± 0.3
35a, b8.40 ± 0.2489.7 ± 0.296.4 ± 0.20.47 ± 0.240.12 ± 0.001.82 ± 0.1321.7 ± 1.5
M-205c, d3.47 ± 0.1116.4 ± 2.422.3 ± 0.70.96 ± 0.391.82 ± 0.050.49 ± 0.0114.0 ± 0.2
14e, f14.33 ± 0.0391.7 ± 0.890.4 ± 1.20.71 ± 0.020.83 ± 0.013.81 ± 0.0726.6 ± 0.5
19a, b15.42 ± 0.4495.9 ± 0.494.1 ± 0.20.73 ± 0.240.59 ± 0.033.47 ± 0.0722.5 ± 0.4
M-258c6.79 ± 0.4914.8 ± 1.345.1 ± 0.70.96 ± 0.393.39 ± 0.121.22 ± 0.1318.0 ± 0.6
12e, f9.86 ± 0.2537.7 ± 1.057.2 ± 0.70.64 ± 0.063.12 ± 0.232.61 ± 0.0526.5 ± 0.6
35a, b, d13.33 ± 0.4271.0 ± 1.085.8 ± 0.70.46 ± 0.243.44 ± 0.071.93 ± 0.1514.5 ± 1.1
Agitated
S-205c, d2.34 ± 0.3625.6 ± 0.625.2 ± 0.60.54 ± 0.361.18 ± 0.030.32 ± 0.0113.5 ± 0.2
19a, b, e, f8.40 ± 0.5398.3 ± 1.396.9 ± 0.30.50 ± 0.530.11 ± 0.013.02 ± 0.0835.9 ± 1.0
S-258d4.78 ± 0.0266.6 ± 2.539.0 ± 4.80.36 ± 0.020.44 ± 0.000.67 ± 0.0314.0 ± 1.2
35a–c, e, f11.05 ± 0.5296.6 ± 1.496.0 ± 0.00.57 ± 0.520.14 ± 0.012.22 ± 0.0720.1 ± 0.6
M-2019a–c, d, e, f16.81 ± 0.6195.4 ± 0.390.5 ± 0.10.80 ± 0.521.40 ± 0.024.24 ± 0.0825.2 ± 0.5
M-2516f7.35 ± 0.1240.3 ± 0.159.3 ± 1.40.44 ± 0.023.11 ± 0.041.42 ± 0.2319.4 ± 3.1
35a–c, d, e16.92 ± 0.7476.5 ± 1.284.3 ± 0.10.54 ± 0.523.93 ± 0.171.50 ± 0.158.8 ± 0.9
(c) M. conica
SubstrateTime XTSconNconYX/SEPSIPSIPS
(Days) (g/L)(%)(%)(g/g)(g/L)(g/L)(%, w/w)
Static
S-205d0.08 ± 0.0821.5 ± 0.014.1 ± 1.90.02 ± 0.081.11 ± 0.010.02 ± 0.0127.0 ± 0.3
12c6.54 ± 0.1956.2 ± 2.580.2 ± 0.10.69 ± 0.140.25 ± 0.002.06 ± 0.1431.5 ± 2.1
19a, b, e, f8.50 ± 0.2498.0 ± 0.596.2 ± 0.40.51 ± 0.010.07 ± 0.023.71 ± 0.1043.6 ± 1.2
S-258d6.91 ± 0.4486.4 ± 0.053.4 ± 0.20.40 ± 0.440.30 ± 0.032.00 ± 0.1729.0 ± 0.7
16c, e, f8.40 ± 0.0194.2 ± 0.478.6 ± 0.80.45 ± 0.010.12 ± 0.093.43 ± 0.0140.8 ± 0.1
35a, b8.71 ± 0.0299.5 ± 0.097.0 ± 0.20.44 ± 0.020.06 ± 0.012.46 ± 0.1328.2 ± 1.5
M-205d0.89 ± 0.0511.3 ± 0.85.5 ± 0.30.36 ± 0.442.37 ± 0.120.24 ± 0.0227.0 ± 1.0
10f12.48 ± 0.3872.0 ± 1.637.2 ± 1.20.79 ± 0.091.21 ± 0.114.37 ± 0.0735.1 ± 0.4
14e14.73 ± 0.4085.6 ± 0.562.3 ± 0.90.78 ± 0.010.73 ± 0.034.57 ± 0.0931.0 ± 0.6
19a, b16.02 ± 0.3096.9 ± 0.685.0 ± 0.70.75 ± 0.020.55 ± 0.063.64 ± 0.1022.7 ± 0.6
M-258c, d5.94 ± 0.5718.1 ± 0.715.9 ± 1.20.80 ± 0.443.14 ± 0.021.13 ± 0.1419.0 ± 1.3
12e, f9.48 ± 0.3531.9 ± 1.234.2 ± 1.20.72 ± 0.092.97 ± 0.033.15 ± 0.0833.2 ± 0.8
35a, b14.45 ± 0.0881.2 ± 0.483.6 ± 0.10.43 ± 0.021.98 ± 0.112.35 ± 0.0716.3 ± 0.5
Agitated
S-205c, d1.76 ± 0.9413.4 ± 0.021.6 ± 0.00.77 ± 0.941.01 ± 0.060.37 ± 0.0421.0 ± 0.5
19a, b, e, f10.85 ± 0.5899.5 ± 0.296.7 ± 0.20.64 ± 0.580.08 ± 0.034.55 ± 0.0742.0 ± 1.2
S-258d6.16 ± 0.0175.9 ± 1.362.1 ± 0.10.41 ± 0.010.71 ± 0.120.92 ± 0.0315.0 ± 0.4
16f8.00 ± 0.7196.5 ± 1.084.9 ± 0.90.41 ± 0.710.43 ± 0.024.14 ± 0.0351.8 ± 0.7
35a–c, e12.15 ± 0.0199.4 ± 0.096.5 ± 0.30.61 ± 0.010.11 ± 0.104.64 ± 0.1338.2 ± 1.0
M-205d3.37 ± 1.5814.6 ± 1.410.5 ± 0.20.80 ± 0.010.95 ± 0.010.78 ± 0.2323.0 ± 2.4
14f13.26 ± 0.1994.6 ± 1.785.1 ± 1.30.64 ± 1.150.69 ± 0.024.21 ± 0.1531.8 ± 1.1
19a–c, e18.16 ± 0.0197.4 ± 0.889.6 ± 0.00.85 ± 0.010.54 ± 0.234.81 ± 0.0926.5 ± 0.5
M-258d4.73 ± 0.1130.9 ± 1.535.9 ± 0.80.37 ± 0.013.18 ± 0.090.76 ± 0.1616.0 ± 2.6
12f5.56 ± 0.1134.2 ± 0.047.3 ± 0.50.40 ± 0.212.93 ± 0.081.20 ± 0.0121.7 ± 10.2
35a–c, e18.10 ± 0.0380.3 ± 1.276.3 ± 1.20.55 ± 0.011.90 ± 0.021.74 ± 0.029.6 ± 0.1
Table 3. Carbohydrate composition of total endopolysaccharides maximum values (IPSmax) produced by M. rotunda, M. vulgaris and M. conica cultivated in static and agitated (120 ± 5 rpm) cultures in sucrose (S-20, S-25) and molasses (M-20, M-25) substrates.
Morchella SpeciesSubstrateDayGlucoseFructoseMannitol
Static
M. rotundaS-201964.2 ± 3.315.1 ± 0.720.7 ± 1.3
S-251656.3 ± 3.924.0 ± 1.219.7 ± 0.9
M-201451.6 ± 4.112.9 ± 0.735.5 ± 1.6
M-253545.7 ± 5.226.1 ± 0.928.2 ± 0.8
M. vulgarisS-201963.4 ± 3.212.2 ± 0.224.4 ± 1.5
S-251663.4 ± 4.115.0 ± 0.921.6 ± 2.1
M-201452.7 ± 2.911.8 ± 1.135.5 ± 1.6
M-251257.2 ± 1.814.7 ± 0.528.1 ± 1.8
M. conicaS-201963.5 ± 3.512.0 ± 0.124.5 ± 1.2
S-251659.0 ± 2.019.9 ± 0.921.1 ± 2.1
M-201458.9 ± 1.09.7 ± 1.131.4 ± 1.7
M-251254.4 ± 4.117.6 ± 0.728.0 ± 1.4
Agitated
M. rotundaS-201958.9 ± 3.420.5 ± 0.820.6 ± 1.4
S-252852.3 ± 4.122.3 ± 1.225.4 ± 1.3
M-201956.6 ± 4.215.9 ± 0.927.6 ± 1.7
M-253536.8 ± 5.119.9 ± 0.843.3 ± 0.9
M. vulgarisS-201955.1 ± 3.322.2 ± 0.322.7 ± 1.6
S-253540.4 ± 4.222.6 ± 0.437.0 ± 2.5
M-201961.0 ± 3.112.1 ± 1.026.8 ± 1.3
M-253546.2 ± 1.912.6 ± 0.341.2 ± 1.9
M. conicaS-201970.2 ± 3.611.1 ± 0.918.7 ± 1.2
S-253570.4 ± 2.312.3 ± 0.417.4 ± 1.5
M-201961.3 ± 1.810.1 ± 0.828.6 ± 1.3
M-253548.4 ± 3.711.3 ± 0.140.3 ± 0.9
Publisher’s Note: MDPI stays neutral with regard to jurisdictional claims in published maps and institutional affiliations.

