1. Introduction
The low Earth orbit (LEO) constellation is widely used in space-based global communications and remote sensing. Through the integration of Internet technology and satellite technology, the development of a cloud service platform that continuously updates multi-source data, and the analysis and prediction of earth observation image information based on big data mining and other services will become the focus of the next research [
1]. However, large-scale LEO constellations have generated a series of problems for the human space industry, including severe threats to the space debris environment, vicious competition for orbit and frequency resources, and potential risks of international conflicts in dense low-orbit regions. The increase in the number of space objects has begun to threaten the safety of the LEO area. Kessler showed that when the LEO debris density reaches a critical value, it will cause the debris to produce a chain impact effect, rendering the near-Earth space area completely unusable [
2]. Due to a large number of satellites in the LEO constellation, the debris generated when passing through the dense area of space targets during the launch process will increase the number of space objects and the collision probability of itself.
In recent years, more and more companies have begun to put forward low-orbit large constellation launch plans. For example, OneWeb plans to build a constellation of 720 satellites at the height of 1200 km orbit, which are evenly distributed on 18 near-polar orbits [
3]. Boeing will deploy a total of 2956 satellites in 1082 km, 1030 km and 970 km orbits in three phases. At present, most companies are still in the constellation design and networking stage, and there is little research on constellation security.
In order to further determine the impact of large constellations on the future space debris environment, many scholars have studied large constellations using their own long-term evolution models. References [
4,
5,
6] studies the impact of the type of constellation disposal orbit, the time in orbit after the mission and the mobility of the satellite on the future environment. References [
7,
8,
9] have studied the effects of changing the success rate of constellation post-mission disposal (PMD), in-orbit life after mission and the number of satellites in the constellation on the number of space debris in the future. Ref. [
10] analyzes the main factors affecting the space debris environment by changing the mass, number, area and PMD orbital height of the launched satellite. Satellites with a larger area and mass are more likely to collide, and more debris are produced after the collision, which has a greater impact on the space environment. The success rate of PMD is an important factor affecting the sustainable development of the space environment, which can directly reflect the growth rate of space debris. Therefore, the performance of the satellite with low mass and a small area is better, the mitigation guidelines should be strictly observed when launching large constellations, and the satellite should have the ability to avoid a collision.
The above studies focus on the impact of individual factors of the number, area and mass of satellites in the constellation on the future environment, but lack of comprehensive analysis of the impact of the number, area and mass of satellites in the constellation on the long-term evolution results. and the impact of different deployment heights of constellations and the interaction between satellites in constellations on the environment is not deeply considered. In this paper, taking the Starlink constellation as an example, the interaction between the constellation and the space debris environment is discussed, and the orbital evolution of the constellation during the mission cycle is analyzed. In different mission stages, the flux analysis of individual satellite and overall satellite constellation is carried out, and calculate the collision risk assessment. According to the different operating heights and inclination of the constellation, the number of avoidance maneuvers and risk levels are evaluated, and the impact of the success rate of post mission disposal (PMD) on the space environment is analyzed. Finally, in the conclusion, the interaction between the space debris environment and the large satellite constellation is given, and the constellation satellite protection and mitigation suggestions are provided.
The structure of the paper is as follows.
Section 2 introduces the deployment and situation of the Starlink constellation.
Section 3 evaluates the collision risk of satellites and constellations in different mission stages.
Section 4 analyzes the avoidance maneuver of the constellation and the corresponding risk level.
Section 5 gives the impact of the success rate of constellation PMD.
Section 6 gives the discussion and conclusions.
2. The Starlink Constellation
According to data published by SpaceX and the Space-track website [
11], the Starlink constellation plans to deploy a total of 42,000 satellites in LEO by four phases, as shown in
Table 1. Each satellite will have a mass of about 260 kg, the design life is 5 years, and the orbit alttitude is adjusted by electric propulsion. At present, the project has completed the construction of the first phase of the orbital layer, and the number of satellites in orbit has reached 1628.
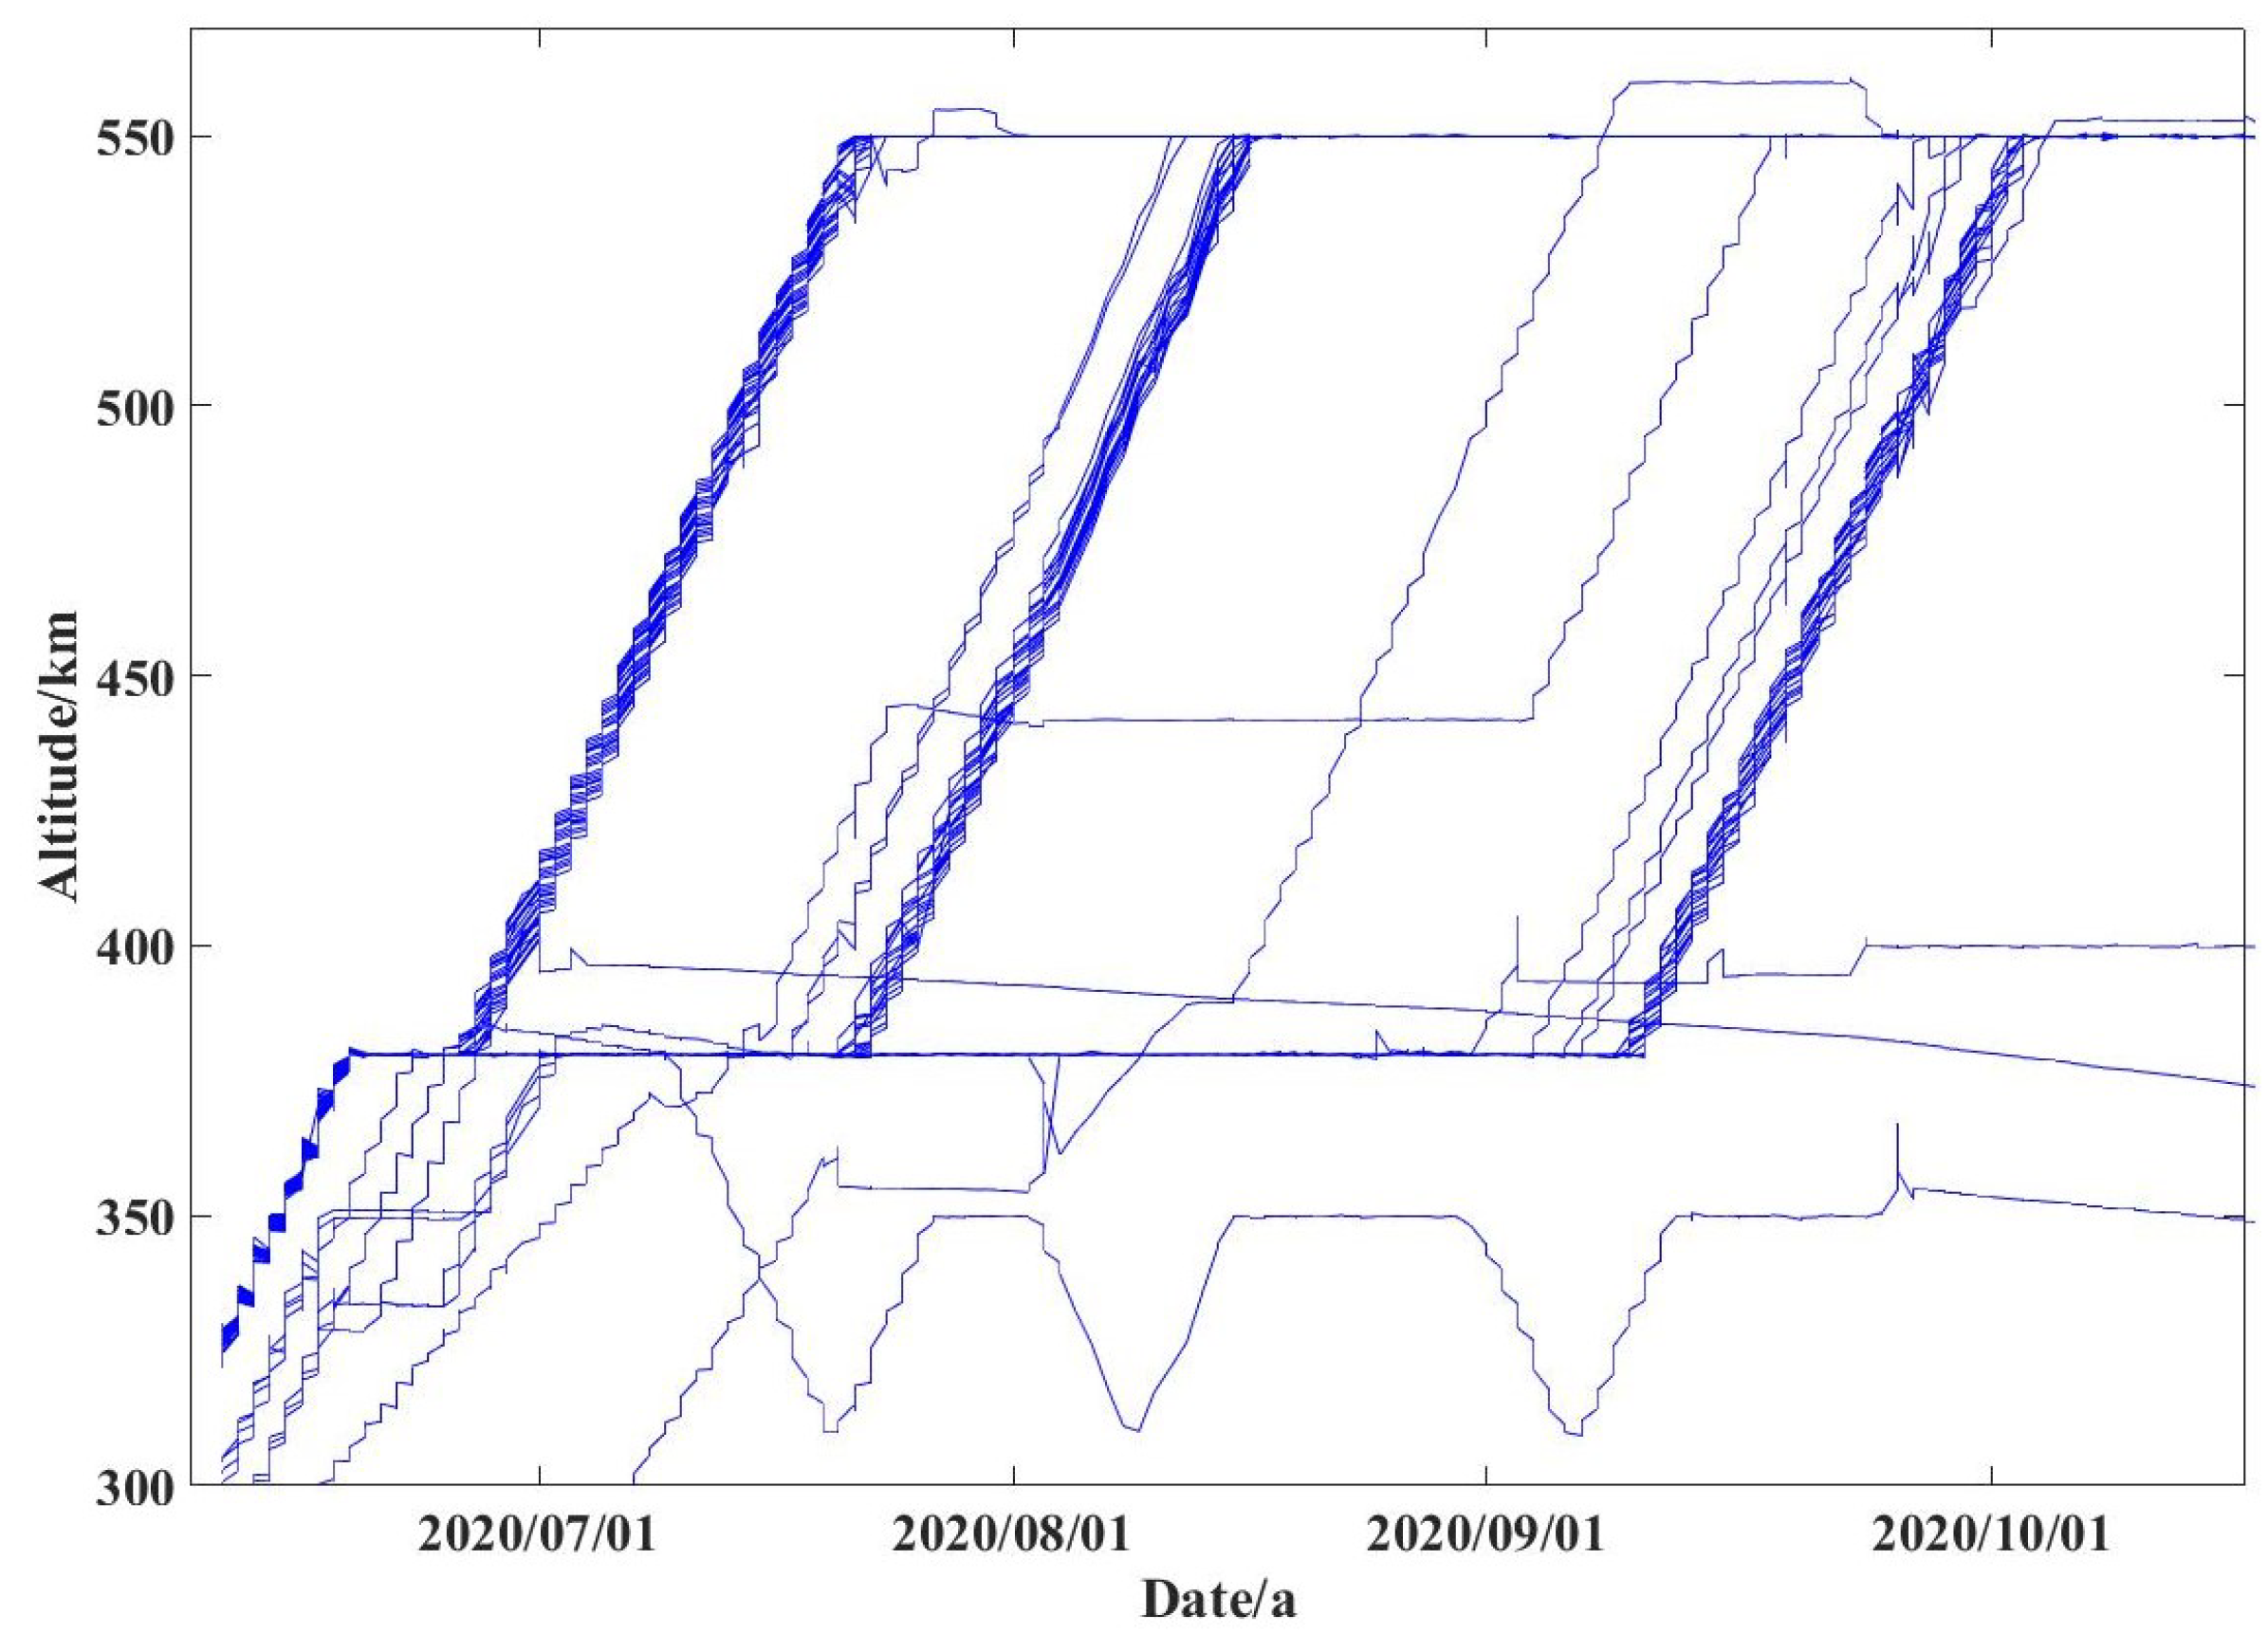
Starlink satellite is released at 300 km circular orbit, and climb to the mission orbit at 550 km altitude in three months, then active mission for 5 years. The satellite is equipped with an active collision-avoidance system to reduce the impact of satellite collision. At the end of the mission, the satellite took the initiative to break out of orbit and re-enter the atmosphere to be destroyed. According to the first test satellites launched in May 2019, 95% of the parts of the satellite during the reentry phase can be burned quickly and do not endanger the operation of other spacecraft.
The mission of the Starlink satellite is split into three phases:
Release at 53 inclination at 300 km, and climb to the mission orbit of 550 km in 2–3 months.
Running normally on the mission orbit for 5 years.
Decelerating by an electric engine to re-enter the atmosphere, burn-up and be destroyed.
The Starlink satellite is characterized by a flat plate design with a size of 2.8 m × 1.4 m × 0.15 m, with one solar panel with the length of 9 m [
12]. The maximum cross-section of the satellite is calculated to be 25.2 m
.
3. Risk Analysis of Constellation Collision
When describing the risk of collision between the space debris environment and the constellation, it is necessary to evaluate the debris size threshold that can cause catastrophic collisions. The Energy-to-Mass ratio (
EMR) is used as a measure of catastrophic collision events, which is defined as
where
describes the mass of the debris,
is the velocity between satellite and target debris,
is the satellite mass. If the
EMR exceeds the 40,000 J/kg, the collision is considered to be catastrophic [
13], which means the satellite is completely broken. Through the analysis of the historical collision event, taking the average velocity 10 km/s, it is calculated that the mass of the target debris in the catastrophic collision is 0.210 kg, assuming that the target debris to be sphere [
14], and the density is 2.8 g/cm
, which is similar to that of the aluminum material. The diameter threshold of the catastrophic collision is about 6 cm, which is smaller than the detectable threshold, 10 cm. Therefore, it is impossible to use the available anti-collision technology to avoid it.
Based on the flux
F calculated in the MASTER model [
15], determine the average number of collisions of the satellite [
16], which is defined as
where
T is the running time range of the satellite, and
A is the collision cross-sectional area, which can be calculated according to the radius of the satellite and the target debris
According to the average number of collisions, Poisson distribution is used to calculate the probability distribution of
n collisions
The probability of no impact (
n = 0) is
The probability of one or more impact is
3.1. Phase 1: Climbing from 300 km to 550 km
After the release of each batch of Starlink satellites, the climbing process and orbital height changes are shown in
Figure 1. The first batch lasts about 41 days, the second batch lasts about 65 days, and the third batch lasts about 115 days. The average climbing days of 73 days are selected as the time parameter. During the climbing phase, the evolution of the flux and orbital height of Starlink satellites encountering ≥6 cm objects over time is shown in
Figure 2. At this stage, the overall objects flux fluctuates between
/m
/a to
/m
/a, and the highest flux is about
/m
/a during the adjustment waiting for orbit ascent.
The average number of collisions and the relationship between the collision probability and the debris diameter of a single satellite and all satellites in the orbital layer during the climbing phase are shown in
Table 2. The collision probability of debris larger than 6 cm to a single satellite is less than 0.01%, and the collision probability of 1628 satellites in the orbital layer is 1.89%.
3.2. Phase 2: Operational Time at 550 km
After reaching the mission orbit, the satellite will operate stably at 550 km altitude for five years. The time-dependent variation of the flux of ≥6 cm objects encountered by Starlink satellites is shown in
Figure 3. Due to the constant height of the satellite, the debris flux fluctuates from
/m
/a to
/m
/a, and the overall number has a downward trend.
The average number of collisions and the relationship between the collision probability and the debris diameter of a single satellite and all satellites in the orbital layer during the working phase are shown in
Table 3. During the 5-year operation, the collision probability of orbiting satellites with objects larger than 1 cm is 99.99%, and for objects larger than 6 cm is 63.36%.
3.3. Phase 3: Take Derailment Disposal, Decelerate and Deviate from the Mission Orbit
The power system of the Starlink satellite uses a krypton ion thruster, which triggers the active derailment device after the five-year operation mission, and the thruster continues to apply small thrust to reduce the satellite’s orbital altitude, and finally, enter the atmosphere to burn and destroy. The duration of this stage is about 9.7 months. The variation of the flux of the satellite encountering ≥6 cm objects with time and the evolution of the satellite orbital height are shown in
Figure 4. At the beginning of satellite disposal, the flux of the object fluctuates from
/m
/a to
/m
/a, the satellite orbit altitude reaches 350 km is affected by atmospheric resistance. The orbit height decreases rapidly and enters the atmosphere for combustion and destruction.
The relationship between the average collision times, collision probability and objects diameter of a single satellite and all satellites in the orbital layer during the out-of-orbit disposal phase is shown in
Table 4. In the out-of-orbit disposal phase, the collision probability of the orbital layer satellite with objects larger than 1 cm is 50.15%, and the collision probability with objects larger than 6 cm is 6.83%.
3.4. Starlnik Constellation Collision Risk
SpaceX has given the planning parameters of about 38,000 satellites expected to be deployed in Phase iii and iv, but the final deployment mode still needs to be adjusted according to the actual use after the completion of the networking of Phase i and Phase ii. Therefore, in this paper, only the Phase i satellites have already been in orbit and the Phase ii satellites to be launched are used in the overall analysis of the Starlink constellation, with a total of 4452 satellites. It can be seen from
Table 1 that phase ii satellites are deployed in four orbital layers. The height of the first orbital layer is 540 km and the inclination is 53.2
. There are 1584 satellites in total. The height of the second orbital layer is 570 km and the inclination is 70
with 720 satellites. The main orbital parameters of the third orbital layer and the fourth orbital layer are the same, the altitude is 560 km, the inclination is 97.6
, a total of 520 satellites. Similarly, the complete mission cycle of the satellite is divided into three stages to evaluate the space object flux and collision risk in the orbit of a single satellite, and to calculate the overall collision probability of the satellite in the orbital layer. The flux variation of the objects above 6 cm encountered by satellites with different orbital layers in the Starlink constellation during the mission cycle is shown in
Figure 5, and the single and overall collision probabilities of satellites with different orbital layers are shown in
Table 5.
In the working stage of the satellite, when satellites have a similar orbit, the object flux in the orbit with a 97.6
inclination is about twice as much as that at the inclination of 53
, and the collision risk of the satellite in the orbit with high inclination is higher. When satellites have a similar inclination, the initial flux of the space object at the 540 km is slightly larger than that of the 550 km, but due to the influence of atmospheric resistance, the fading speed of the object with low orbit is faster, and the average flux at the 550 km is larger during the overall working time in orbit, so the risk of satellite collision is higher. As can be seen from
Table 5, the collision probability of a single satellite increases with the promotion of the orbital inclination, but because of more satellites in the orbital layer near the low inclination, the corresponding overall collision probability is higher. In the whole mission cycle of the satellite life, the collision risk is the highest in the in-orbit operation phase, so we need to pay more attention to the design of collision avoidance and in-orbit satellite monitoring.
4. Analysis of Constellation Collision Maneuver
Starlink satellites can take evasive maneuver measures on the basis of collision early warning based on the cataloged object orbit data provided by the US Space Surveillance Network, but because the thrust provided by ion thruster is small, the fuel or working medium that the satellite can carry is limited, and the operation time of each avoidance maneuver is longer than several minutes. A too-high maneuvering frequency or long-term altitude changes will lead to a constellation configuration change. Therefore, it is necessary to selectively avoid possible collisions. When formulating the avoidance strategy in the design stage of the satellite, the accepted collision probability level (ACPL) is usually used as the evaluation criterion to measure whether to take evasive measures or not. For satellites operating in LEO orbits, the ACPL values used in the design are between
and
[
17].
The DRAMA software [
18] developed by the ESA is used to analyze the avoidance maneuver times and collision risk of 1628 Starlink satellites deployed in phase i. The cross-section of the satellite is 25.2 m
, the equivalent radius is 2.667 m, and the collision risk of objects of 6 cm and above is considered.
4.1. Phase 1: Collision Avoidance Maneuver during Climbing
In order to simplify the calculation process of the model, the satellite orbit in the climbing phase is approximately an elliptical orbit of 300 km × 550 km, the semi-major axis is 6803 km, the eccentricity is 0.0184 and the orbit inclination is 53
. The calculation time is 73 days. The calculated results are described by two data, one is detectable, that is, the collision probability and flux of objects above 10 cm (subscript d), and the other is the overall collision probability and flux of space objects, including undetectable objects evolved from the space debris model (subscript w), as shown in
Table 6.
The ACPL value is defined by the engineer as a parameter that is beneficial to the efficient avoidance and maneuver of the satellite. The value range of ACPL in actual operation is comprehensively considered by calculating the avoidance times of the satellite under a certain collision probability level. It can be seen from the data in
Table 5 that, although the collision probability of a single satellite at the inclination of the high orbit is larger, the overall collision probability of the orbital layer is smaller due to the influence of the number of satellites. Therefore, when calculating the avoidance times of all satellites in a constellation corresponding to different ACPL values, it is necessary to optimize the average avoidance times of the single satellites in this environment, so as to obtain the avoidance maneuver times corresponding to different ACPL values in this orbital layer.
Figure 6 shows the variation of the total avoidance times of 1628 Starlink satellites with the ACPL value during the climbing phase. when the ACPL value is
, the satellite in this orbital layer needs about 2000 maneuvers to avoid, and a low ACPL value will reduce the operation and efficiency of the satellite. When the ACPL value is
, the orbital layer satellite only needs to avoid three times.
Figure 7 shows the relationship between the overall collision risk and the number of avoidance. The total collision risk is reduced by 0.2% (Risk Reduction) due to three avoidance maneuvers, and the residual risk of detectable objects and remaining risk of all objects is about 1.5%, indicating that the impact of non-detectable objects with diameters between 6–10 cm on satellite collision risk is small.
4.2. Phase 2: Collision Avoidance Maneuver during Working in Orbit
During the operation of the satellite, it operates in a near-circular orbit at the height of 550 km, with a semi-major axis of 6928 km, an orbital inclination of 53
and an eccentricity of 0.0001. The calculation time is from January 2021. The on-orbit collision avoidance simulation is carried out for 5 years, and the annual collision probability and flux with detectable objects and all objects are obtained, as shown in
Table 7.
Figure 8 shows the relationship between the total number of circumvention and ACPL value during satellite operation in orbit. When the ACPL value is
, the total number of avoidance of all satellites is about 1300, with an average annual avoidance of 260, as can be seen from
Figure 9, if the corresponding full maneuver avoidance is carried out, the collision risk can be reduced by 60%, and the remaining collision risk for all space objects is 20%. When the ACPL value is
, all mobile avoidance can reduce the remaining risk to less than 5%, but too many avoidance times will lead to an increase in fuel demand, so it is necessary to make a reasonable choice of ACPL value according to the mission situation.
4.3. Phase 3: Collision Avoidance Maneuver in the Stage of Derailment Disposal
As can be seen from
Figure 4, the fading speed accelerates when the satellite orbit altitude is lower than that of 350 km, and the debris is highly affected by the atmosphere and the space object flux is low, and the collision between the two is relatively small. The orbit of the satellite in the out-of-orbit phase is approximate to the elliptical orbit of 550 km × 350 km, the semi-major axis is 6828 km, the eccentricity is 0.01465, the inclination of the orbit is 53
, and the calculation time is 293 days. the annual collision probabilities and fluxes of detectable objects and all objects are obtained as shown in
Table 8.
Figure 10 shows the relationship between the overall avoidance times and the ACPL value of the satellite in the out-of-orbit disposal phase. When the ACPL value is
, all satellites need to perform 15 avoidance maneuvers at this stage. As shown in
Figure 11, the risk after the maneuver is reduced by 1%, and the collision remaining risk caused by all space objects is 5.7%. By increasing the number of avoidances, the remaining risk can continue to be reduced.
4.4. Starlink Constellation Collision Avoidance Maneuver
Based on the analysis of the collision avoidance maneuvers of the other three orbital layers mentioned in
Section 3.4,
Table 9 shows the average collision probability and average object flux of a single satellite in each orbital layer during the mission. When the value of ACPL is
, the total avoidance maneuver times of the satellite in each stage and in the whole mission under different orbit parameters are shown in
Figure 12. The flux of space objects in the orbit with high inclination is larger, and more collision avoidance maneuvers are needed in the climbing phase to ensure the safe and orderly follow-up work of the satellite.
When the orbit height is similar, the number of avoiding maneuvers in the low inclination orbital layer is about 1500 times during the mission cycle, and the total avoidance times of the high inclination orbital layer satellites is about 500. The satellites on the low inclination orbital layer need to pay more attention to their operation status and replace damaged or failed satellites in time.
5. The Influence of Constellation on Space Environment
The launch of a large number of constellations will significantly increase the number of space objects, increase the risk of collision between satellites, and have an irreversible impact on the space environment. According to the Delta model [
19] developed by the ESA to simulate the evolution of future space objects, considering the effects of the explosion, collision, disintegration and other events as the main sources of debris, it is calculated that the introduced constellation consists of 4452 satellites deployed in phase i and ii of the Starlink constellation. The design life of a single satellite is 5 years, it was first launched in May 2019, and the deployment of all constellations will be complete in 2026. Using the Monte Carlo method [
4,
20] to calculate the number of space objects above 10 cm under different conditions in the next 20 years.
5.1. Impact of Single Satellite Collision
A large number of debris will be produced after the collision and break up of the satellite in the course of operation. There are two kinds of collision situations: one is the collision between the satellite and the small debris, and the other is the collision between the satellite and the satellite. The parameters such as mass, area–mass ratio and velocity increment produced by the disintegration of space objects can be simulated by using NASA’s EVOLVE 4.0 break up model [
21], and the initial motion state of the breakup debris cloud can be obtained. This analysis only aims at the collision between the Starlink satellite and other mission satellites in the 550 km orbit, and the two satellites completely break up after the collision. The distribution of fragments larger than 10 cm is simulated according to the breakup model, as shown in
Figure 13 and
Figure 14.
The area-mass ratio can reflect the relationship between the size and quality of debris produced by satellite break up. Through simulation, it is calculated that the number of debris larger than 10 cm after the collision between Starlink satellites and other mission satellites is about 540, and the velocity increment of debris is concentrated in 10–150 m/s.
Figure 15 shows the orbital distribution larger than that of 10 cm debris after the collision. Because the orbit of the satellite is a 550 km circle orbit, the orbit height of the breakup debris is mainly concentrated in this area, which has a great impact on the parent satellite and there is a collision threat.
5.2. Objects Number Influenced by Constellation
Based on the collision simulation of a single satellite, the collision influence of the constellation is analyzed comprehensively.
Figure 16 shows the evolution of the number of space objects larger or equal to 10 cm with and without constellations. After joining constellations, the number of objects increases obviously at the beginning and then fluctuates. The blue line represents the proportion of space objects with and without constellations, which is on the rise, indicating that the existence of constellations has accelerated the growth of the number of objects, and by 2040, the number of space objects will be nearly 1.3 times higher than when there are none constellations. This is only the impact of some satellites in the Starlink constellation plan. In the later stage, after all 38,000 satellites are deployed, the impact on the number of objects will increase exponentially, and the collision risk will increase step by step. The high requirements for configuration and accuracy of constellation satellites may even lead to cascade collisions.
5.3. PMD Rate Influence
Although the Starlink satellite adds the post-mission active derailment link in the design phase, if the satellite collides or is damaged during the mission cycle, the active derailment device can not be effectively triggered, resulting in a longer period of satellite re-entry into the atmosphere and increasing the impact on the space environment, so it is necessary to analyze the post-mission disposal (PMD) success rate.
Figure 17 compares the object growth trend under the four PMD success rates of 50%, 75%, 90%, 100%. The increase in the number of objects corresponding to the higher PMD rate at the initial stage of deployment is more moderate. After the completion of deployment, the growth trend of objects corresponding to the four PMD rates is similar, and the growth rate of objects with 90% and 100% PMD success rates slows down in the later stage. The lower the PMD rate, the higher the number of satellites left in orbit, the greater the probability of collision with the passage of time, and the interaction between the accumulation of satellites and space objects will lead to the continuous deterioration of the space environment.
Figure 18 shows the ratio of the number of objects corresponding to different PMD rates to the number of objects without constellations. The higher PMD rate can reduce the growth rate of space objects, but due to the influence of constellations, the growth rate of objects continues to rise. By 2040, even with the PMD success rate up to 100%, the growth rate of objects will still be about 1.07. Therefore, the introduction of large satellite constellations is bound to have an impact on the space environment and the growth of space objects, and the risk of this impact can be reduced to a certain extent by improving the success rate of PMD.
6. Discussion
In this paper, the Starlink constellation planned by SpaceX Company is used as the research object. By changing the number of satellites in the constellation, the orbital height and inclination of the constellation, the effects of the launch of large constellations on space object flux, collision probability, avoidance maneuver times and future space debris environments are analyzed.
According to the calculation, objects above 6 cm will cause catastrophic collisions of Starlink satellites, and the maximum flux on the satellite is during the working period in orbit, and the long mission cycle further increases the collision risk of this stage. In addition, the collision of the three orbital layers planned to be launched by the Starlink constellation is also analyzed. when the orbital height is similar, the collision probability of a single satellite increases with the promotion of the orbital inclination, but there are more satellites in the low-inclination orbit, the overall collision probability is higher, and the collision probability in the working phase in orbit is more than 60%.
When a single satellite is maneuvering and avoiding, it is only necessary to consider the influence of maneuverability and mission execution efficiency. When studying the maneuver avoidance of constellations, it is necessary to comprehensively consider the factors such as the maintenance of constellation configuration, acceptable collision level, avoidance times, etc. This paper focuses on the analysis of the situation when the value of ACPL is , during the operation of the satellite, taking reasonable circumvention measures can reduce the risk level by more than 50%. Affected by the number of satellites, the number of avoidance maneuvers in a low-inclination orbital layer is about 1500 and that in a high-inclination orbital layer is about 1500. In practical engineering applications, an efficient collision avoidance method for satellites can be developed according to ACPL values and risk assessment parameters.
The collision of satellite constellations may lead to satellite failure and the increase of space debris. The NASA Break-up model is used to simulate the impact on the space environment after the collision between a single satellite and other mission satellites. On this basis, the Delta debris long-term evolution model and Monte Carlo method are used to evolve the number of space objects in the next 20 years. The number and growth ratio of space objects are analyzed in the case of introducing the Starlink constellation and adopting different PMD success rates for satellites in the constellation. The improvement of the success rate of PMD can alleviate the growth rate of space objects, but cannot offset the impact of the introduction of constellations.
7. Conclusions
Launching large constellations into LEO to promote the integration of communication Internet is a development direction that many companies are presently focusing on. In order to ensure the safety and order of the space environment, the relevant responsible personnel need to understand the possible lasting impacts of such missions on the space environment and design them reasonably in the early planning, operation and testing stages. The fewer the number of satellites in the constellation and the smaller the orbital inclination, the less harm to the space debris environment. To realize the function, we can comprehensively consider the relationship between the number of satellites in the constellation and the orbital parameters, and select the scheme that has the least impact on the environment, and achieves the highest reliability of satellite post-mission disposal. It is crucial to strictly comply with the space debris mitigation guidelines proposed by the Inter-Agency Space Debris Coordination Committee (IADC) [
22], and create a good space environment order.
Author Contributions
Conceptualization, R.W., X.Y. and S.R.; methodology, S.R., R.W.; software, S.L., R.W. and S.R.; validation, S.R., R.W.; formal analysis, S.R., R.W.; investigation, S.L., X.Y. and X.S.; data curation, S.R.; writing—original draft preparation, S.R.; writing—review and editing, all authors; visualization, S.R., X.S. and S.L. All authors have read and agreed to the published version of the manuscript.
Funding
This research received no external funding.
Institutional Review Board Statement
Not applicable.
Informed Consent Statement
Not applicable.
Data Availability Statement
This study did not report any data.
Conflicts of Interest
The authors declare no conflict of interest. The funders had no role in the design of the study; in the collection, analyses, or interpretation of data; in the writing of the manuscript, or in the decision to publish the results.
References
- Zhao, Q.Y.; Hu, C.B.; Chen, C. Opportunities and challenges of low-orbit large constellations. Space Debris Res. 2020, 1, 1–9. [Google Scholar]
- Kessler, D. Collision Cascading: The limits of population growth in low Earth Orbit. Adv. Space Res. 1991, 11, 63–66. [Google Scholar] [CrossRef]
- Chun, X. New Development of Oneweb Space Internet Leo Constellation. Satell. Appl. 2016, 6, 75–77. [Google Scholar]
- Virgili, B.B.; Dolado, J.C.; Lewis, H.G.; Radtke, J.; Krag, H.; Revelin, B.; Cazaux, C.; Colombo, C.A.; Crowther, R.; Metz, M. Risk to space sustainability from large constellations of satellites. Acta Astronaut. 2016, 126, 154–162. [Google Scholar] [CrossRef] [Green Version]
- Virgili, B.B.; Krag, H. Small satellites and the future space debris environment. In Proceedings of the 30th International Symposium on Space Technology and Science, Kobe, Japan, 4–10 July 2015. [Google Scholar]
- Virgili, B.B.; Krag, H.; Lewis, H. Mega-constellations and small satellites and their impact on the space debris environment. In Proceedings of the 67th International Astronautical Congres, Guadalajara, Mexico, 27 September 2016. [Google Scholar]
- Kitajima, S.; Abe, S.; Hanada, T.; Kawamoto, S. Influences of MEGA constellations on the orbital environment. In Proceedings of the 67th International Astronautical Congres, Guadalajara, Mexico, 27 September 2016. [Google Scholar]
- Kawamoto, S.; Hirai, T.; Kitajima, S.; Abe, S.; Hanada, T. Evaluation of space debris mitigation measures using a debris evolutionary model. Trans. Jpn. Soc. Aeronaut. Space Sci. 2018, 16, 599–603. [Google Scholar] [CrossRef]
- Lewis, H.; Radtke, J.; Rossi, A.; Beck, J.; Oswald, M.; Anderson, P.; Bastida Virgili, B.; Krag, H. Sensitive of the space debris environment to large constellations and small satellite. J. Br. Interplanet. Soc. 2017, 70, 105–117. [Google Scholar]
- Rossi, A.; Alessi, E.M.; Valsecchi, G.B.; Lewis, H.; Radtke, J.; Bombardelli, C.; Bastida Virgili, B. A quantitative evaluation of the environmental impact of the mega constellations. In Proceedings of the 7th European Conference on Space Debris, Darmstadt, Germany, 18–21 April 2017. [Google Scholar]
- Space-Track.Org. Available online: www.space-track.org (accessed on 1 July 2021).
- McDowell, J.C. The Low Earth Orbit Satellite Population and Impacts of the SpaceX Starlink Constellation. Astrophys. J. Lett. 2020, 892, L36. [Google Scholar] [CrossRef] [Green Version]
- Chobotov, V.A.; Herman, D.E.; Johnson, C.G. Collision and Debris Hazard Assessment for a Low-Earth-Orbit Space Constellation. J. Spacecr. Rocket. 1997, 2, 233–236. [Google Scholar] [CrossRef]
- Radtke, J.; Kebschul, C.; Stoll, E. Interactions of the space debris environment with mega constellations—Using the example of the OneWeb constellation. Acta Astronaut. 2017, 131, 55–68. [Google Scholar] [CrossRef]
- Flegel, S.; Gelhaus, J.; Möckel, M.; Wiedemann, C.; Kempf, D.; Krag, H.; Vörsmann, P. Maintenance of the ESA MASTER Model—Final Report 21705/08/D/HK; Institute of Space Systems, TU Braunschweig: Braunschweig, Germany, 2011. [Google Scholar]
- Klinkrad, H. Space Debris—Models and Risk Analysis; Springer: Berlin/Heidelberg, Germany, 2006. [Google Scholar]
- Space Debris Office. Collision Avoidance Requirements Verification and Guidelines Based on DRAMA/ARES.MIT-COL-MAN-00279-OPS-SD; Space Debris Office: Darmstadt, Germany, 2020. [Google Scholar]
- ESA/ESOC Space Debris Office. Debris Risk Assessment and Mitigation Analysis (DRAMA) Software User Manual; ESA/ESOC Space Debris Office: Darmstadt, Germany, 2020. [Google Scholar]
- Walker, R.; Martin, C.E.; Stokes, P.H.; Wilkinson, J.E.; Klinkrad, H. Analysis of the effectiveness of space debris mitigation measures using the DELTA model. Adv. Space Res. 2001, 28, 1437–1445. [Google Scholar] [CrossRef]
- Foreman, V.L.; Siddiqi, A.; Weck, O.L. Large Satellite Constellation Orbital Debris Impacts: Case Studies of OneWeb and SpaceX Proposals. In Proceedings of the AIAA SPACE and Astronautics Forum and Exposition, Orlando, FL, USA, 12–14 September 2017. [Google Scholar]
- Johnson, N.L.; Krisko, P.H.; Liou, J.C.; Anz-Meador, P.D. NASA’s new breakup model of EVOLVE 4.0. Adv. Space Res. 2001, 28, 1377–1384. [Google Scholar] [CrossRef]
- IADC 2007, IADC Space Debris Mitigation Guidelines, IADC-02-01 Revision 1. Available online: www.iadc-home.org/documents_public (accessed on 15 July 2021).
Figure 1.
Starlink satellite orbit altitude.
Figure 1.
Starlink satellite orbit altitude.
Figure 2.
Flux and satellites altitude over time during Phase 1 with objects ≥6 cm.
Figure 2.
Flux and satellites altitude over time during Phase 1 with objects ≥6 cm.
Figure 3.
Flux and satellites altitude over time during Phase 2 with objects ≥6 cm.
Figure 3.
Flux and satellites altitude over time during Phase 2 with objects ≥6 cm.
Figure 4.
Flux and satellites altitude over time during Phase 3 with objects ≥6 cm.
Figure 4.
Flux and satellites altitude over time during Phase 3 with objects ≥6 cm.
Figure 5.
Flux of objects on satellites with different orbital parameters with objects ≥6 cm.
Figure 5.
Flux of objects on satellites with different orbital parameters with objects ≥6 cm.
Figure 6.
The relationship between the mean number of avoidance manoeuvres and ACPL during Phase 1.
Figure 6.
The relationship between the mean number of avoidance manoeuvres and ACPL during Phase 1.
Figure 7.
The relationship between risk and the mean number of avoidance manoeuvres during Phase 1.
Figure 7.
The relationship between risk and the mean number of avoidance manoeuvres during Phase 1.
Figure 8.
The relationship between the mean number of avoidance manoeuvres and ACPL during Phase 2.
Figure 8.
The relationship between the mean number of avoidance manoeuvres and ACPL during Phase 2.
Figure 9.
The relationship between risk and the mean number of avoidance manoeuvres during Phase 2.
Figure 9.
The relationship between risk and the mean number of avoidance manoeuvres during Phase 2.
Figure 10.
The relationship between the mean number of avoidance manoeuvres and ACPL during Phase 3.
Figure 10.
The relationship between the mean number of avoidance manoeuvres and ACPL during Phase 3.
Figure 11.
The relationship between risk and the mean number of avoidance manoeuvres during Phase 3.
Figure 11.
The relationship between risk and the mean number of avoidance manoeuvres during Phase 3.
Figure 12.
The mean number of avoidance manoeuvres for each orbital satellite.
Figure 12.
The mean number of avoidance manoeuvres for each orbital satellite.
Figure 13.
Breakup fragments‘ area-mass ratio distribution.
Figure 13.
Breakup fragments‘ area-mass ratio distribution.
Figure 14.
Breakup fragments‘ velocity increment distribution.
Figure 14.
Breakup fragments‘ velocity increment distribution.
Figure 15.
Breakup fragments‘ orbit distribution.
Figure 15.
Breakup fragments‘ orbit distribution.
Figure 16.
The influence of constellations on the evolution of objects more than 10 cm.
Figure 16.
The influence of constellations on the evolution of objects more than 10 cm.
Figure 17.
The influence of different PMD success rates on the evolution of objects.
Figure 17.
The influence of different PMD success rates on the evolution of objects.
Figure 18.
The ratio of different PMD success rates and objects without joining constellations.
Figure 18.
The ratio of different PMD success rates and objects without joining constellations.
Table 1.
Starlink constellation plan.
Table 1.
Starlink constellation plan.
| Phase | Orbital Altitude (km) | Inclination () | Number of Satellites |
|---|
| i | 550 | 53.0 | 1584 |
| ii | 540 | 53.2 | 1584 |
| | 570 | 70.0 | 720 |
| | 560 | 97.6 | 348 |
| | 560 | 97.6 | 172 |
| iii | 340 | 42–53 | 7518 |
| iv | 328–580 | 30–87.7 | 30,000 |
Table 2.
Fluxes, numbers of impacts and probability for one or more collisions for constellation objects during Phase 1.
Table 2.
Fluxes, numbers of impacts and probability for one or more collisions for constellation objects during Phase 1.
| Class | Flux (1/m/a) | N | (%) | | (%) |
|---|
| cm | 3.16 | 1.42 | 0.02 | 2.31 | 20.60 |
| cm | 2.56 | 1.17 | <0.01 | 1.91 | 1.89 |
| cm | 1.60 | 7.43 | <0.01 | 1.21 | 1.20 |
| m | 5.24 | 3.30 | <0.01 | 5.37 | 0.54 |
Table 3.
Fluxes, numbers of impacts and probability for one or more collisions for constellation objects during Phase 2.
Table 3.
Fluxes, numbers of impacts and probability for one or more collisions for constellation objects during Phase 2.
| Class | Flux (1/m/a) | N | (%) | | (%) |
|---|
| cm | 6.58 | 8.39 | 0.84 | 4.60 | 99.99 |
| cm | 4.74 | 6.17 | 0.06 | 4.19 | 63.36 |
| cm | 4.03 | 5.30 | 0.05 | 3.19 | 57.80 |
| m | 6.74 | 1.18 | 0.01 | 7.71 | 17.53 |
Table 4.
Fluxes, numbers of impacts and probability for one or more collisions for constellation objects during Phase 3.
Table 4.
Fluxes, numbers of impacts and probability for one or more collisions for constellation objects during Phase 3.
| Class | Flux (1/m/a) | N | (%) | | (%) |
|---|
| cm | 2.21 | 4.28 | 0.04 | 6.96 | 50.15 |
| cm | 2.20 | 4.34 | 0.01 | 7.07 | 6.83 |
| cm | 1.37 | 2.73 | <0.01 | 4.45 | 4.35 |
| m | 5.35 | 1.44 | <0.01 | 2.34 | 2.32 |
Table 5.
Probability of collision between satellites in different orbital layers and objects ≥6 cm.
Table 5.
Probability of collision between satellites in different orbital layers and objects ≥6 cm.
| Phase | Single Satellite | All Satellites |
|---|
| (%) | (%) | (%) | (%) | (%) | (%) | (%) | (%) |
| 1 | <0.01 | <0.01 | <0.01 | <0.01 | 1.89 | 1.72 | 1.06 | 0.88 |
| 2 | 0.06 | 0.07 | 0.10 | 0.12 | 63.36 | 66.25 | 50.88 | 44.49 |
| 3 | 0.01 | 0.01 | 0.01 | 0.01 | 6.83 | 6.69 | 4.21 | 3.32 |
Table 6.
Single satellite annual collision probability (ACP) and space object flux during Phase 1.
Table 6.
Single satellite annual collision probability (ACP) and space object flux during Phase 1.
| | (/m/a) | (/m/a) |
|---|
| 8.22 | 8.51 | 2.42 | 2.56 |
Table 7.
Single satellite annual collision probability (ACP) and space object flux during Phase 2.
Table 7.
Single satellite annual collision probability (ACP) and space object flux during Phase 2.
| | (/m/a) | (/m/a) |
|---|
| 1.67 | 1.72 | 4.58 | 4.74 |
Table 8.
Single satellite annual collision probability (ACP) and space object flux during Phase 3.
Table 8.
Single satellite annual collision probability (ACP) and space object flux during Phase 3.
| | (/m/a) | (/m/a) |
|---|
| 7.76 | 7.78 | 2.20 | 2.20 |
Table 9.
Average collision probability and average object flux of a single satellite in each orbital layer.
Table 9.
Average collision probability and average object flux of a single satellite in each orbital layer.
| | | | (/m/a) | (/m/a) |
|---|
| 540 km/53.2 | 1.57 | 1.58 | 5.37 | 5.41 |
| 560 km/97.6 | 2.39 | 2.39 | 8.39 | 8.40 |
| 570 km/70 | 2.15 | 2.15 | 6.91 | 6.91 |
| Publisher’s Note: MDPI stays neutral with regard to jurisdictional claims in published maps and institutional affiliations. |
© 2021 by the authors. Licensee MDPI, Basel, Switzerland. This article is an open access article distributed under the terms and conditions of the Creative Commons Attribution (CC BY) license (https://creativecommons.org/licenses/by/4.0/).


