Article

By-Plant Prediction of Dry Matter Yields at Various Growth Stages of Maize Plants (Zea mays L.) Using Leaf Greenness Indicator in Climatic Conditions of Poland

1
Department of Grassland and Natural Landscape Sciences, Poznań University of Life Sciences, Dojazd 11, 60-632 Poznań, Poland
2
Department of Grassland Farming, Institute of Technology and Life Sciences-National Research Institute, Falenty, 3 Hrabska Avenue, 05-090 Raszyn, Poland
3
Department of Agronomy, Poznań University of Life Sciences, Dojazd 11, 60-632 Poznań, Poland
4
Department of Genetics, Plant Breeding and Seed Production, Wrocław University of Environmental and Life Sciences, Grunwaldzki 24A, 53-363 Wrocław, Poland
5
Research Center for Cultivar Testing (COBORU), Słupia Wielka 34, 63-022 Słupia Wielka, Poland
6
Department of Food Technology of Plant Origin, Poznan University of Life Sciences, Wojska Polskiego 31, 60-624 Poznań, Poland
*
Author to whom correspondence should be addressed.
Appl. Sci. 2021, 11(20), 9513; https://doi.org/10.3390/app11209513
Submission received: 25 August 2021 / Revised: 24 September 2021 / Accepted: 11 October 2021 / Published: 13 October 2021

Abstract

:
Predicting yield at an early growth stage allows one to optimize the amount and timing of nitrogen fertilization to maximize crop yield. The aim of the study was to determine how different nitrogen doses would affect the nutrition of two maize varieties (Zea mays L.) with this element and their yields, and to demonstrate the potential of using the SPAD index as an early-stage predictor of dry matter yield (DMY) of maize biomass. The field experiment, with different pre- and post-sown N fertilizer doses, was conducted for two years in Poland. The two-factor experiment was set up in a randomized block design with three field replicates. There were four mineral fertilization variants: (I) 120 kg N·ha−1 without P and K fertilization, (II) 120 kg N·ha−1 + PK, (III) 160 kg N·ha−1 + PK, and (IV) 200 kg N·ha−1 + PK. The second-order factor was two stay-green maize varieties: Delitop (FAO 240) and Magitop (FAO 270). The mean values of the SPAD index of maize depended on the nitrogen dose. When the dose was increased from 120 kg·ha−1 to 200 kg·ha−1 with constant P and K fertilization, the value of the leaf greenness index increased significantly. The plants of both maize varieties fertilized with nitrogen at a dose of 120 kg N·ha−1 without P and K were characterized by the lowest values of the SPAD index, regardless of the year of the experiment. When the nitrogen dose was supplemented with P and K, the plants’ nutrition with nitrogen improved significantly. The values of the SPAD index in the maize plants of the variety Magitop were significantly greater than in the plants of the variety Delitop. The coefficients of correlation calculated for both maize varieties were highly significant at all measurement dates. Therefore, it is possible to conclude that the SPAD leaf greenness index can be used as an important, reliable, and non-invasive indicator for maize yield prediction. Nutrition of maize plants with nitrogen proved to be the main determinant of variability of the biomass yield. For this reason, it was the basis for the verification of individual mineral fertilization variants. The lack of phosphorus and potassium in the dose of mineral fertilizer limited the yield regardless of the variety, as compared to the variant that was optimally balanced with the nitrogen dose.

1. Introduction

Maize (Zea mays L.) is an important cereal crop in the world. Maize is cultivated in almost all countries, occupying an area of approximately 160 million hectares. Nitrogen fertilization is a very important factor affecting the volume of maize yield and its quality [1,2,3,4]. According to reference publications, optimal nitrogen doses applied to maize should range from 90 to 180 kg N∙ha−1 [1,5]. A lower level of nitrogen fertilization would make it impossible to use the production potential of currently grown maize varieties and would reduce the yield [6,7,8]. It is possible to increase the yield by more intensive nitrogen fertilization only up to a certain level, above which the yield may decrease [1]. Therefore, maize nitrogen fertilization should be strictly adapted to its requirements in terms of the dose and form of the fertilizer, as well as the date and method of its application [8,9]. In agricultural practice, nitrogen nutrition of plants is commonly assessed using a quick and non-destructive method [10,11,12,13,14]. It consists in measuring the intensity of greenness of leaves with optical devices such as SPAD-502, or soil and plant analysis development 502) or Hydro N-Tester [15,16]. Neither of these devices measures the chlorophyll content in leaves directly. They only measure the greenness index, which is the quotient of light absorption at 650 and 940 nm wavelengths. Light with a wavelength of 650 nm is absorbed by chlorophyll, whereas light with a wavelength of 940 nm is trapped by the leaf parenchyma. The result is the mean of 30 measurements, and it is referred to as a dimensionless SPAD unit [17].
Chlorophyll meter readings can be affected by many factors such as plant growth stage, cultivar, specific leaf weight, leaf thickness, leaf position on the plant, and measurement site on the leaf as well as environmental stresses and solar radiation [14,18,19]. For this reason, it is necessary to calibrate SPAD index readouts for individual plant species. There may be differences in the interpretation of the results even between cultivars of one species. The Hydro company followed this principle when preparing an auxiliary table of correlation of N-tester readouts for individual winter wheat cultivars. According to some researchers, there is a high correlation between N-tester readouts and the content of chlorophyll a + b in plants measured with classical methods [16]. For example, Kozłowski et al. [20] found that a linear function with a high coefficient of determination R2 = 0.95 should be used to estimate the content of chlorophyll a + b in the leaves of Lolium multiflorum varieties based on N-tester readouts. Zielewicz and Kozłowski [21] observed similar dependencies between the SPAD index readouts made in the field and chlorophyll a+b content in Sorghum saccharatum measured by the classical method. Other authors [15] observed differences in SPAD readouts for the same amount of chlorophyll measured with laboratory methods in different plant species. The right level of nitrogen in maize plants at the initial stages of their growth and during the period of their full development is decisive for their good physiological condition throughout the growing season and their final yield, as reported by other authors [1,22,23]. Predicting yield at an early growth stage allows one to optimize the amount and timing of nitrogen fertilization to maximize crop yield.
The field study hypothesis assumed that differentiated mineral fertilization could modify the dynamics of the initial growth of two types of maize, which would affect the final yield. This is a new approach to this research problem, because the stay-green type of maize is characterized by a different nitrogen remobilization factor. The field study hypothesis assumed that differentiated mineral fertilization may modify the dynamics of the initial growth of two types of maize domains (traditional, stay-green), which affects the final yield.
The aim of the study was as follows: (i) to determine how different doses of nitrogen would affect the yield of two maize varieties and (ii) to demonstrate the potential of using the SPAD index to predict the DMY of maize biomass grown for silage.

2. Material and Methods

2.1. Experimental Field

A field experiment was conducted during 2 years at the Brody Experimental Farm belonging to the Poznań University of Life Sciences, Poland (52°43′ N, 16°30′ E). The two-factor experiment was set up in a randomized block design with three field replicates. There were four mineral fertilization variants: (I) 120 kg N·ha−1 without P and K fertilization, (II) 120 kg N·ha−1 + PK, (III) 160 kg N·ha−1 + PK, and (IV) 200 kg N·ha−1 + PK. The second-order factor was two stay-green maize varieties: Delitop (FAO 240) and Magitop (FAO 270). The area of the plots was 14.0 m2 (2 rows × 0.7 m × 10.0 m). Both maize varieties were sown with a Monosem pneumatic seed drill at an amount of 120,000 seeds per ha after 27 April. The crops were protected from weeds with Primextra Gold 720 SC herbicide, which was applied at a dose of 2.5 l·ha−1 immediately after sowing. They were fertilized with 34% N ammonium nitrate twice. The first dose of 80 kg N·ha−1 was applied in all the variants before sowing the seeds. The second dose was applied during the growing season at the phase of development of the sixth leaf on the maize plants (BBCH 16)—40 kg N·ha−1 in the first and second variants, 80 kg N·ha−1 in the third variant, and 120 kg N·ha−1 in the fourth variant. Before maize was sown, phosphorus and potassium fertilizers were applied to the soil at doses of 60 kg·ha−1 P2O5 and 120 kg·ha−1 K2O in all the variants except the first one (120 kg N·ha−1 without P and K).

2.2. Observations and Measurements

In both years, the plants’ nutrition with nitrogen (the SPAD index) was measured during the growing season. In the first year, the measurements were made on 26 June (the first term), 24 July (the second term), and 12 August (the third term). In the second year, the measurements were made on 30 June, 22 July, and 14 August. The maize plants were at the following stages of development: the first term—BBCH 55 (Delitop variety) and BBCH 51 (Magitop variety), the second term—BBCH 71 (Delitop variety) and BBCH 69 (Magitop variety), and the third term—BBCH 83 (Delitop variety) and BBCH 79 (Magitop variety). A Hydro N-tester (scale 0–800) was used for measurements on well-developed leaf lamina. This device function is based on the measurement of light absorption of the leaf at two different wavelengths, i.e., 650 and 940 mm. The quotient of these differences serves as an indicator of chlorophyll content and is called SPAD—soil and plant analysis development—units. A high coefficient of determination (R2) was demonstrated, depending on the species, between the readings of the apparatus and the amount of extracted chlorophyll. The measurements were repeated twice in each plot. The biomass samples for evaluation of dry matter yields (DMY) were collected at BBCH 85–87, on 25 September in the first year and on 29 September in the second year. Sample plants (10 pcs.) were taken from two central rows of each experimental plot. After drying, the dry matter content as well as dry weight of an individual plant were defined. The dry matter content in maize plants was determined by the drying method. The plants were dried at 105 °C for 36 h. The dry matter content per unit area was determined based on the dry weight of individual plants and the number of plants per unit area.

2.3. Statistical Analysis

The results of SPAD readings and DMYd were assessed by analysis of variance using two-way ANOVA. N and PK rates and varieties were fixed factors. The significance of the effect of the experimental factors was verified with Tukey’s test at a significance level of α = 0.05. A simple linear regression equation describing the relationship between SPAD values measured in successive terms and dry matter maize biomass yield were calculated. The correlations between DMY of maize biomass and SPAD index values at successive measurement dates for both varieties were evaluated using the Pearson correlation coefficient. Data were subjected to analysis by the Statistica v. 6.0, FR-ANALWAR-5.2 FR and MS Excel software. Boxplots were drawn using Statistica program v.6.0. (Statsoft, Polska).

2.4. Weather and Soil Conditions

The local climate is classified as temperate. It is characterized by mutual influence of maritime and continental climates. It has a seasonal, transitional, and changeable nature, especially in summer. Table 1 shows the weather conditions in both growing seasons. In the first year of the experiment, the average temperatures in May, June, July, and October were higher than in the second year, whereas the average temperatures in April, August, September, and November were lower. The average temperature in March in the first and second year of the experiment was similar. In the first year of the experiment between March and November, the total rainfall was 8.2 mm/m2 lower than in the second year. However, in both years the total rainfall in the period under analysis was higher than in the multiannual period. The distribution of rainfall in the first year was less favorable because there was low rainfall during the key periods of initial development of maize. In April, the total rainfall was only 8.7 mm/m2, in May it was 19.5 mm/m2, and in June it was 8.6 mm/m2. By comparison, in the second year, the rainfall in April was 13.3 mm/m2, in May it was 85.3 mm/m2, and in June it was 79.3 mm/m2 (Table 1).
The field experiment was conducted on loamy sand soil underlain by sandy loam and classified as Albic Luvisol [24]. Before starting field research, the soil contained 1.28% humus, 115.0 mg P2O5, 147.0 mg K2O (double lactate method), and 78.0 mg MgO per kg DM soil (Schachtschabel method). The silt and clay fraction amounted to 16%. The pH was slightly acidic (pHKCl = 6.2, pHH2O = 6.5).

3. Results and Discussion
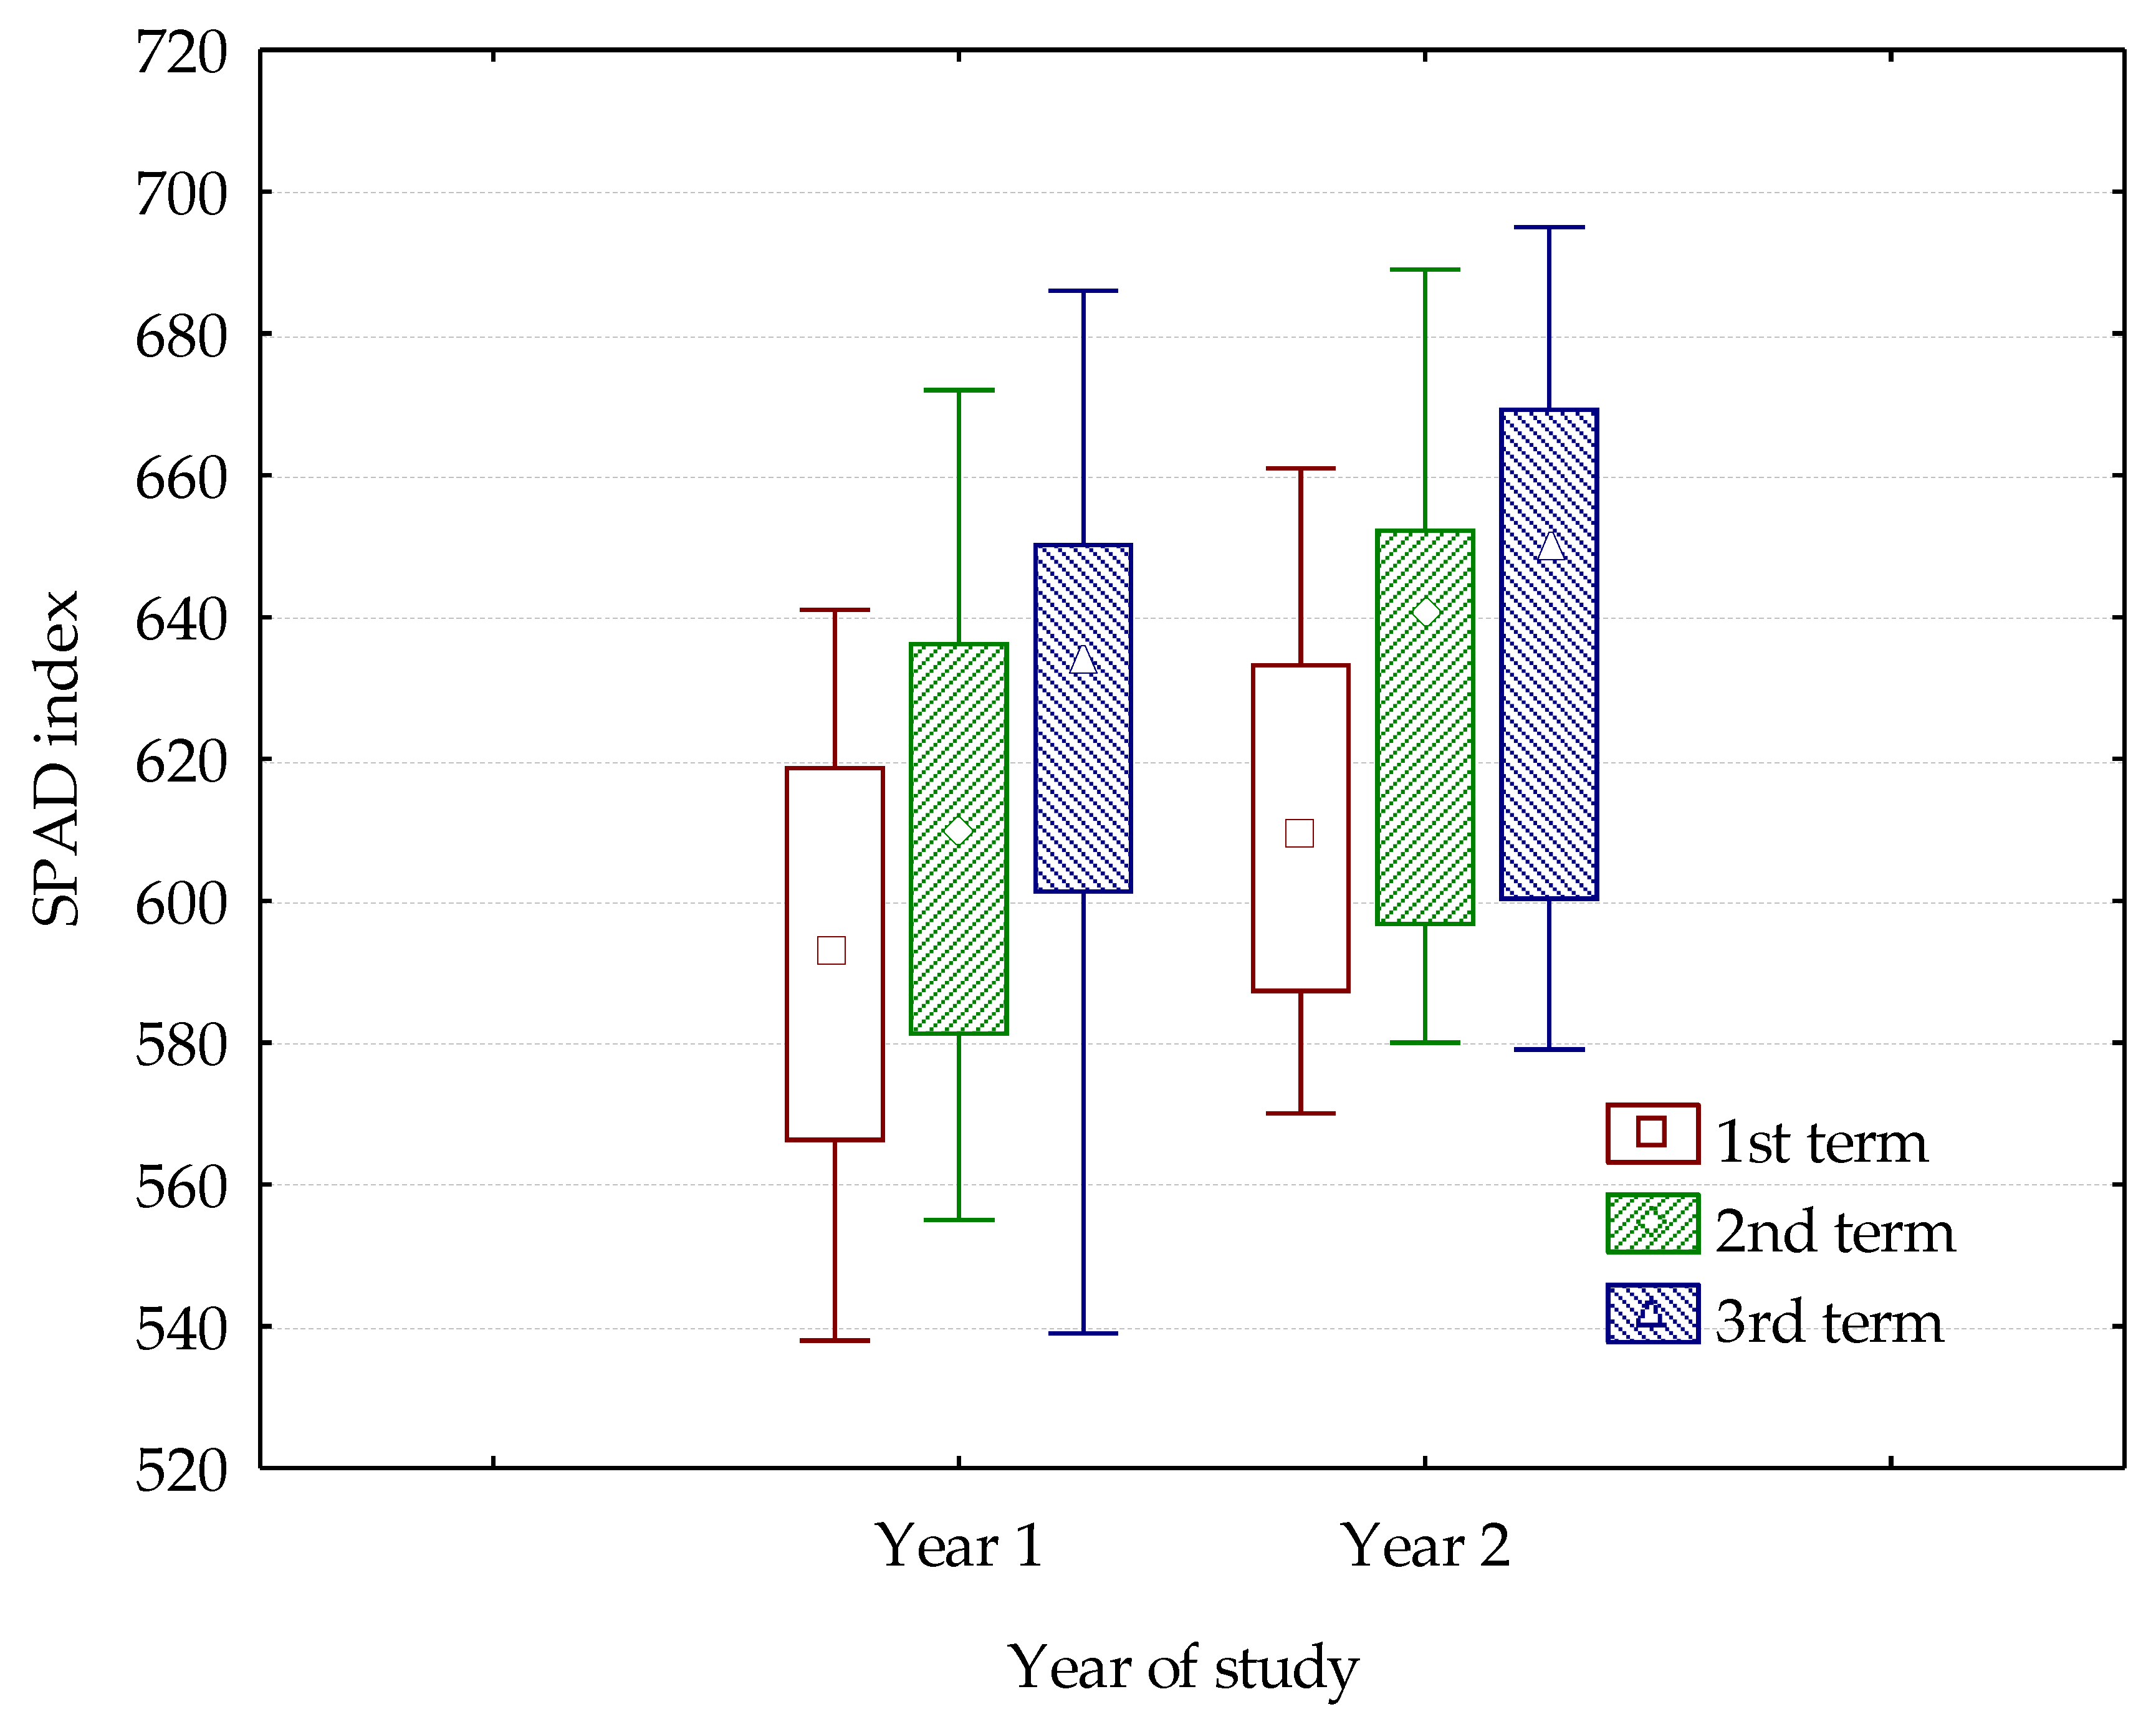
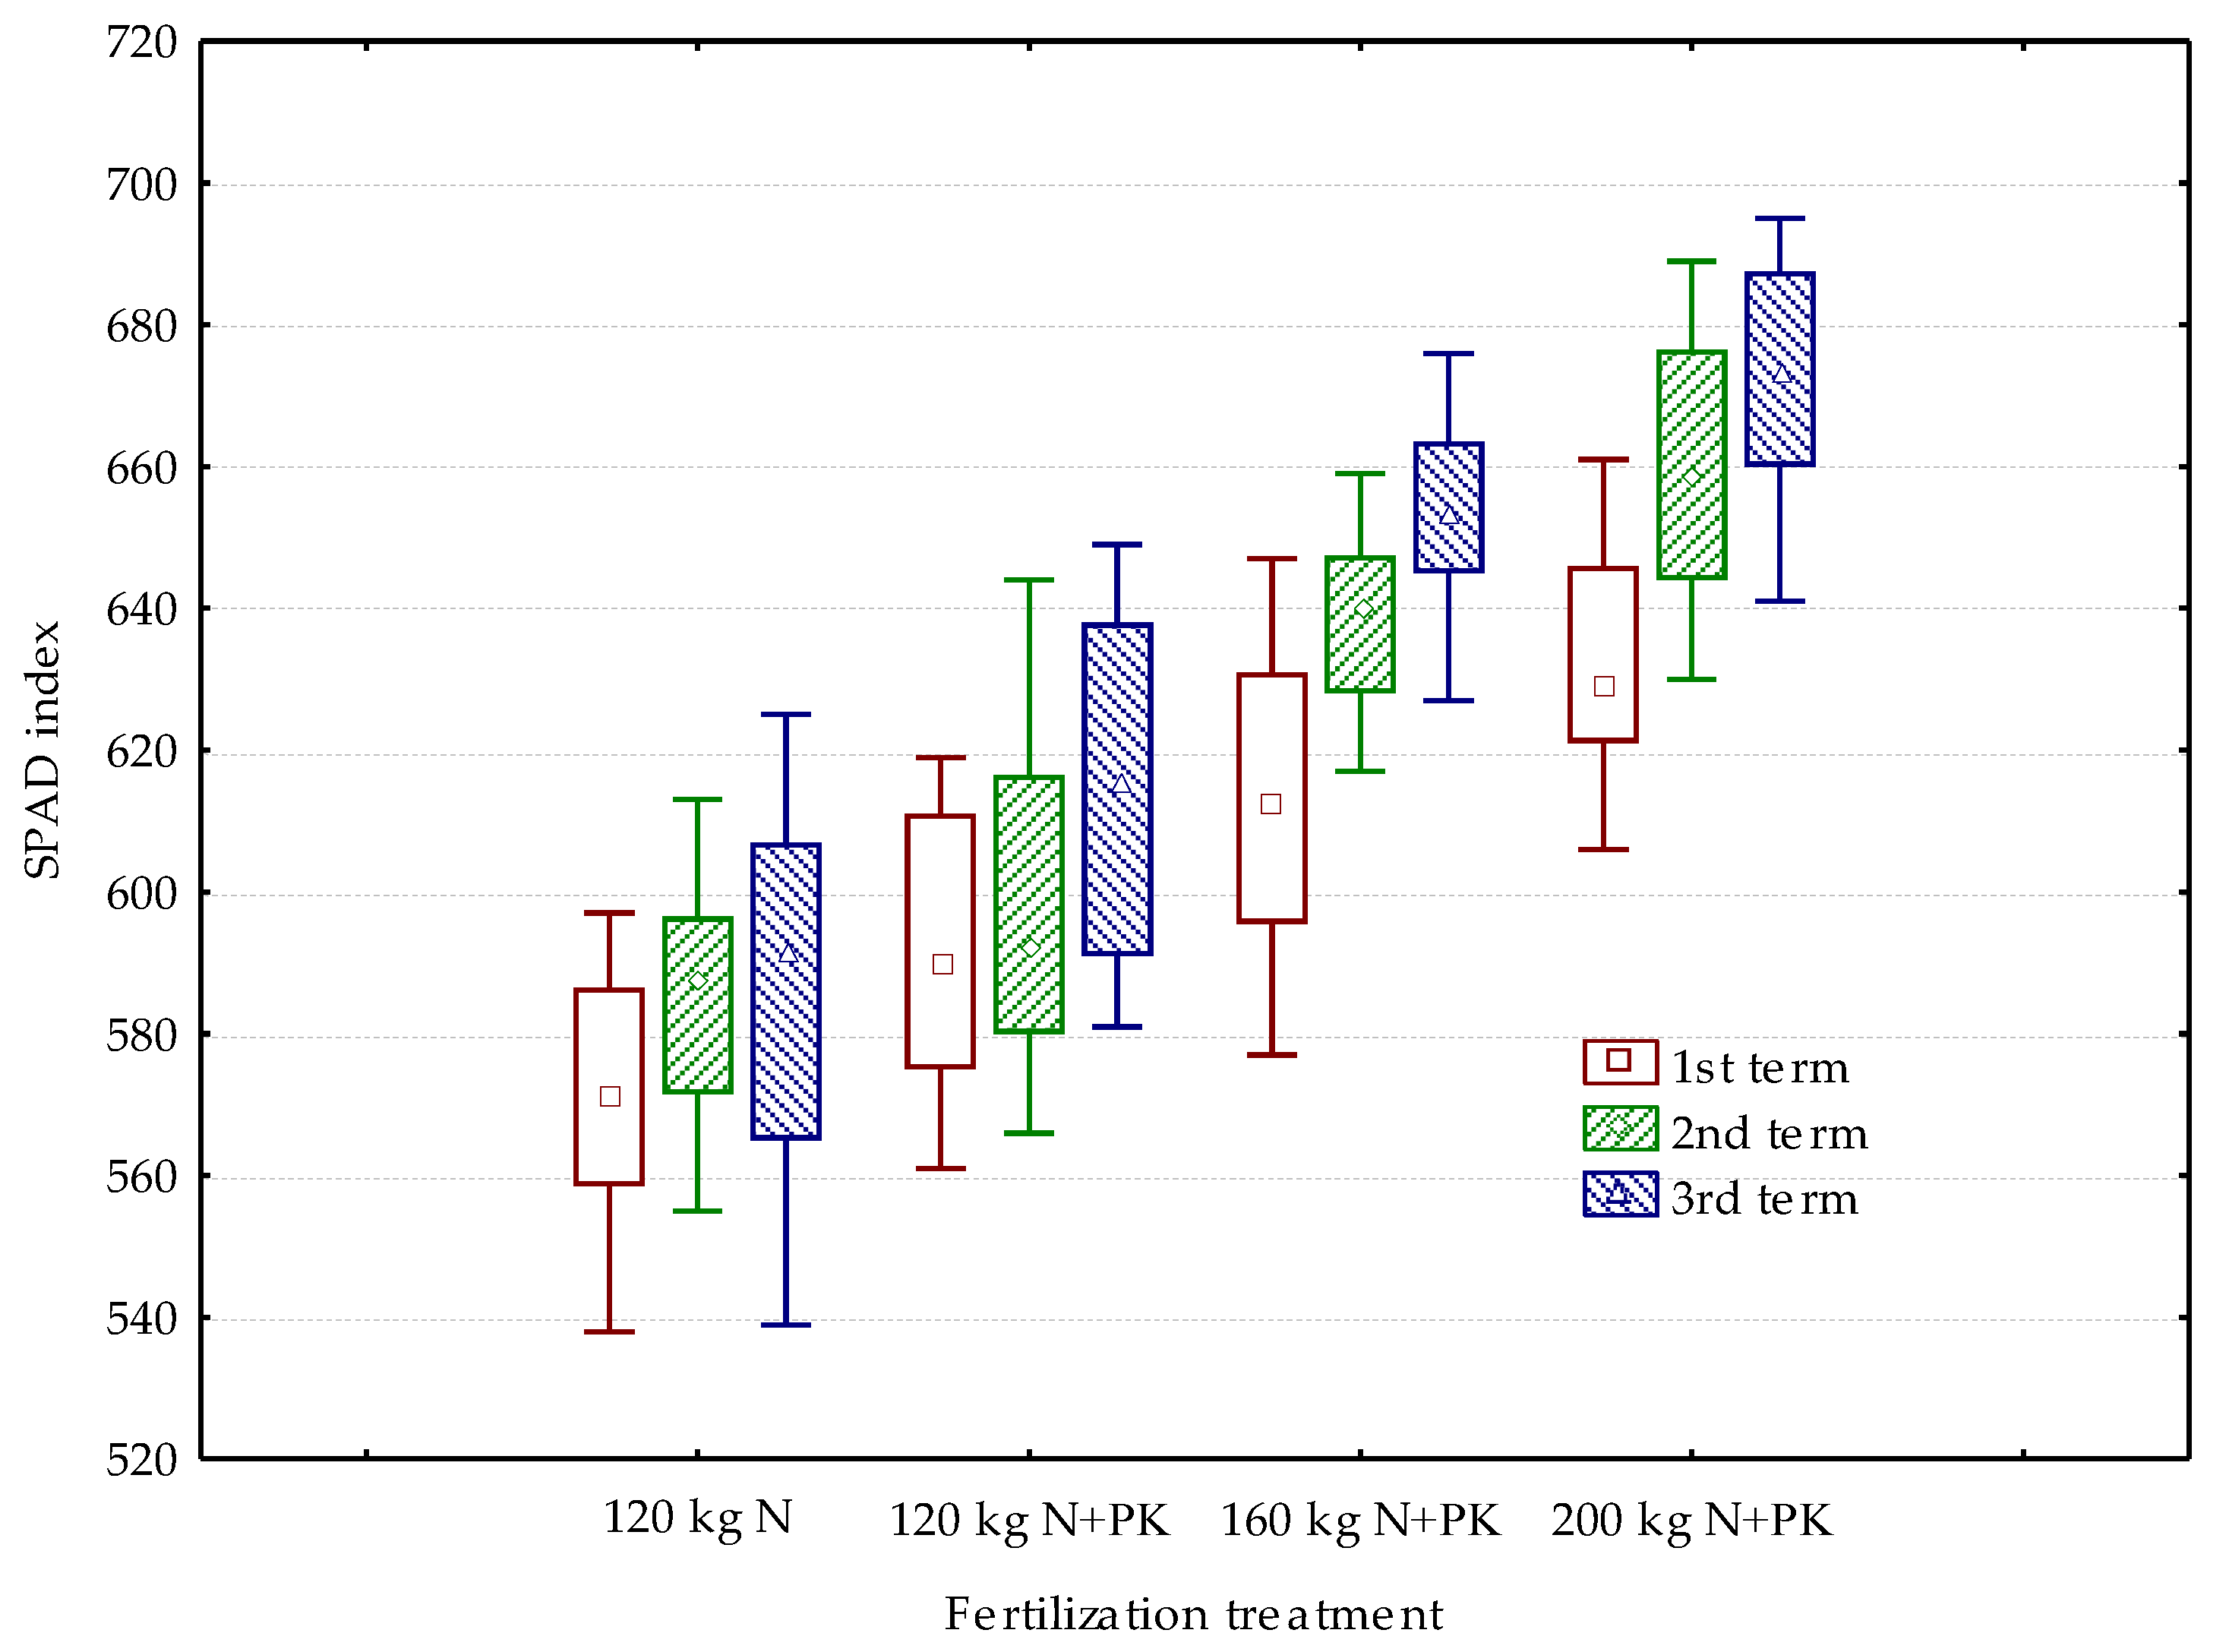
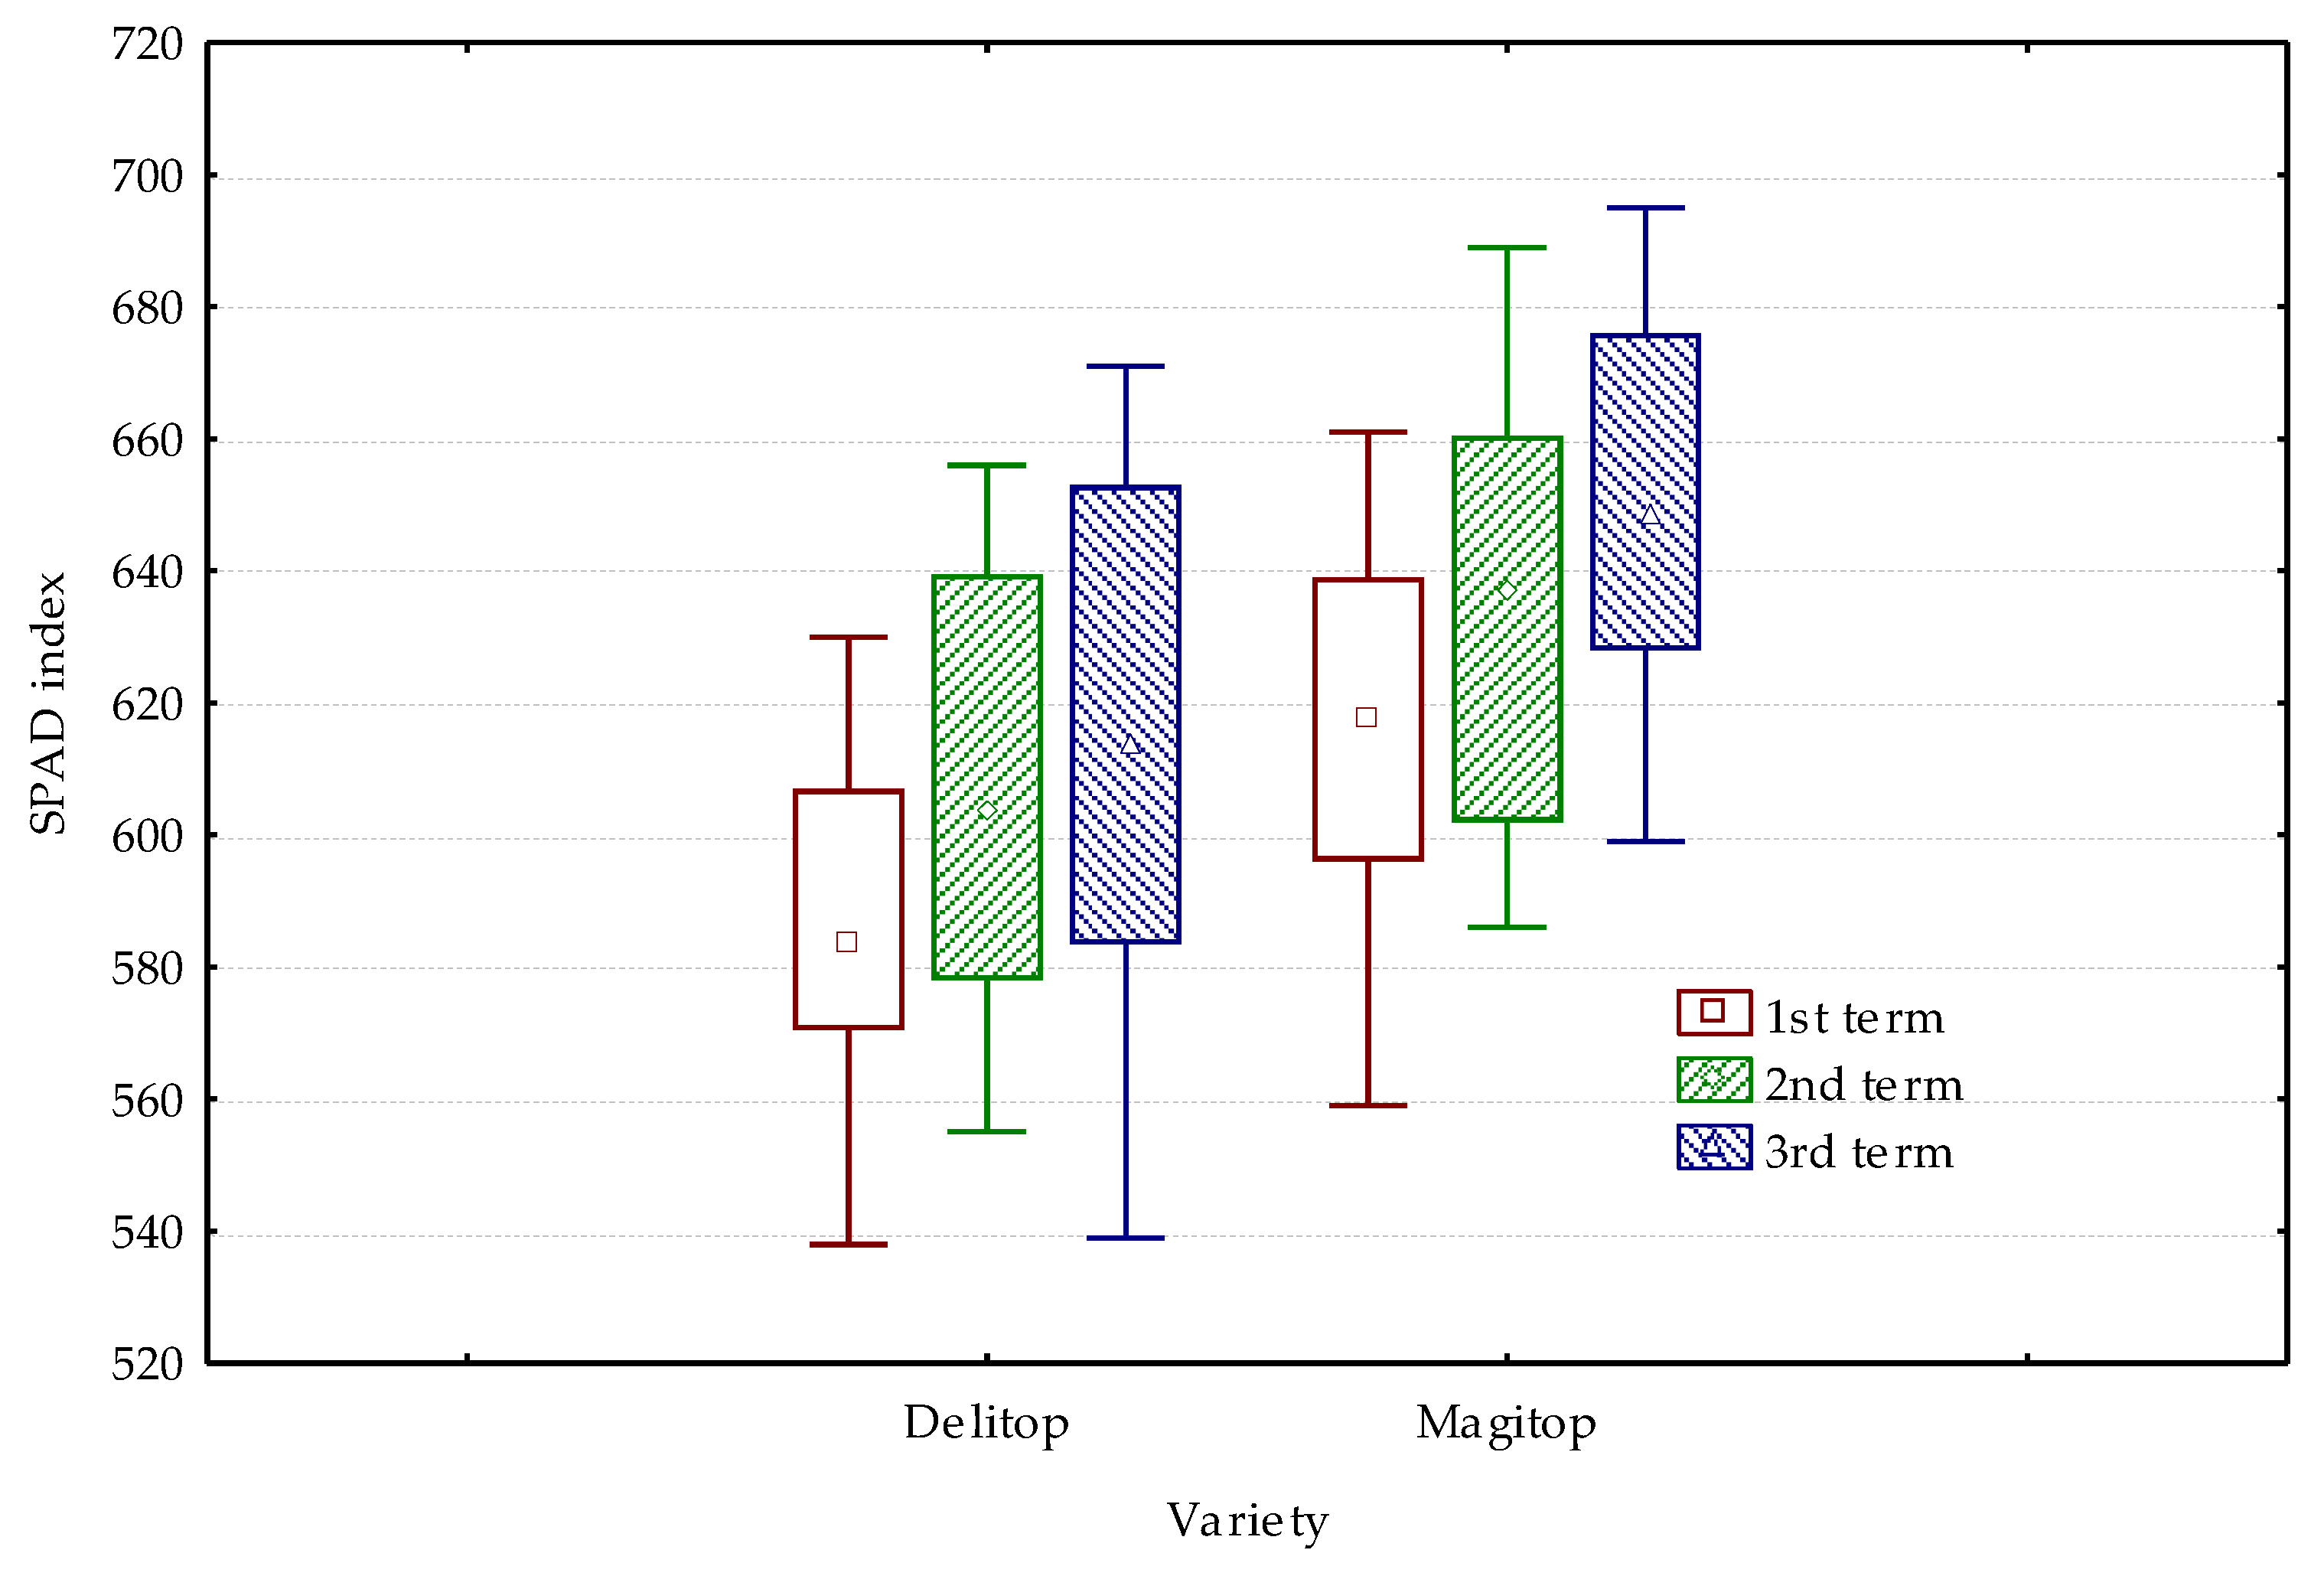
3.1. SPAD Index

The measured values of SPAD readouts ranged from 538 to 695. They were similar to the ranges of values listed in reference publications for maize grown in Poland [25]. Sulewska et al. [26] conducted a study on maize at BBCH 83–85 and reported higher values ranging from 719 to 846 (in control variants) to 742.6 to 859.4 (in fertilized variants). Piechota et al. [27] observed lower values of SPAD readouts, which depended on the phase of maize development during the measurements. In our study, differences in SPAD readings were also observed between consecutive measurement dates. In the first time point, they ranged from 538 to 661. On the consecutive measurement dates, the SPAD index values increased, in the second time point, they ranged from 555 to 689, whereas they were the highest in the third time point and ranged from 539 to 695 (Figure 1).
The growth dynamics of the leaf greenness index from the day of plant emergence was illustrated by equations for the average values from both study years and all mineral fertilization variants. The dynamics of changes in the SPAD index of the variety Delitop were described (R2 = 0.94) with a simple linear regression equation, y = 1.115x + 533.74. Changes in the variety Magitop (R2 = 0.99) were described with the following equation: y = 1.37x + 548.14, where: y is the SPAD index value, and x is the number of days since the sowing of maize seeds. Costa et al. [28] conducted their research in eastern Canada and made similar observations. Machul and Borowiecki [29] found that as the time passed and the plants developed, the SPAD index in maize leaves tended to increase regardless of the nitrogen fertilization level. The latter authors observed the highest SPAD index values 84–89 days after plant emergence, i.e., at the beginning of the panicle ejection phase. The date of measurement had a greater influence on the SPAD index than nitrogen fertilization, plantation location, and maize variety. Machul and Jadczyszyn [30] made similar observations in their study.
They found that the date of measurement had the greatest influence on the total variability of SPAD index readouts and determined them from 57% to over 90%, depending on the year of the study. In addition, Natywa et al. [25] noted the highest SPAD index at BBCH 67 (full flowering), regardless of the nitrogen fertilization level. They recorded significantly lower values at BBCH 75, i.e., the phase of full milk maturity. Similarly, Rostami et al. [31] observed that the SPAD index value increased systematically until the beginning of cob formation (phase R1), but then it decreased. The maximum chlorophyll level in the leaves is referred to as ‘photosynthetic maturity’ in reference publications.
In our study, the mean values of the leaf greenness index (SPAD) differed significantly depending on the level of mineral nitrogen fertilization. On average, regardless of the variety and year of the experiment, the lowest SPAD index values were noted in the plants fertilized with nitrogen at a dose of 120 kg N·ha−1 without P and K (Table 2 and Table 3 and Figure 2). On average, they amounted to 571 in the first date, 585 in the second date, and 586 in the third date. When nitrogen fertilization was supplemented with P and K, the SPAD index value increased significantly in all the measurement time points—by 20, 13, and 29 units, respectively. This means that the supplementation of fertilization with phosphorus and potassium, which are key minerals, resulted in better uptake and use of nitrogen by plants [32,33].
When the dose of nitrogen fertilization was increased from 120 kg·ha−1 to 200 kg·ha−1, and the dose of P and K remained constant, there was a further significant increase in the leaf greenness index value. The fertilization with nitrogen at a dose of 160 kg·ha−1 resulted in the average SPAD index of 612, 639, and 653 on the subsequent measurement dates. When the highest dose of nitrogen, i.e., 200 kg·ha−1, was applied to maize plants, it resulted in their most optimal nutrition with this component. The average values of the greenness index readouts in both varieties and years of the study: 632 (1st date), 660 (2nd date), and 672 (3rd date) (Figure 2) were the highest in this treatment.
The results of our experiment were in line with the results of other authors [30,31,34,35,36] who fertilized maize with different nitrogen doses. These authors unequivocally stated that the amount of nitrogen fertilization was the most significant determinant of chlorophyll content in leaves expressed in SPAD units. Szulc [36] reported the lowest SPAD index values (305.5) in maize not fertilized with nitrogen, whereas the plants fertilized with nitrogen at a dose of 120 kg ha−1 had the highest chlorophyll content, as evidenced by the SPAD index readouts (344.6). The author did not find statistically significant differences in the SPAD index values between nitrogen doses of 60 and 120 kg N·ha−1. The results of the research by Natywa et al. [25] showed that the highest SPAD index value measured at the phase of full flowering and milk maturity was observed when maize plants were fertilized with nitrogen at a dose of 240 kg·ha−1. However, it was important that very high doses of nitrogen did not progressively increase chlorophyll content in leaves, as observed by other authors [37,38]. The content of chlorophyll expressed in the SPAD index value can be a good indicator of nitrogen nutrition of plants, but only when doses of this nutrient applied with fertilizer do not exceed 190 kg N·ha−1. Above this limit, the SPAD leaf greenness index is less useful for the evaluation of plant nutrition with nitrogen, because nitrogen is not completely converted to chlorophyll at large amounts [39]. The content of chlorophyll pigments in plants is not only a species-specific feature, but also variety-specific feature, as observed by Kozłowski et al. [20]. In our study, the analysis of variance showed that the plants of the variety Magitop were characterized by significantly higher SPAD index values regardless of the fertilization level and year of the experiment. These values at subsequent measurement dates amounted to 616, 634, and 649, respectively, whereas the SPAD index values of the variety Delitop were significantly lower and amounted to 587, 607, and 614, respectively (Figure 3).
These results clearly indicate that nitrogen nutrition of these plants was significantly worse. This reaction may have been caused by the slower dynamics of this nutrient uptake. Nutrition of plants with nitrogen also influenced the morphological properties and yield of both varieties (Figure 4, Figure 5 and Figure 6). The variety Magitop (FAO 270) was characterized by a higher yield, and its cobs were heavier than those of the typical grain variety Delitop (FAO 240) (Table 4). Chlorophyll content in the leaves and the SPAD value were significantly influenced not only by the soil abundance in minerals, but also by total rainfall, thermal conditions, and light intensity [29]. The results of our study confirmed this observation.
The SPAD leaf greenness index values of both maize varieties were significantly lower in the first than in the second year, regardless of the dose of nitrogen fertilizer. On average, these differences in both varieties were the largest in the second time point (21 SPAD units), smaller in the first time point (19 SPAD units), and the smallest in the third time point (14 SPAD units). They may have been caused by different weather conditions during the growing season in both years of the experiment. The distribution of rainfall was better in the second year (Table 1), and it influenced the availability and uptake of nutrients from the soil by maize plants. In consequence, the nutrition of the plants with nitrogen was better. Natywa et al. [25] attempted to eliminate the influence of water stress on the nutrition of maize plants by irrigating them with sprinklers. It significantly increased the SPAD index values regardless of the nitrogen fertilization level.

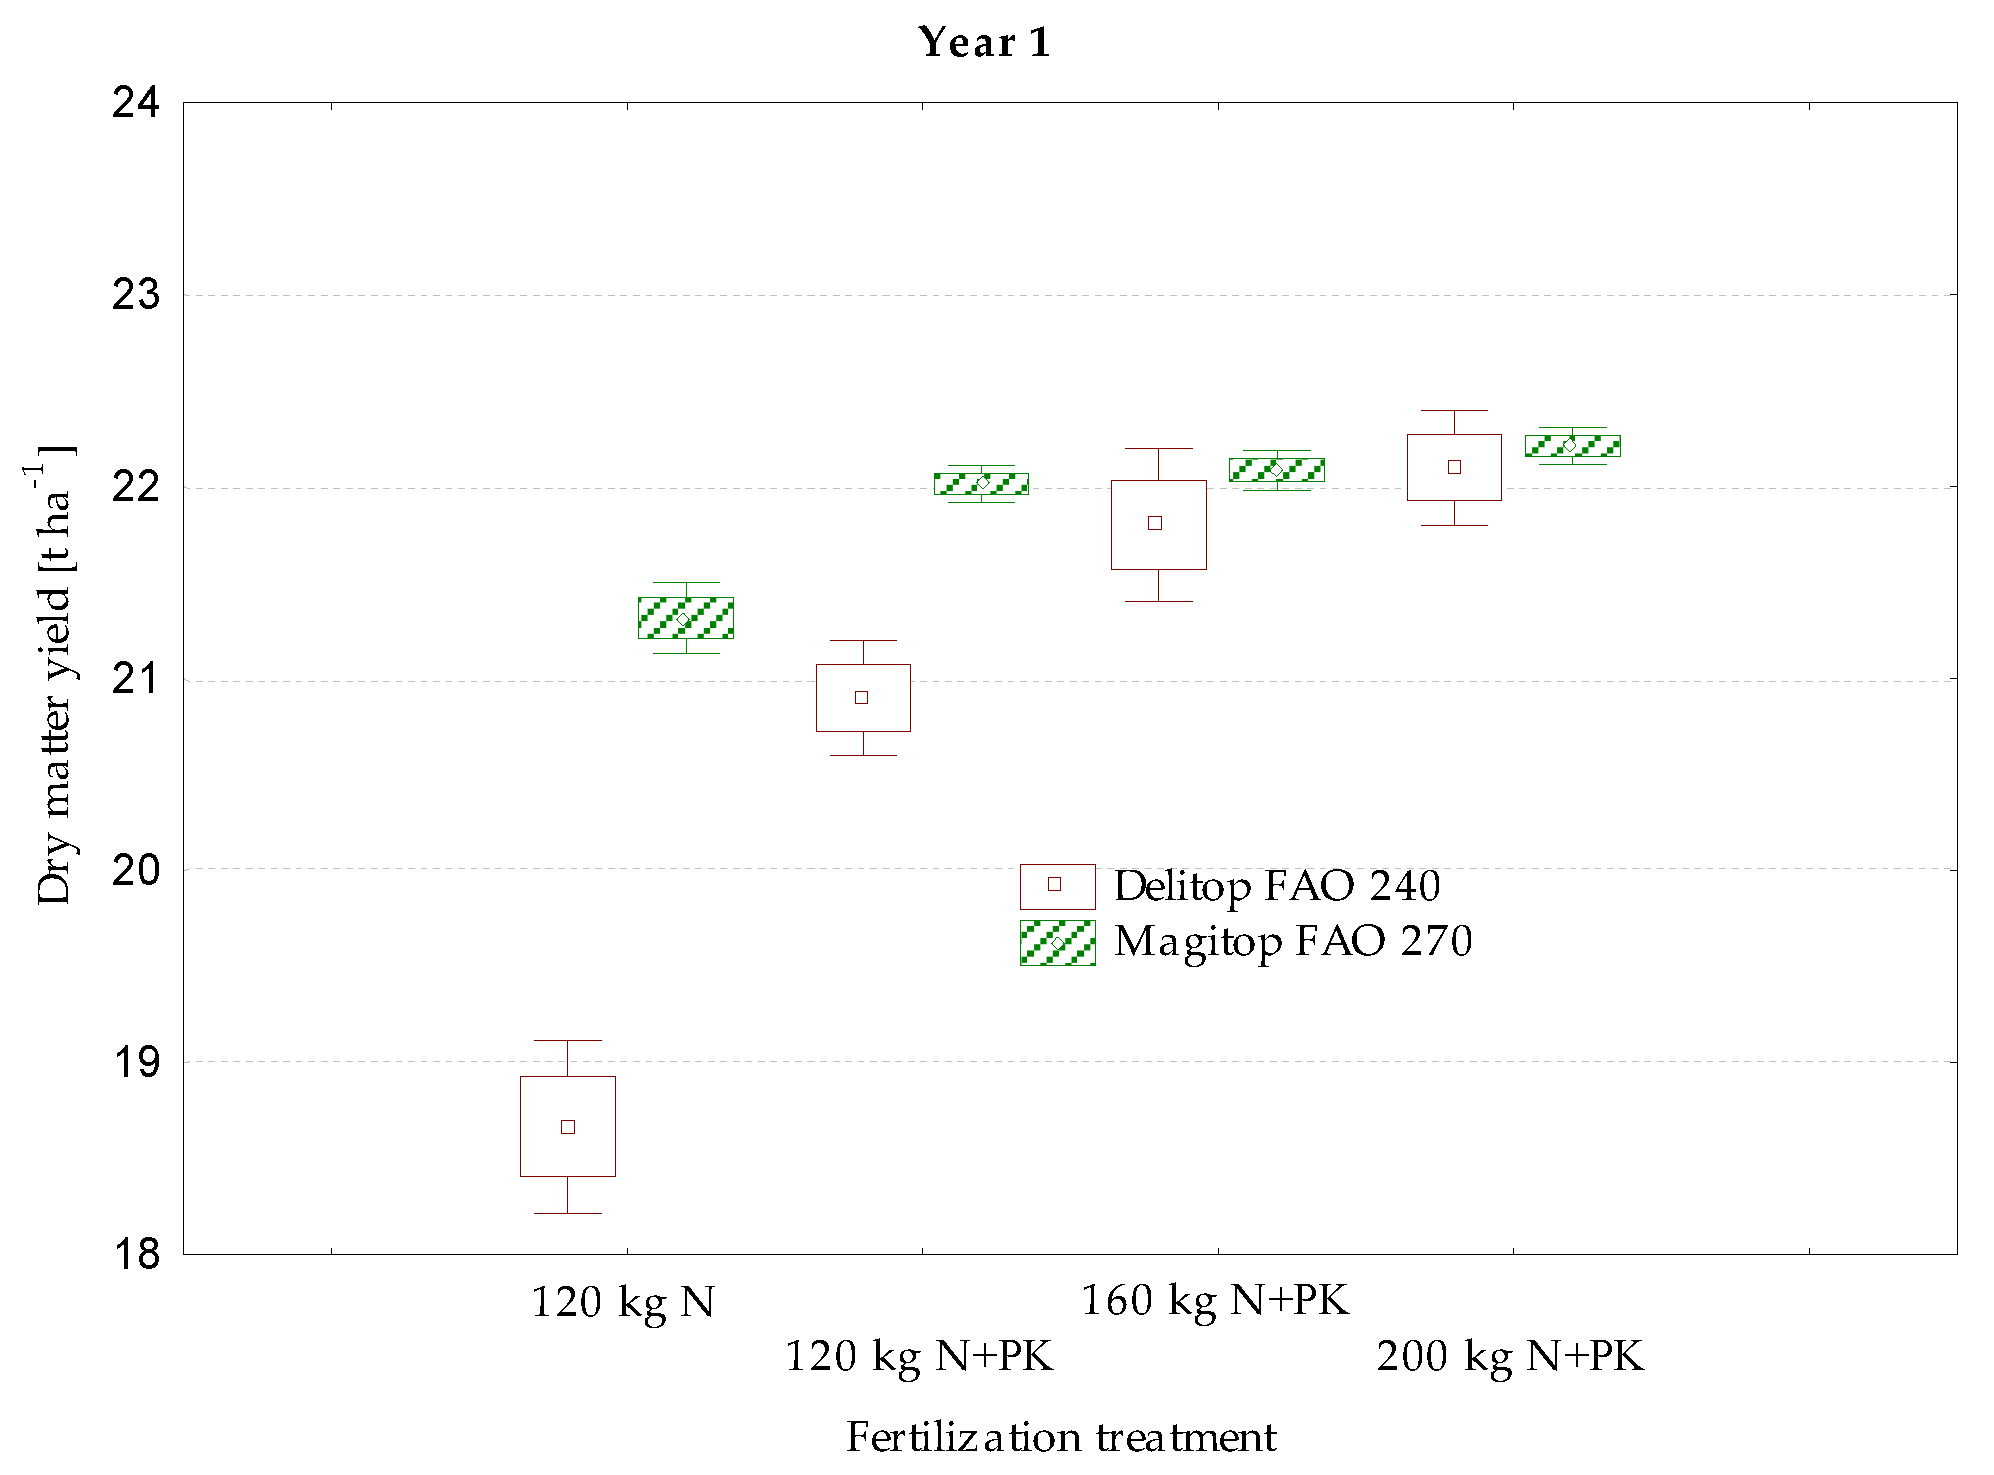
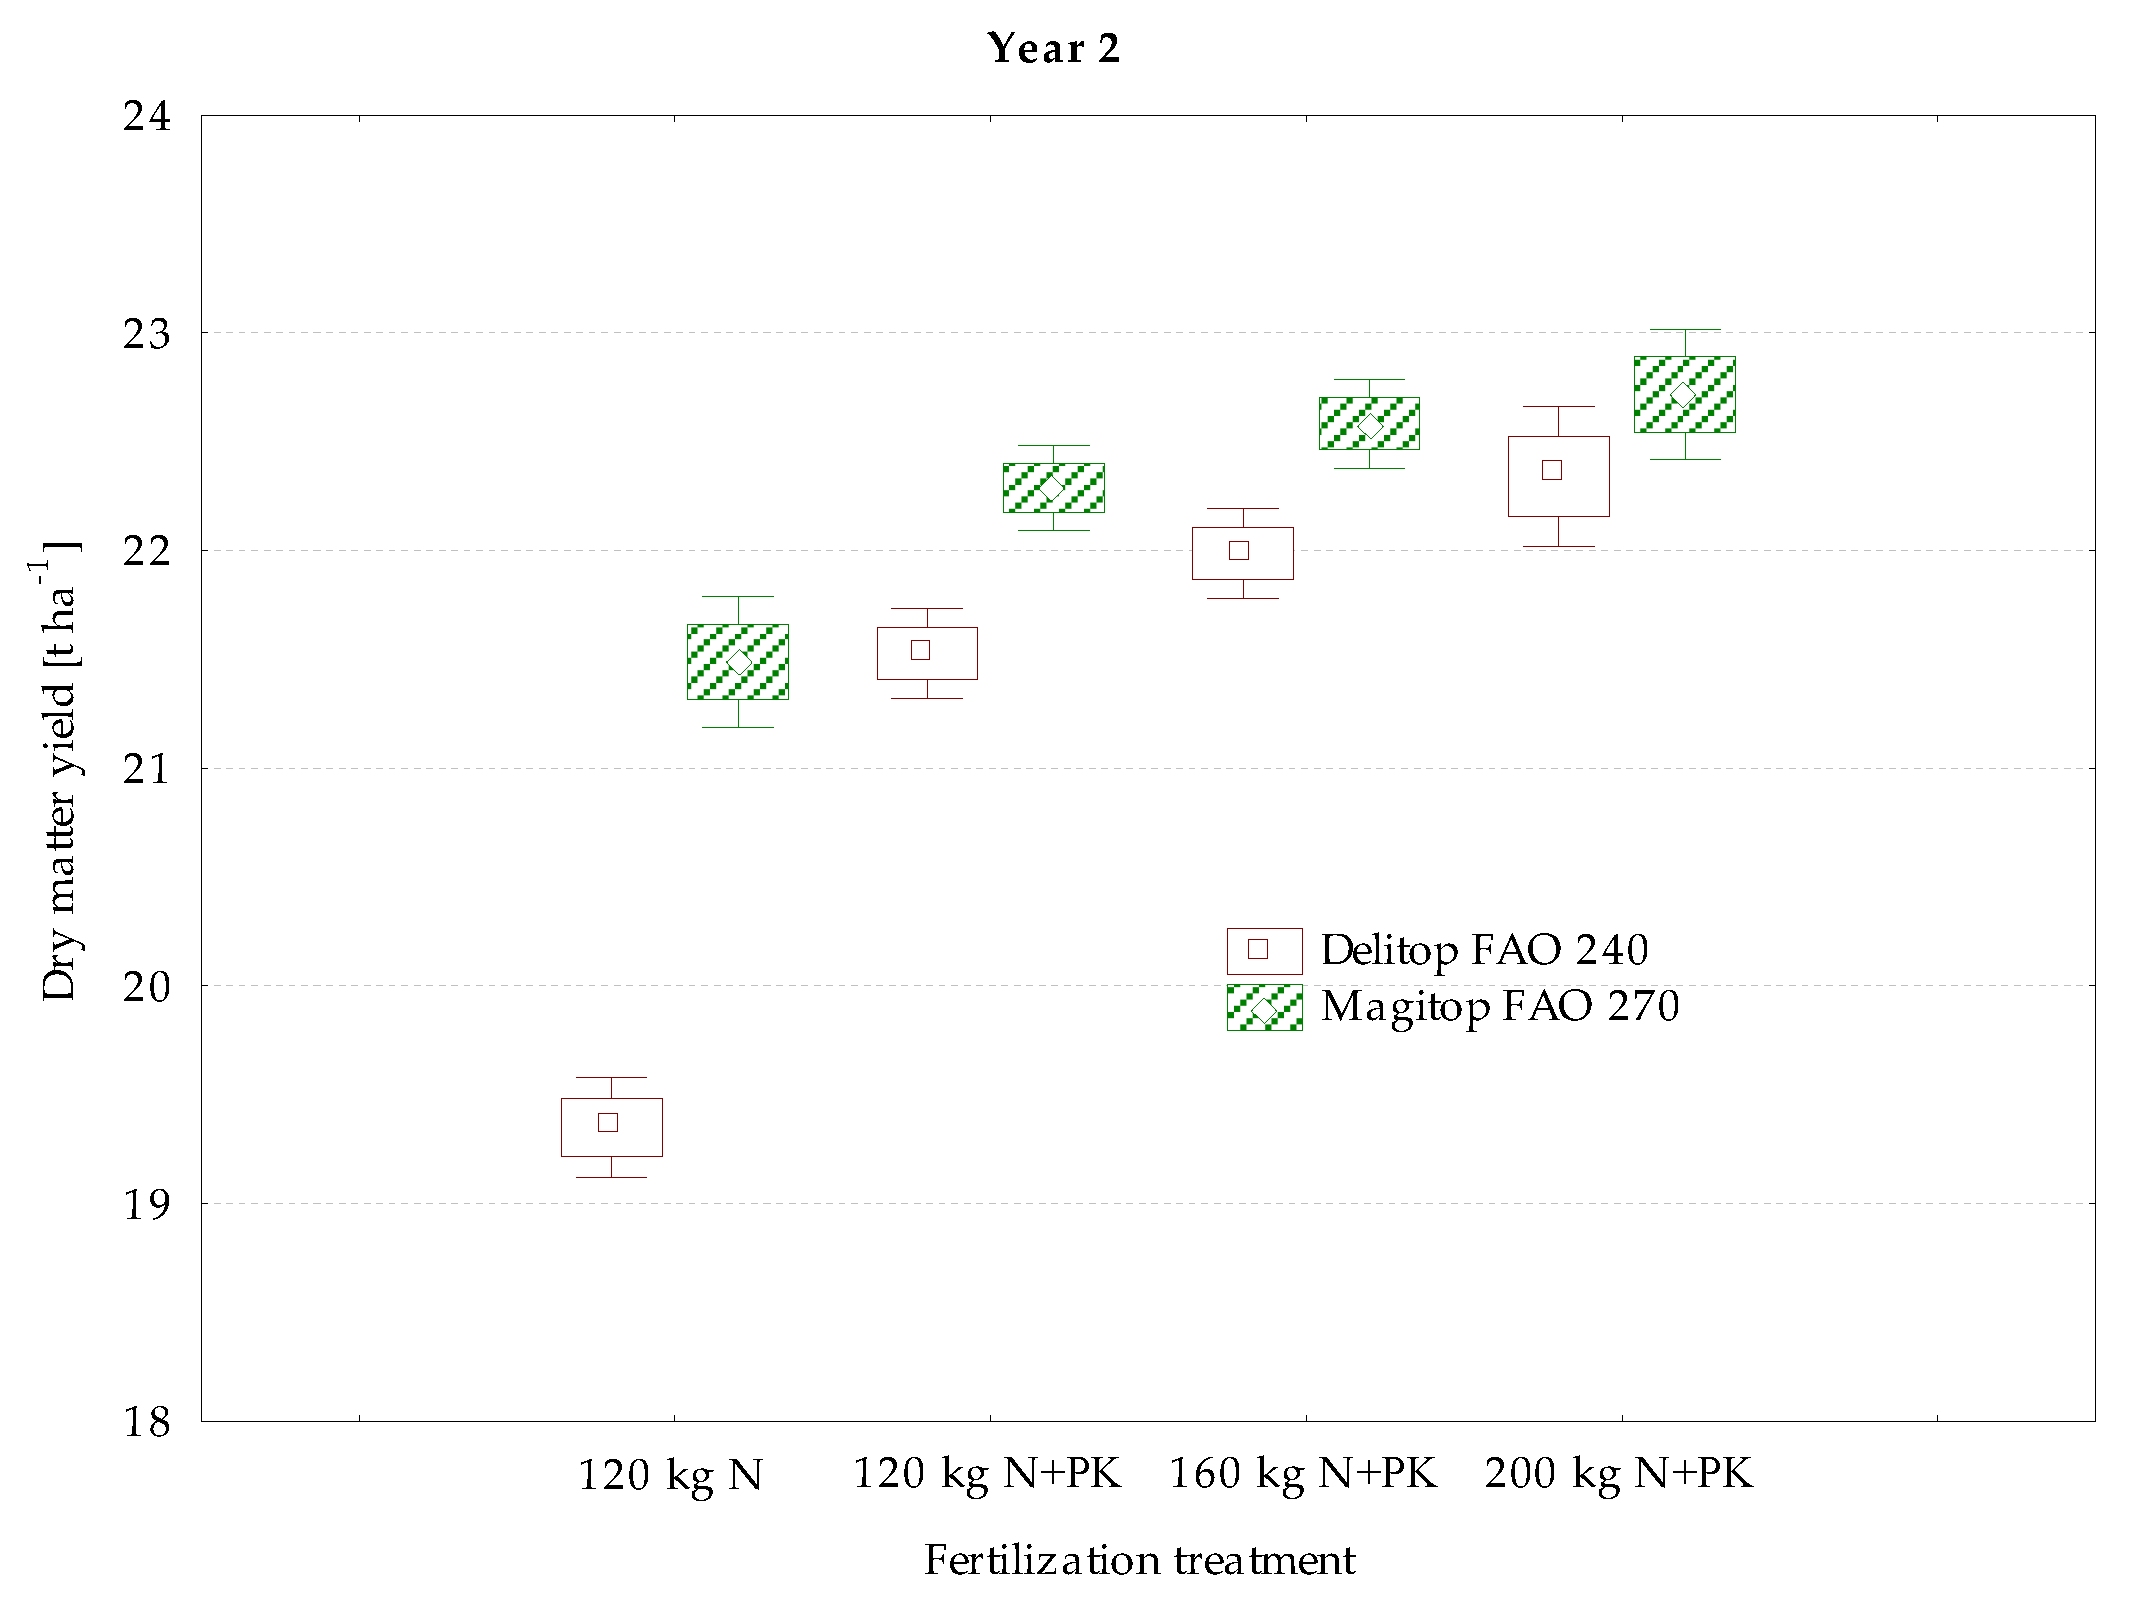
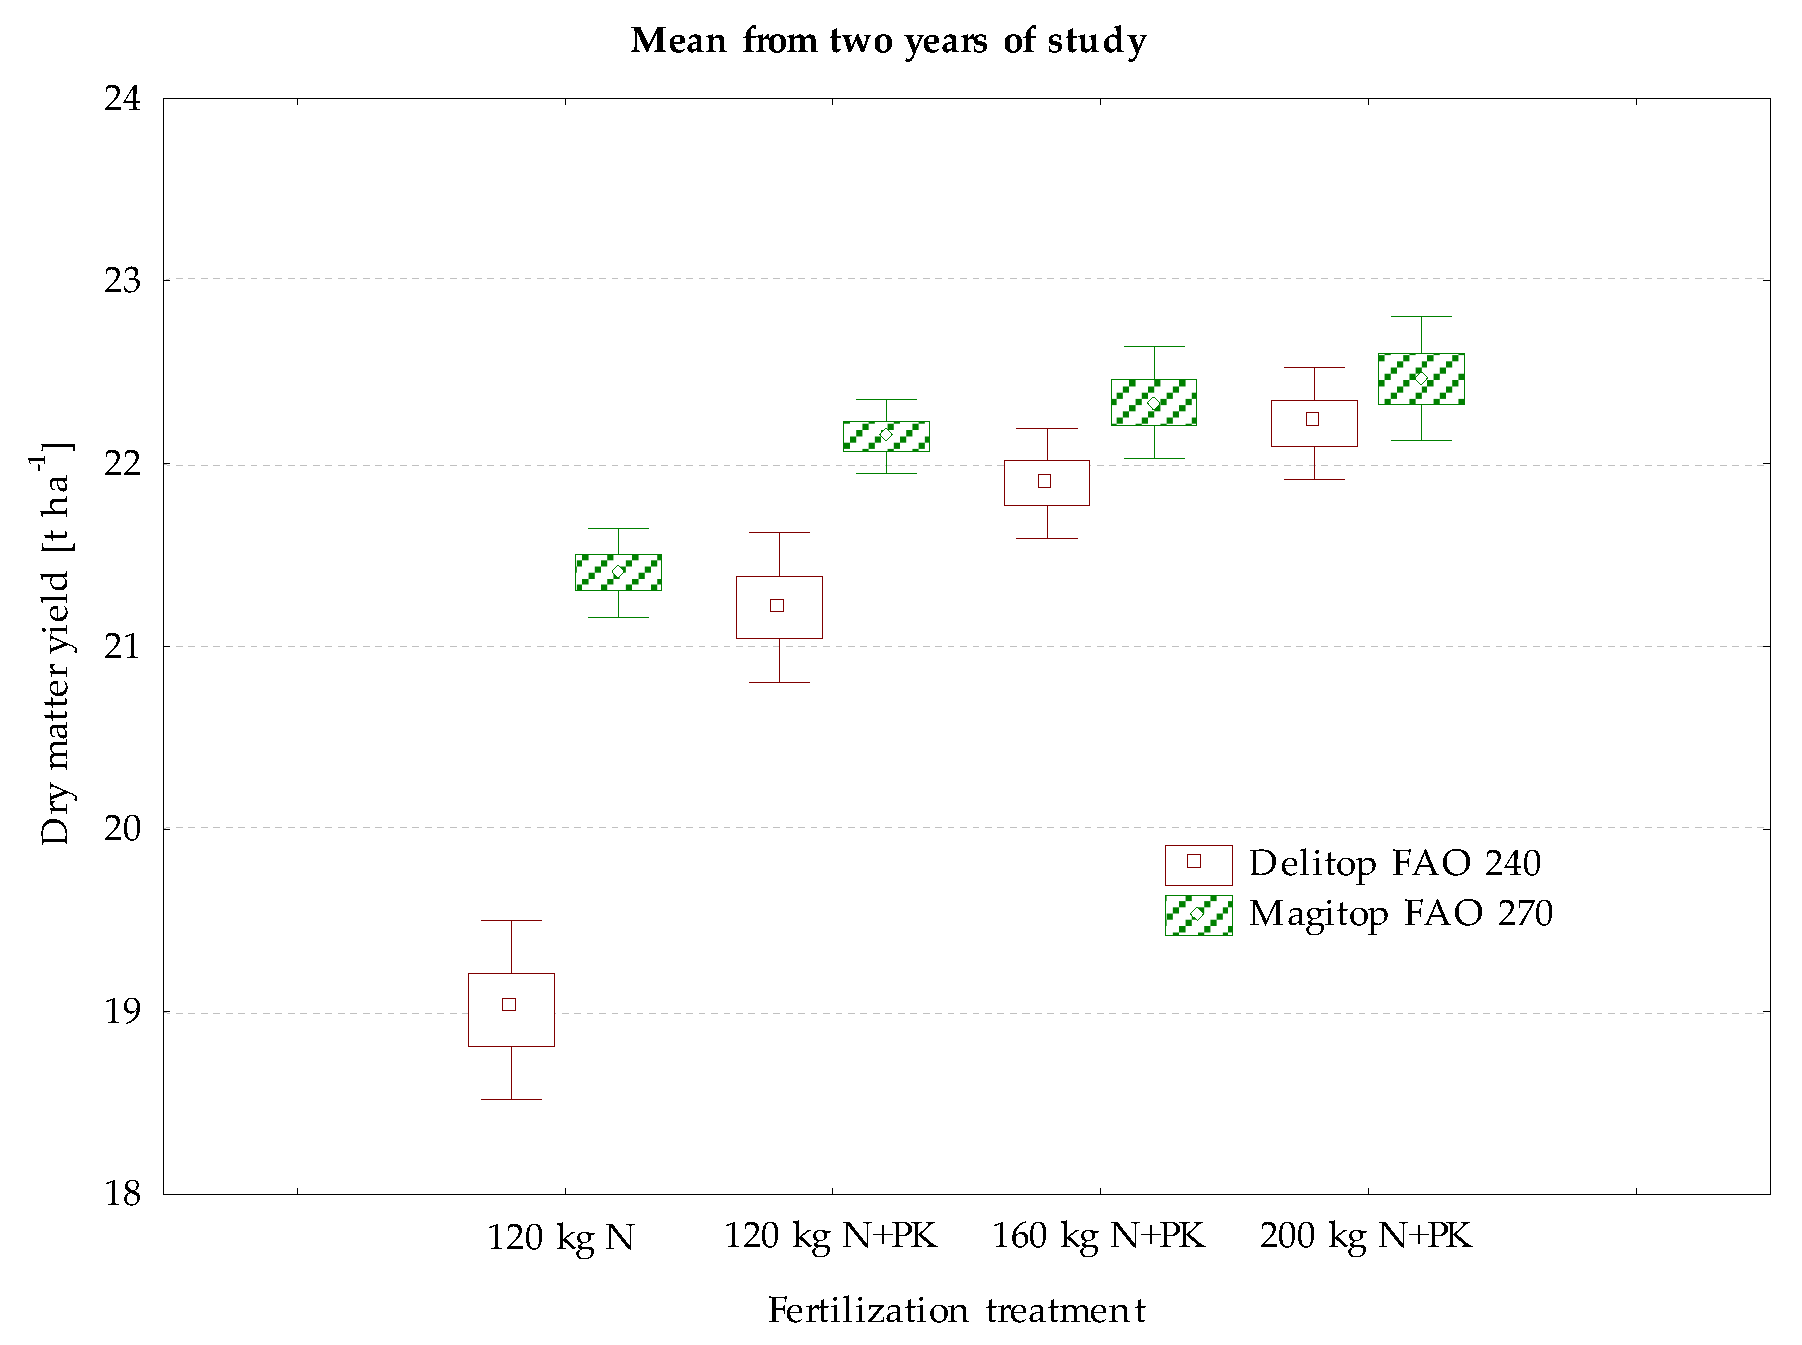
3.2. Dry Matter Yield (DMY)

The DMY depended on the maize variety. The average DMY of the variety Magitop (FAO 270) was higher than that of the variety Delitop (FAO 240) regardless of the fertilizer dose. Both varieties differed in their reaction to fertilization. In terms of the average DMY of the variety Delitop, the highest-yielding variant fertilized with a dose of 200 kg N·ha−1 + PK differed by 4.7% from the variant fertilized with a dose of 120 kg N·ha−1 + PK and by 1.6% from the variant fertilized with a dose of 160 kg N·ha−1 + PK, i.e., by 1.0 t·ha−1 and 0.35 t·ha−1, respectively. There were smaller differences between the nitrogen fertilization variants applied to the variety Magitop, where the DMY increased by 1.4% (0.31 t·ha−1) and 0.6% (0.13 t·ha−1), respectively (Table 4). Księżak et al. [7] increased the dose of nitrogen fertilization from 120 to 160 kg·ha−1 and observed a significant increase in DMY. Moreover, increasing nitrogen doses applied by Podleśna et al. [40] were effective to the level of 160 kg per ha and resulted in a DMY increase. Higher doses of nitrogen were ineffective in terms of yield. The level of nitrogen fertilization in the study by Sowiński and Liszka-Podkowa [41] did not significantly influence the yield of fresh or dry matter of maize. The latter authors only observed that maize yield tended to increase when higher doses of nitrogen were applied.
A comparison of the DMY of maize in the variant fertilized with a nitrogen dose of 120 kg N·ha−1 + PK and the control variant fertilized with the same dose of nitrogen, but without P and K, revealed interesting results. These fertilization variants of the variety Delitop differed in DMY by as much as 11.7% (2.22 t·ha−1), whereas the variants of the variety Magitop differed only by 3.5% (0.75 t ha−1). The lack of P and K fertilization strongly differentiated DMY of the variety Delitop (Table 4, Figure 4, Figure 5 and Figure 6).
The results of the research on optimal nitrogen fertilization doses of maize grown for silage under Polish climate conditions are variable. Fotyma [42] conducted a study on maize grown for silage and found that the optimal dose of nitrogen should be 140–150 kg·ha−1. According to Kruczek [43], the optimal dose of nitrogen, calculated on the basis of the ratio of the DMY to N fertilization efficiency, is 150 kg·ha−1. According to various authors [7,44,45,46], optimal doses of nitrogen applied to maize in the climatic and soil conditions of Poland ranged from 90 to 180 kg N·ha−1. Differences in the assessments of maize’s response to nitrogen fertilization resulted from different cultivation purposes, different varieties, different plant density, and harvest time limiting the length of the growing season. Bogucka et al. [47] noticed a high variation in the reaction of various maize varieties to nitrogen fertilization. Nitrogen fertilization at a dose of 150 kg·ha−1 was sufficient for the variety Junak, whereas grain yield of the variety Boruta tended to increase up to a nitrogen dose of 180 kg·ha−1. In our study, maize varieties reacted positively when nitrogen doses were increased even up to 200 kg·ha−1. The DMY of maize biomass was significantly influenced not only by nitrogen doses, but also by weather conditions during the growing season. In the first study year, the DMY of the variety Delitop was 0.43 t·ha−1 lower than in the second year. The difference in the mean DMY of Magitop varieties in both years was slightly smaller, i.e., 0.36 t·ha−1 DM (Table 4).

3.3. Dry Matter Yield Prediction

The assessment of the leaf greenness index (SPAD) has been the subject of studies aimed at using this parameter to estimate the yield of crops. Gáborčik [48] made one of the first attempts to correlate nitrogen nutrition of meadow grasses with the yield of sward. Rostami et al. [31] conducted a study on maize and found that the yield of this species was significantly linearly correlated with the values of the SPAD index. This linear dependency indicates that the SPAD index can be used as a tool to estimate the yield of maize silage biomass as well as seed yields. Our study showed a strict positive correlation between DMY of maize and the values of the SPAD leaf greenness index (Table 5).
The correlation coefficients calculated for both maize varieties were highly significant at all measurement dates. This fact shows that this index can be used to predict the yield of maize plants grown for silage (DMY of maize biomass) fertilized with different doses of nitrogen. The rectilinear regression model was used separately for each variety and for each SPAD index measurement date (three time points) to calculate the relationship between plant nitrogen nutrition with and DMY of maze biomass (Table 6). The highest R2 value, indicating the best fit of the equation for the variety Delitop, was recorded at maize development phase BBCH 83 (beginning of wax maturity of caryopses) (3rd date); for the variety Magitop, it was phase BBCH 51 (beginning of emergence of panicles) (1st date).
There are different opinions concerning the choice of the maize development phase when the SPAD index value enables the best estimation of biomass yield. According to Rostami et al. [31], yield prediction is the most precise when the SPAD index is measured at the beginning of cob formation (R1). According to Piekielek et al. [49], readouts of chlorophyll content, interpreted based on the SPAD index, performed at the six-leaf development phase (V6) can also be used to predict and estimate the yield. Wood et al. [50] observed the best correlation between the SPAD index values and yield at the 10-leaf development phase (V10). Vetsch and Randall [51] found that chlorophyll content expressed as the value of the SPAD index began to exhibit close relationship with seed size at the six-leaf development phase (V6). Blackmer et al. [52] observed an even stronger correlation between the SPAD index values and maize yield at later stages of development. The results of Bencze [53] demonstrated that both SPAD values and changes in LAI values showed a positive correlation with the average DMY.

4. Conclusions

The mean values of the SPAD index of maize depended on nitrogen dose. When the dose was increased from 120 kg·ha-1 to 200 kg·ha-1 and constant P and K fertilization, the value of the leaf greenness index increased significantly.
The plants of both maize varieties fertilized with nitrogen at a dose of 120 kg N·ha−1 without P and K were characterized by the lowest values of the SPAD index, regardless of the year of the experiment. When the nitrogen dose was supplemented with P and K, the plant nutrition with nitrogen improved significantly. The values of the SPAD index in maize plants of the variety Magitop were significantly higher than in the plants of the variety Delitop.
The coefficients of correlation calculated for both maize varieties were highly significant at all measurement dates. Therefore, it can be concluded that the SPAD leaf greenness index can be used as an important, reliable, and non-invasive indicator for DMY prediction of maize biomass.
Nutrition of maize plants with nitrogen proved to be the main determinant of the variability in biomass yield. For this reason, it was the basis for the verification of individual mineral fertilization variants.
The lack of phosphorus and potassium in the dose of mineral fertilizer limited the yield, regardless of the variety, as compared to the variant that was optimally balanced with nitrogen dose.

Author Contributions

Conceptualization, W.Z., B.W. and P.S.; methodology, W.Z., B.W. and P.S.; software, B.W.; validation, W.Z., B.W., H.B. and B.S.; formal analysis, W.Z., B.W. and P.S.; investigation, W.Z., B.W. and P.S.; resources, W.Z. and B.W.; data curation, W.Z., B.W. and P.S.; writing—original draft preparation, W.Z., B.W. and P.S.; writing—review and editing, W.Z., B.W. and P.S.; visualization, W.Z., B.W. and H.B.; supervision, W.Z., B.W. and P.S.; project administration, W.Z. and P.S.; funding acquisition, W.Z., P.S. and B.S. All authors have read and agreed to the published version of the manuscript.

Funding

This research received no external funding.

Institutional Review Board Statement

Not applicable.

Informed Consent Statement

Not applicable.

Data Availability Statement

All data generated or analyzed during this study are included in this published article.

Conflicts of Interest

The authors declare no conflict of interest.

References

  1. Asibi, A.E.; Chai, Q.; Coulter, J.A. Mechanisms of nitrogen use in maize. Agronomy 2019, 9, 775. [Google Scholar] [CrossRef] [Green Version]
  2. Rambo, L.; Ma, B.; Xiong, Y.; Ferreira da Silva, P. Leaf canopy optical characteristics as crop-N-status indicators for field nitrogen management in corn. J. Plant Nutr. Soil Sci. 2010, 173, 434–443. [Google Scholar] [CrossRef]
  3. Zielewicz, W.; Wróbel, B. Effect of differential nitrogen fertilization on the nutritive value of fodder mallow (Malva verticillata L.) and maize (Zea mays L.) Eurostar variety. J. Res. Appl. Agric. Eng. 2018, 63, 151–156. [Google Scholar]
  4. Szulc, P.; Bocianowski, J.; Rybus-Zając, M. Response of nitrogen nutritional indices maize leaves to different mineral-organic fertilization. Maydica 2012, 57, 260–265. [Google Scholar]
  5. Szulc, P.; Waligóra, H.; Michalski, T.; Bocianowski, J.; Rybus-Zając, M.; Wilczewska, W. The size of the Nmin soil pool as a factor impacting nitrogen utilization efficiency in maize (Zea mays L.). Pak. J. Bot. 2018, 50, 189–198. [Google Scholar]
  6. Gastal, F.; Lemaire, G. Nitrogen uptake and distribution in crops: An agronomical and ecophysiological perspective. J. Exp. Bot. 2002, 53, 789–799. [Google Scholar] [CrossRef] [Green Version]
  7. Księżak, J.; Bojarszczuk, J.; Staniak, M. Produkcyjność kukurydzy i sorga w zależności od poziomu nawożenia azotem. Polish J. Agron. 2012, 8, 20–28. [Google Scholar]
  8. Yang, Y.; Timlin, D.J.; Fleisher, D.H.; Lokhande, S.B.; Chun, J.A.; Kim, S.H.; Staver, K.; Reddy, V.R. Nitrogen concentration and dry-matter accumulation in maize crop: Assessing maize nitrogen status with allometric function and a chlorophyll meter. Commun. Soil Sci. Plant Anal. 2012, 43, 1563–1575. [Google Scholar] [CrossRef]
  9. Niu, J.; Chen, F.J.; Mi, G.H.; Li, C.J. Transpiration and nitrogen uptake and flow in two maize (Zea mays L.) inbred lines as affected by nitrogen supply. Ann. Bot. 2007, 99, 153–160. [Google Scholar] [CrossRef] [Green Version]
  10. Argenta, G.; Regis Ferreira da Silva, P.; Sangoi, L. Leaf relative chlorophyll content as an indicator to predict nitrogen fertilization in maize. Ciénc. Rural. 2004, 34, 1379–1387. [Google Scholar] [CrossRef] [Green Version]
  11. Gáborčik, N.; Zmetáková, Z. Chlorophyll (SPAD readings) and nitrogen concentrations in leaves of some forage grasses and legumes. Grassld. Sci. Pol. 2001, 4, 43–48. [Google Scholar]
  12. Shah, S.H. Houborg, R. McCabe, M.F. Response of chlorophyll, carotenoid and SPAD-502 measurement to salinity and nutrient stress in wheat (Triticum aestivum L.). Agronomy 2017, 7, 61. [Google Scholar] [CrossRef] [Green Version]
  13. Yuan, Z.; Ata-Ul-Karim, S.T.; Cao, Q.; Lu, Z.; Cao, W.; Zhu, Y.; Liu, X. Indicators for diagnosing nitrogen status of rice based on chlorophyll meter readings. Field Crops Res. 2016, 185, 12–20. [Google Scholar] [CrossRef]
  14. Zhao, B.; Liu, Z.; Ata-Ul-Karim, S.T.; Xiao, J.; Liu, Z.; Qi, A.; Ning, D.; Nan, J.; Duan, A. Rapid and nondestructive estimation of the nitrogen nutrition index in winter barley using chlorophyll measurements. Field Crops Res. 2016, 185, 59–68. [Google Scholar] [CrossRef]
  15. Machul, M. Zastosowanie testu SPAD do ustalenia uzupełniającej dawki azotu dla kukurydzy. Pam. Puł. 2005, 140, 159–172. [Google Scholar]
  16. Uddling, J.; Gelang-Alfredsson, J.; Piikki, K.; Pleijel, H. Evaluation of the relationship between leaf chlorophyll concentration and SPAD-502 chlorophyll meter readings. Photosynth. Res. 2007, 91, 37–46. [Google Scholar] [CrossRef]
  17. Hoel, B.O.; Solhaug, K.A. Effect of irradiance on chlorophyll estimation with the Minolta SPAD-502 Leaf Chlorophyll Meter. Ann. Bot. 1998, 82, 389–392. [Google Scholar] [CrossRef] [Green Version]
  18. Ziadi, N.; Brassard, M.; Bélanger, G.; Claessens, A.; Tremblay, N.; Cambouris, A.N.; Nolin, M.C.; Parent, L.É. Chlorophyll measurements and nitrogen nutrition index for the evaluation of corn nitrogen status. Agron. J. 2008, 100, 1264–1273. [Google Scholar] [CrossRef]
  19. Ata-Ul-Karim, S.T.; Liu, X.; Lu, Z.; Yuan, Z.; Zhu, Y.; Cao, W. In-season estimation of rice grain yield using critical nitrogen dilution curve. Field Crops Res. 2016, 195, 1–8. [Google Scholar] [CrossRef]
  20. Kozłowski, S.; Goliński, P.; Golińska, B. Barwniki chlorofilowe jako wskaźniki wartości użytkowej gatunków i odmian traw. Zesz. Probl. Post. Nauk Rol. 2001, 474, 215–223. [Google Scholar]
  21. Zielewicz, W.; Kozłowski, S. Żywotność Sorghum saccharatum (L.) Pers. w aspekcie możliwości jego uprawy w Polsce. Fragm. Flor. Geobot. Pol. Suppl. 2007, 9, 173–181. [Google Scholar]
  22. Subedi, K.; Ma, B. Nitrogen uptake and partitioning in stay-green and leafy maize hybrids. Crop Sci. 2005, 45, 740–747. [Google Scholar] [CrossRef]
  23. Szulc, P. The effect of the sum of absolute values of nutrient status indexes in plants of two hybrid types of maize (Zea mays L.) on dynamics of dry matter accumulation in initial vegetation period at varied soil nitrogen and magnesium resources. Fres. Envi. Bullet. 2013, 22, 2616–2624. [Google Scholar]
  24. IUSS Working Group WRB. World Reference Base for Soil Resources 2014, Update 2015 International Soil Classification System for Naming Soils and Creating Legends for Soil Maps, World Soil Resources Reports No. 106; FAO: Rome, Italy, 2015. [Google Scholar]
  25. Natywa, M.; Pociejowska, M.; Majchrzak, L.; Pudełko, K. Influence of irrigation and nitrogen fertilization on field and leaf greenness index (SPAD) of maize. Acta Sci. Pol. Agric. 2014, 13, 39–50. [Google Scholar]
  26. Sulewska, H.; Szymańska, G.; Śmiatacz, K.; Koziara, W.; Niewiadomska, A. Efekty stosowania PRP SOL w kukurydzy uprawianej na ziarno. J. Res. Appl. Agric. Eng. 2013, 58, 161–166. [Google Scholar]
  27. Piechota, T.; Kowalski, M.; Sawinska, Z.; Majchrzak, L. Ocena przydatności pasowej uprawy roli do doglebowej aplikacji płynnych nawozów organicznych w uprawie kukurydzy. Fragm. Agron. 2014, 31, 74–82. [Google Scholar]
  28. Costa, C.; Dwyer, L.M.; Dutilleul, P.; Stewart, D.W.; Ma, B.L.; Smith, D.L. Inter-relationships of applied nitrogen, SPAD and field of leafy and non-leafy maize genotypes. J. Plant Nutr. 2001, 24, 1173–1194. [Google Scholar] [CrossRef]
  29. Machul, M.; Borowiecki, J. Wpływ nawożenia azotem na wielkość i jakość plonu kukurydzy uprawianej na kiszonkę z kolb (CCM). Pam. Puł. 2000, 121, 117–125. [Google Scholar]
  30. Machul, M.; Jadczyszyn, T. Przydatność wskaźnika względnej zawartości chlorofilu do oceny stanu odżywienia kukurydzy azotem. Pam. Puł. 2005, 140, 173–185. [Google Scholar]
  31. Rostami, M.; Koocheki, A.R.; Mahallati, M.N.; Kafi, M. Evaluation of chlorophyll mater (SPAD) data for prediction of nitrogen status in corn (Zea mays L.). Am.-Eurasian J. Agric. Environ. Sci. 2008, 3, 79–85. [Google Scholar]
  32. Hirel, B.; Tétu, T.; Lea, P.J.; Dubois, F. Improving nitrogen use efficiency in crops for sustainable agriculture. Sustainability 2011, 3, 1452–1485. [Google Scholar] [CrossRef]
  33. Cañas, R.A.; Amiour, N.; Quillerè, I.; Hirel, B. An integrated statistical analysis of the genetic variability of nitrogen metabolism in the ear of three maize inbred lines (Zea mays L.). J. Exp. BVot. 2010, 62, 2309–2318. [Google Scholar] [CrossRef] [PubMed]
  34. Hokmalipour, S.; Darbandi, M.H. Effects of nitrogen fertilizer on chlorophyll content and other leaf indicate in three cultivars of maize (Zea mays L.). World Appl. Sci. J. 2011, 15, 1780–1785. [Google Scholar]
  35. Szulc, P.; Waligóra, H. Response of maize hybrid (Zea mays L.), stay-green type to fertilization with nitrogen, sulphur and magnesium. Part II. Plant development and the uptake of mineral components. Acta Sci. Pol. Agric. 2010, 9, 41–54. [Google Scholar]
  36. Szulc, P. Response of maize hybrid (Zea mays L.), stay-green type to fertilization with nitrogen, sulphur and magnesium. Part I. Yields and chemical composition. Acta Sci. Pol. Agric. 2010, 9, 29–40. [Google Scholar]
  37. Schepers, J.S.; Francis, D.D.; Vigil, M.; Below, F.E. Comparison of corn leaf nitrogen concentration and chlorophyll meter readings. Commun. Soil Sci. Plant Anal. 1992, 23, 2173–2187. [Google Scholar] [CrossRef]
  38. Dwyer, L.M.; Anderson, A.M.; Ma, B.L.; Stewart, D.W.; Tollenar, M.; Gregorich, E. Quantifying the nonlinearity in chlorophyll content meter response to corn leaf nitrogen concentration. Can. J. Plant Sci. 1995, 75, 179–182. [Google Scholar] [CrossRef]
  39. Varvel, G.E.; Schepers, J.S.; Francis, D.D. Ability for in-season correction of nitrogen deficiency in corn using chlorophyll meters. Soil Sci. Soc. Am. J. 1997, 61, 1233–1239. [Google Scholar] [CrossRef]
  40. Podleśna, A.; Podleśny, J.; Klikocka, H. Effect of fertilization with sulfur and nitrogen on nitrogen-phosphorus management of maize. Przemysł Chem. 2017, 96, 1374–1377. [Google Scholar]
  41. Sowiński, J.; Liszka-Podkowa, A. Wielkość i jakość plonu suchej masy kukurydzy (Zea mays L.) oraz sorga cukrowego (Sorghum bicolor (L.) Moench.) na glebie lekkiej w zależności od dawki azotu. Acta Sci. Pol. Agric. 2008, 7, 105–115. [Google Scholar]
  42. Fotyma, E. Reakcja roślin uprawy polowej na nawożenie azotem. III. Kukurydza. Fragm. Agron. 1994, 11, 20–35. [Google Scholar]
  43. Kruczek, A. Efektywność nawożenia azotem kukurydzy uprawianej na ziarno w rejonie Wielkopolski. Rocz. Nauk. Rol. A 1996, 112, 50–66. [Google Scholar]
  44. Szulc, P.; Ambroży-Deręgowska, K.; Waligóra, H.; Mejza, I.; Grześ, S.; Zielewicz, W.; Wróbel, B. Dry matter yield of maize (Zea mays L.) as an indicator of mineral fertilizer efficiency. Plants 2021, 10, 830. [Google Scholar] [CrossRef]
  45. Szulc, P.; Bocianowski, J.; Nowosad, K.; Bujak, H.; Zielewicz, W.; Stachowiak, B. Effects of NP Fertilizer Placement Depth by Year Interaction on the Number of Maize (Zea mays L.) Plants after Emergence Using the Additive Main Effects and Multiplicative Interaction Model. Agronomy 2021, 11, 1543. [Google Scholar] [CrossRef]
  46. Gonet, Z.; Stadejek, H. Wpływ nawożenia azotem i ilości wysiewu na plony kukurydzy uprawianej na zielonkę bezpośrednio do skarmiania. Fragm. Agron. 1990, 7, 30–43. [Google Scholar]
  47. Bogucka, B.; Szempliński, W.; Wróbel, E. Reakcja kukurydzy ziarnowej na nawożenie azotem w warunkach północno-wschodniej Polski. In Materiały Konferencji Naukowej Problemy Agrotechniki Oraz Wykorzystania Kukurydzy i Sorgo; UP: Poznań, Poland, 2008; pp. 44–46. [Google Scholar]
  48. Gáborčik, N. The use of a portable chlorophyllmeter for determination of nitrogen status of grasses and herbage yield. Grassld Sci. Eur. 1996, 1, 221–223. [Google Scholar]
  49. Piekielek, W.P.; Fox, R.H. Use of a chlorophyll meter to predict sidedress nitrogen requirements for maize. Agron. J. 1992, 84, 59–65. [Google Scholar] [CrossRef]
  50. Wood, C.W.; Reeves, D.W.; Duffield, R.R.; Edmisten, K.L. Field chlorophyll measurements for evaluation of corn nitrogen status. J. Plant Nutr. 1992, 15, 487–500. [Google Scholar] [CrossRef]
  51. Vetsch, J.A.; Randall, G.W. Corn production as affected by nitrogen application timing and tillage. Agron. J. 2004, 96, 502–509. [Google Scholar] [CrossRef] [Green Version]
  52. Blackmer, T.M.; Schepers, J.S.; Vigil, M.F. Chlorophyll meter readings in maize as affected by plant spacing. Commun. Soil Sci. Plant Anal. 1993, 24, 2507–2516. [Google Scholar] [CrossRef]
  53. Bencze, G. Examination of yield, leaf area and relative chlorophyll content, in monoculture long-term experiment of maize in 2016–2018. Res. J. Agric. Sci. 2019, 51, 174–181. [Google Scholar]
Figure 1. Boxplot of the SPAD index of two maize varieties in two years of the study (mean from fertilization treatments).
Applsci 11 09513 g001
Figure 2. Boxplot of the SPAD index in the following terms of measurements in relation to fertilization treatments.
Applsci 11 09513 g002
Figure 3. Boxplot of the SPAD index at successive measurement dates of in relation to maize variety.
Applsci 11 09513 g003
Figure 4. Boxplot of DMY of two maize varieties in the first year of study.
Applsci 11 09513 g004
Figure 5. Boxplot of DMY of two maize varieties in the second year of the study.
Applsci 11 09513 g005
Figure 6. Boxplot of the DMY of two maize varieties during two study years.
Applsci 11 09513 g006
Table 1. Weather conditions during the vegetation period in RGD Brody in the years of study.
MonthAverage Air Temperature (°C)Total Rainfall (mm)
The First YearThe Second YearLong-Term AverageThe First YearThe Second YearLong-Term Average
March4.24.32.875.765.137.5
April8.711.77.78.713.337.2
May15.213.413.119.585.354.7
June19.115.716.38.679.364.6
July20.019.717.980.168.177.5
August18.819.717.4171.531.462.7
September13.915.613.029.850.047.0
October10.07.98.574.973.340.7
November5.76.73.434.345.444.1
Mean/Sum
March–November
12.812.711.1503.1511.2466.0
Table 2. The leaf greenness index (SPAD) of two maize varieties depending on the fertilization variant in the first year.
Fertilization VariantVariety Delitop FAO 240Variety Magitop FAO 270
1st Date2nd Date3rd DateMean1st Date2nd Date3rd DateMean
120 kg N·ha−1548559545550566589618591
120 kg N·ha−1 + PK566571586574603598634611
160 kg N·ha−1 + PK584621634613621638652637
200 kg N·ha−1 + PK615635648632634667681660
LSD0.056.2681.4132.706x4.8285.8275.413x
Mean578596603592606623646624
Table 3. The leaf greenness index (SPAD) of maize varieties depending on the fertilization variant in the second year.
Fertilization VariantVariety Delitop FAO 240Variety Magitop FAO 270
1st Date2nd Date3rd DateMean1st Date2nd Date3rd DateMean
120 kg N·ha−1577586582581593607601600
120 kg N·ha−1 + PK582588596588615637644632
160 kg N·ha−1 + PK604642655633642653672655
200 kg N·ha−1 + PK624652668648656685692677
LSD0.055.1613.55710.159x1.63215.5043.649x
Mean596617625612626645652641
LSD0.05—for years of research, variety Delitop = 6.881, LSD0.05—for years of research, variety Magitop = n.s., LSD0.05 —for varieties = n.s.; n.s.—non-significant statistical difference.
Table 4. DMY of maize biomass depending on the fertilization variant and variety (t·ha−1).
Years of StudyFertilization TreatmentVariety
120 kg N·ha−1120 kg N·ha−1 + PK160 kg N·ha−1 + PK200 kg N·ha−1 + PKDelitop FAO 240Magitop FAO 270
Year 120.00a21.47b21.93c22.16c20.87a21.91b
Year 220.42a21.91b22.28bc22.53c21.30a22.27a
Mean from years20.21a21.69b22.11c22.35c21.09a22.09b
a, b, c—means in the same rows with the same letter are not significantly different.
Table 5. Correlation matrix between the DMY of maize biomass and SPAD index values at successive measurement dates for Delitop and Magitop varieties (**-p < 0.01; *-p < 0.05).
ParameterDelitop FAO 240 VarietyMagitop FAO 270 Variety
DMY1st Date2nd Date3rd DateDMY1st Date2nd Date3rd Date
DMY1.00 1.00
1st date0.94 **1.00 0.93 *1.00
2nd date0.92 **0.96 **1.00 0.86 *0.96 *1.00
3rd date0.95 **0.94 **0.97 **1.000.88 *0.96 *0.93 *1.00
Table 6. Straight-line regression equations describing the relationship between SPAD values measured in successive time points and DMY of whole plants.
Analysis DatesDelitop FAO 240 VarietyMagitop FAO 270 Variety
RegressionR2RegressionR2
1st dateY = 0.443x + 49.490.70Y = 0.164x + 120.080.86
2nd dateY = 0.324x + 14.40.68Y = 0.125x + 141.830.69
3rd dateY = 0.287x + 34.350.81Y = 0.141x + 129.50.75
Y—DMY of maize biomass, x—SPAD index value.
Publisher’s Note: MDPI stays neutral with regard to jurisdictional claims in published maps and institutional affiliations.

