1. Introduction
With its development of metropolises and urban agglomerations, China is now planning and constructing regional rapid rail transit networks within urban areas and between urban agglomerations on a large scale. Suburban rail connects the central area of a metropolis to its surrounding satellite cities, operates on long routes with long distances between stations, and primarily serves commuters during peak periods. To minimize commuter travel times and improve train utilization efficiency, suburban rail services are generally operated with a combination of express and local trains. This mode of operation referred to as E/L mode, express trains can satisfy the needs of passengers who travel over long distances, with rapid and direct service, whereas local trains accommodate the needs of those traveling over short distances along the same route [
1].
E/L mode refers to the concurrent operation of both local trains that stop at every station and express trains that skip some or even all stations between two points along the same route, with the goal of meeting the needs of different passengers. E/L mode is shown in
Figure 1.
Researchers around the world have studied E/L mode in urban rail transit systems. Cao et al. [
2], Ghoseiri et al. [
3], and Riejos et al. [
4] studied stop plans of express trains from the perspective of passenger travel efficiency and found the following: (1) Allowing express trains to skip stations can effectively reduce both the train turnaround times and the travel times of passengers on long journeys; and (2) using reasonable schedules that allow express trains to overtake local trains can maximize route capacity. Suh et al. [
5] developed a model incorporating several factors (e.g., inter-station distances, changes in passenger flow, and departure intervals) to optimize the stop plan for an E/L mode of the Seoul subway system and found that while operating both express and local trains during peak periods increased the passenger wait time
twait, this mode of operation reduced the total passenger travel time
ttotal. Larrain et al. [
6] examined four influencing factors for the attractiveness of express train services, namely, the direction of the route, the average passenger trip length, the scale of the passenger flow, and the level of imbalance, of which the average passenger trip length was identified as the principal factor.
The optimization problem of stop plan for skip-stop operation is usually defined as a mathematical optimization problem, and researchers have designed the mathematical models and algorithms. Gao et al. [
7], Freyss et al. [
8] and Jamili and Aghaee [
9] developed the optimization models to minimize energy consumption and passenger travel costs for urban and suburban rail transit, respectively. Boos [
10], Ulusoy et al. [
11], and Abdelhafiez et al. [
12] established the nonlinear integer programming models to minimize passenger travel times, with several parameters (e.g., the passenger flow demand, departure intervals, and the number of operating trains) as constraints, and they designed algorithms to solve these models. Parbo et al. [
13] presented the formulation of the skip-stop problem as a bi-level optimization problem, and a heuristic method for large-scale urban networks is presented to solve this extremely complex bi-level problem, where the skip-stop optimization is a mixed-integer problem. Xie et al. [
14] developed a model where the objectives consider the minimization of probability of train delays, energy consumption, and travel time of the trains, a parallelism selection genetic algorithm was designed to solve the model.
Moreover, some scholars have studied the synchronization optimization of the train stopping plan and timetable under E/L mode. Niu et al. [
15] optimized the train timetable for a route based on a certain stop plan in E/L mode. Yang et al. [
16] propose a new collaborative optimization method for both train stop planning and train scheduling problems that consider the minimization of the total dwelling time and total delay between the real and expected departure times from the origin station. Zhao et al. [
17] proposed a mixed-integer nonlinear programming (MINLP) model to formulate the integrated planning of stop planning, train scheduling and rolling stock circulation, explicitly considering time-dependent origin–destination demand.
Passenger demand distribution has a significant impact on the optimization plan under E/L mode. Mignone and Accadia [
18], and Lee et al. [
19] calculated optimal stop plans for E/L mode to accommodate different passenger flow distributions. In addition to researches with static passenger demand, Tian et al. [
20], Zhao et al. [
21], Jong et al. [
22,
23] and Sogin et al. [
24] developed models for optimizing the stop plan in E/L mode that are applicable to dynamic passenger flow patterns. Furthermore, Tang et al. [
25], and Jiang et al. [
26] proposed the mixed-integer linear programming models under express/local model consider the capacity constraints (Di et al. [
27]) and “overtaking” condition.
In this study, a multi-objective optimization model is established for optimizing the stop plan and departure frequency of suburban railway under E/L mode. The model takes the upper and lower limits of train departure frequency as the constraints and aims to minimize the total passenger travel time and the total number of operating trains. Meanwhile, a solution approach based on a genetic algorithm (GA) is proposed to solve the model. Different from previous studies, this paper mainly focuses on the schedule adjustment and impacts on solution results under the overtaking condition. Finally, a case is taken to verify the effectiveness of the proposed model.
The rest of this paper is organized as follows.
Section 2 describes the proposed problem and assumptions.
Section 3 describes the overtaking judgment and adjustment; the multi-objective programming model is also established in this section. Furthermore, a solution algorithm based on GA is designed to search for the optimal solution in
Section 4.
Section 5 uses a case to demonstrate the effectiveness and superiority of the proposed model and algorithm. Finally, the conclusions and future work are presented in the last section.
2. Description of the Problem and Assumptions
A suburban railway line on which both express trains, which skip some stations, and local trains, which stop at every station, are operated concurrently is examined in this study. Stop plans for E/L mode that can accommodate the specific passenger flow pattern on this route are calculated from the inter-station distances, the design speed, the acceleration and deceleration rates of the trains, safe headway, and the passenger origin–destination (OD) flow distribution.
The following basic assumptions are made:
(1) Regardless of their type, all trains depart from the originating station at equal time intervals.
(2) Trains run on a double-track railway line on this route. The inter-station segments of this route are not equipped with facilities that allow one train to overtake another. Overtaking occurs only at stations equipped with the requisite facilities.
(3) Passengers entering each station during the period examined in this study follow a uniform distribution.
(4) A train accelerates when departing from a station, then travels at a constant speed (i.e., the maximum design operating speed), and finally decelerates when entering the next station it stops at.
(5) The departure frequency of local trains is an integer multiple of that of express trains (this assumption facilitates the operational scheduling for trains).
(6) A passenger can only be delayed once and can only transfer once.
(7) Each passenger waiting at a station boards the train when it arrives at the station.
(8) Express trains overtake local trains at overtaking stations without stopping.
3. Modeling
Based on the above modeling assumptions, a 0–1 integer programming model (IPM) for E/L mode is established, with the stop plan for express trains and the number of express/local trains that depart during peak hours (i.e., operating frequency) as decision variables. By traversing all the operating schedules for E/L mode, parameters (e.g., the train operating timetable, the number of passengers waiting at each station, the number of passengers on board in each inter-station segment, and the number of delayed passengers) are calculated for each schedule. Then, ttotal and the total number of operating trains Ctotal in each schedule are obtained. The optimal schedule is found through comparison.
This study examines the morning peak period and the cyclic mode of operation. The study period
TR can be divided into several minimum cycles
Tc. Let
I and 1:
n be the number of trains and the ratio of the number of departing express trains to the number of departing local trains in each cycle, respectively.
Table 1 summarizes the main model parameters and their definition.
3.1. Train Timetable Calculations
Establishing a train timetable requires the calculation of the interval at which trains depart from the origin station and their travel times along each inter-station segment of the route, based on which the arrival and departure times of each train at each station can be obtained. Calculated timetables need to satisfy the tmin constraint. It is also necessary to determine whether overtaking occurs and, if so, to adjust the arrival and departure times to account for the overtaking.
3.1.1. Calculation of the Arrival and Departure Times of Trains at Each Station
1. Departure intervals
A train schedule should be formulated to satisfy the passenger flow demand on the route. The minimum operating frequency depends on the maximum sectional passenger volume during peak hours as well as the capacity and the passenger load factor of the trains. Then, the interval at which trains depart from the origin station can be calculated using Equation (1):
where
f1 and
f2 are the departure frequencies of local and express trains during the morning peak period, respectively,
qjmax is the maximum sectional inter-station passenger volume during the morning peak period (unit: persons),
D is the capacity of the trains (unit: persons/train), and
ηmax is the maximum passenger load factor of the trains.
2. Inter-station travel times
The operation of a train between two adjacent stations is simplified to the following process: It accelerates when departing from a station, then travels at a constant speed, and finally decelerates when entering the next station. A train’s travel time between two adjacent stations consists of the time when it is uniformly accelerating, the time when it is traveling at a constant speed, and the time when it is uniformly decelerating. For an express train, because it skips some stations, the uniform acceleration time and the uniform deceleration time or both should be removed if it does not stop at one or both stations of a segment. The travel time of train
i in inter-station segment
j is calculated using Equation (2):
where
Lj is the distance between stations
j and (
j + 1) (meters, m),
v is the speed at which train
i travels between the stations (km/h), and
a1 and
a2 are the acceleration and deceleration rates of train
i, respectively (m/s
2).
3. Arrival and departure times of trains at each station
Based on the above-calculated departure interval and inter-station travel times combined with tz, the arrival and departure times of each train at each station can be calculated using Equations (3)–(5). The arrival and departure times of an express train at a station where it does not stop are the same.
The departure time of each train at the origin station is calculated as follows:
The departure time of each train at each station other than the origin station is calculated as follows:
In the above equations, tzi,j is the time during which train i dwells at station j (s).
The arrival time of each train at each station is calculated as follows:
3.1.2. The tmin Constraint
To ensure safe operation,
tmin must be satisfied between successive trains. Usually, the interval between the time when a train departs from a station and the time when the next train arrives at the same station plays a key role in controlling
tmin. The state of a train at a station can be categorized into three types: arriving, passing, and departing. Based on their type (express or local), the
tmin between two successive trains is affected by three factors: the interval between the time when a train departs from a station and the time when the next train arrives at the same station, here called
Ida; the interval between the time when a train passes through a station and the time when the next train arrives at the same station, called
Ita; and the interval between the time when a train departs from a station and the time when the next train passes through the same station, called
Idt. Then the interval between when a train departs from a station and when the next train arrives at the same station must satisfy Equation (6):
3.1.3. Overtaking Judgement and Adjustments
Due to the express trains have fewer stop stations and run faster than local trains, express trains will catch up with the local trains when they are running on the same route. At this moment, the express trains need to overtake the local trains. The overtaking judgment condition can be defined as follows: if the arrival interval between two successive trains cannot satisfy the required safe interval tmin at the last station, the rear train needs to overtake the front train (as shown in Equation (7)).
1. Overtaking judgement condition:
where
is the value used to determine whether the interval between the arrival times of trains (
i − 1) and
i at the last station (i.e., station
N) satisfies the required
tmin (
means that train
i needs to overtake train (
i − 1);
means that train
i does not overtake train (
i − 1)).
2. Determination of the locations of the overtaking stations
When overtaking is deemed essential, it is necessary to determine the locations of the overtaking station. Two scenarios require overtaking to occur (
Figure 2).
Scenario 1: When the departing interval between the local train and the behind express train at station
j satisfies the safety requirement, however, the arrival interval at the station (
j + 1) is not satisfied, the express train needs to overtake the local train at station
j, as shown in
Figure 2a. Whether the train
i overtake the local train at station
j is calculated by Equation (8).
where
is the departing interval between the two successive trains at station
j and
is the arrival interval between two trains at the station (
j + 1).
Scenario 2: When the arrival interval between the local train and the behind express train at station
j satisfies the safety requirement, however, the departing interval at station
j is not satisfied, the express train needs to overtake the local train at station
j, as shown in
Figure 2b. In this scenario, whether the train
i overtake the local train at station
j is calculated by Equation (9).
3. Adjustment of the train timetable after an overtaking
If overtaking occurs, the tz of the overtaken train at the overtaking station needs to be extended. The departure time of the overtaken train at the overtaking station is changed to the original time at which overtake train passes through the overtaking station plus Itd. The arrival and departure times of the overtaken train at each subsequent station need to be recalculated based on the corresponding inter-station travel time and tz.
The timetable for each subsequent train needs to be adjusted accordingly based on the tmin constraint. If the interval constraint is unsatisfied, then the absolute value of the difference between the required and actual intervals needs to be added to the current arrival and departure times. The arrival and departure times at each subsequent station need to be recalculated based on the corresponding inter-station travel time and tz.
3.2. Passenger Flow Parameters
Our model calculations involve the following main passenger flow parameters: the number of waiting passengers at each station, the number of boarding passengers, the number of alighting passengers, the number of onboard passengers, and the number of delayed passengers.
3.2.1. Number of Passengers Waiting at the Origin Station of the Line
Under the assumption that passengers arriving at the origin station follow a uniform distribution during the study period, the total number of passengers who enter the origin station of the line between the departures of trains
j(
l) and
j(
l − 1) and whose destinations are the other stations is as follows:
Overtaking occurs on the route and causes changes in the order in which trains arrive at each station. Therefore, j(l) is used to denote the lth train that dwells at station j.
3.2.2. Number of Passengers Waiting for Trains Who Are Delayed at Each Station Other Than the Origin Station
Unlike the passengers waiting at the origin station, the passengers waiting at station
j(
j ≠ 1) consist of both the passengers who arrive during the current time period and those that were unable to board the preceding train (i.e., train
j(
l − 1)) because its capacity was reached (i.e., delayed passengers). The total number of passengers waiting at station
j is as follows:
The number of delayed passengers, that is, passengers who were unable to board train
j(
l − 1) because the number of passengers waiting for train
j(
l − 1) exceeded its capacity is as follows:
The number of passengers who board train
j(
l) at station
j depends on two factors: (1) the remaining capacity of train
j(
l) after passengers alighting at station
j; and (2) the current number of waiting passengers. If the number of waiting passengers is lower than the remaining capacity of the train, then all the waiting passengers can board the train; otherwise, only some of the waiting passengers can board the train, while the rest need to wait for the next train:
where
is the number of passengers onboard train
j(
l) at the time when the train departs from station (
j − 1), which is calculated using the following equation:
where
is the number of passengers who alight from train
j(
l) at station (
j − 1), which is calculated as follows:
3.3. Objective Functions
High departure frequencies can reduce twait and thus ttotal but increase Ctotal. The objectives of the optimization model established in this study are to minimize both ttotal and Ctotal.
3.3.1. Total Passenger Travel Time ttotal
ttotal consists of twait, the time spent onboard trains tonboard, and the time spent transferring between express and local trains ttran.
1. twait
The average
twait is set to half of the interval between the departure times of two successive trains. For delayed passengers, their
twait is set to the average
twait plus the whole interval between the departure times of trains (
i + 1) and
i.
2. tonboard and ttran
ttotal includes
tonboard and
ttran. The sum of
tonboard and
ttran can be calculated by subtracting the departure time from the starting station from the arrival time at the destination station:
where
i’ is the number of the train that the passenger takes to reach the destination station, and
i is the number of the train that the passenger takes at the starting station (if the passenger does not transfer between trains, then
I =
i’; otherwise,
I ≠
i’).
The
ttotal during the study period is as follows:
3.3.2. Total Number of Operating Trains Ctotal
Ctotal is the sum of the number of operating express trains
Ce and the number of operating local trains
Cl. It depends on the operating cycle and frequency of trains. Regardless of type, a train’s one-way travel time consists of the one-way turn-back time
tback, the
tz at each station, and the total inter-station travel time. The one-way travel times of an express train and a local train are calculated using Equations (19) and (20), respectively.
Then
Ce and
Cl are calculated as follows:
Ctotal is calculated as follows:
3.3.3. Normalization of the Objective Functions
The dimensions of the two optimization objectives of the model are different and need to be unified before the model is solved. First, the two objectives are separately normalized. Then, the two-objective optimization problem is transformed using the linear weighting method to a single-objective optimization problem. To reflect the importance attached by different decision-makers to
ttotal and
Ctotal, two normalized values are calculated for two objectives. Then, the two normalized values are linearly weighted and summed [
28], as shown in Equation (26):
3.4. Constraints
The following constraints are placed on the model:
1. Maximum departure frequency:
2. Minimum departure frequencies:
where
and
are the minimum departure frequencies of local and express trains, respectively.
3. The departure frequency of local trains is an integer multiple of that of express trains:
4. Express trains must stop at the first and last stations:
4. Algorithm Design
The proposed model includes many decision variables, such as f1, f2 and xi,j. The two-objective optimization problem described by the optimization model is transformed using the normalization method to a single-objective optimization problem, which can be solved using an algorithm based on genetic algorithm (GA) with elite strategy, the procedure of algorithm is provided below.
Step 1: Generate the initial population.
Generate the random initial population of 40 chromosomes. One chromosome has 19 genes, the corresponding gene is a binary variable equal to 1 or 0. Furthermore, one chromosome can be divided into three segments, coding for express train stop plan
xi,j (2 ≤
j ≤ 10), local train departure frequency
f1 and express train departure frequency
f2, respectively. The binary encoding of the chromosome is shown in
Figure 3.
Step 2: Calculate the fitness.
Generate the timetable according to the stop plan and frequencies of express and local train which are decoded by the chromosome. Then the overtaking condition is judged according to the safe time interval and the schedule is adjusted when overtaking occurs. If the stop plan and departure frequencies corresponding to the chromosome do not satisfy the constraints, this chromosome is discarded. If it satisfies the constraints, calculate the value of the objective function under the adjusted schedule and the fitness value of each chromosome by using the rank-based fitness method.
Step 3: Selection, crossover and mutation.
Select the chromosomes which have higher fitness to form the new subgroups and then generate a new population by using the crossover and mutation methods.
Step 4: Termination criteria.
If it reaches the maximum iteration times, stop the calculation and output the optimal result, otherwise, return to Step 2.
The flowchart of the algorithm is shown in
Figure 4.
5. Case Study
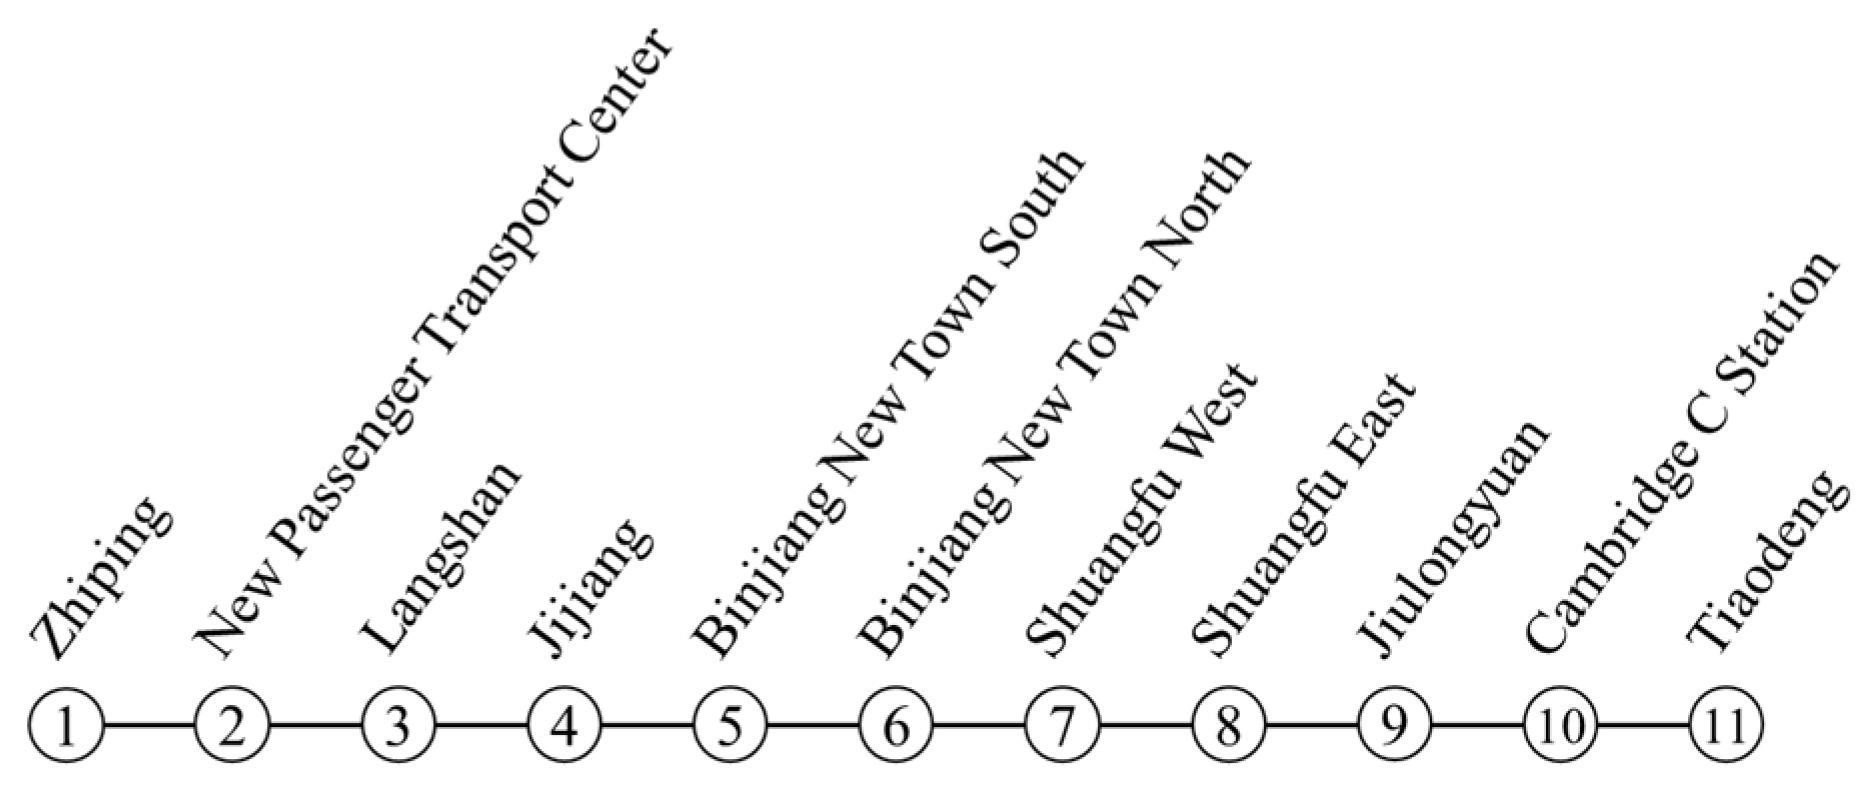
A case study of the Jiangjin Line in Chongqing in the direction towards the city center during the morning peak period was carried out to find an optimal stop plan in E/L mode for this line. The Jiangjin Line stretches 42.1 km across 11 stations, starting from the Tiaodeng Station and ending at the Zhiping Station, with an average inter-station distance of 4.21 km.
Figure 5 and
Figure 6 show the map of the Jiangjin Line and a schematic of its stations, respectively.
Table 2 summarizes the inter-station distances.
5.2. Passenger OD
The Jiangjin Line is a radiating urban rail transit line with a terminal station connected to Chongqing’s No. 5 Metro Line. The majority of the passengers on the Jiangjin Line travel to the city center. As a result, many passengers transfer from the Jiangjin Line to the No. 5 Metro Line at the Tiaodeng Station (station No. 11). The passenger flow volume on the Jiangjin Line gradually increases in the direction of the city center.
Table 5 and
Table 6 summarize the passenger OD matrix and the sectional passenger flow volume in each inter-station segment, respectively.
5.3. Calculation Results and Analysis
5.3.1. Convergence Process
Calculations yielded an optimal stop plan in E/L mode for the Jiangjin Line during morning peak hours.
Figure 7 shows the optimal trace of every generation. It can be seen that the optimal value of objective converges at 89th generation to 0.1936. The proposed algorithm shows a fast convergence speed.
5.3.2. Optimal Solution in E/L Mode
The stop plan of the express train corresponding to the optimal solution is (1, 0, 0, 1, 0, 0, 0, 1, 0, 1, 1) of which the express train skips stations No. 2, 3, 5, 6, 7, 9, and the express train overtakes the local train at stations No. 2 and 6, as shown in
Figure 8. The optimal departure frequency of the local train is
f1 = 12 trains/h and the frequency of the express train is
f2 = 6 trains/h. The adjusted train timetable under overtaking conditions is shown in
Figure 9.
5.3.3. Comparison of Optimal Results between Different Modes
1. Comparison between E/L Mode (Overtake) and AS Mode
Under the overtaking situation, the total wait time
twait in optimal E/L mode is 994.05 h, which is 132.63 h higher than that (861.42 h) in all-stop (AS) mode, this is because the express train skip at some stations leads to longer waiting time for passengers at skip stations. Moreover, the total in-vehicle time
tonboard in optimal E/L mode is 6158.83 h, which is 1633.03 h (20.96%) less than that (7791.86 h) in AS mode. This is because the express train skips some stations leading to higher operating speeds and less running time between stations. Overall, the total time
ttotal is less than that in AS mode, reduced by 1500.04 h (approximately 17.34%). Moreover, the optimal E/L mode requires 23 trains, more than the 20 trains needed by AS mode. Although the number of trains in E/L mode is greater than that in AS mode, the E/L mode is better overall because the total travel time in E/L mode is less and the weight of passenger travel time in the normalized objective function is greater than the weight of the number of trains.
Table 7 summarizes the comparison results between E/L mode with the overtaking condition and AS mode.
2. Comparison between E/L Mode (Overtake) and E/L Mode (No Overtake)
When the line adopts E/L mode but the overtaking condition is not allowed, the total wait time
twait in is 1593.02 h, which is 598.97 h higher than that in E/L mode with the overtaking condition, this is because in non-overtaking mode, the interval between express train and local train at each station becomes very long in order to meet the safety interval requirements. Moreover, the total in-vehicle time
tonboard in non-overtaking mode is 6849.58 h, which is 690.75 h (10.08%) greater than that in E/L mode with the overtaking condition. The extra time is mainly caused by the longer transfer time of non-direct passengers at the transfer station. Overall, the total time
ttotal with the overtaking condition is less than that with the non-overtaking condition, it can reduce 1289.72 h (approximately 15.28%). As the express train cannot overtake the local train, the departure frequency of the train is very small to ensure the safe operation interval, thus the total number of trains required is fewer.
Table 8 summarizes the comparison results between E/L mode with the overtaking condition and E/L mode without overtaking condition.
5.3.4. Sensitivity Analysis
Calculations were carried out to analyze the effects of
tz on the optimization results for AS mode, E/L mode with overtaking condition and E/L mode without overtaking condition at a
tmin of 90 s and a load factor of 100% while the other conditions were kept unchanged.
Figure 10 shows the comparison results of different
tz values.
The following conclusions can be drawn from
Figure 10.
(1) With the increase in stop time tz, the total travel time of passengers ttotal increases. The increase in tz has a greater impact on the ttotal in AS mode than other modes. As tz increases from 30 to 60 s, the ttotal in AS mode increases by 1025.6 h (12.60%), from 8141.54 to 9167.14 h, while the ttotal in E/L mode with the overtaking condition increases by 523.7 h (7.53%) from 6950.92 to 7474.62 h, the ttotal in E/L mode without the overtaking condition increases by 977.12 h (12.27%) from 7960.92 to 8938.04 h.
(2) Increasing tz enhances the superiority of E/L mode over AS mode in terms of ttotal. At tz = 30 s, the ttotal in E/L mode with the overtaking condition is 14.62% less than that in AS mode, and the number grows to 18.46% as tz increases to 60 s. Therefore, the formulation of a train operating schedule requires the determination of a reasonable tz based on the actual operational conditions on the route in conjunction with the passenger flow.
6. Conclusions
In this paper, a 0–1 integer programming model is built for optimizing the stop plan and departure frequency of a suburban railway under a skip-stop operation mode. The model takes the stop plan of an express train and the departure frequencies of both express and local trains as decision variables, the upper and lower limits of train departure frequency as the constraints. The optimization objectives of the model are to minimize the total passenger travel time and the total number of operating trains. Meanwhile, a solution algorithm based on a genetic algorithm is proposed to solve the model. On the basis of previous research, this paper mainly focuses on schedule adjustment, optimization of a stop plan and frequency under the overtaking condition, which can maximize the line capacity. A case of Jiangjin Line in Chongqing is used to show the reasonability and effectiveness of the proposed model and algorithm. The results show that total travel time in E/L mode with the overtaking condition is significantly reduced compared with AS mode and E/L mode without the overtaking condition. Although the number of trains in the optimal solution is more than other modes, the E/L mode with the overtaking condition is still better than other modes on the whole. Increasing the station stop time can enhance the superiority of E/L mode over AS mode.
The research results of this paper can provide a reference for the optimization research of skip-stop operation under overtaking conditions and provide evidence for urban rail transit operators and planners. There are still some aspects that can be extended in future work. Firstly, this paper assumes that passengers take the first train to arrive at the station, whether it is the express train or local train. In reality, the passenger’s choice of train is a probability problem, therefore the passenger route choice behavior considering the train congestion should be considered in future studies. Moreover, genetic algorithms have the characteristics of obtaining partial optimal solutions rather than global optimal solutions. The optimization problem of the genetic algorithm for solving skip-stop operation optimization models is also an important research tendency.


