Abstract
Continuous interaction between wheels and rails during train operation results in rail wear and tear. Corrugation of the rail surface is particularly caused by the contact mechanism between train wheel and rail and increases the vibration and dynamic wheel load, and if continued, leads to various defects and breakage of the track. Many devices are used to measure corrugation accurately, but measurement deviation varies greatly by measuring device. The most common corrugation measurement system measures surface roughness with a vibration acceleration sensor or displacement sensor. Corrugation with different pitches can be calculated by assuming the longitudinal rail surface as a chord with variable wavelength. Recent systems use a measurement model applying multiple sensors for more accurate measurement. This study investigated spectral characteristics of rail surface roughness based on long time measurement results. In particular, spectral changes upon the growth of rail surface wear and corrugation were analyzed when using the measurement system applying the chord offset method with multiple sensors. The results of analysis were verified through the field subway section, a running track undergoing corrugation, three months after initial measurement, and compared the measurement results according to the number of sensors. Additionally, the rail surface wavelength bands that affected measurement value according to the number of sensors were analyzed.
1. Introduction
Rail corrugation refers to surface roughness in the longitudinal direction of rail with a regular shape generated by friction and sliding between train wheel and rail. It can be generated in forms that vary by cause and also occurs in straight sections but mainly on low rails of curved sections. Applying cant, which is a gap between the inner and outer rails of an appropriate curved track according to train operating speed, can reduce corrugation or damage to the rails. Rail corrugation is in the form of wear with short wavelengths (30~100 mm) and long wavelengths (100~300 mm) depending on train weight, speed, and frequency, track curvature radius, and rail hardness.
Continuous generation and development of corrugation increases excitation of the wheels and train rails, causing rail defects and increasing track maintenance costs and risks to safety. It is also a major source of environmental noise. Furthermore, rail corrugation can not only affect the passenger comfort [1], but also deteriorate the vehicle–infrastructure interaction performance [2]. Together, these factors make it necessary to monitor for rail surface corrugation through continuous inspection and accurate detection [3].
Rail surface roughness is measured to determine the degree of corrugation on the track’s rail surface, with the measured surface roughness level expressed as a function of rail wavelength. The rail wavelength is associated with noise-generating frequencies related to speed, with the wavelength of acoustic roughness associated with the rolling noise increasing as the speed of the train running on the rail increases. The rail surface roughness with a long wavelength (or associated frequency about 0 Hz~100 Hz) induces dynamic stress and causes structure-born noise, and the relatively short wavelength(or associated frequency about 30 Hz~5 kHz) on the rail surface irregularity is the main cause of airborne noise [4,5,6,7]. This paper measured acoustic roughness and rail corrugation in the rail wavelength ( = 7~70 mm) domain related to 500~2000 Hz, which is the frequency band in urban train operating speed (50~120 km/h). Although the wavelength range used in measurement of acoustic surface roughness and the prediction of rolling noise varies by track and train speed, international standards generally specify 3.15~250 mm (EN 15610), 3.15~630 mm (EN 3095), and 10~1000 mm (EN 13231-3) [8,9,10].
A variety of portable devices have been developed to measure rail surface roughness. These include ones that use an acceleration sensor on a moving platform [11] and trolley-type devices that use a displacement sensor fixed to the platform [12]. Other types include non-contact sensors, such as those that involve attaching a laser displacement sensor to a device fixed to the rail, to measure the surface along the guide rail reciprocally. A recently developed measurement method using displacement sensors measures the relative displacement between upper platform and rail surface. In particular, the displacement sensor such as LVDT is in direct contact with the rail surface and observes displacement changes caused by surface irregularity when the platform of the measurement system moves while maintaining a constant height from the surface and converts the collected data into the rail surface roughness. However, the mobile measurement platform does not have a fixed reference for sensor measurement and the sensor itself may be tilted, causing potential for distortion in the size and phase of the measured value. Therefore, new ways have been proposed, such as the chord-based measurement method, which assumes that the longitudinal rail surface is a sinusoidal wave function consisting of various wavelengths and uses more than one sensor to correct the measured value mutually, and have been used to complement the structural limitations of mobile measuring systems with displacement sensors [13,14].
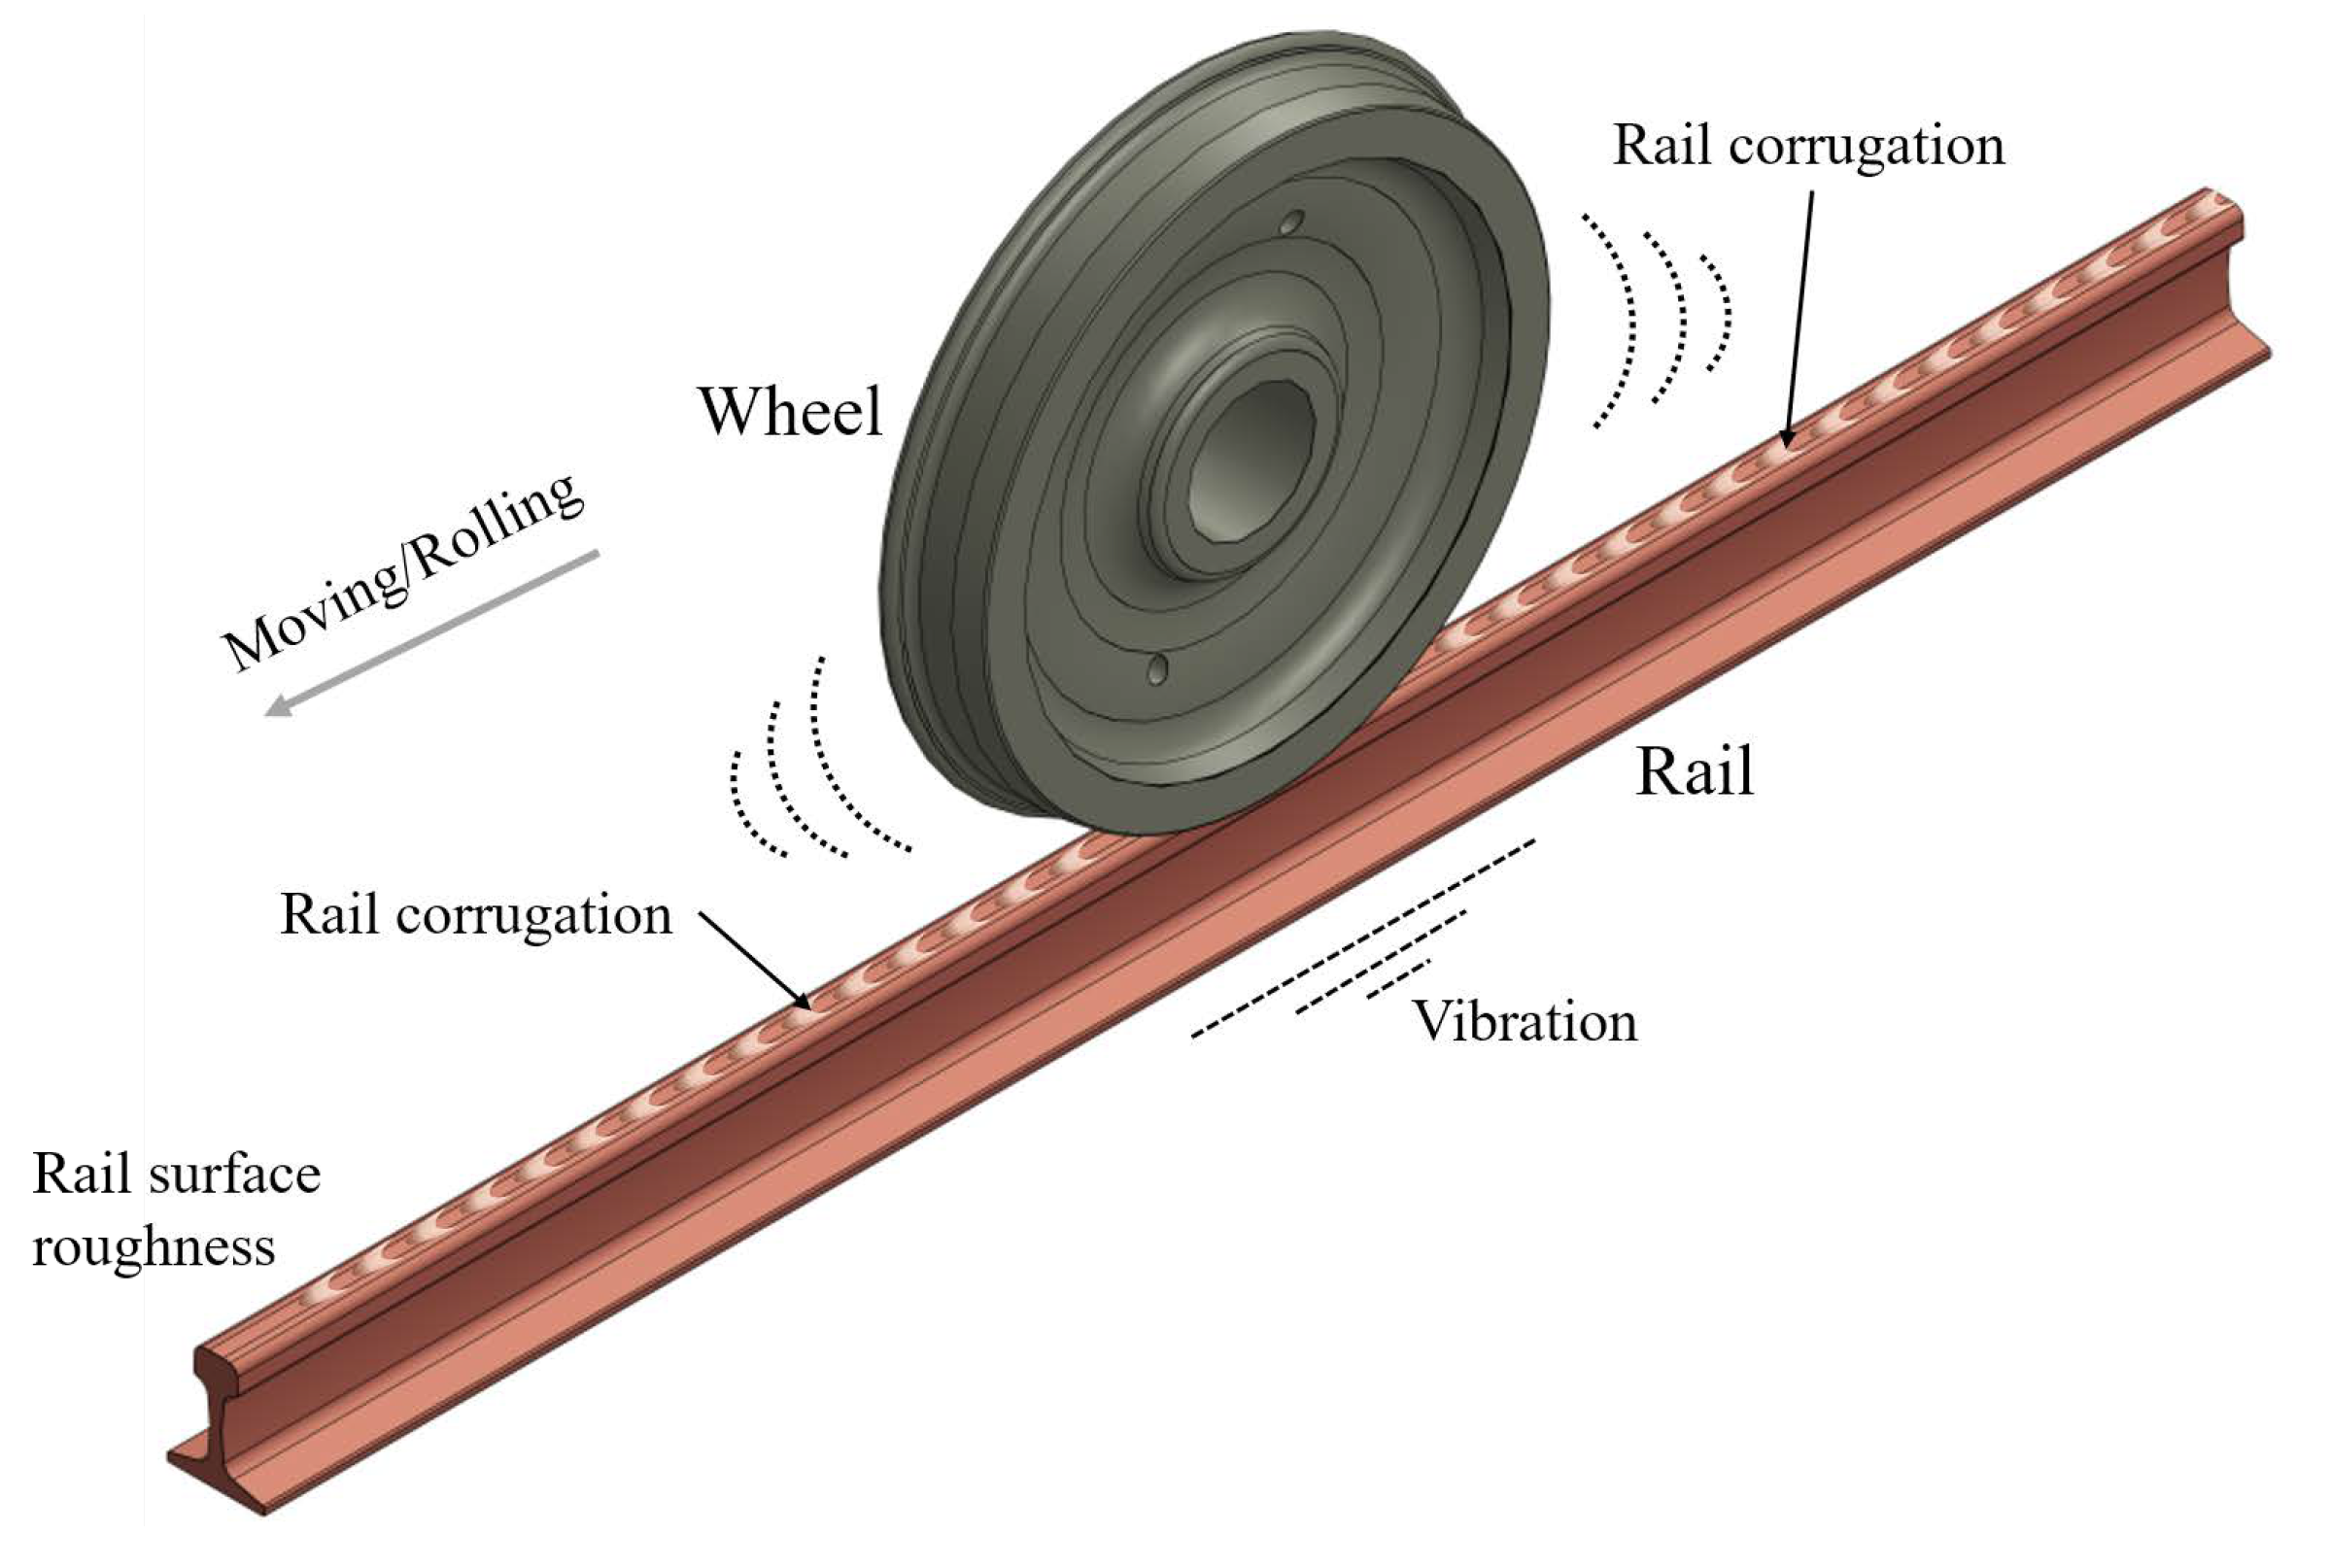
This study analyzed the accuracy of measured values by number and location of displacement sensors installed on a mobile device to measure rail surface conditions, such as corrugation generated by the contact of wheel and rail, as shown in Figure 1. It then verified measurement accuracy by analyzing the sensitivity for different numbers of sensors and testing the railway operating track.

Figure 1.
Rail corrugation and rolling noise generated through wheel-rail contact mechanism.
2. Method for Measuring Rail Surface Roughness
Ways to measure rail surface roughness in a longitudinal direction can be mainly divided into non-contact and contact. The non-contact method generally uses laser sensors and images installed on a detection train or dedicated train for high-speed measurement. The contact measurement method generally uses laser sensors installed on a mobile trolley device to measure acceleration in tandem with an acceleration sensor in contact with the rail surface. It calculates displacement value indirectly through double integration or measures surface displacement directly using a contact displacement sensor, such as LVDT [11,12]. Accelerometer-based surface roughness measuring systems—using an acceleration sensor as in the contact measurement via a portable trolley in this study—can be used without reference value to measure the rail surface roughness and thus can be successfully used with a moving measurement platform. However, they are much more sensitive to shaking or vibration from the measurement system itself and thus require an additional means for dynamic isolation treatment between the fixed frame and the acceleration sensor. Moreover, it is important to maintain a speed consistently during measurement since the sampling intervals vary to measurement speed. Using double integration to extract displacement from the measured acceleration value is a major cause of poor accuracy. Therefore, mobile measuring devices that directly measure rail displacement using a displacement sensor have been the recent choice.
2.1. Chord-Based Measurement
There is an advantage to measurement systems using a displacement sensor on a small mobile trolley in that they can measure directly displacement of the rail surface. However, the measured value can not express the actual surface roughness of rail correctly since the sensor only measures the relative distance between the moving platform and the rail surface as the sensor moves with the moving platform it is fixed upon. To compensate for this problem, the system assumes the rail surface is a sinusoidal wave function with size Y and wavelength , defining the ratio of measurement system length (chord length or wheelbase, L) to sensor position, and calculating the transfer function between the measured values to the rail roughness to minimize amplification of the measured value [15]. However, such a modeling method can include an unmeasurable or amplified wavelength range, in which measured value is larger than actual value, depending on the sensor positions on the platform. For example, measuring the wavelength in the = 5~250 mm band is important when predicting the rolling noise of an electric train by measuring the rail surface roughness. In that case, the analysis method considering such characteristics of wavelength range is necessary to investigate rail acoustic roughness accurately. The surface contact method, which removes the platform’s drive wheel and slides with the rail surface, may be used to compensate for the vulnerability of the measured value of the sensor fixed on the moving platform to the measurement of a specific wavelength on the rail surface [16]. However, it is difficult to automate the device, and there may be a large difference in the result value depending on the user. Moreover, the platform size may increase, and the platform surface in contact requires continuous maintenance.
Therefore, using the chord offset method with multiple sensors on a small mobile measurement system, along with analyzing rail acoustic roughness, has been the most common choice to resolve measurement distortion in a specific wavelength range [17]. The recently proposed chord offset-based measurement method using multiple sensors, like chord offset synchronizing, increases data accuracy by compensating for the size and phase of the measured value based on multiple sensors in the mobile measurement system design and at the same time reducing external disturbance from the driving wheels [14]. However, while increasing the number of sensors mounted on the platform can increase measurement accuracy, this increases both device costs and sensor maintenance. This study analyzed the measured value as it changed with the number of sensors installed on an automated mobile platform when measuring rail surface for such things as corrugation, and examined the impact of the number of sensors on measurements of rail surface corrugation. The results of our analysis were tested and verified with a corrugation measurement test on the railway track in operation.
2.2. Chord-Based Measurement with a Single Sensor
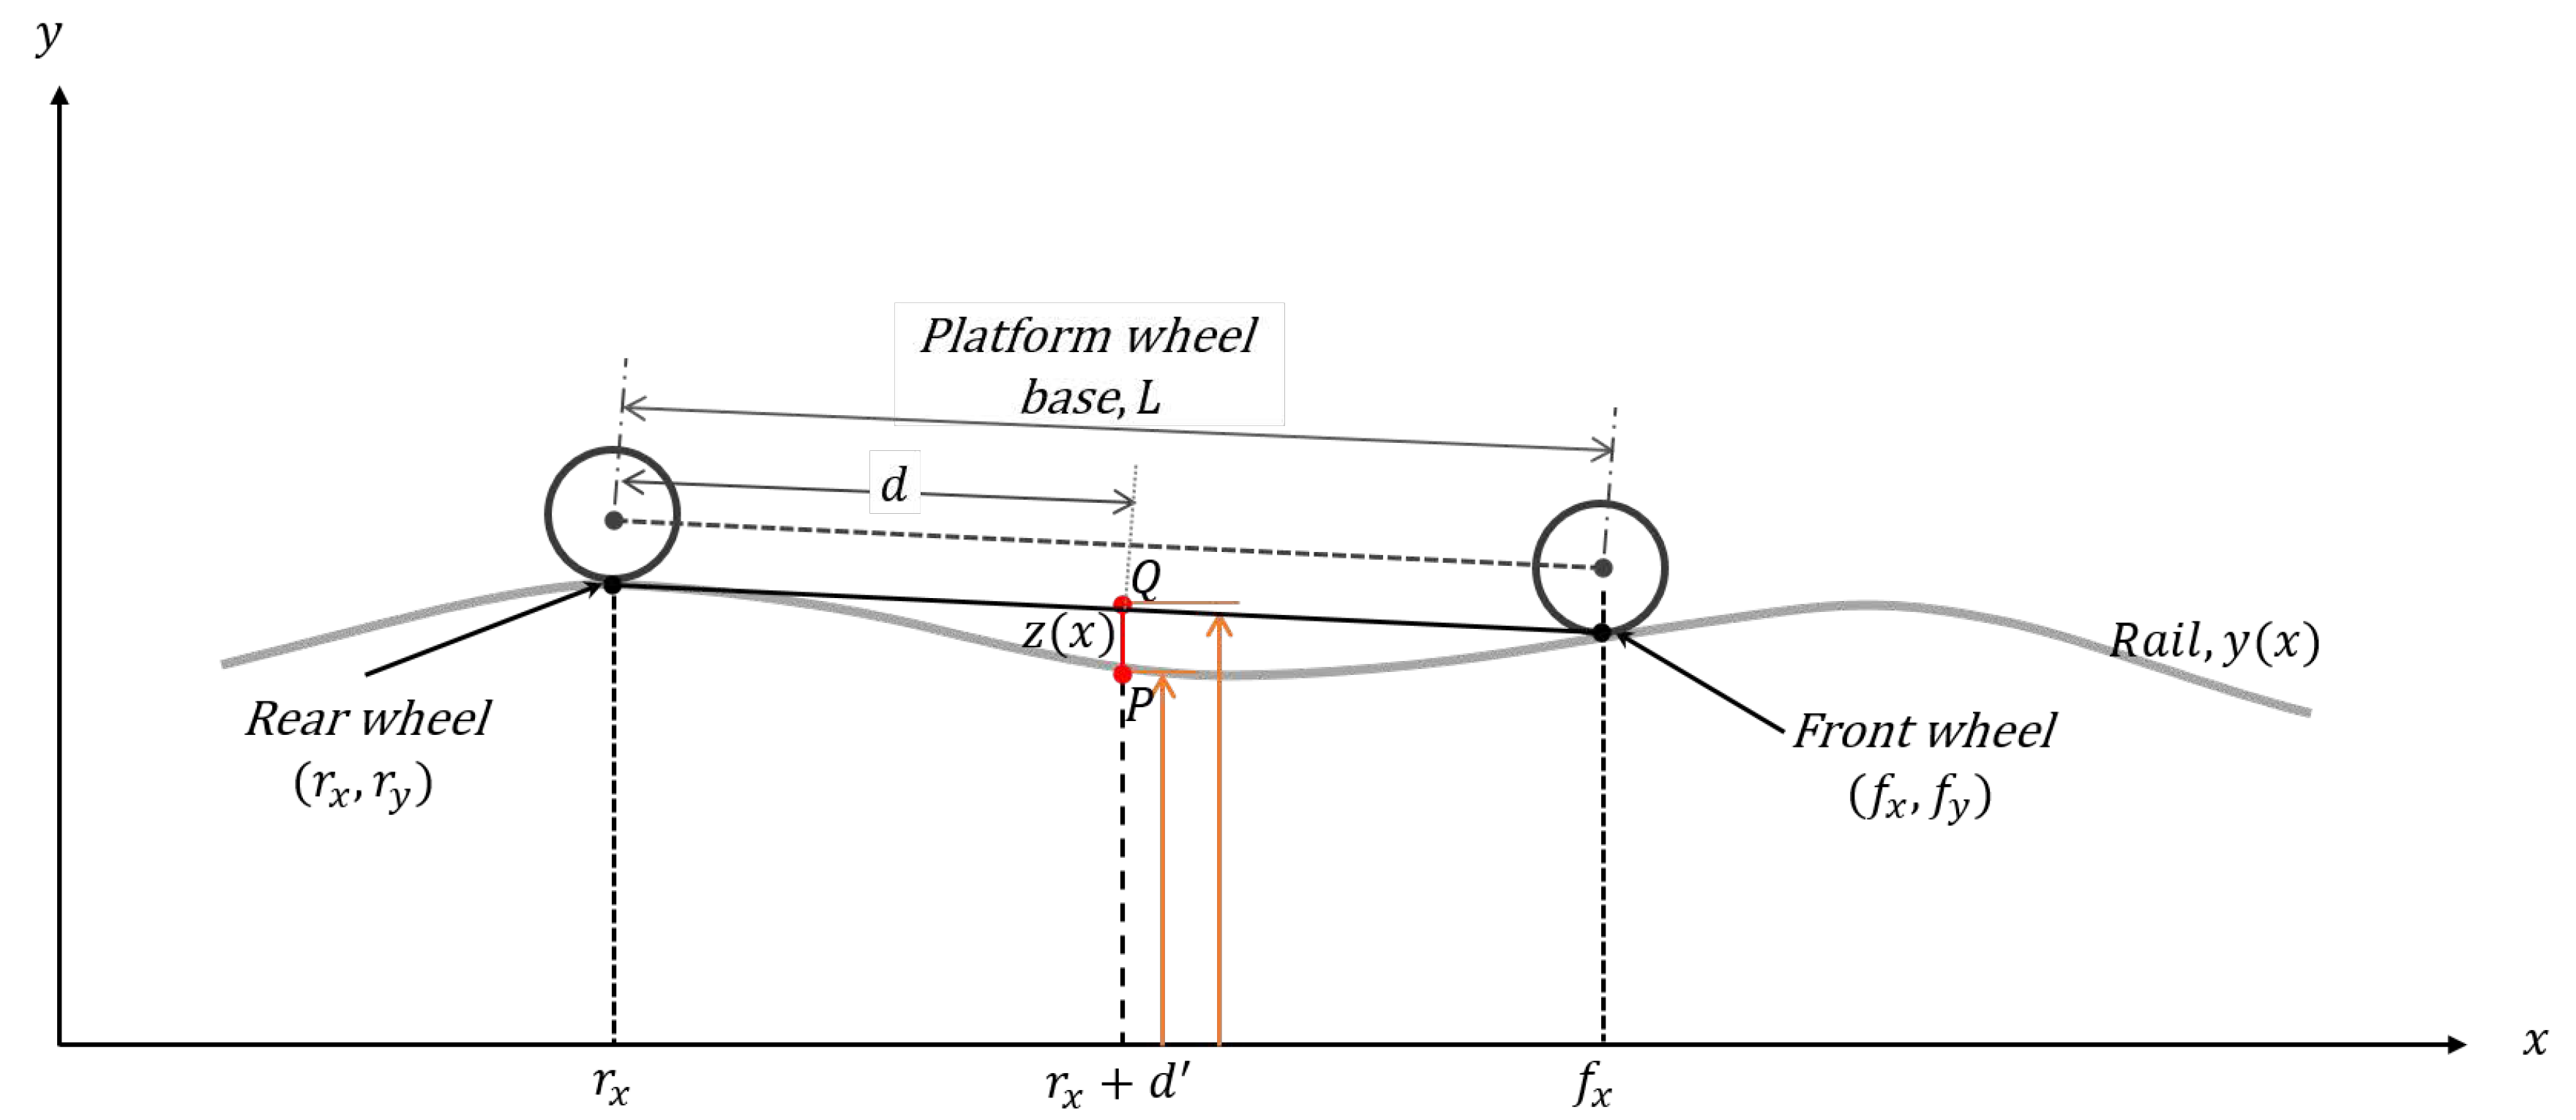
As depicted in Figure 2, where and are coordinate of contacting points between rail surface and rear and front wheel, respectively, d is the distance from rear wheel () to the sensor, and is the x-axis projection of d, chord-based measurement assumes that the measurement system with the chord length of L positioned at a distance of d from the edge drives on a rail of sinusoidal form() with an arbitrary wavelength. In this case, the coordinates of the point where the two wheels contact the rail can be expressed as Equations (1) and (2).
where Y is the amplitude of the sinusoidal rail, and k is . Since the value measured by the sensor is the distance from the platform to the rail surface at sensory position x, the vertical rail waveform can be expressed as follows:
where is a line segment between the sensor position on the platform and the rail surface, and .
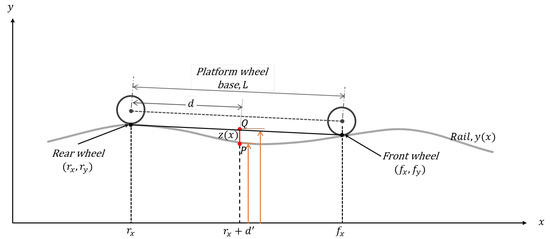
Figure 2.
Chord offset measurement model with single sensor (adapted and modified from [14]).
Therefore, the amplitude and phase measured by the sensor on the platform can be calculated numerically by using the magnitude and phase of trigonometrical function from Equation (3), while the transfer function between the measured value and the rail surface roughness can be defined as follows [14]:
The transfer function of Equation (4) can be used to calculate the amplification ratio of the measured sensor value to the actual value of the rail surface and the change to phase in accordance with sensor position. Measuring rail surface roughness with a sensor may amplify or attenuate the measured value depending on sensor position (d), rail surface wavelength (), and device length (L). In other words, it is necessary to change sensor position (d) value for repeat measurements to verify the measured value when using a sensor to measure rail with corrugation of a specific wavelength since it is difficult to predict measurement distortion. However, it is often impossible to adjust sensor position on some measurement platforms, making it difficult to trust measurement accuracy.
2.3. Chord-Based Measurement with Two or Three Sensors
The recently proposed multi-sensor-based chord offset measurement uses two or more sensors in consideration of actual platform length (L) and main wavelength range to be measured to supplement the amplification or attenuation of individual measured values at a specific wavelength. It also increases measurement accuracy by minimizing the excessive amplification or attenuation that occurs at specific wavelengths [14]. Although the method may display different compensated values according to the relative distance between the sensors, it has the advantage of obtaining more accurate measurements throughout the wavelength ranges on the rail surface and easily analyzing rail cracks or unevenness than the conventional analysis method. However, at least two sensors are necessary to synchronize the values of the sensors used in different positions with a value measured in the same position and to increase measurement accuracy.
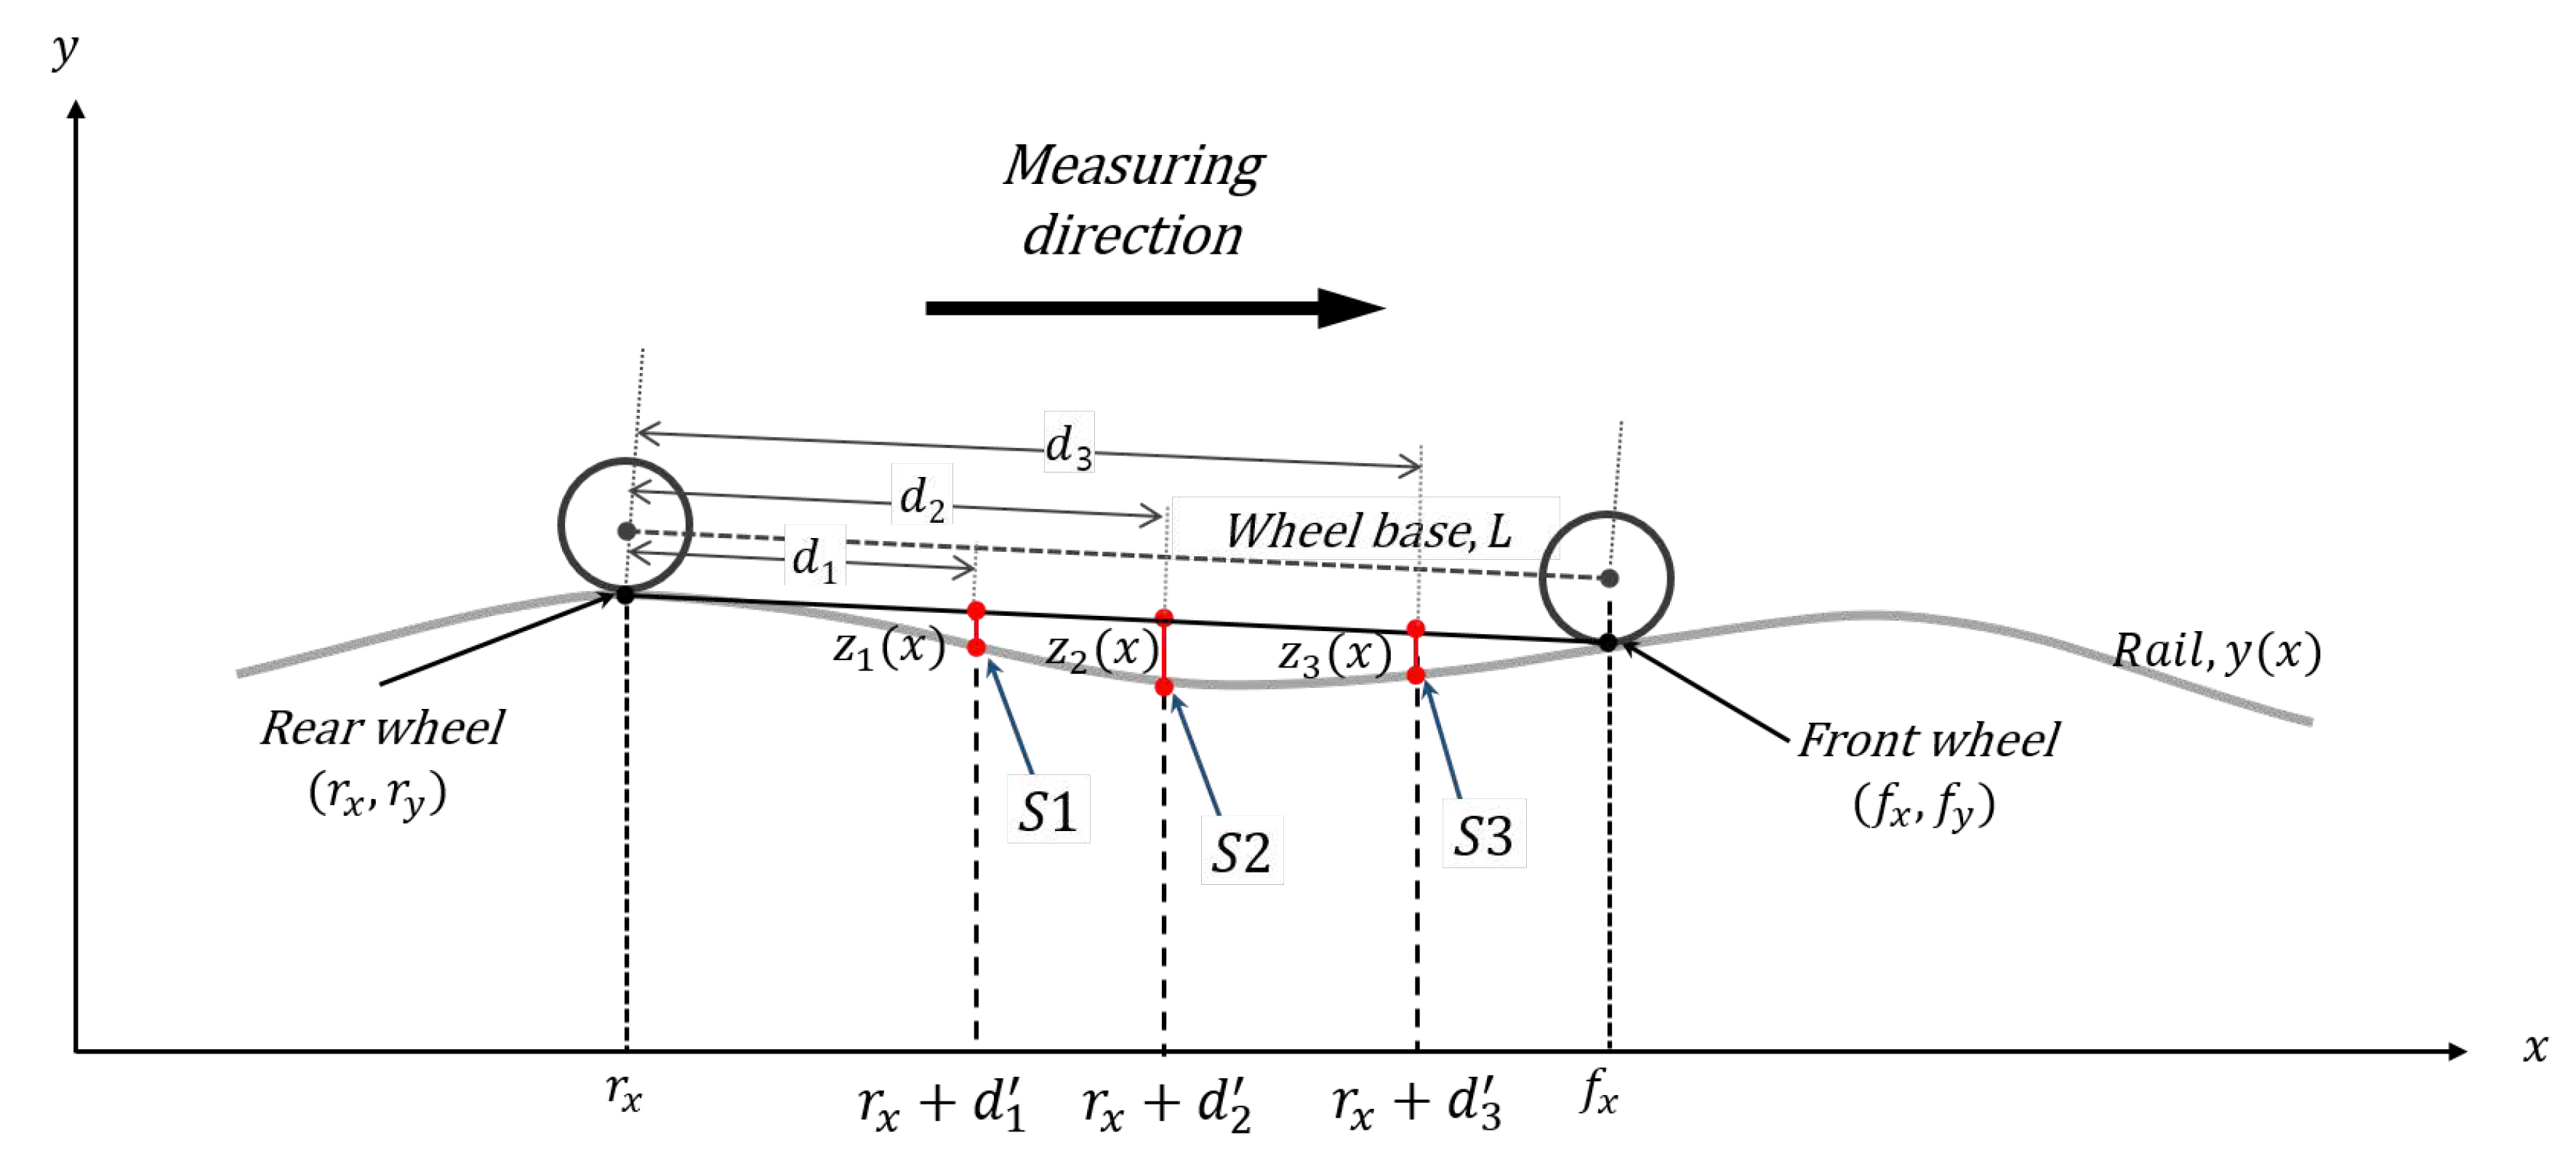
Figure 3 shows the multiple sensor-based chord offset measurement model, which calculates measurement value and phase difference using multiple sensors. This model can calculate optimal sensor positions on a platform with a specific wheelbase (L) and wheel diameter (D). The optimal position of each of three sensors can be determined by calculating the measurement size with Equations (3) and (4) first and obtaining the average value of the magnitudes of the calculated measurements. Finally, the sensor position with the minimal final value can be obtained by varying the three sensor positions. With the measuring system manufactured for the test, which had a wheelbase of 716 mm (L = 716 mm) and wheel diameter of 100 mm (D = 100 mm), the optimized positions of the three sensors are calculated as = 222 mm, = 327 mm, and = 432 mm from the rear wheel [14].
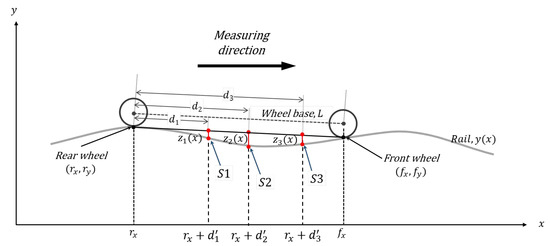
Figure 3.
Multiple sensor-based chord offset measurement model, where , is the distance between to ith sensor () (Adapted and modified from [14]).
Although using the multiple sensors can improve accuracy of the measured value and remove the impact of periodic external disturbance, as shown in the spectral analysis of rail surface roughness, it requires at least three sensors on the platform. Therefore, it is possible to perform an optimization check to verify the results obtained after reducing the number of sensors to two. Although more sensors make for a more accurate measurement of various wavelength ranges of a rail surface, it is possible to optimize positions of two sensors by limiting measurement range to rolling noise of the rail or main wavelength ranges.
By using the transfer function, , of the sensor measurement to the rail surface roughness value, the following equation is obtained in accordance with changes to each sensor position and calculating the sum of squared residuals (SSR), where residual(r) is and amplification ratio is considered as .
where is the observed response value and is the fitted response value.
Optimal sensor positions can be obtained by changing the positions of the two sensors to be installed and using calculations to minimize the sum of the residuals to minimize the amplification ratio of the measured values. Therefore, the positions of two sensors were calculated using the distance between front and rear platform wheels (wheelbase L = 716 mm) with the minimum value in the main wavelength region (5~500 mm) where rolling noise occurs. The sensor positions selected in consideration of frequency domain ( R = 314 mm) related to drive wheel eccentricity to solve the problem of the wheel-mounted mobile platform measuring device emphasizing the spectrum of the wavelength related to wheel rotation period can be calculated as = 230 mm, = 380 mm. The value at this time becomes 26.16. Table 1 summarizes optimal sensor positions when different numbers of sensors are used.

Table 1.
Summary of optimal sensor positions when increasing the number of sensors used.
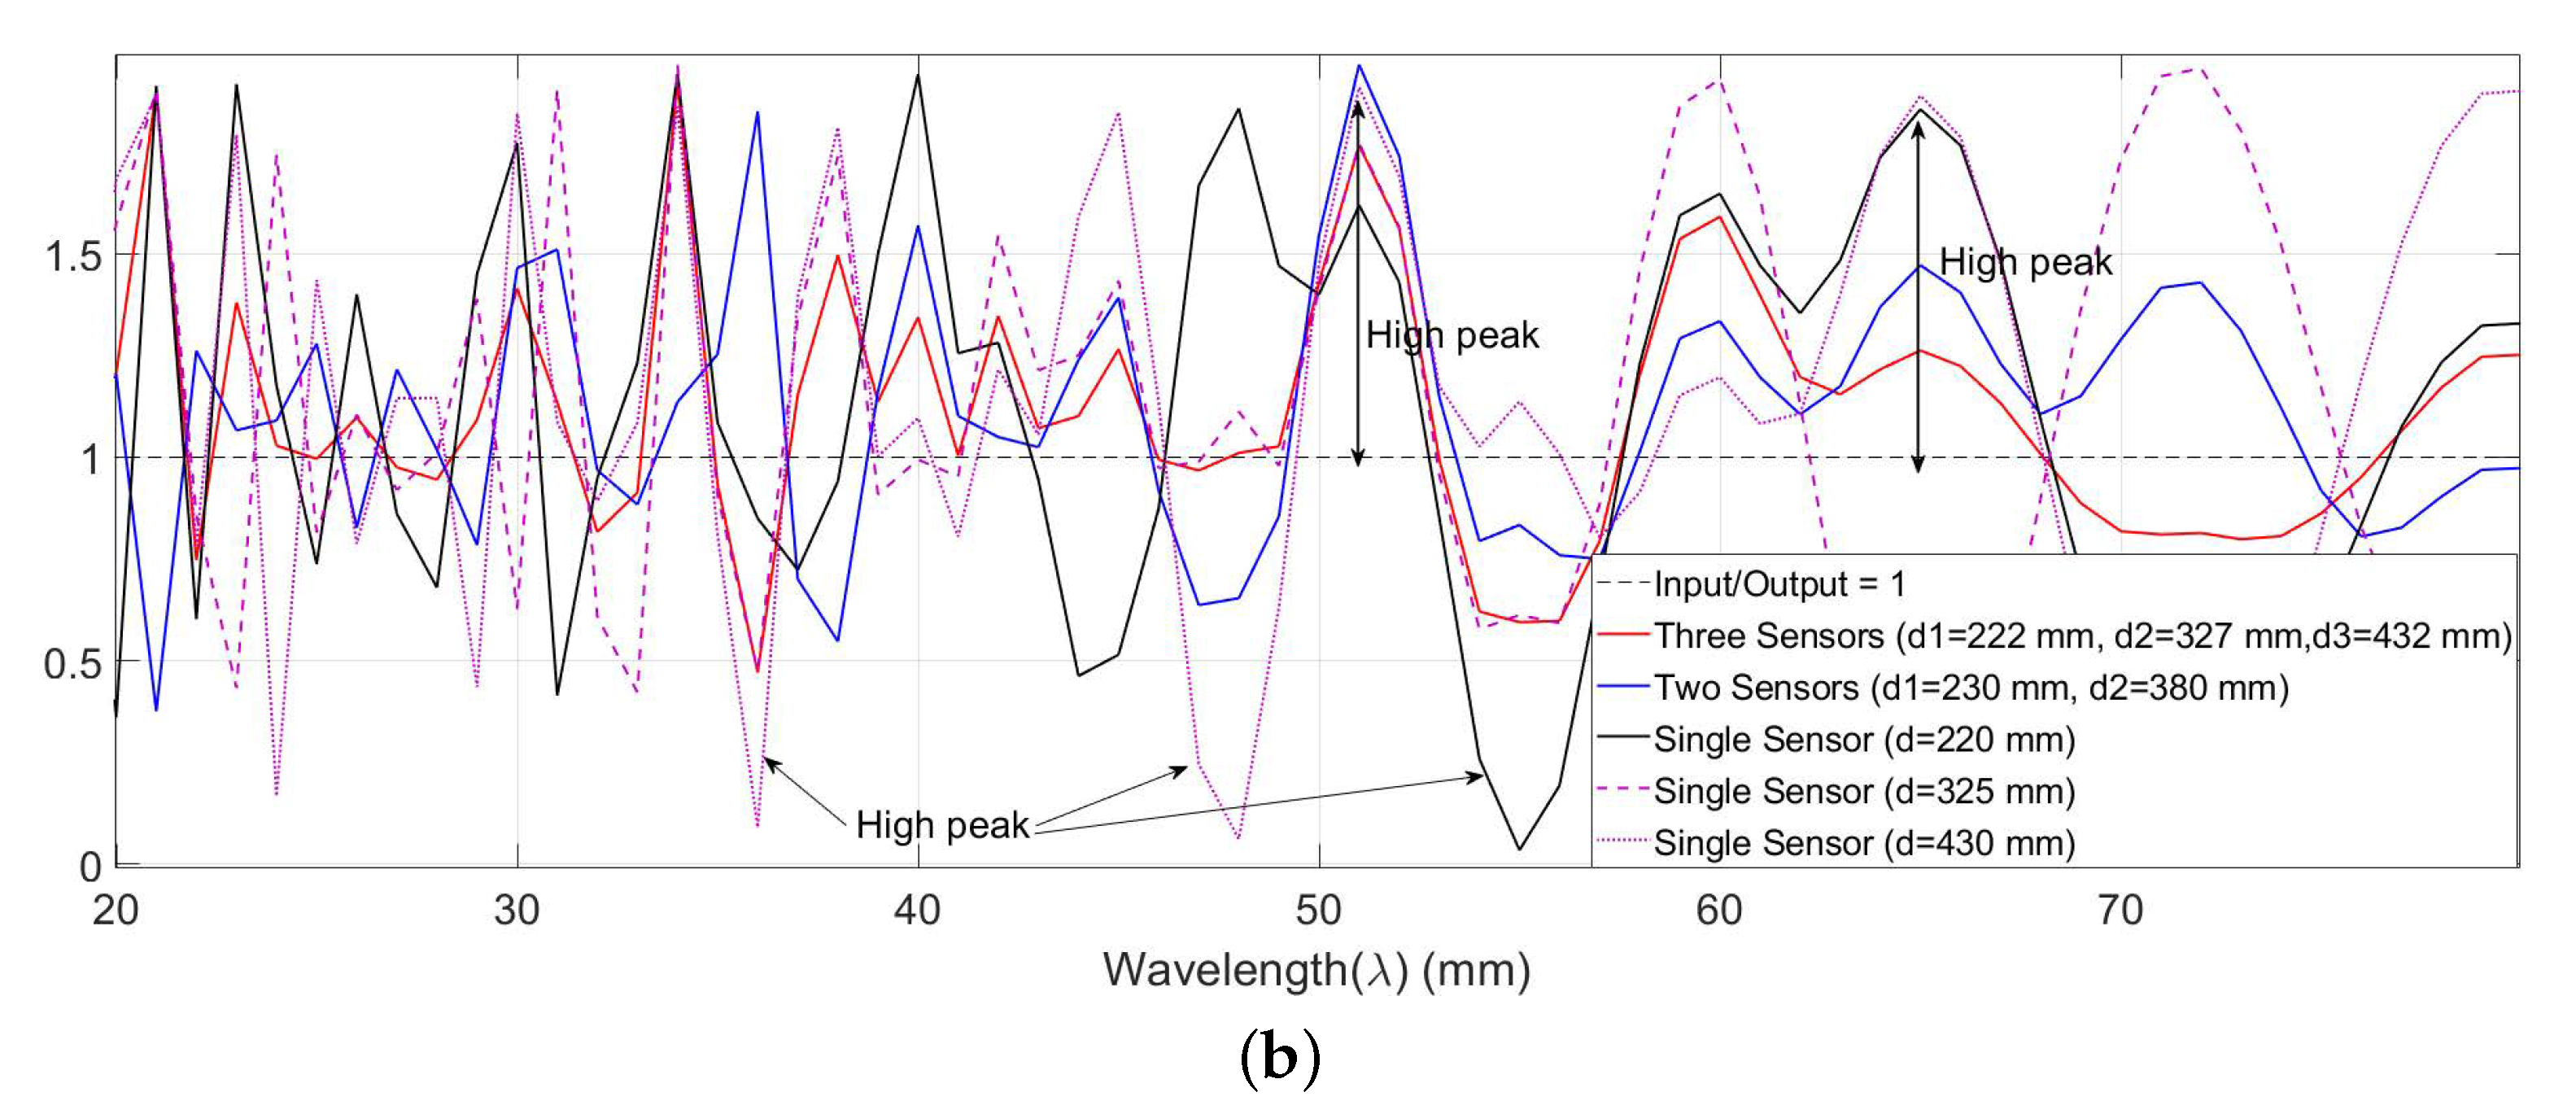
Figure 4 shows a comparison of these two sensor positions with the transfer function values of chord offset measurement method using three sensors. As shown by the graph, the sum of total measurement errors at the wavelength Section 300 mm or higher is expected to be low. In particular, the roughness spectrum value of a specific wavelength is amplified, as shown in Figure 4a, if one sensor is used. Figure 4b is an enlarged view of the main wavelength range (20~80 mm) that occurs in rail corrugation.
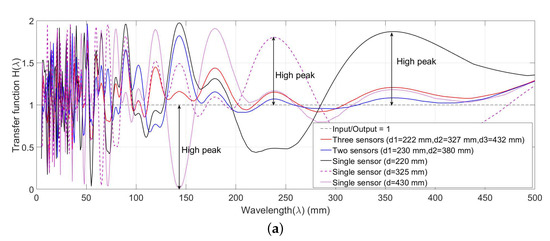

Figure 4.
Comparison of magnitude of transfer function according to the number of sensors used; (a) Overall magnitude of the transfer function; (b) Magnitude of transfer function at specific wavelength range from 20 mm to 80 mm.
The transfer function representing the amplification ratio of the measured values based on optimal position values for different numbers of sensors. The value of these transfer functions is generally smaller than when using one sensor, but this differs slightly by the wavelength to be measured.
3. Field Test and Results
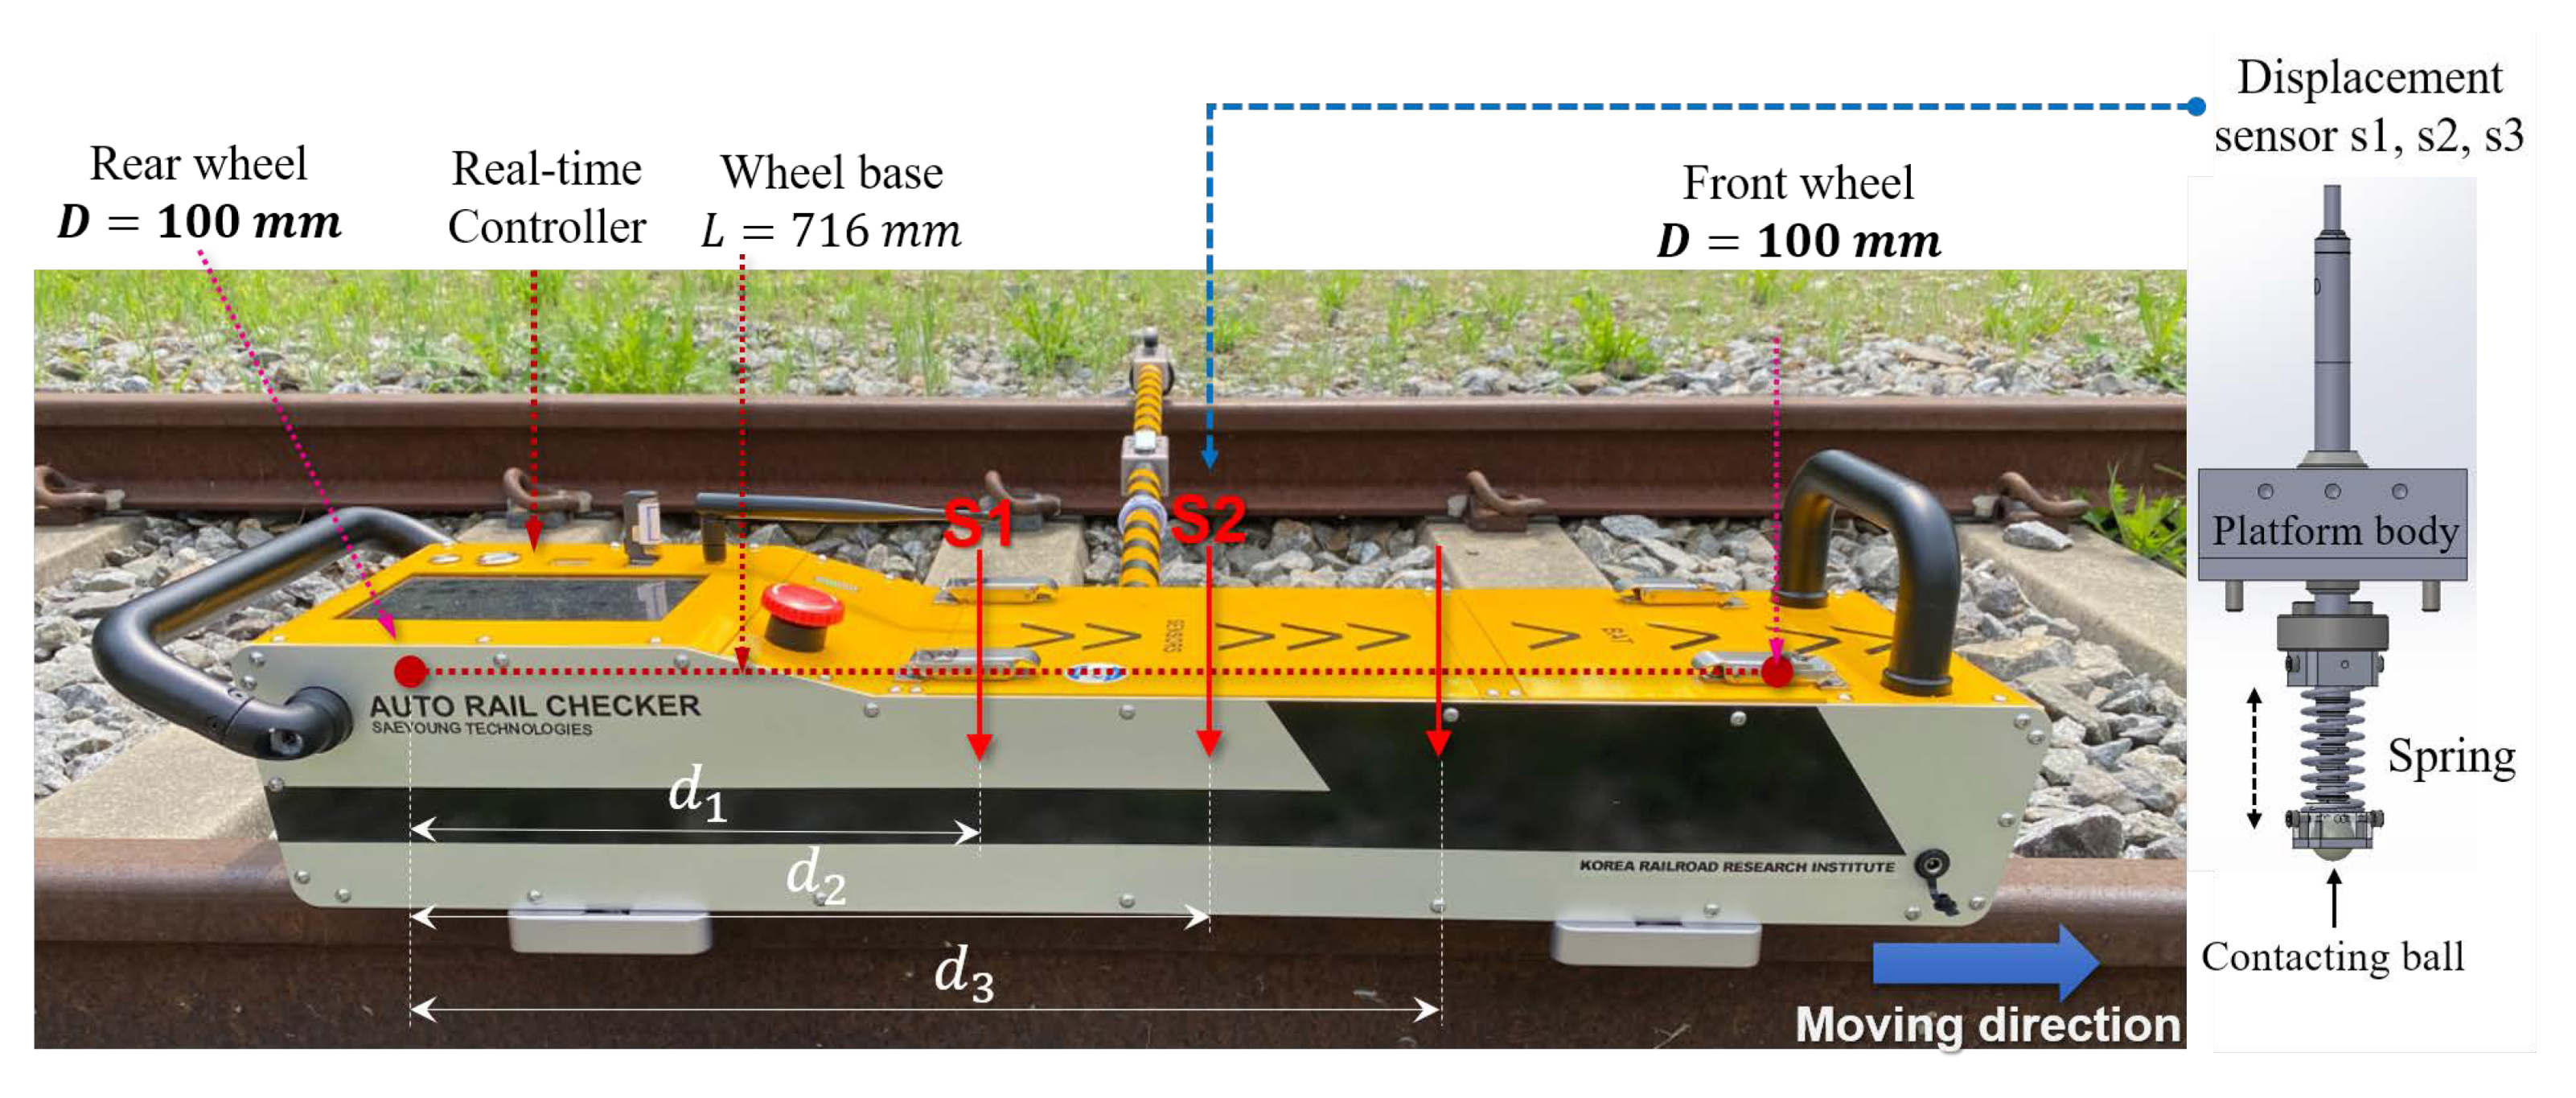
Differences in measured values were compared according to changes in the number of sensors by measuring the field track using the previously calculated optimal sensor positions. The rail surface roughness measuring system used for on-site measurement was the Auto Rail Checker (ARCer), which allows control of speed and automatic measurement, as shown in Figure 5. The ARCer used for measurement also features a brushless motor with an incremental encoder to measure distance, three LVDT sensors installed at movable positions, Li-Ion battery, and wireless data transmission functionality. The probe tip of the LVDT has been modified as shown in Figure 5 and curvature processing was applied as defined in the EN 15610:2009 standard [9]. The ARCer also has a platform with a wheelbase of 716 mm and front and rear driving wheels with diameters of 100 mm. The speed at the time of measurement was 0.5m/s. As shown in Figure 5, the ARCer is equipped with three sensors (S1, S2, and S3), and the sensor positions (, and ) are adjustable according to the measurement algorithm. It was used to measure rail surface roughness at curved section where corrugation was well developed along Seoul Metro lines. Two track locations with different corrugation wavelengths, section A and section B, were choosen for experiment. Each sensor position was used to repeatedly measure the same section using the optimal position for the number of sensors described above. Measurement and analysis showed that longitudinal rail surface roughness conformed to the EN 15610:2009 standard [9].
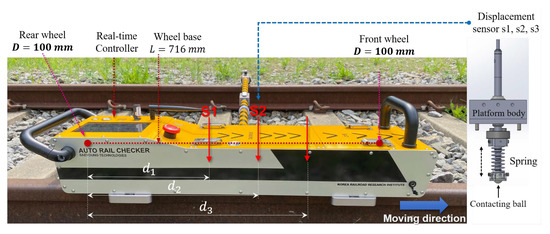
Figure 5.
Auto Rail Checker (ARCer) with multiple displacement sensors.
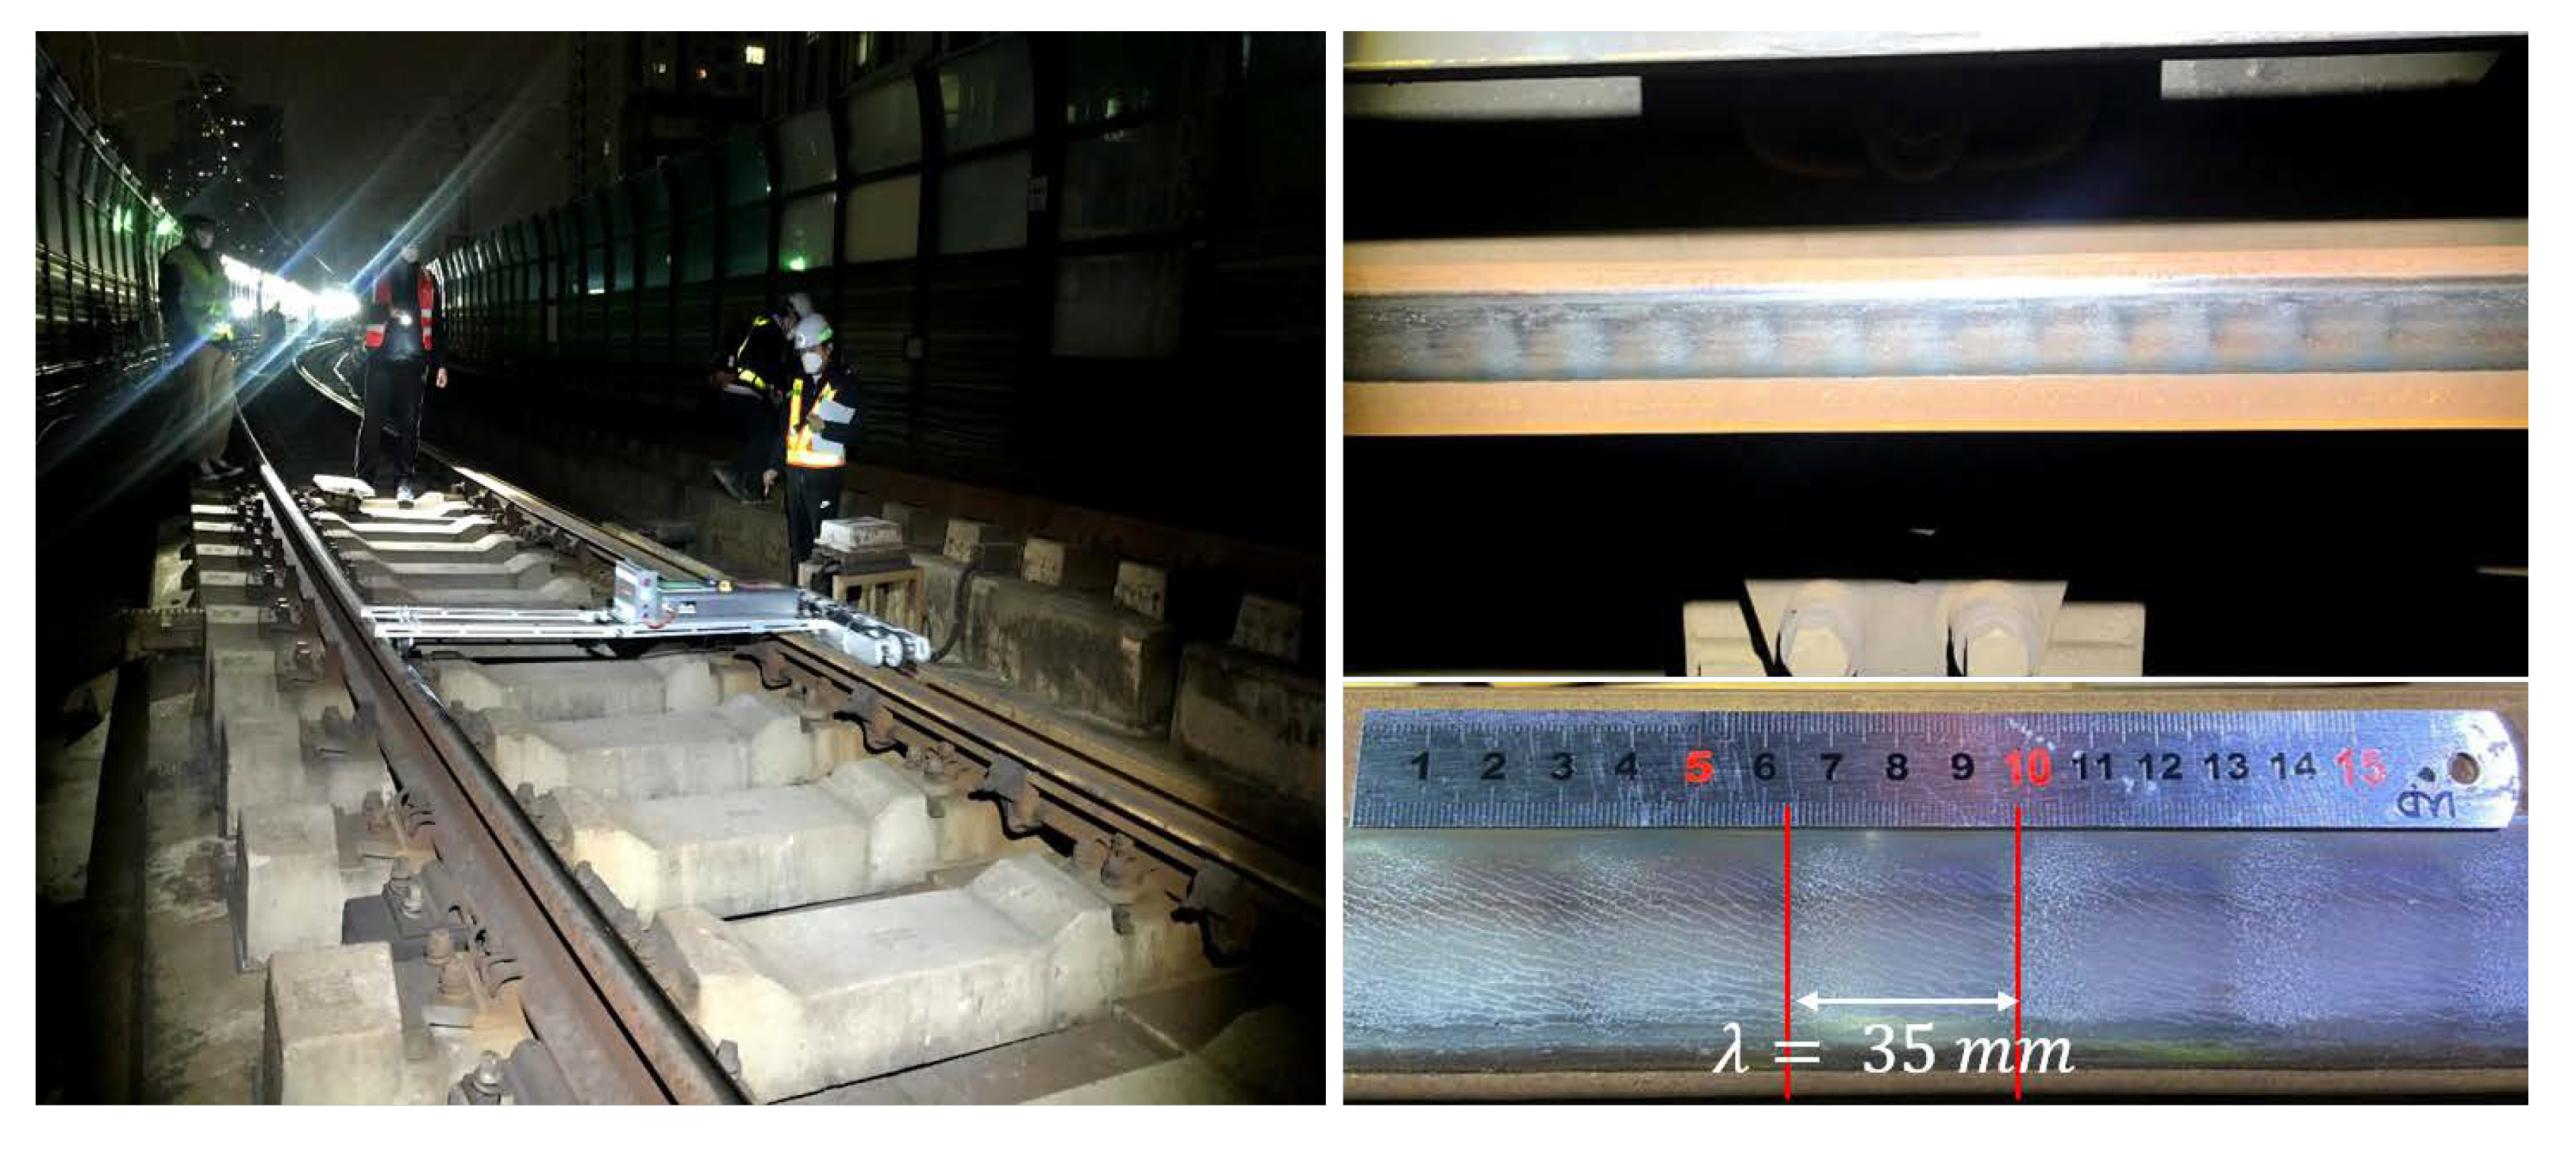
The subject of the field test was a curved section of a concrete sleeper track with a well-developing corrugation ( =350 mm), as shown in Figure 6. Three sections of the curved line were repeatedly measured with three sensors, two sensors, and one sensor using ARCer at 10-meter intervals. The optimal sensor positions used in the field experiment were = 222 mm, = 327 mm, and = 432 mm for three sensors and = 255 mm and = 380 mm for two sensors for comparison. When using one sensor, the center position of = 327 mm was used.
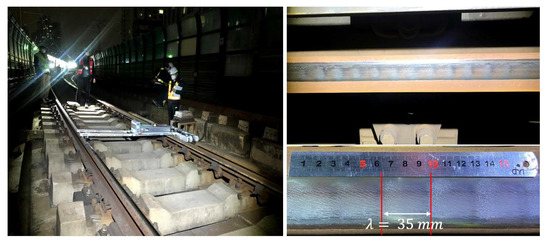
Figure 6.
Field|measurement of corrugated rail on curved section.
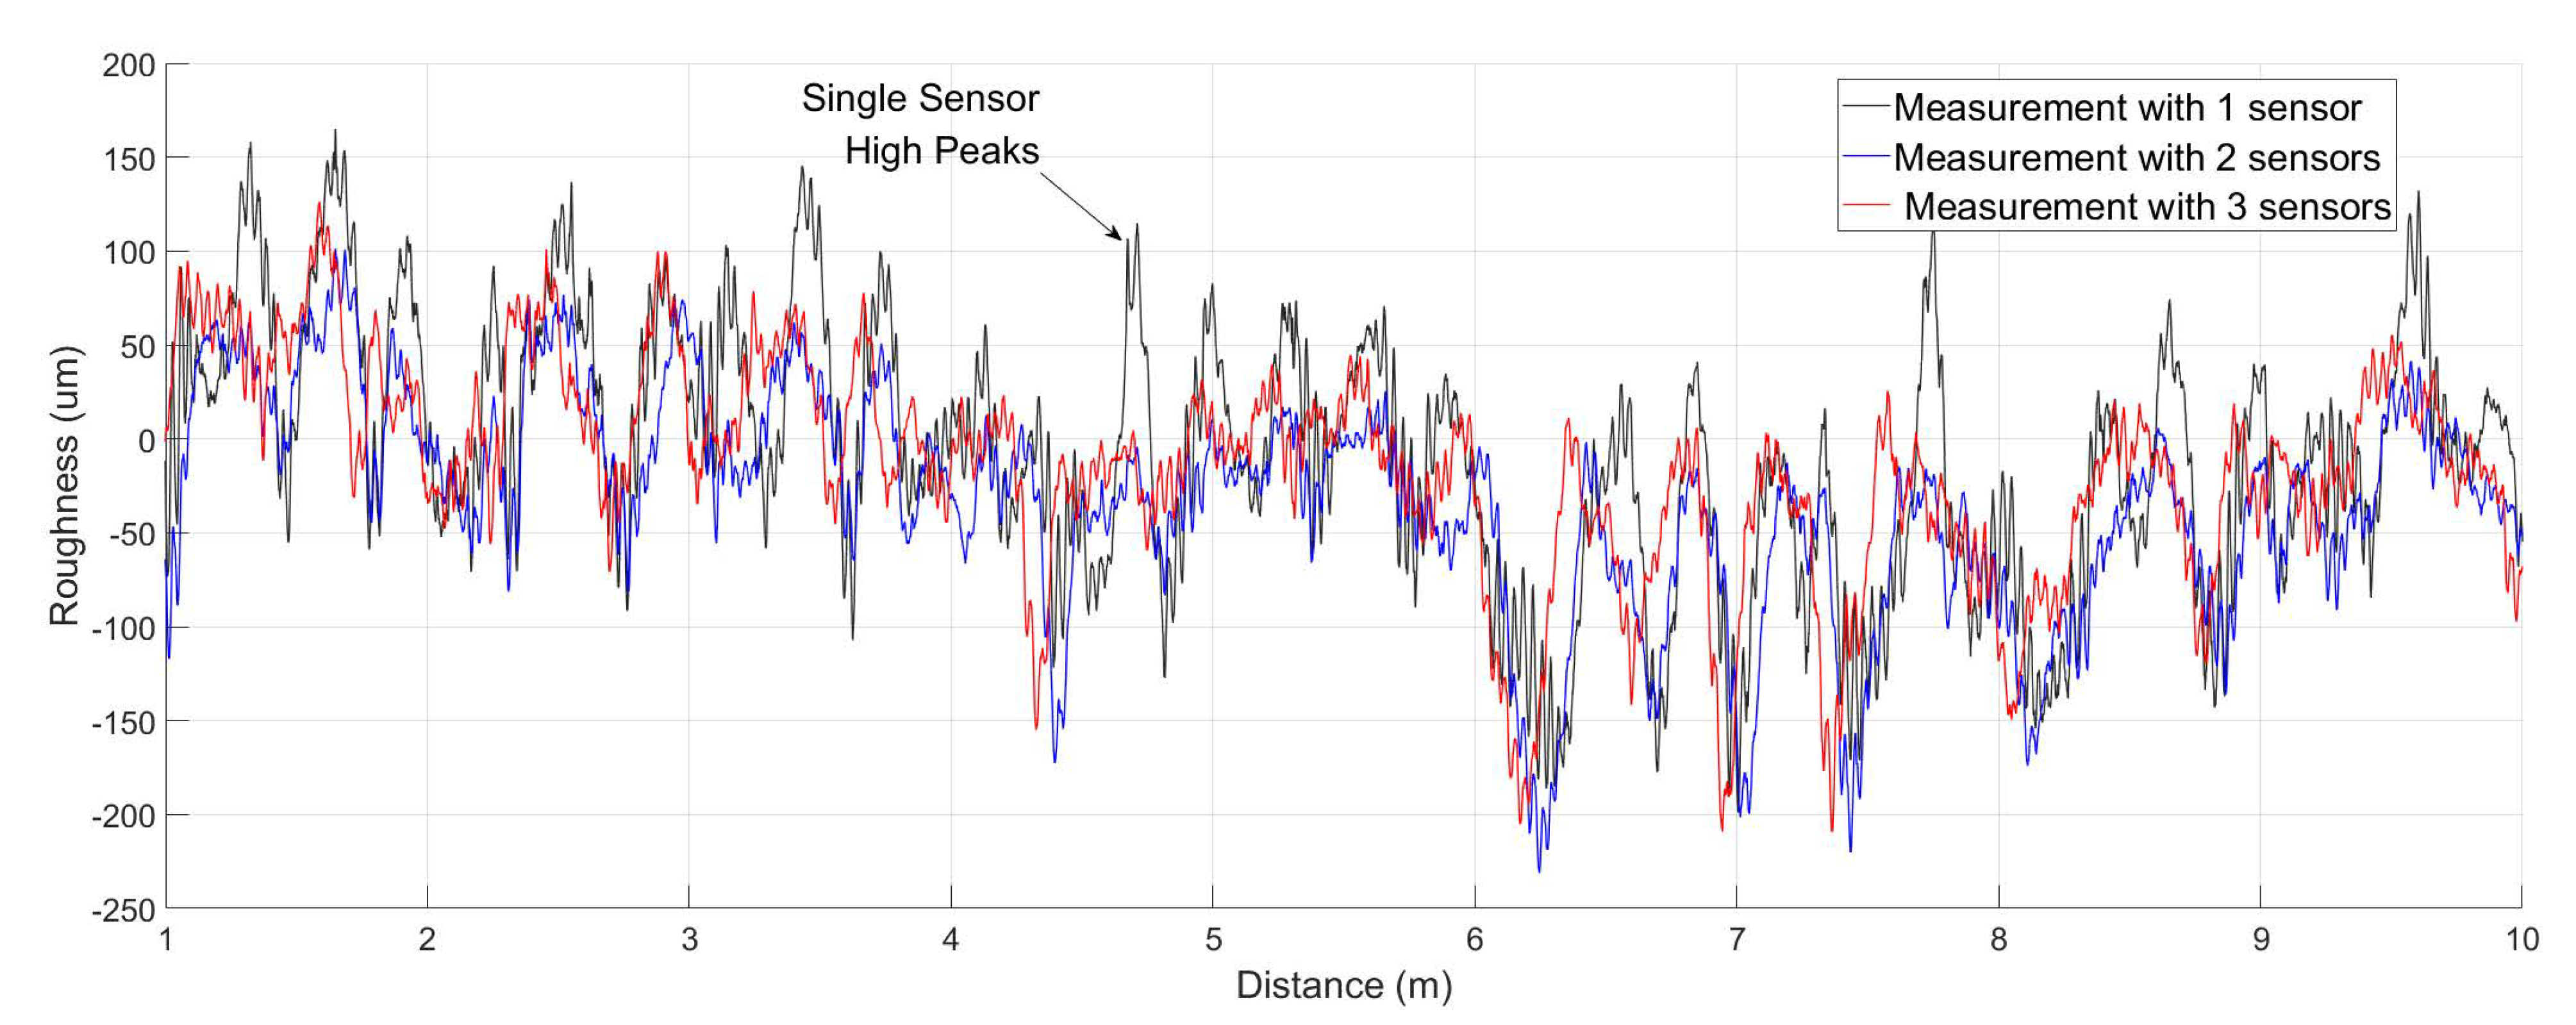
The roughness spectrum analysis was based on the displacement values of 1~9 m, excluding before and after the 1 meter measurement, which was the acceleration/deceleration section, based on the displacement values measured from each sensor. Figure 7 and Figure 8 show the comparison of the rail surface acoustic roughness levels obtained through the measured acoustic roughness values and frequency analysis for each number combination and position of the sensors. In the field test, measurements of two sections were compared for different points on the same track. The measured corrugation in the second section B rather than the first section A shows a broad wavelength band, as shown in Figure 8.

Figure 7.
Sensor measurement values of rail surface roughness at operational field track sections.
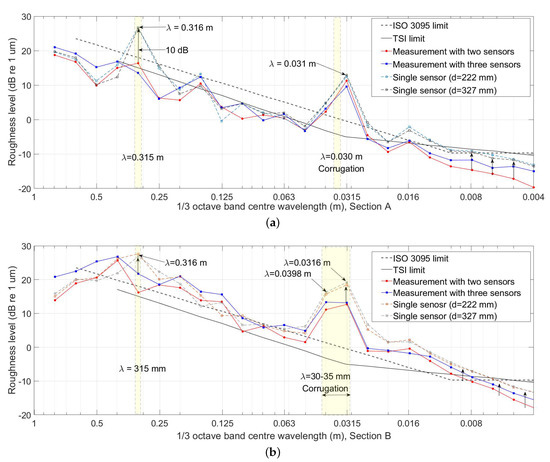
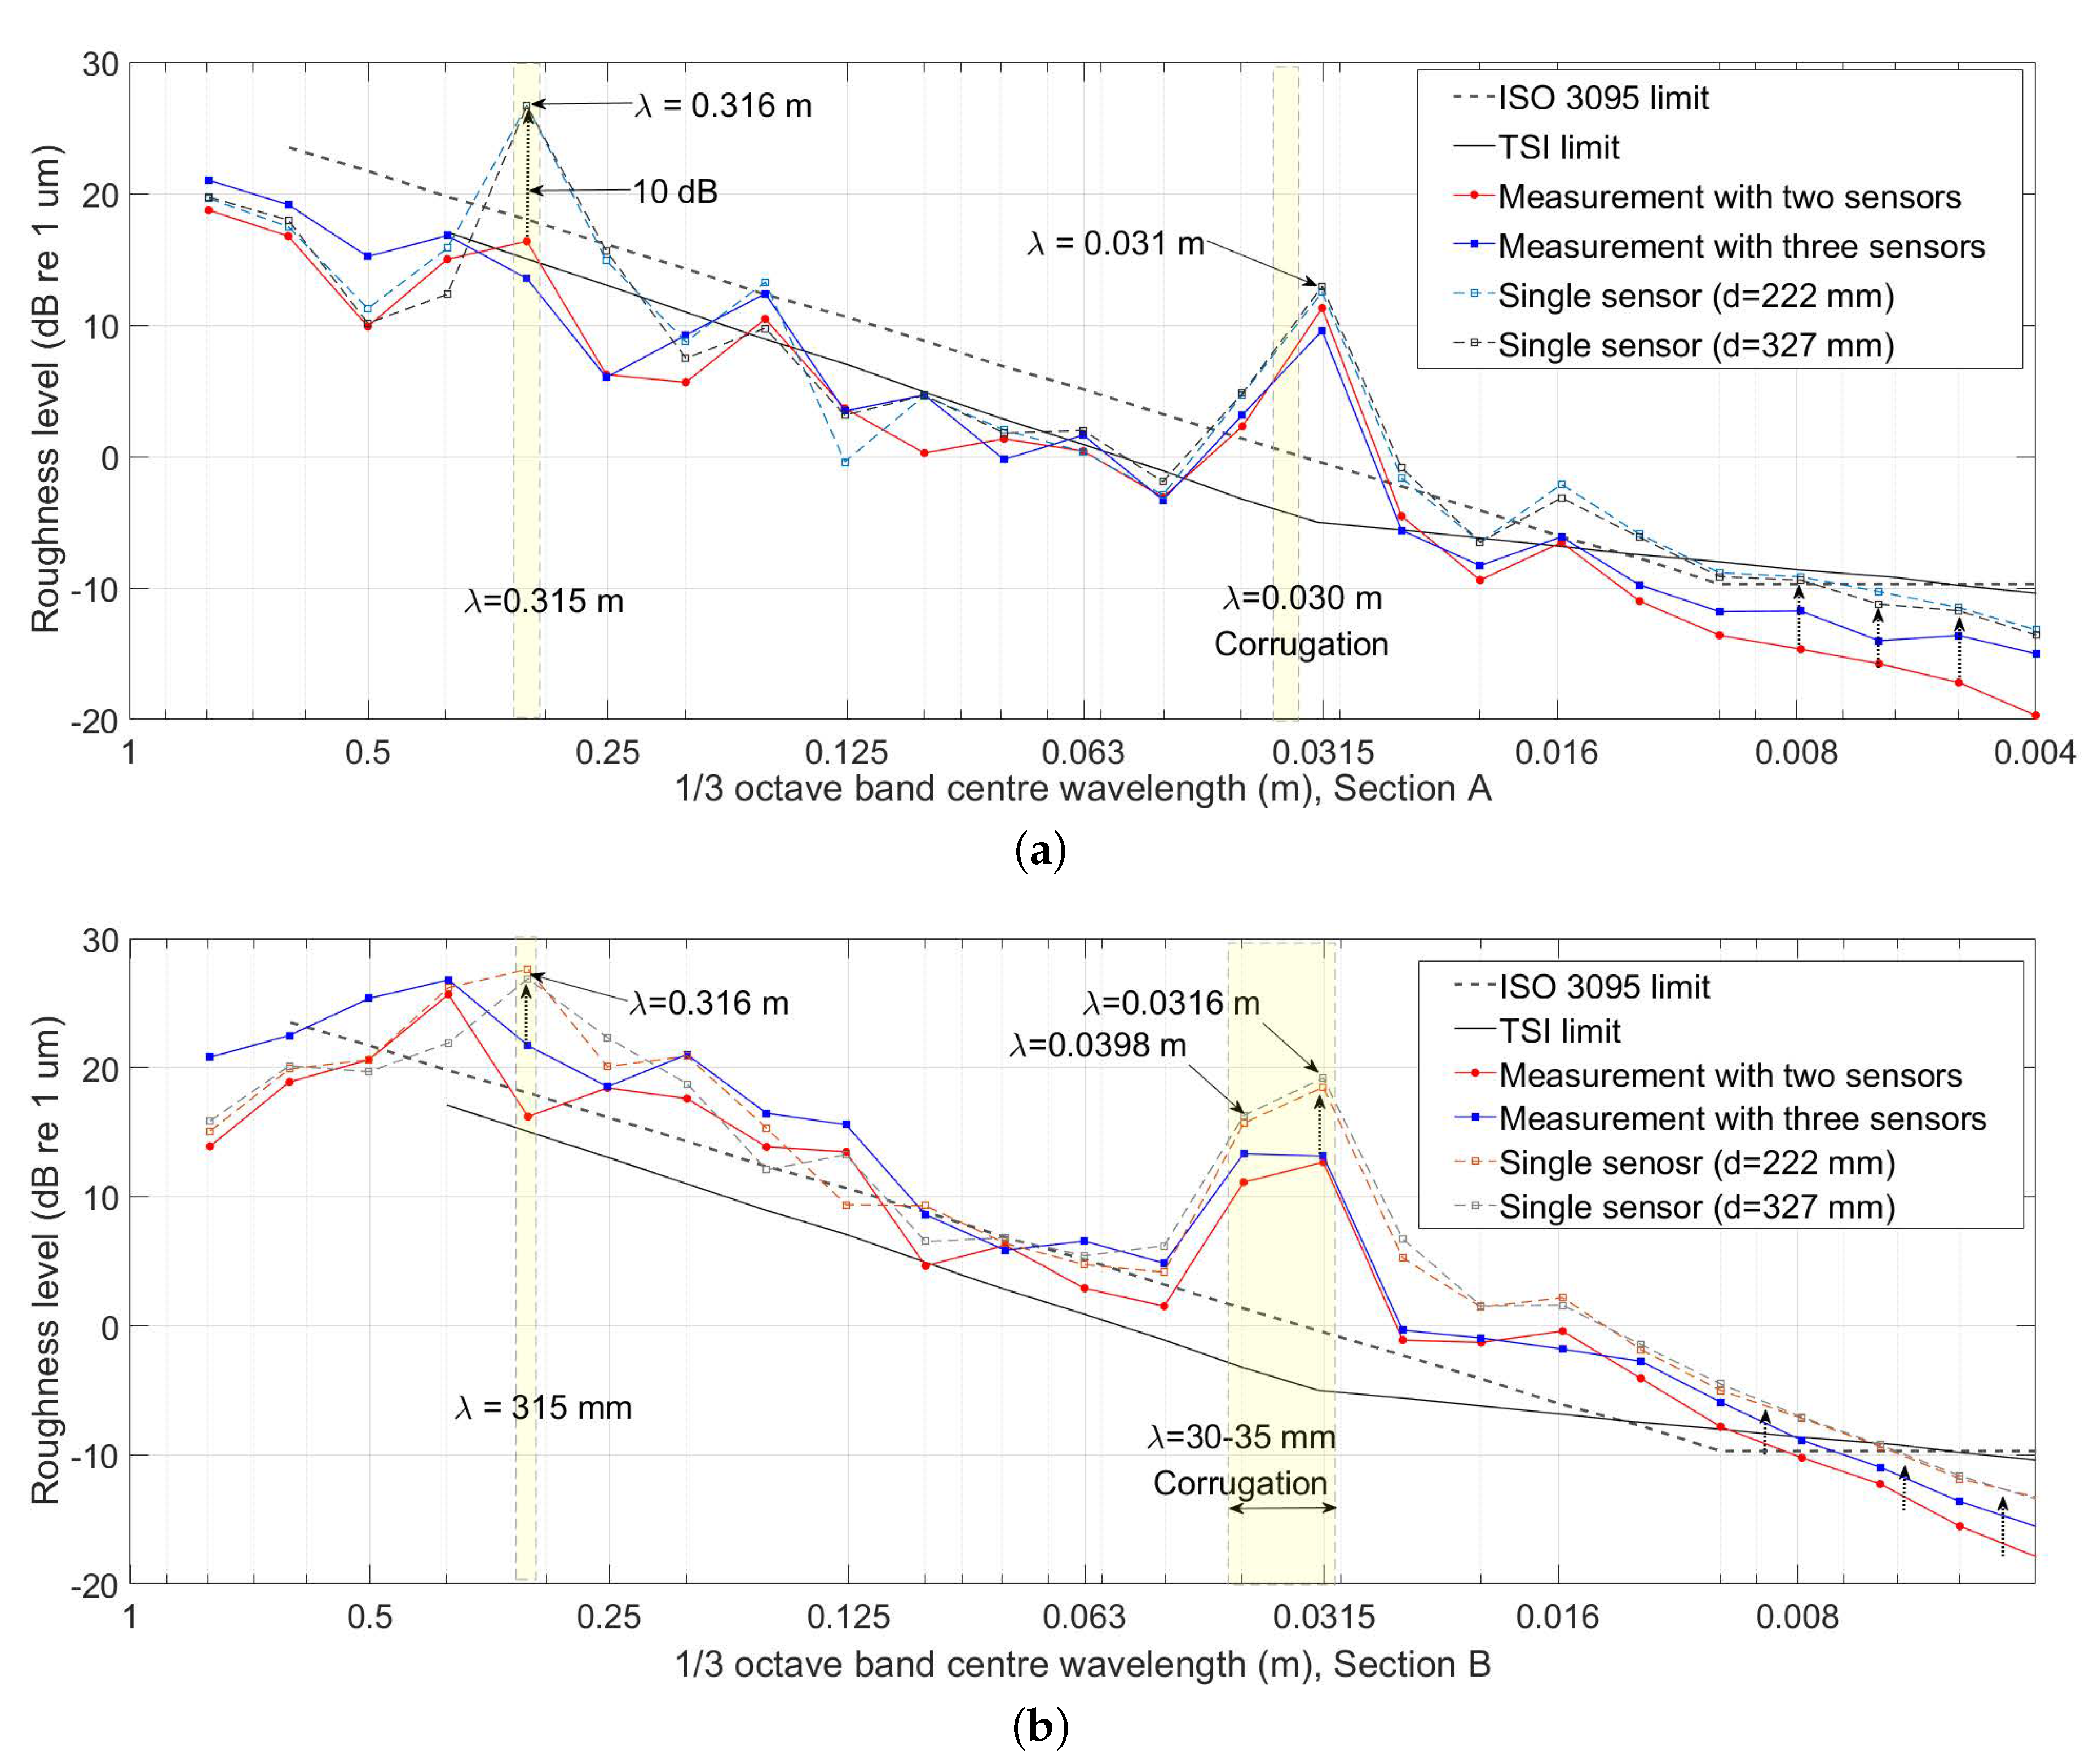
Figure 8.
Spectral analysis of longitudinal rail roughness in operational field track: (a) Section A, (b) Section B.
Although corrugation with a wavelength of 30~35 mm confirmed in Figure 8 appears regardless of the number of sensors used, using one sensor amplified the corrugation section, or the acoustic roughness level value showed a significant difference of at least 10 dB at the = 0.314 m wavelength, which was related to wheel diameter. Measurements using two sensors were lower than those using three sensors at relatively short wavelength regions.
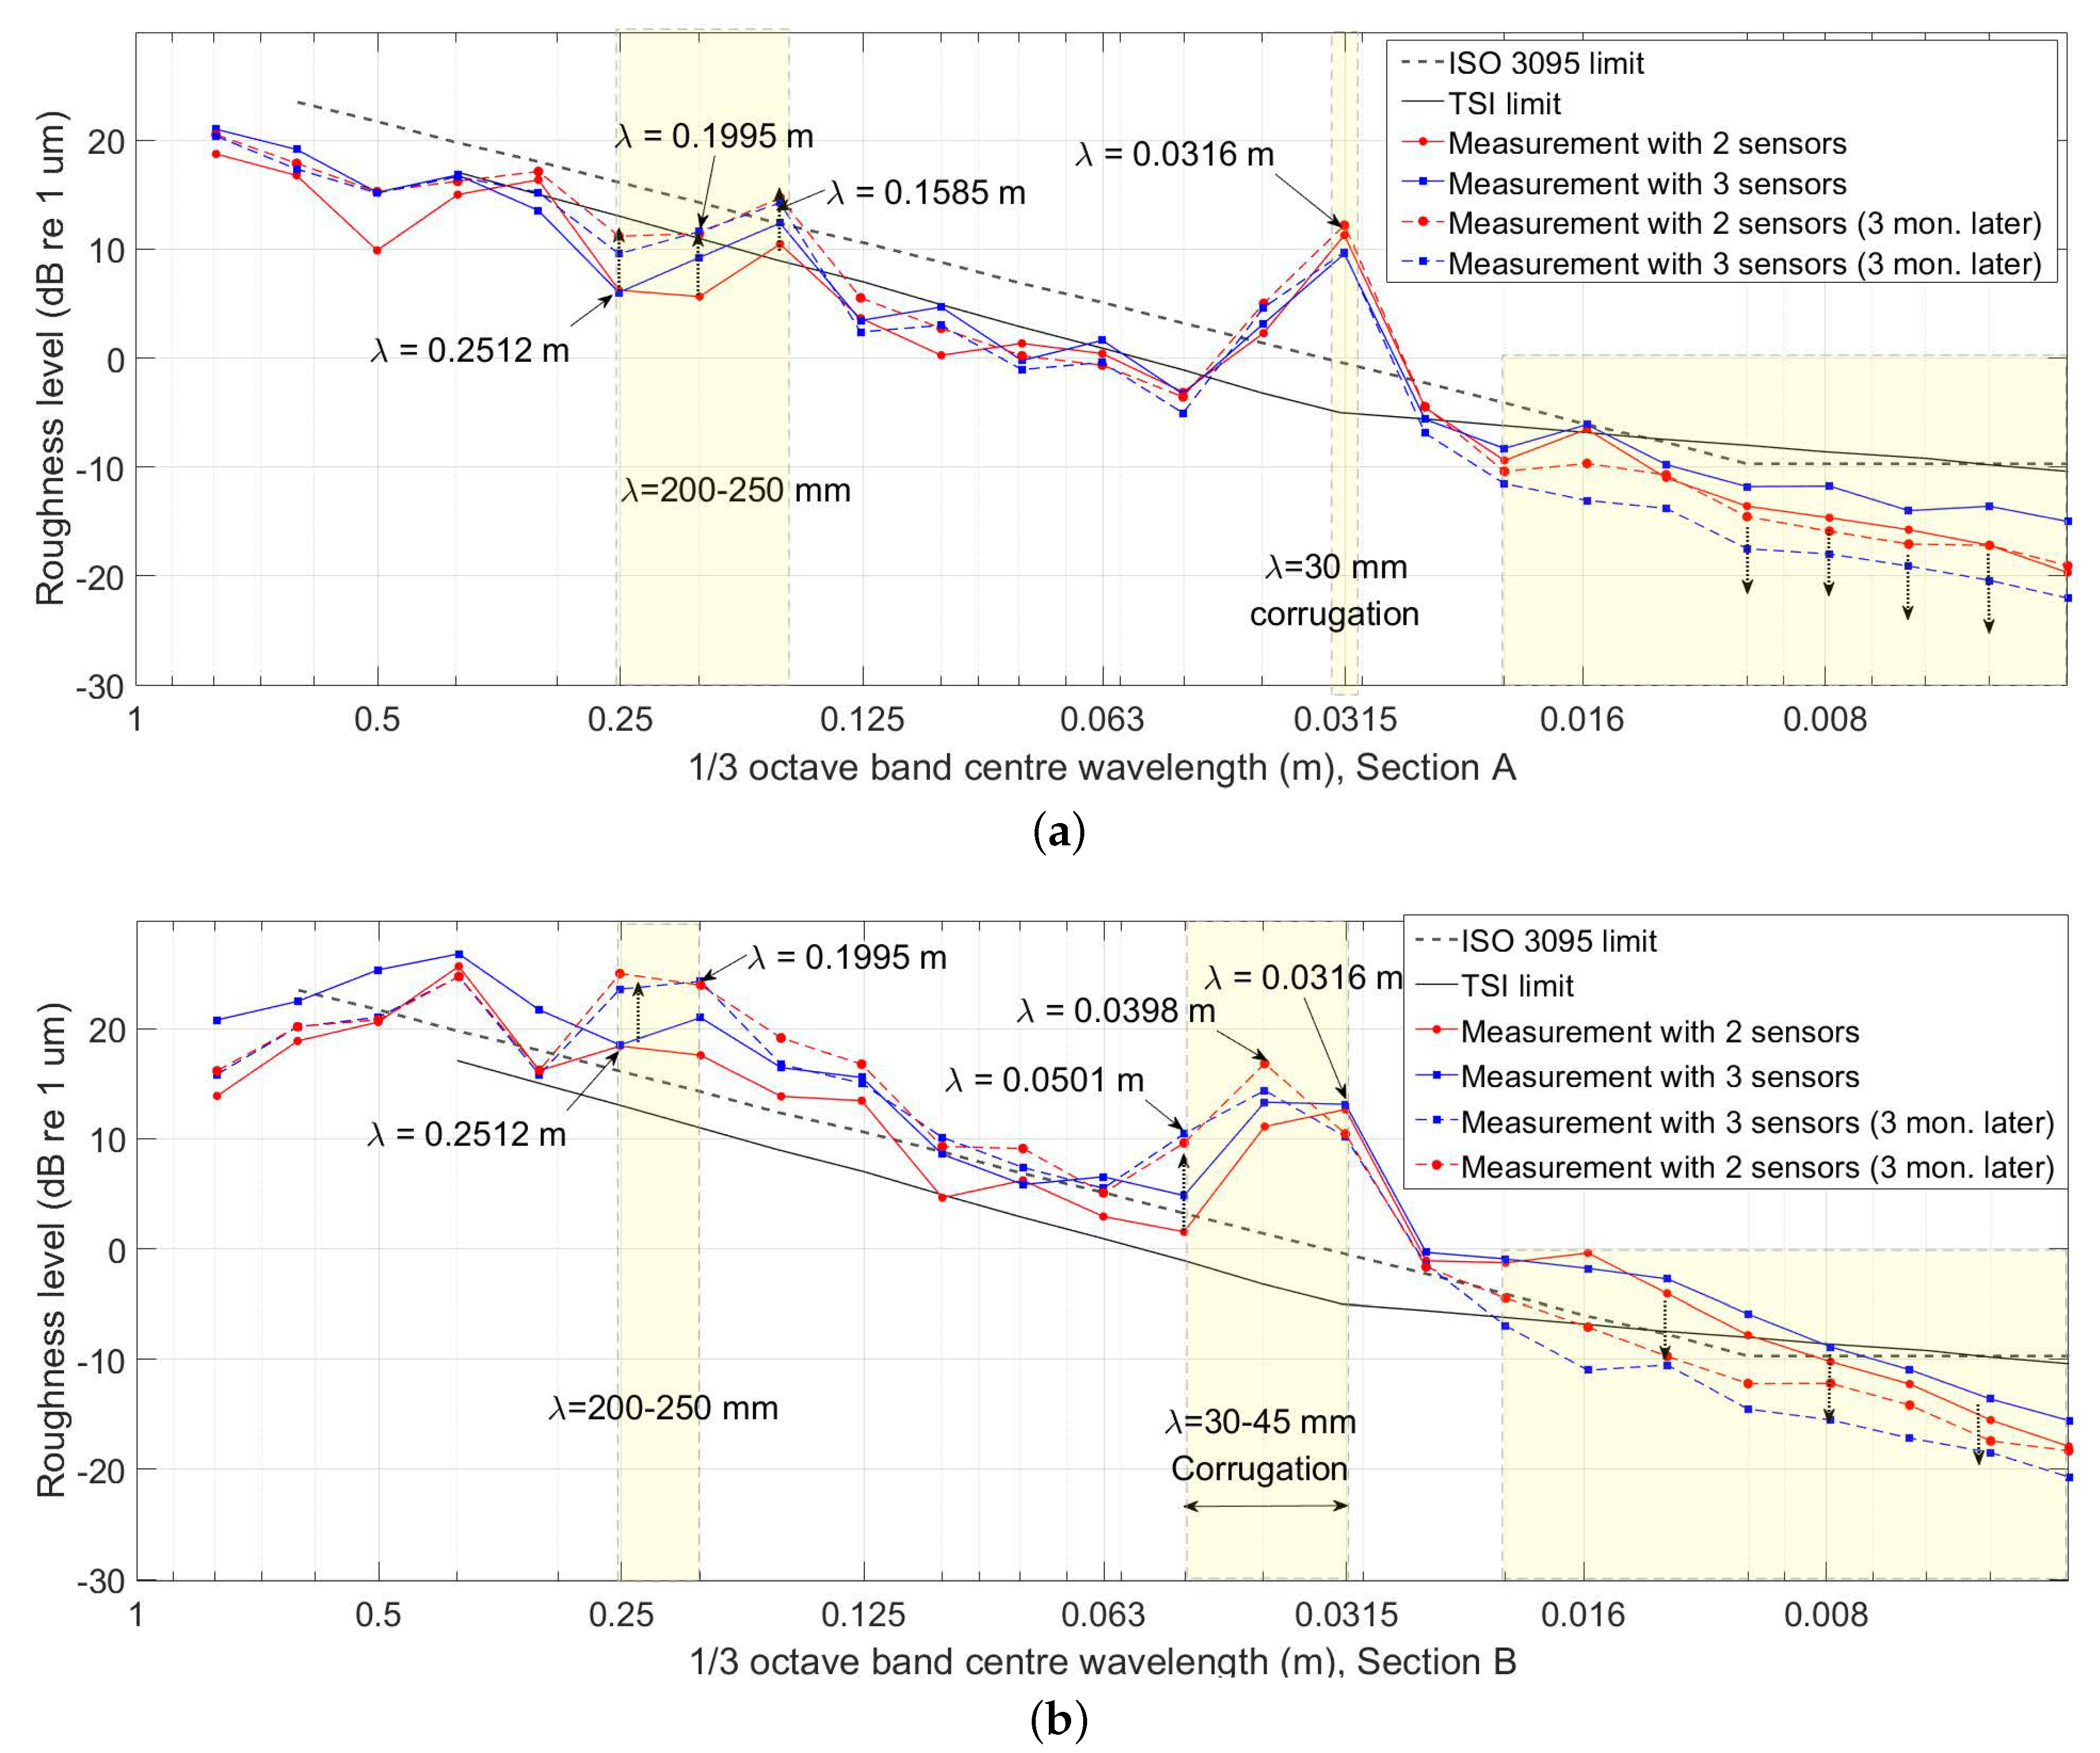
The spectrum of rail surface roughness was measured three months after initial measurement to observe any changes in rail surface corrugation due to train operations, as shown in Figure 9. When using two and three sensors, the sensor positions shown in Table 1 were used as in the previous measurement, while single-sensor measurements were not used as there were many cases of distortion, as shown in Figure 8.
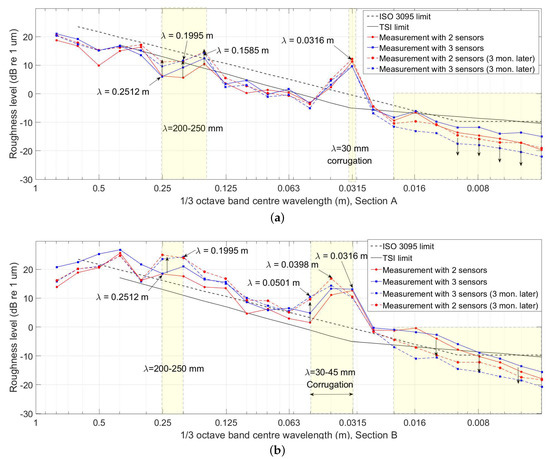
Figure 9.
Spectralum changes in railhead roughness on operational field track over 3 month period: (a) Section A, (b) Section B.
The measurement results show that surface spectral size due to train operations decreases in the relatively short wavelength band in both sections while the spectral size increases in some long wavelength bands ( = 200~250 mm). Of particular note is the large change in the spectral magnitude of short wavelengths in three-sensor measurement. Corrugation with a wavelength of 30 mm slightly increases in Section A, while the relatively wide band of corrugation expanded even more in Section B. The measured values of Section A and Section B over time show an increasing spectrum of the 200~250 mm wavelength region, but with no large difference in measured values with different numbers of sensors.
In conclusion, using a single sensor when measuring rail corrugation generates an excessively amplified wavelength domain. Using three sensors in a short wavelength domain of 10 mm or less shows a somewhat higher spectral size than when using two sensors.
4. Conclusions
In this study, surface roughness and spectrum level value were measured accurately by optimizing the positions of multiple sensors on a measurement system designed to measure acoustic roughness. Furthermore, the measured values were analyzed as they varied by the number of sensors used. In particular, wavelength regions that are excessively amplified when using a single sensor were measured and confirmed in sections where corrugation was developing along currently running tracks. Development of and changes to corrugation over time were checked by measuring the same track sections after an interval of three months. We have found that the wavelength range of corrugation became wide over time. Using two optimized measuring sensors resulted in lower spectral values than using three sensors in a relatively short wavelength range of 10 mm or less. Although spectral size in the very short wavelength range may appear slightly different according to the diameter of the sensor’s tip used in measurement, it is necessary to adjust the measured values of the short wavelength region as the number of sensors used in measurement varies.
As a result, even if the number of sensors is reduced, using one sensor to measure may result in a large number of distortions, making accurate correction difficult. Therefore, it was confirmed that the correction that two or more sensors provide is essential for measurement systems using a displacement sensor on a moving platform, and it is necessary to correct in the short wavelength band when using two or more sensors. Confirming the minimum number of sensors that is optimal for the automatic rail acoustic roughness system (ARCer) is expected to be applicable to other measuring systems for similar purposes.
Funding
This research was supported by a grant (21CTAP-C163589-01) from Ministry of Land, Infrastructure and Transport and the R&D program of the Korea Railroad Research Institute, Republic of Korea.
Conflicts of Interest
The author declares no conflict of interest.
References
- Lewis, T.D.; Neild, S.A.; Gong, C.; Iwnicki, S.D. Using an inerter-based suspension to improve both passenger comfort and track wear in railway vehicles. Veh. Syst. Dyn. 2020, 58, 472–493. [Google Scholar] [CrossRef]
- Song, Y.; Wang, Z.; Liu, Z.; Wang, R. A spatial coupling model to study dynamic performance of pantograph-catenary with vehicle-track excitation. Mech. Syst. Signal Process. 2021, 151, 107–336. [Google Scholar]
- Grassie, S.L.; Kalouseck, J. Rail corrugation: Characteristics, causes and treatments. Proc. Inst. Mech. Eng. Part J. Rail Rapid Transit 1993, 207, 57–68. [Google Scholar] [CrossRef]
- Thompson, D.; Jones, C. A review of the modelling of wheel/rail noise generation. J. Sound Vib. 2000, 231, 519–536. [Google Scholar] [CrossRef]
- Thompson, D. Railway Noise and Vibration: Mechanisms, Modelling and Means of Control; Elsevier: Amsterdam, The Netherlands, 2008. [Google Scholar]
- Thompson, D. On the relationship between wheel and rail surface roughness and rolling noise. J. Sound Vib. 1996, 193, 149–160. [Google Scholar] [CrossRef]
- Han, J.; Xiao, X.; Wu, Y.; Wen, Z.; Zhao, G. Effect of rail corrugation on metro interior noise and its control. Appl. Acoust. 2018, 130, 63–70. [Google Scholar] [CrossRef]
- ISO 3095: 2013 Acoustics-Railway Applications-Measurement of Noise Emitted by Railbound Vehicles. Available online: https://www.iso.org/standard/55726.html (accessed on 26 August 2021).
- BS EN 15610:2019 Railway Applications. Acoustics. Rail and Wheel Roughness Measurement Related to Noise Generation. Available online: https://shop.bsigroup.com/ProductDetail/?pid=000000000030304302 (accessed on 26 August 2021).
- BS EN 13231-3:2012 Railway Applications-Track-Acceptance of Works, Part 3; Acceptance of Reprofiling Rails in Track. Available online: https://shop.bsigroup.com/ProductDetail/?pid=000000000030209366 (accessed on 26 August 2021).
- Grassie, S.L. Rail corrugation: Advances in measurement, understanding and treatment. Wear 2005, 2, 1224–1234. [Google Scholar] [CrossRef]
- Verheijen, E. A survey on roughness measurements. J. Sound Vib. 2006, 293, 784–794. [Google Scholar] [CrossRef]
- Jeong, W.; Jeon, S.; Jeong, D.; Choi, H. Effect of design variables of rail surface measuring device on acoustic roughness and spectral analysis. J. Korean Soc. Railway 2017, 20, 440–447. [Google Scholar] [CrossRef]
- Jeong, D.; Choi, H.S.; Choi, Y.J.; Jeong, W. Measuring Acoustic Roughness of a Longitudinal Railhead Profile Using a Multi-Sensor Integration Technique. Sensors 2019, 19, 1610. [Google Scholar] [CrossRef] [PubMed] [Green Version]
- Grassie, S.L. Measurement of railhead longitudinal profiles: A comparison of different techniques. Wear 1996, 191, 245–251. [Google Scholar] [CrossRef]
- Diehl, R.; Holm, P. Roughness measurements have the necessities changed? J. Sound Vib. 2006, 293, 777–783. [Google Scholar] [CrossRef]
- Tanaka, H.; Shimizu, A. Practical application of portable trolley for the continuous measurement of rail surface roughness for rail corrugation maintenance. Q. Rep. RTRI 2016, 57, 118–124. [Google Scholar] [CrossRef] [Green Version]

Publisher’s Note: MDPI stays neutral with regard to jurisdictional claims in published maps and institutional affiliations. |
© 2021 by the author. Licensee MDPI, Basel, Switzerland. This article is an open access article distributed under the terms and conditions of the Creative Commons Attribution (CC BY) license (https://creativecommons.org/licenses/by/4.0/).