
Methodology to Assess Sustainable Mobility in LATAM Cities

 ,
,  ,
,  ,
,  and
and
Abstract
:1. Introduction

| Reference | Index | Study Objective | Criteria | Indicators | Region | |
|---|---|---|---|---|---|---|
| [9] | Impact Mobility Index | Connection between urban expansion and environmental costs | (1) Geographical variables (2) Socio-economic variables | (3) Morphology (4) Accessibility and transport efficiency | 18 | Italy |
| [10] | Sampling Mobility Index | Mobility for medium-size cities urban centers | (1) Pedestrians (2) Motor vehicles | (3) Cycling | 8 | Brazil |
| [11] | Sustainable Urban Mobility Index (IMUS) | Mobility Planning and management supporting tool | (1) Accessibility (2) Environmental Aspects (3) Social Aspects (4) Political Aspects (5) Transportation infrastructure (6) Non-motorized modes | (7) Integrated planning (8) Urban circulation and traffic (9) Urban transport system | 87 | Brazil |
| [12] | Sustainable Urban Mobility Index (IMS) | Evaluate the impact of mobility on the sustainability of the city | (1) Social (2) Economic | (3) Environment | 10 | Brazil |
| [13] | Normalized Transport Sustainability Index | Cluster policies of sustainable mobility | (1) Budget (2) Planning and land-use (3) Safety | (4) Time (5) Health and environment (6) Social | 24 | Europe |
| [14] | Composite Sustainability Index (CSI) tool | Evaluate transportation and land use alternatives | (1) Environmental Sustainability (2) Socio-cultural sustainability | (3) Transport system effectiveness (4) Economic sustainability | 30 | US |
| [15] | Urban Sustainable Transportation Indicators | For global comparison based on UITP database | (1) Environmental (2) Economical | (3) Social | 9 | World |
| [16] | Urban Core Index (UCI) | Standardize classification of urban and suburban census tracts | (1) Urban Census | 3 | Canada | |
| [17] | Transport Sustainability Index | Obtaining a composite transport sustainability index for Australia | (1) Environmental (2) Social | (3) Economical | 9 | Australia |
| [18] | Urban mobility index (UMI) | Introduction of an urban mobility measure using a point system | (1) Correlated with the percentage of daily trips of private motorized modes | 19 | US and Hong Kong | |
| [8] | Synthetic Indicator of Smart Mobility (SMI) | Construction of a Synthetic Indicator of Urban Mobility | (1) Public transport (2) Cycle lanes (3) Bike-sharing (4) Car sharing (5) Private mobility support system | (6) Public transport support system | 18 | Italy |
| [19] | Smart Mobility Index | benchmarking cities in accordance with the smartness of their transportation systems | (1) Sustainability: - Social transportation - Environmental - Economic | (2) Innovation: - Technological | 16 | Spain |
| [20] | Sustainable Mobility Efficiency Index (SMEI) | Enhancing the Sustainable Urban Mobility in Greek Cities | (1) Accessibility and operation of the transport system (2) Environment | (3) Society (4) Economy (5) Transport system quality | 15 | Greece |
| Reference | Index | Study Objective | Criteria | Indicators | Region | ||
|---|---|---|---|---|---|---|---|
| Government/Organization | [25] | Sustainable Mobility Project 2.0 (SMP2.0) | Evaluate the current situation of the mobility system, understand the evolution of the system over time, and to evaluate the potential impact of selected solutions | (1) Global environment (2) Quality of life | (3) Economic success (4) Mobility system performance | 19 | World |
| [32] | Sustainable Urban Mobility Indicators (SUMI) | Standardize mobility evaluation and measure improvements from policies in EU cities | (1) Core indicators | (2) Non-core indicators | 18 | Europe | |
| [26] | Sustainable Urban Transport Index (SUTI) | Assess urban transport systems and services | (1) Planning (2) Access (3) Safety | (4) Quality and reliability (5) Affordability (6) Emissions | 10 | Asia | |
| Private company | [27] | Mobility in cities database | Provide a database of transport patterns and trends for 60+ metropolitan areas worldwide | (1) Demography (2) The economy (3) Urban structure(4) Number and use of private vehicles | (5) The road network (6) Public transport networks (7) Mobility patterns | 120 | World |
| [28] | Urban Mobility Index | establish which transportation solutions are the closest to becoming emissions-free | (1) Status Quo (2) Conditions for Change | (3) Preparedness for Future | 20 | World | |
| [29] | Arthur D. Little Urban Mobility Index 3.0 | Assess the mobility maturity, innovativeness andperformance of 100+ cities worldwide | (1) Maturity (2) Innovation | (3) Performance | 27 | World | |
| [30] | Urban Mobility Index | Private assessment of mobility and solutions | (1) Connectivity (2) Sustainability | (3) Affordability (4) Innovation | 9 | World | |
| [31] | Deloitte CityMobility Index (DCMI) | Explore what mobility could be in a smart, economically vibrant city. | (1) Performance and resilience (2) Vision and leadership | (3) Service and inclusion | 82 | World | |
2. Methodology
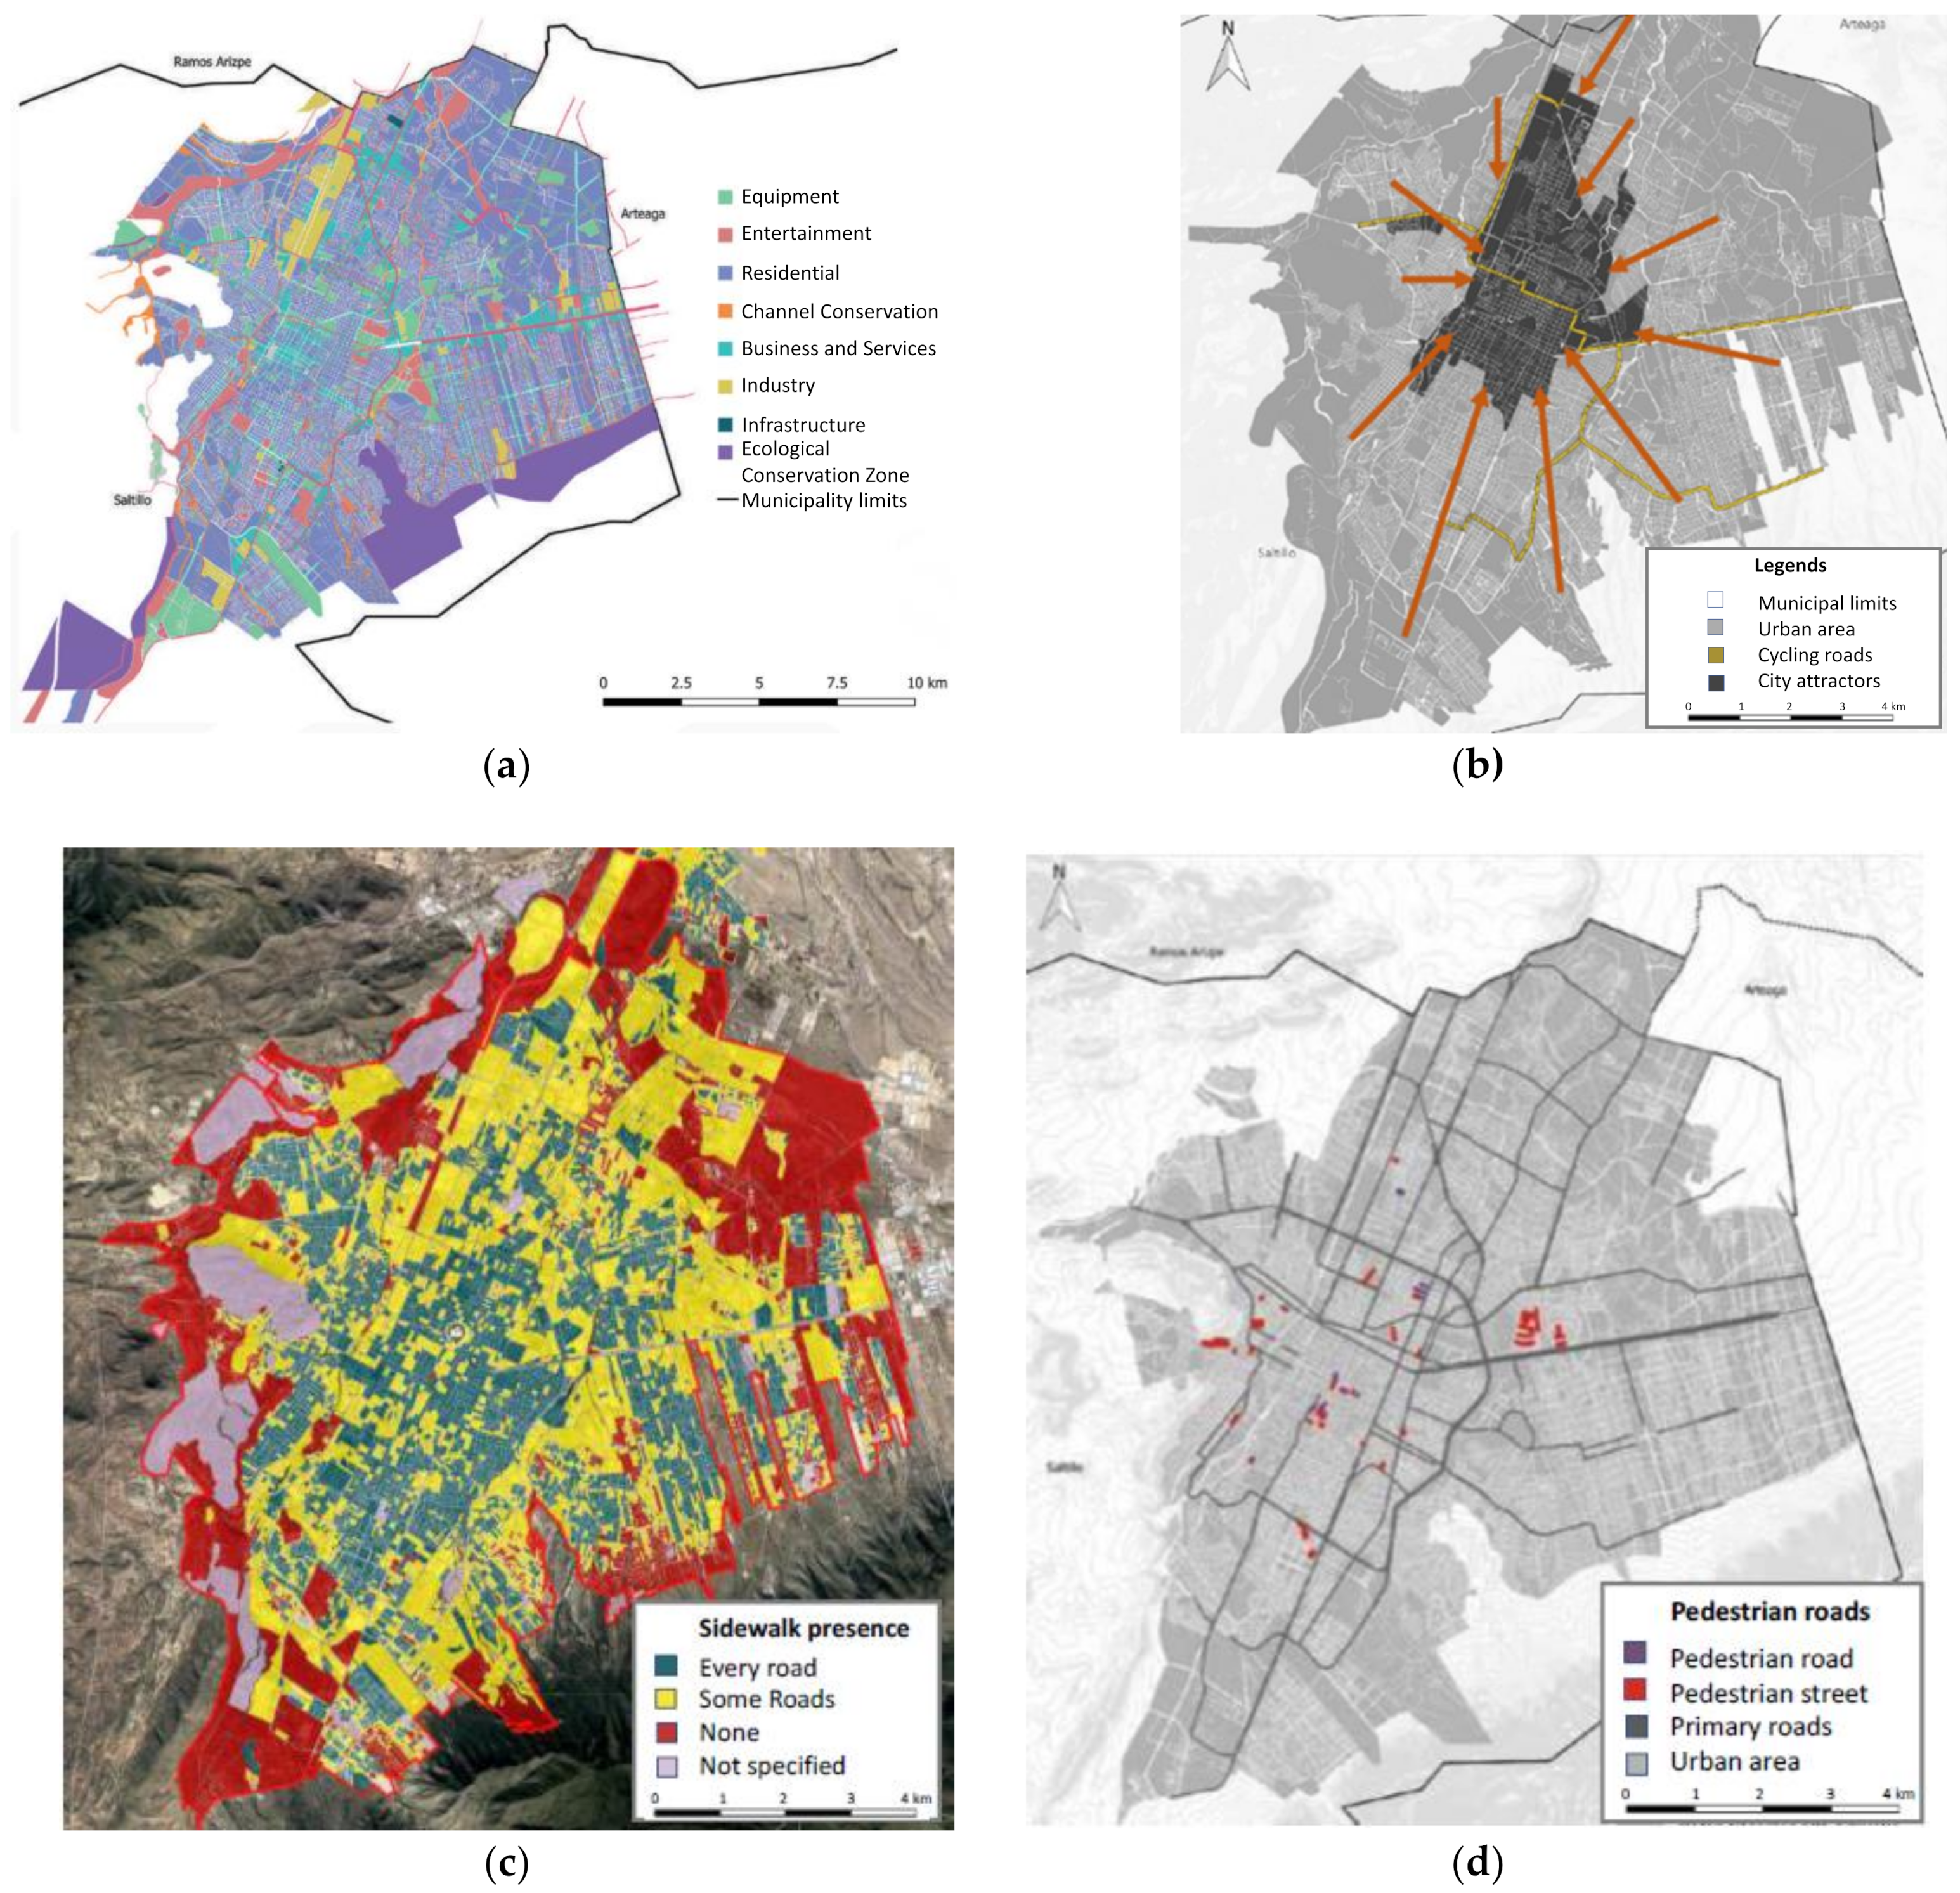
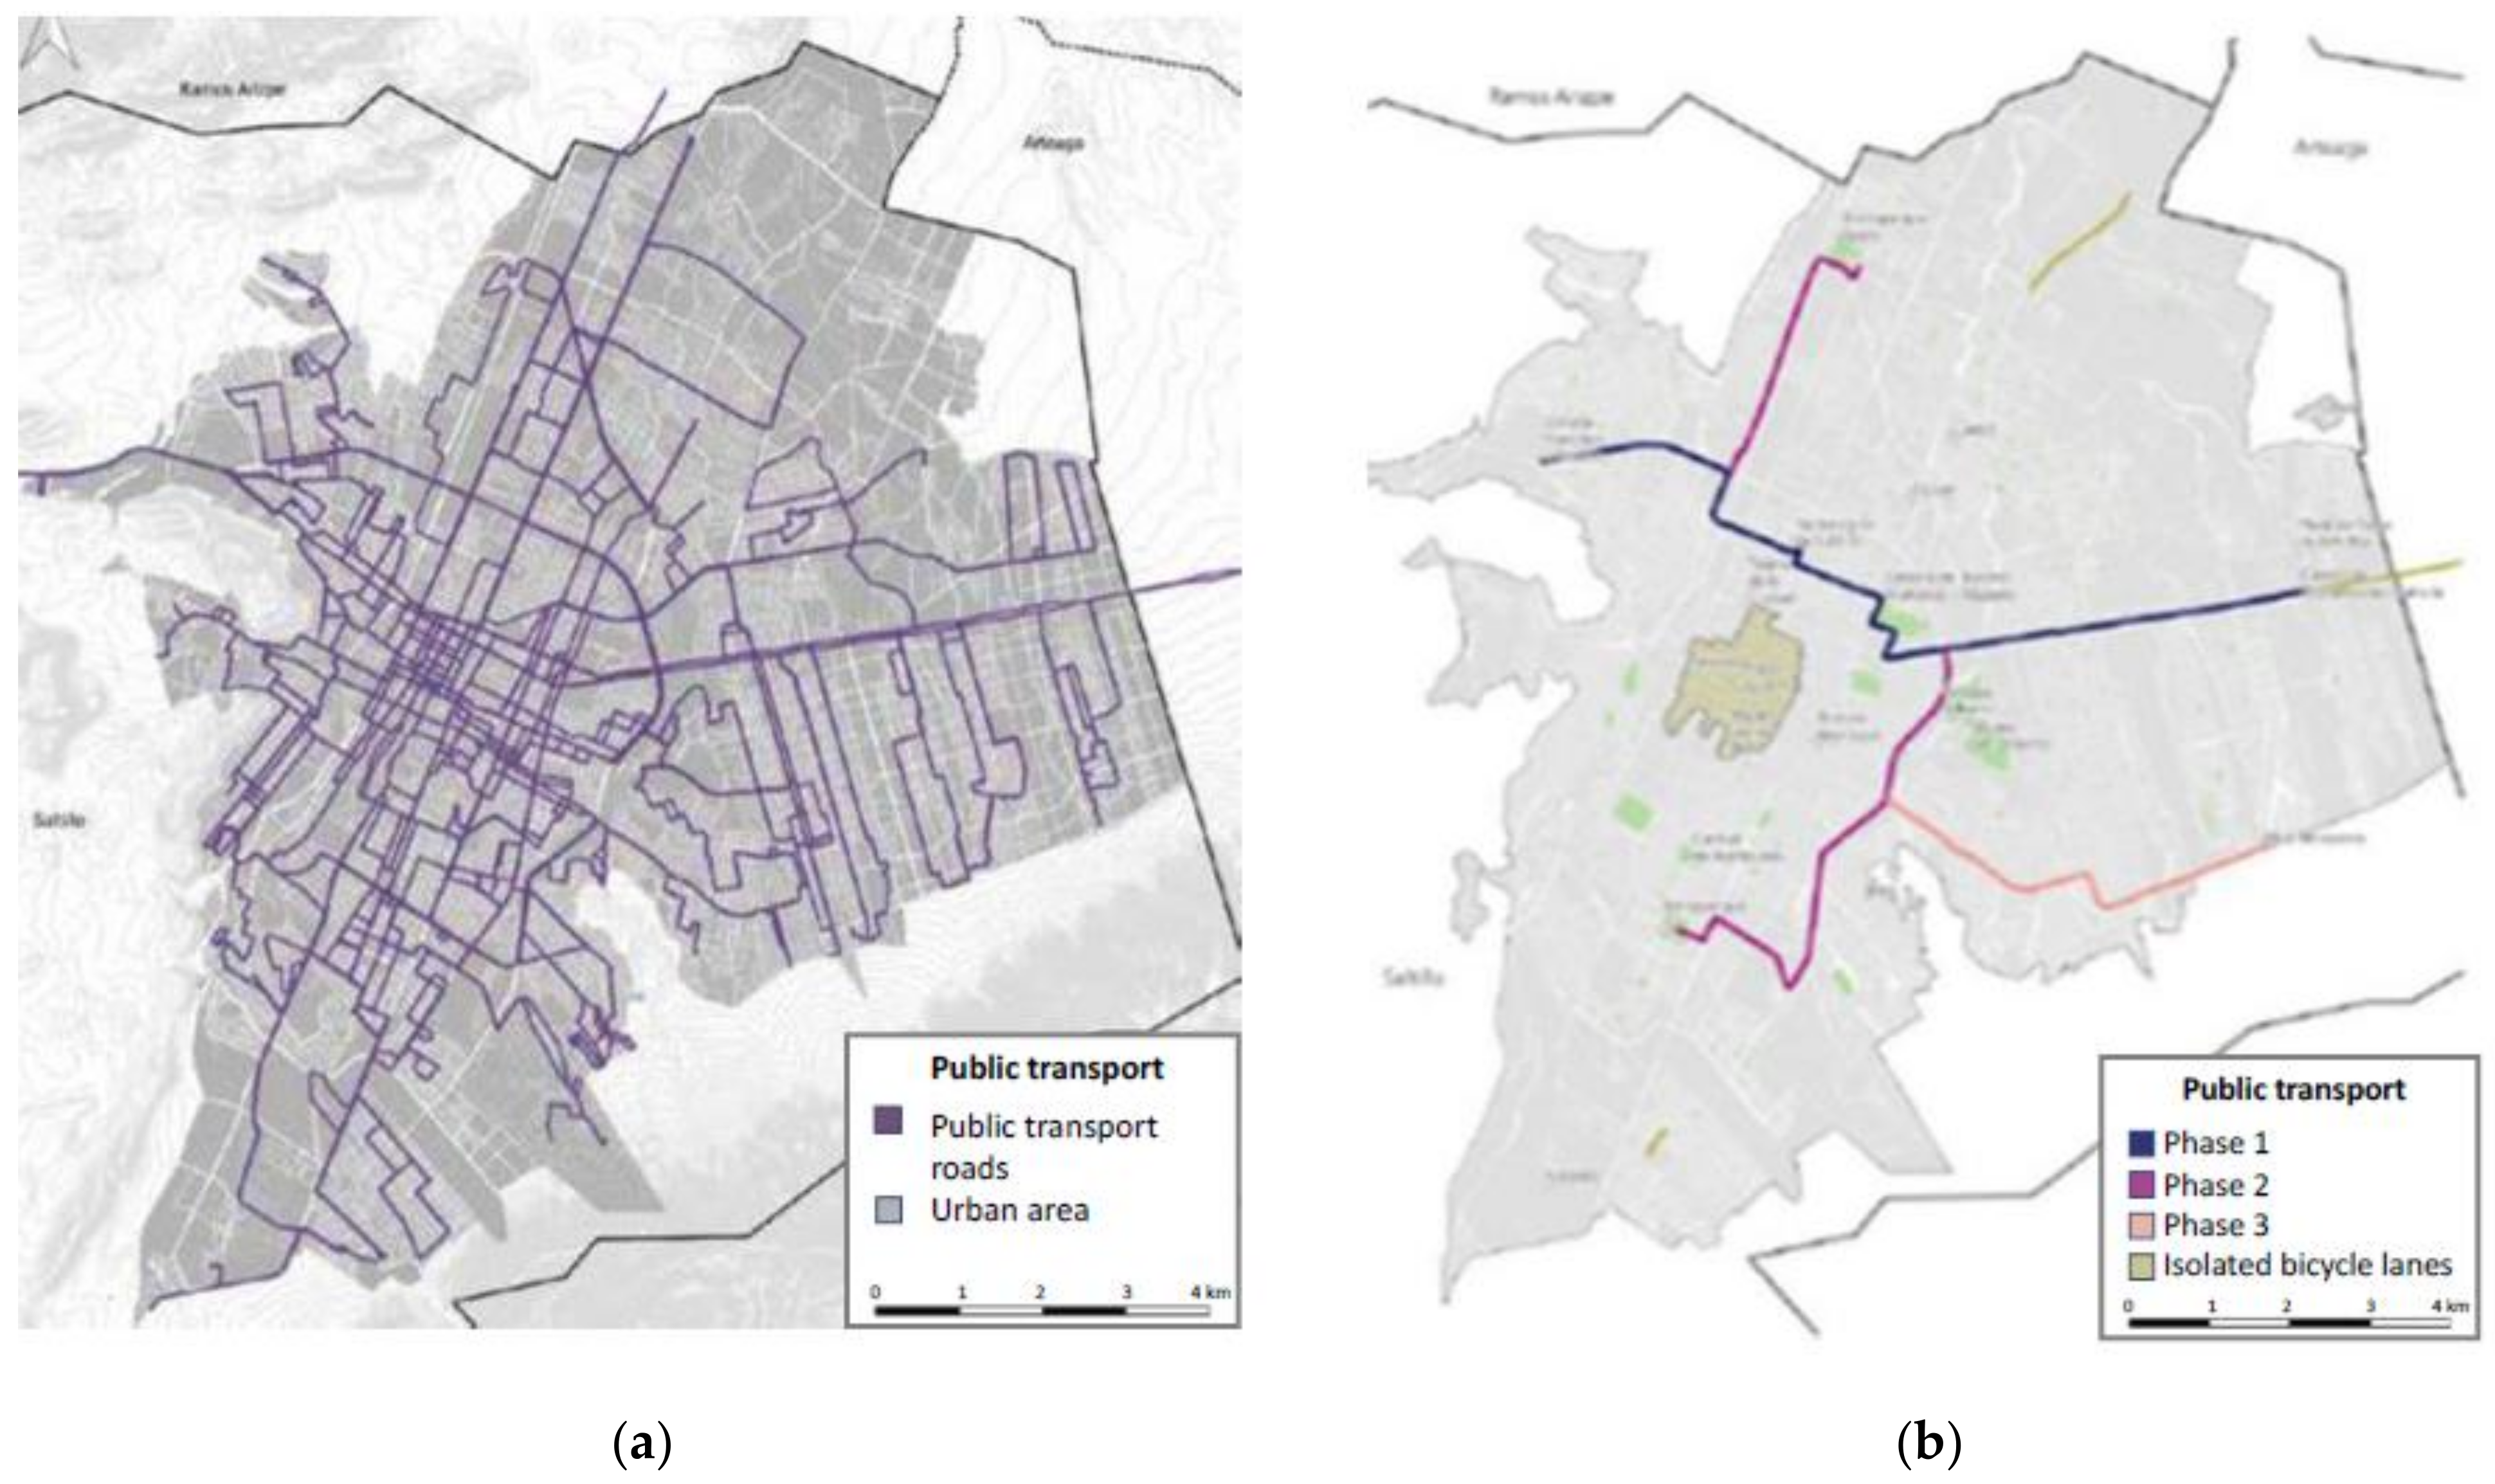
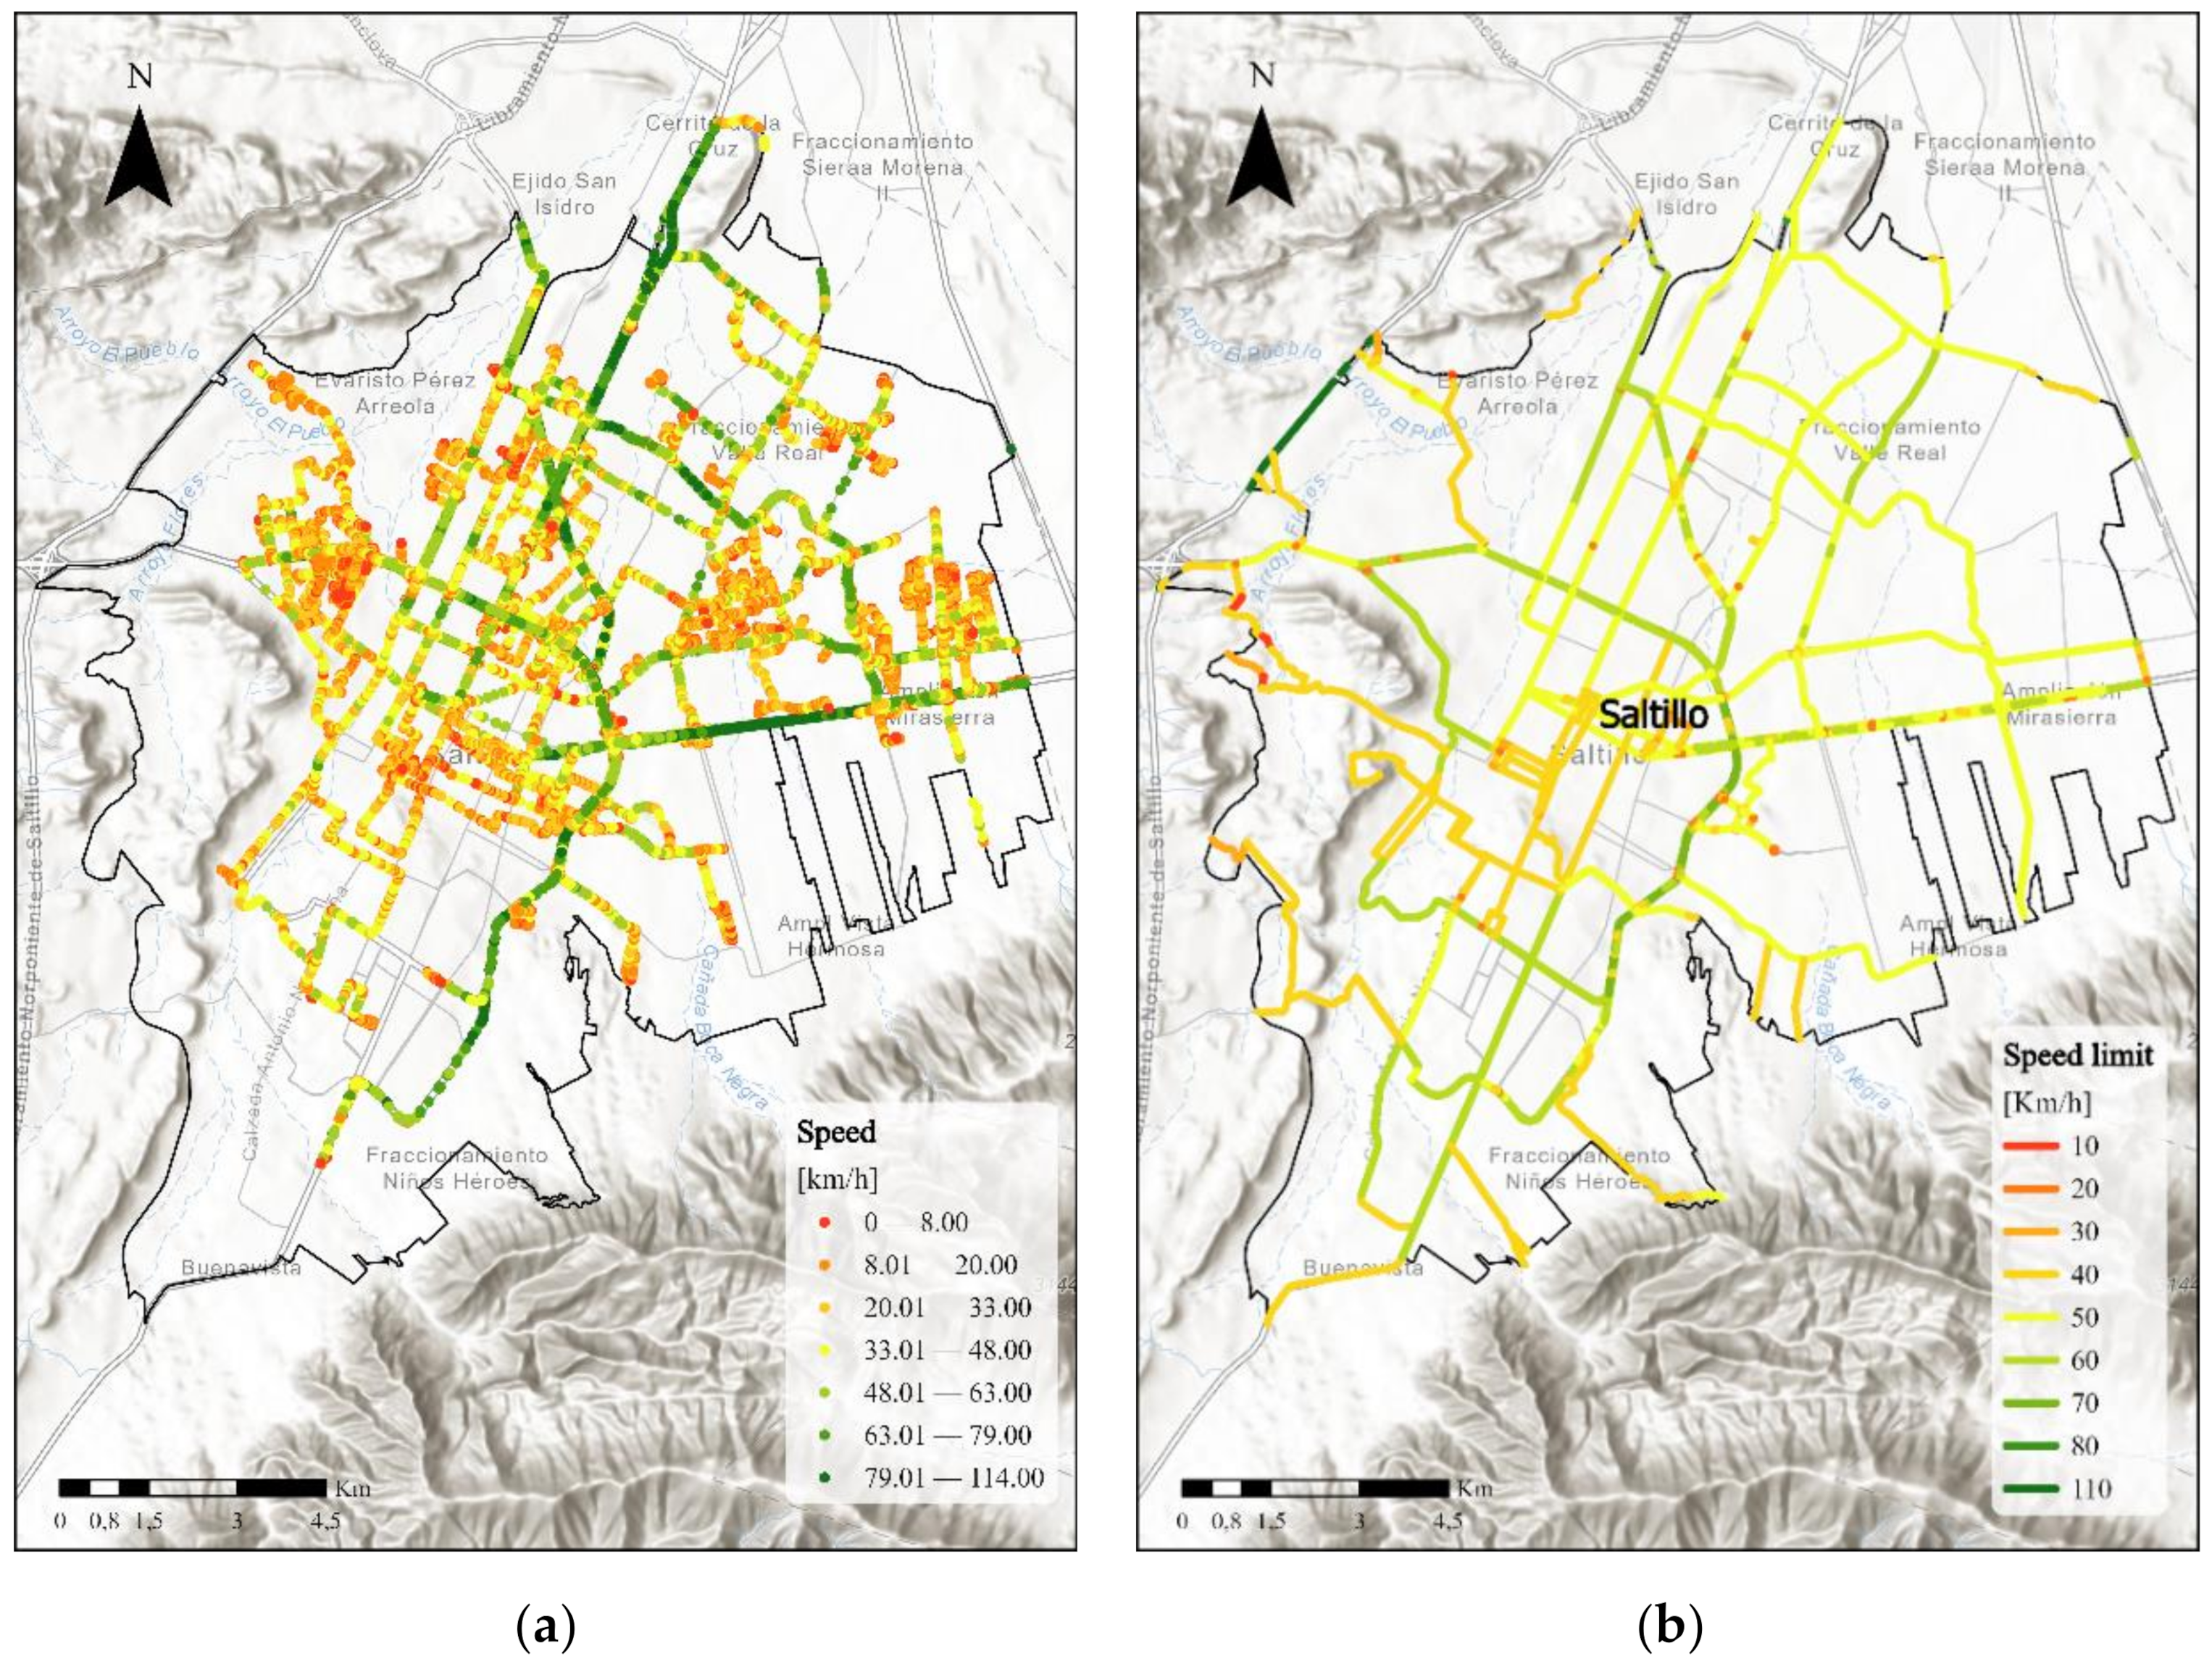
2.1. Region of Study
2.2. Evaluation of Mobility-Related Performance Indicators
2.2.1. Accessibility
|
|
|
2.2.2. Government
2.2.3. Environmental Impact
2.2.4. Mobility
2.3. Assessment
3. Results
3.1. Region of Study
3.2. Key Performance Indicators
3.2.1. Accessibility
3.2.2. Government
- 1.
- Law of Transit and Transport of the State of Coahuila de Zaragoza (1996): This law regulates transport services as well as the conditions of concessions. It addresses different aspects of the transport operation, such as authorized schedules, frequencies, routes, and years of operation of public vehicles [62].
- 2.
- Law for the Development and Inclusion of Persons with Disabilities in the State of Coahuila de Zaragoza (2013): This law establishes that the General Department of Urban Management, Water, and Planning and the General Department of Infrastructure oversees the designing, establishing, and monitoring compliance with regulations focused on the mobility of persons with disabilities in the city [63].
- 3.
- Saltillo Urban Development Master Plan (2014): This strategic plan sets out the main objectives in terms of mobility, transport, and guidelines for the construction of roads and parking infrastructure in Saltillo. In terms of mobility and transport, it seeks to solve conflict points in the city’s road network, improves connectivity with the Derramadero area (an important commercial town located 32.7 km southwest of Saltillo), and creates alternative road options in the east of the municipality. It also aims to improve the average speed of public transport journeys to levels similar to those of private vehicles and aims to develop specific roads for freight transport and alternative mobility. It also seeks to discourage the entry of private cars into strategic areas of the city to benefit the operation of public transport [64].
- 4.
- Traffic and Transport Regulation for Saltillo (2015): This regulation establishes the rules concerning public transport and defines the local authorities in charge of monitoring the compliance of said regulation. In accordance with these provisions, the municipality is responsible for establishing the rules regarding timetables, fares, and rules for the use of public transport vehicles. In addition, the municipality supervises the locations of bus stops and terminals in the city, as well as the routes and frequency of public transport [65].
- 5.
- General Law on Human Settlements, Territorial Planning and Urban Development (2016): This law establishes ensuring the interconnection of roads and shared-use paths with human-scale design as a responsibility of the government. It also promotes the adoption of new urban mobility and accident prevention habits to improve people’s travel conditions by encouraging the intensive use of public and non-motorized transport. In addition, it encourages the provision and preservation of spaces for pedestrian and bicycle traffic and connectivity criteria between roads that promote urban mobility [65].
- 6.
- Sustainable Mobility Law of the State of Coahuila de Zaragoza (2017): This law establishes the general conditions for the operation of infrastructure for persons with disabilities, pedestrians, and users of public transport and non-motorized vehicles. It promotes public policies aimed at shifting the use of private vehicles to public transport as well as establishes the plan for the adoption and replacement of public transport vehicles and promoting the implementation of subsidies, loans, and provisions to achieve this objective [66].
|
|
3.2.3. Environmental Impact
3.2.4. Mobility
3.3. Assessment
4. Discussion
- The objective of the methodology is to assess the current situation of city mobility as a first step to identify the most effective sustainable strategies that the city should implement to improve the mobility of people and goods within the city.
- Sustainability is a key part of the methodology. Thus, the pillars aspects of sustainability (social, economic, and environmental) were included.
- In the process of defining the methodology, the special circumstances of LATAM cities related to urban mobility were taking into consideration. In most of these cities, people′s mobility is based on buses. Cities are spread and located at high altitudes over mountainous regions. There is a marked social stratification with most of the people in the low-income segment. These low-income people usually live in the periphery of the city. These aspects influence the definition of the categories to consider and the reference values used for each KPIi.
- The methodology aims to ease the assessment process, at the lowest possible incremental cost, in a reproducible manner and producing results free from subjectivities. In this sense, the methodology is based on data. We propose the use of web map services, telematics data, results from the city’s air quality monitoring network and from its inspection and maintenance program. All these data can be obtained at a reduced incremental cost. This essential characteristic of the proposed methodology will allow it to become a Monitoring and Reporting System (MRS) that continuously assesses the effects of the mobility strategies implemented in the city.
- Integration of the multiple modes of transportation on a Mobility as a Service (MaaS) platform
- Reorganization of the public transport with particular emphasis on the public transport in the historic center
- The progressive introduction of electric buses in the public transport system
- Strengthening of the program that promotes the use of bicycles as an alternative mode of transportation
- Implementation of a compulsory Inspection and maintenance (I/M) program for all vehicles
5. Final Remarks
Author Contributions
Funding
Institutional Review Board Statement
Informed Consent Statement
Data Availability Statement
Acknowledgments
Conflicts of Interest
References
- CO2 Emissions from Fuel Combustion—Overview; International Energy Agency: Washington, DC, USA, 2017.
- Pérez, J.; de Andrés, J.M.; Borge, R.; de la Paz, D.; Lumbreras, J.; Rodríguez, E. Vehicle fleet characterization study in the city of Madrid and its application as a support tool in urban transport and air quality policy development. Transp. Policy 2018, 74, 114–126. [Google Scholar] [CrossRef]
- Curl, A.; Nelson, J.; Anable, J. Does accessibility planning address what matters? A response to Derek Halden by Curl, Nelson and Anable. Res. Transp. Bus. Manag. 2012, 3, 84. [Google Scholar] [CrossRef]
- The Sustainable Mobility Project; World Business Council for Sustainable Development (WBCSD): Geneva, Switzerland, 2002.
- Kordej-De Villa, Ž. Human Smart Cities: Rethinking the interplay between design and planning. Privred. Kretanjua I Ekon. Polit. 2017, 25, 71–83. [Google Scholar]
- Institute of Human Factors and Technology Management IAT. City Lab Kochi, India; Institute of Human Factors and Technology Management IAT: Stuttgart, Germany, 2020. [Google Scholar]
- Joumard, R.; Gudmundsson, H. Indicators of Environmental Sustainability in Transport; European Commission. RECHERCHES No. R282. Available online: http://cost356.inrets.fr (accessed on 13 October 2021).
- Garau, C.; Masala, F.; Pinna, F. Benchmarking smart urban mobility: A study on Italian cities. In International Conference on Computational Science and Its Applications; Springer: Berlin/Heidelberg, Germany, 2015; pp. 612–623. [Google Scholar]
- Camagni, R.; Gibelli, M.C.; Rigamonti, P. Urban mobility and urban form: The social and environmental costs of different patterns of urban expansion. Ecol. Econ. 2002, 40, 199–216. [Google Scholar] [CrossRef]
- Frei, F. Sampling mobility index: Case study in Assis—Brazil. Transp. Res. Part A Policy Pr. 2006, 40, 792–799. [Google Scholar] [CrossRef]
- Silva, A.N.R.D.; Costa, M.D.S.; Ramos, R.A. Development and Application of I_SUM: An Index of Sustainable Urban Mobility. In Proceedings of the Transportation Research Board (TRB) 89th Annual Meeting, Washington, DC, USA, 10–14 January 2010. [Google Scholar]
- Machado, L. Índice de Mobilidade Sustentável para Avaliar a Qualidade de Vida Urbana: Estudo de caso Região Metropolitana de Porto Alegre-RMPA. Master’s Thesis, Universidade Federal do Rio Grande do Sul. Faculdade de Arquitetura, Porto Alegre, Mexico, 2010. [Google Scholar]
- Zito, P.; Salvo, G. Toward an urban transport sustainability index: A European comparison. Eur. Transp. Res. Rev. 2011, 3, 179–195. [Google Scholar] [CrossRef] [Green Version]
- Jeon, C.M.; Amekudzi, A.A.; Guensler, R.L. Sustainability assessment at the transportation planning level: Performance measures and indexes. Transp. Policy 2013, 25, 10–21. [Google Scholar] [CrossRef]
- Haghshenas, H.; Vaziri, M. Urban sustainable transportation indicators for global comparison. Ecol. Indic. 2012, 15, 115–121. [Google Scholar] [CrossRef]
- Patterson, Z.; Saddier, S.; Rezaei, A.; Manaugh, K. Use of the urban core index to analyze residential mobility: The case of seniors in Canadian metropolitan regions. J. Transp. Geogr. 2014, 41, 116–125. [Google Scholar] [CrossRef]
- Reisi, M.; Aye, L.; Rajabifard, A.; Ngo, T. Transport sustainability index: Melbourne case study. Ecol. Indic. 2014, 43, 288–296. [Google Scholar] [CrossRef]
- Moeinaddini, M.; Asadi-Shekari, Z.; Shah, M.Z. An urban mobility index for evaluating and reducing private motorized trips. Measurement 2015, 63, 30–40. [Google Scholar] [CrossRef]
- Lopez-Carreiro, I.; Monzon, A. Evaluating sustainability and innovation of mobility patterns in Spanish cities. Analysis by size and urban typology. Sustain. Cities Soc. 2018, 38, 684–696. [Google Scholar] [CrossRef]
- Morfoulaki, M.; Papathanasiou, J. Use of the sustainable mobility efficiency index (SMEI) for enhancing the sustainable urban mobility in Greek cities. Sustainability 2021, 13, 1709. [Google Scholar] [CrossRef]
- Sampaio, C.; Macedo, E.; Coelho, M.C.; Bandeira, J.M. Economic and environmental analysis of measures from a Sustainability Urban Mobility Plan—Application to a small sized city. Transp. Res. Procedia 2020, 48, 2580–2588. [Google Scholar] [CrossRef]
- Regmi, M.B. Measuring sustainability of urban mobility: A pilot study of Asian cities. Case Stud. Transp. Policy 2020, 8, 1224–1232. [Google Scholar] [CrossRef]
- Nemoto, E.H.; Issaoui, R.; Korbee, D.; Jaroudi, I.; Fournier, G. How to measure the impacts of shared automated electric vehicles on urban mobility. Transp. Res. Part D Transp. Environ. 2021, 93, 102766. [Google Scholar] [CrossRef]
- Sharifi, A. A typology of smart city assessment tools and indicator sets. Sustain. Cities Soc. 2020, 53, 101936. [Google Scholar] [CrossRef]
- The Sustainable Mobility Project; World Business Council for Sustainable Development (WBCSD): Geneva, Switzerland, 2016.
- Sustainable Urban Transport Index (SUTI); Economic and Social Commission for Asia and the Pacific (ESCAP): Bangkok, Thailand, 2018.
- Union Internationale des Transports Publics UITP, Mobility in Cities Database. Available online: https://www.uitp.org/publications/mobility-in-cities-database/ (accessed on 30 June 2021).
- A Centre for Economics & Business Research Exploration with Qualcomm, n.d. Urban Mobility Index. Available online: https://www.qualcomm.com/media/documents/files/urban-mobility-index-report.pdf (accessed on 30 June 2021).
- The Future of Mobility 3.0. Reinventing Mobility in the Era of Disruption and Creativity. Available online: https://www.adlittle.com/en/insights/viewpoints/future-mobility-30 (accessed on 30 June 2021).
- HERE. Urban Mobility Index. Available online: https://urbanmobilityindex.here.com/ (accessed on 30 June 2021).
- Deloitte Insights, The 2020 Deloitte City Mobility Index. Deloitte City Mobil. Index. Available online: https://www2.deloitte.com/content/dam/insights/us/articles/4331_Deloitte-City-Mobility-Index/2020/DCMI_Methodology_2020_WEB.pdf (accessed on 30 June 2021).
- Sustainable Urban Mobility Indicators (SUMI); Commission E: Brussels, Belgium, 2020.
- Marchetti, D.; Oliveira, R.; Figueira, A.R. Are global north smart city models capable to assess Latin American cities? A model and indicators for a new context. Cities 2019, 92, 197–207. [Google Scholar] [CrossRef]
- Aghaabbasi, M.; Moeinaddini, M.; Shah, M.Z.; Asadi-Shekari, Z. Addressing issues in the use of Google tools for assessing pedestrian built environments. J. Transp. Geogr. 2018, 73, 185–198. [Google Scholar] [CrossRef]
- Altamirano-Avila, A.; Martínez, M. Urban sustainability assessment of five Latin American cities by using SDEWES index. J. Clean. Prod. 2020, 287, 125495. [Google Scholar] [CrossRef]
- Análisis Diagnóstico de la Ciclovía y Movilidad no Motorizada en el Municipio de Saltillo; IMPLAN: Saltillo, Mexico, 2018.
- Pinhate, T.B.; Parsons, M.; Fisher, K.; Crease, R.P.; Baars, R. A crack in the automobility regime? Exploring the transition of São Paulo to sustainable urban mobility. Cities 2020, 107, 102914. [Google Scholar] [CrossRef]
- PurpleAir Inc. An Air Quality Monitoring Network Built on a New Generation of “Internet of Things” Sensors. PurpleAir Real-time Air Qual. Monit. Available online: https://www2.purpleair.com/ (accessed on 9 August 2021).
- Air Quality Index: A Guide to Air Quality and Your Health; United States Environmental Protection Agency: Washington, DC, USA, 2009.
- Informe Annual; CFE Comision Federal de Electricidad: Mexico City, Mexico, 2019.
- Quirama, L.F.; Giraldo, M.; Huertas, J.I.; Jaller, M. Driving cycles that reproduce driving patterns, energy consumptions and tailpipe emissions. Transp. Res. Part D Transp. Environ. 2020, 82, 102294. [Google Scholar] [CrossRef]
- Giraldo, M.; Huertas, J.I. Real emissions, driving patterns and fuel consumption of in-use diesel buses operating at high altitude. Transp. Res. Part. D Transp. Environ. 2019, 77, 21–36. [Google Scholar] [CrossRef]
- Mogro, A.E.; Huertas, J.I. Assessment of the effect of using air conditioning on the vehicle’s real fuel consumption. Int. J. Interact. Des. Manuf. 2021, 1–5. [Google Scholar] [CrossRef]
- Franco, V.; Kousoulidou, M.; Muntean, M.; Ntziachristos, L.; Hausberger, S.; Dilara, P. Road vehicle emission factors development: A review. Atmos. Environ. 2013, 70, 84–97. [Google Scholar] [CrossRef]
- Mancilla, Y.; Araizaga, A.E.; Mendoza, A. A tunnel study to estimate emission factors from mobile sources in Monterrey, Mexico. J. Air Waste Manag. Assoc. 2012, 62, 1431–1442. [Google Scholar] [CrossRef] [Green Version]
- Bishop, G.; Stedman, D.H. Measuring the emissions of passing cars. Accounts Chem. Res. 1996, 29, 489–495. [Google Scholar] [CrossRef]
- Borken-Kleefeld, J.; Dallman, T. Remote Sensing of Vehicle Exhaust Emissions; International Council on Clean Transportation: Washington, DC, USA, 2018. [Google Scholar]
- Secretaria de Medio Ambiente y Recursos Naturales, NOM-167-SEMARNAT; Diario Oficial de la Federación: Mexico City, Mexico, 2017.
- Clean Screening in Inspection and Maintenance Programs. Tech. Highlights 1–4; United States Environmental Protection Agency: Washington, DC, USA, 1998.
- Huertas, J.; Mogro, A.; Mendoza, A.; Huertas, M.; Ibarra, R. Assessment of the reduction in vehicles emissions by implementing inspection and maintenance programs. Int. J. Environ. Res. Public Health 2020, 17, 4730. [Google Scholar] [CrossRef]
- Huertas, J.I.; Mendoza, A.; Huertas, M.E.; Ibarra, R.; Mogro, A. Potential environmental impact of I/M programs in urban centers based on RSD monitoring campaigns. IOP Conf. Ser. Earth Environ. Sci. 2020, 489, 012015. [Google Scholar] [CrossRef]
- Quirama, L.F.; Giraldo, M.; Huertas, J.I.; Tibaquirá, J.E.; Cordero-Moreno, D. Main characteristic parameters to describe driving patterns and construct driving cycles. Transp. Res. Part D Transp. Environ. 2021, 97, 102959. [Google Scholar] [CrossRef]
- Municipio de Saltillo, Saltillo Segunda Ciudad Mexicana Con Mayor PIB Per Cápita en 2019. Available online: https://saltillo.gob.mx/saltillo-segunda-ciudad-mexicana-con-mayor-pib-per-capita-en-2019/ (accessed on 1 July 2021).
- Consejo Nacional de Evaluación de la Política de Desarrollo Social, Ingreso Laboral per Cápita. Monit. y Estados. Available online: https://www.coneval.org.mx/coordinacion/Paginas/principal.aspx (accessed on 23 November 2020).
- Propuesta Ordenamiento del Sistema de Transporte Público de la Zona Conurbada de Saltillo; IMPLAN: Saltillo, Mexico, 2015.
- Sistema de Indicadores de Movilidad Urbana; IMPLAN: Saltillo, Mexico, 2015.
- Instituto Mexicano del Transporte, Red Nacional de Caminos. Represent. Cart. en formato Digit. y Georreferenciada la Red Nac. Caminos. Available online: https://www.gob.mx/imt/acciones-y-programas/red-nacional-de-caminos (accessed on 21 July 2021).
- Estudio de Emisiones Vehiculares de la Ciudad de Saltillo Mediante la Técnica de Detección Remota; INECC Instituto Nacional de Ecología y Cambio Climático: Mexico City, Mexico, 2019; p. 52.
- Proposal for a Network of Cycling Routes for the City of Saltillo; IMPLAN: Saltillo, Mexico, 2016.
- INEGI Instituto Nacional de Estadística Geografía e Informática, Inventario Nacional de Viviendas. Saltillo. Available online: https://www.inegi.org.mx/app/mapa/inv/ (accessed on 2 July 2021).
- Gobierno del Estado de Coahuila de Zaragoza. Constitución Política del Estado de Coahuila de Zaragoza; Diario Oficial de la Federación: Mexico City, México, 1918. [Google Scholar]
- Gobierno del Estado de Coahuila de Zaragoza. Ley de Transito y Transporte del Estado de Coahuila de Zaragoza; Periódico Oficial DOF: Mexico City, México, 1996. [Google Scholar]
- Gobierno del Estado de Coahuila de Zaragoza. Ley para el Desarrollo e Inclusión de las Personas con Discapacidad del Estado de Coahuila de Zaragoza; Periódico Oficial DOF: Mexico City, México, 2013. [Google Scholar]
- Plan Municipal de Desarrollo Urbano Saltillo; Gobierno Municipal de Saltillo: Saltillo, Mexico, 2019.
- Gobierno Municipal de Saltillo. Reglamento de Tránsito y Transporte para el Municipio de Saltillo, Coahuila de Zaragoza; Diario Oficial de la Federación: Mexico City, México, 2015. [Google Scholar]
- Gobierno del Estado de Coahuila de Zaragoza. Ley de Transporte y Movilidad Sustentable para el Estado de Coahuila De Zaragoza; Diario Oficial de la Federación: Saltillo, México, 2019. [Google Scholar]
- Hacia la Consolidación del Centro Histórico de Saltillo; IMPLAN: Saltillo, Mexico, 2018.
- Análisis de Movilidad Urbana en el Centro Histórico de Saltillo; IMPLAN: Saltillo, Mexico, 2016.
- Guía de Recomendaciones para Mejora del Segmento de Ciclovía: Centro de Gobierno—Distribuidor Vial El Sarape; IMPLAN: Saltillo, Mexico, 2015.
- Recomendaciones al Proyecto Denominado: Actualización Tecnológica del Parquímetros; IMPLAN: Saltillo, Mexico, 2015.
- Guía de Diseño de Infrastructura Peatonal; IMPLAN & Gobierno Municipal de Saltillo: Saltillo, Mexico, 2017.
- PEMEX, Hoja De Datos De Seguridad HDS-PEMEX-TRI-SAC-7. Gasolinas Pemex Prem. y Pemex Magna. Available online: https://www.coursehero.com/file/50004634/HDS-SAC-Gasolinas-Premium-y-Magna-TRI-7-1-1pdf/ (accessed on 23 November 2020).
- Pepper, G.T. Methods and System for Determining Consumption and Fuel Efficiency in Vehicles. U.S. Patent 7,774,130, 10 August 2010. [Google Scholar]
- Ramírez, J.D.; Giraldo-Peralta, N.; Flórez-Ceron, D.; Rangel, V.; Mejía-Argueta, C.; Huertas, J.I.; Bernal, M. Eco-driving key factors that influence fuel consumption in heavy-truck fleets: A Colombian case. Transp. Res. Part D Transp. Environ. 2017, 56, 258–270. [Google Scholar] [CrossRef]
- Programa de Gestión para Mejorar la Calidad del Aire del Estado de Coahuila de Zaragoza 2017–2026; SEMARNAT: Mexico City, Mexico, 2017.
- Western, G. Guía de Elaboración y Uso de Inventario de Emisiones; INE-SEMARNAT: Mexico City, Mexico, 2005. [Google Scholar]
- Jiménez-Palacios, L.J. Understanding and Quantifying Motor Vehicle Emissions with Vehicle Specific Power and TILDAS Remote Sensing; Massachusetts Institute of Technology: Cambridge, MA, USA, 1999. [Google Scholar]
- Redes Urbanas y Servicios de Planeación, S.A. de C.V. Programa de Desarrollo Urbano de la Zona Metropolitana de Saltillo-Ramos Arizpe-Arteaga. Saltillo. 2012. Available online: http://www.segucoahuila.gob.mx/admin/uploads/Documentos/modulo23/programa_de_desarrollo_urbano_de_la_zona_metropolitana_saltillo_ramos_arteaga.pdf (accessed on 9 August 2021).
- Montufar, P.; Huertas, J.I.; Cuisano, J. Driving cycle and emission factors in high-altitude cities: Riobamba case. In Proceedings of the 2020 IEEE ANDESCON, Quito, Ecuador, 13–16 October 2020; pp. 1–6. [Google Scholar] [CrossRef]
- Banco Interamericano de Desarrollo, Programa Ciudades Emergentes y Sostenibles. Acompañando el Crecim. Sosten. las Ciudad. emergentes Am. Lat. y el Caribe. Available online: https://publications.iadb.org/es/guia-metodologica-programa-de-ciudades-emergentes-y-sostenibles-tercera-edicion-anexo-de (accessed on 9 August 2021).


| Pillar | Category | Performance Indicators (PIs) | Units | KPIi | KPIi- | KPIi+ | Si (%) |
|---|---|---|---|---|---|---|---|
| Accessibility | Physical Infrastructure |
| km/106 hab | 41.2 | 2.84 | 58.6 | 31.2 |
| km/ha | 0.00 | NR | NR | NR | ||
| km/ha | N/D | NR | NR | NR | ||
| km/106 hab | 0.47 | 0.16 | 7.8 | 4.1 | ||
| % | 55.24 | 0 | 100 | 55.2 | ||
| % | 2.58 | 0 | 100 | 2.6 | ||
| % | 5.00 | NR | NR | NR | ||
| % | 10.00 | 0 | 100 | 0.00 | ||
| Economic scope |
| % | 19 | 2.8 | 25 | 27 | |
| USD/hab | 32,000 | 6000 | 70,000 | 40.7 | ||
| USD/trip | 0.55 | 0.20 | 2.80 | 87.7 | ||
| Energy Supply |
| stations/106 hab | 1.2 | 0.1 | 4.3 | 27.0 | |
| km/106 hab | 0.09 | 0 | 5.5 | 1.5 | ||
| Vehicles for the mobility of people and goods |
| veh/hab | 0.18 | 0.05 | 0.70 | 79.7 | |
| veh/106 hab | 1232.89 | NR | NR | NR | ||
| % | N/D | NR | NR | NR | ||
| % | 67 | 0 | 100 | 33 | ||
| % | <0.01 | 0 | 17 | 0.00 | ||
| % | N/D | NR | NR | NR | ||
| City distribution |
| [hab/ha] | 48.89 | 13.7 | 286 | 87.08 | |
| [%] | 16.40 | 0 | 100 | 0.00 | ||
| [1/106 hab ] | 1.2 | NR | NR | NR | ||
| Government | Organization and regulations |
| [0/1] | 1 | 0 | 1 | 100 |
| [0/1] | 1 | 0 | 1 | 100 | ||
| [0/1] | 1 | 0 | 1 | 100 | ||
| [0/1] | 1 | 0 | 1 | 100 | ||
| [0/1] | 1 | 0 | 1 | 100 | ||
| [0/1] | 1 | 0 | 1 | 100 | ||
| Environmental Impact | Energy and emissions |
| l/100 km | 12 | 9.9 | 20.2 | 79.3 |
| tons/hab-year | 6.2 | 0.1 | 8.8 | 31.4 | ||
| % | 0.58 | 0.06 | 0.6 | 2.8 | ||
| ppm | 398 | 39 | 506 | 23.1 | ||
| ppm | 595 | 62 | 596 | 0.2 | ||
| Mobility | Mobility patterns |
| km/h | 21.1 | 9.6 | 35 | 45.3 |
| m/s2 | 0.2 | NR | NR | NR | ||
| % | 21.4 | NR | NR | NR | ||
| % | 79 | NR | NR | NR | ||
| Deaths/106 hab | 0.5 | 0.01 | 1.4 | 64 | ||
| trip/hab-year | 186.5 | 106 | 4131 | 2 | ||
| % | 18 | 6.2 | 51.4 | 26.1 | ||
| % | 0.92 | 0.2 | 32 | 2.3 | ||
| % | 34 | 4.8 | 51.6 | 62.6 | ||
| % | 38.1 | 12 | 85 | 64.3 | ||
| min | 25.6 | 14 | 32 | 35.6 | ||
| min | 39.5 | 37 | 87 | 95 |
| Score | Classification | Interpretation |
|---|---|---|
| 80–100 | A | Very high sustainable mobility |
| 60–79 | B | High sustainable mobility |
| 40–59 | C | Medium sustainable mobility |
| 20–39 | D | Low sustainable mobility |
| 10–19 | E | Very low sustainable mobility |
| 0–9 | F | Unsustainable mobility |
| Year | Strategy | Reference |
|---|---|---|
| 2004 | Improved buses, cards, created routes, surveyed origin-destination. | |
| 2013 | IMPLAN establishment | http://www.implansaltillo.mx/, accessed on 31 July 2021 |
| 2015 | East Area Public Transport Analysis—Boulevard Carranza | |
| 2015 | Urban mobility indicator system | [56] |
| 2015 | Recommendations guide for the improvement of the bike path segment: Government Center—Distributor Vial “El Sarape” | [69] |
| 2015 | Recommendations to the project denominated: “update technology of parking meters | [70] |
| 2016 | Analysis of urban mobility in the Saltillo historical center | [68] |
| 2017 | Design guide for pedestrian infrastructure. | [71] |
| 2019 | Study of vehicular emissions in the city of Saltillo using the remote sensing technique | [58] |
| 2020 | Proposal for reorganizing mobility in the historic center |
| Primary Source | Secondary Source | Tertiary Source | |
|---|---|---|---|
| Volatile Organic Compounds (VOCs) | Automotive industry (30%) | SUV and Pick-up vehicles (17%) | Passenger vehicles and taxicabs (29%) |
| Carbon Monoxide (CO) | SUV and Pick-up vehicles (39%) | Passenger vehicles and taxicabs (29%) | Vehicles under 3 tons (9%) |
| Nitrogen Oxides (NOX) | Generation of electricity (43%) | Metallurgical industry (21%) | Vehicles under 3 tons and tractor units (11%) |
| Particulate Matter smaller than 10 micrometers (PM10) | Metallurgical industry (43%) | Unpaved roads (20%) | Generation of electricity (7%) |
| Particulate Matter smaller than 2.5 micrometers (PM2.5) | Metallurgical industry (59%) | Unpaved roads (8%) | Generation of electricity (6%) |
| Saltillo | |
|---|---|
| Measuring site | |
| Date | 26 to 30, 2019 |
| Campaign schedule | 08:30 to 16:30 |
| Vehicles monitored | |
| Total Measurements | 19,003 |
| Valid measurements for CO, HC, and NO | 12,233 |
| Licensed plate matched | 12,233 |
| Adjusted to speed and Acceleration ranges * | 12,109 |
| Adjusted to VSP range | 11,477 |
| Measurement conditions | |
| Avg. Fleet age [years] | 8.1 |
| Median Fleet age [years] | 6 |
| Avg. Speed [mph] | 16.77 |
| Median Speed [mph] | 16.31 |
| Avg. Acceleration [mph/s] | 1.11 |
| Median Acceleration [mph/s] | 1.05 |
| Avg. VSP [kW/Ton] | 6.67 |
| Median VSP [kW/Ton] | 6.29 |
| Avg. Slope [Degrees] | 1.13 |
| Emissions concentrations | |
| Mean CO [vol %] | 0.583 ± 0.013 * (4.5 **) |
| Median CO [vol %] | 0.118 |
| Mean HC 1 [ppm] | 398 ± 11 * (600 **) |
| Median HC 1 [ppm] | 47.5 |
| Mean NO [ppm] | 595 ± 10 * (2500 **) |
| Median NO [ppm] | 43.2 |
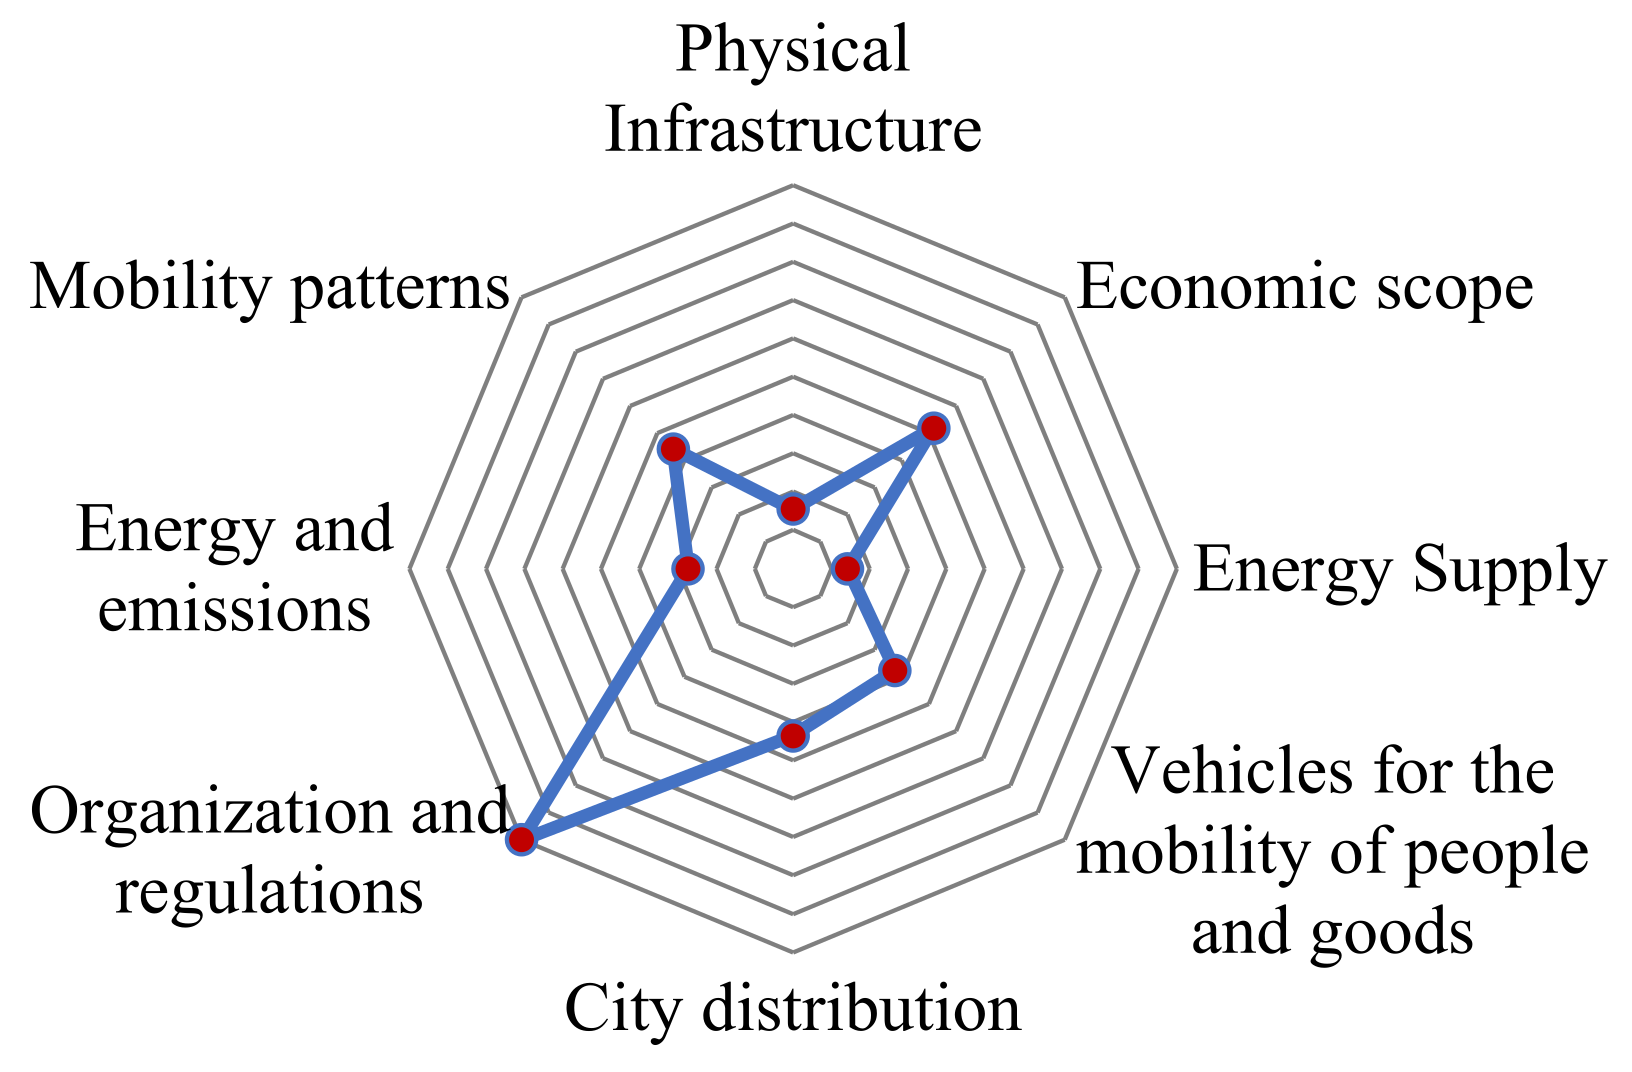
| Pillar | Category | UMI | Classification | Interpretation |
|---|---|---|---|---|
| Accessibility | Physical infrastructure | 18.6 | E | Very low sustainable mobility |
| Economic scope | 51.8 | C | Medium sustainable mobility | |
| Energy Supply | 14.3 | E | Very low sustainable mobility | |
| Vehicles for the mobility of people and goods | 37.6 | D | Low sustainable mobility | |
| City distribution | 43.5 | C | Medium sustainable mobility | |
| Government | Structure and regulations | 100 | A | Very high sustainable mobility |
| Environmental Impact | Energy and emissions | 27.4 | D | Low sustainable mobility |
| Mobility | Mobility patterns | 44.1 | C | Medium sustainable mobility |
| Overall | 46.5 | C | Medium sustainable mobility |
Publisher’s Note: MDPI stays neutral with regard to jurisdictional claims in published maps and institutional affiliations. |
© 2021 by the authors. Licensee MDPI, Basel, Switzerland. This article is an open access article distributed under the terms and conditions of the Creative Commons Attribution (CC BY) license (https://creativecommons.org/licenses/by/4.0/).
Share and Cite
Huertas, J.I.; Stöffler, S.; Fernández, T.; García, X.; Castañeda, R.; Serrano-Guevara, O.; Mogro, A.E.; Alvarado, D.A. Methodology to Assess Sustainable Mobility in LATAM Cities. Appl. Sci. 2021, 11, 9592. https://doi.org/10.3390/app11209592
Huertas JI, Stöffler S, Fernández T, García X, Castañeda R, Serrano-Guevara O, Mogro AE, Alvarado DA. Methodology to Assess Sustainable Mobility in LATAM Cities. Applied Sciences. 2021; 11(20):9592. https://doi.org/10.3390/app11209592
Chicago/Turabian StyleHuertas, José I., Sonja Stöffler, Trinidad Fernández, Xanin García, Roberto Castañeda, Oscar Serrano-Guevara, Antonio E. Mogro, and Duván A. Alvarado. 2021. "Methodology to Assess Sustainable Mobility in LATAM Cities" Applied Sciences 11, no. 20: 9592. https://doi.org/10.3390/app11209592
APA StyleHuertas, J. I., Stöffler, S., Fernández, T., García, X., Castañeda, R., Serrano-Guevara, O., Mogro, A. E., & Alvarado, D. A. (2021). Methodology to Assess Sustainable Mobility in LATAM Cities. Applied Sciences, 11(20), 9592. https://doi.org/10.3390/app11209592