Article

Closed-Loop Modeling to Evaluate the Performance of a Scaled-Up Lithium–Sulfur Battery in Electric Vehicle Applications

1
Institute for Clean Energy & Advanced Materials, School of Materials and Energy, Southwest University, Chongqing 400715, China
2
Institute of Materials Science & Devices Suzhou, School of Materials Science and Engineering, University of Science and Technology, Suzhou 215009, China
*
Author to whom correspondence should be addressed.
Qingxin Zeng, Zhuo Zou and Jie Chen contribute equally.
Appl. Sci. 2021, 11(20), 9593; https://doi.org/10.3390/app11209593
Submission received: 15 September 2021 / Revised: 11 October 2021 / Accepted: 12 October 2021 / Published: 14 October 2021
(This article belongs to the Special Issue Advanced Technology for Low-Emission Mobility)

Abstract

:
A closed-loop modeling method was established here to evaluate the performance of new battery technology from lab research to scaled-up developed electric vehicle (EV) applications. As an emerging energy-storage device, the lithium–sulfur battery (LSB) is a very promising candidate for the next generation of rechargeable batteries. However, it has been difficult to commercialize the LSB up to now. In this work, we designed and built a battery, EV, and driver system loop model to study the key performance parameters of LSB operation in EVs, in which the tested data from the lab were introduced into the model followed by simulating driving cycles and fast charging. A comparison with the lithium-ion batteries used in real vehicles verified the high reliability of the model. Meanwhile, the simulation results showed that the LSB needs more improvements for EV application; in particular, developments are still highly needed to overcome the high power and energy loss and sharp voltage vibration for practical applications. The novelty of this work relies on the created closed-loop modeling method to simulate lab research results for evaluating new battery technology in scaled-up EV applications in order to not only vividly predict EV operation performance and commercialization feasibility, but also thoughtfully guide researchers and developers for further optimization and problem solutions. Therefore, this method holds great promise as a powerful tool for both lab research and the industrial development of new batteries for EV applications.

1. Introduction

Air pollution has resulted in severe environmental problems [1]. In particular, exposure to traffic-related air pollution can cause potentially fatal human health concerns such as asthma, cancer, and cardiovascular disease [2]. It has been reported that about 1.3 billion vehicles including trucks, buses, and cars are registered and running worldwide [2]. The replacement of conventional gasoline vehicles with electrified power-train vehicles is an efficient approach to significantly reduce the emissions of contaminants such as PM 2.5, CO2, NOx, and CO. Therefore, governments worldwide have formulated policies to accelerate the development of EVs, which is being treated as an important strategy in economic development. For example, the USA has initiated the national “Zero Emission Vehicle Program”, and the UK and China started financial incentive programs such as the Plug-in Car and Van Grant Eligibility and New Energy Vehicle Credit Program in 2016 and 2017, respectively [3].
Currently, most electric vehicles are powered by lithium-ion batteries (LIBs) [4], and a “should cost” model was reported by BloombergNEF in that the price of a car battery will continuously drop to be comparable with combustion engines [5]. However, it is still currently not possible to meet the full demands of EVs due to safety issues and limited material reservation. It is highly demanding to develop a new generation of battery systems to overcome the shortcomings for the broad applications of EVs. Benefiting from high energy density and being environmentally friendly, the lithium–sulfur battery (LSB) is regarded as one of the most promising candidates for use in the further development of EVs [6]. Unfortunately, this technology has still not been industrialized for EVs, because there are some severe restrictions such as low coulomb efficiency, self-discharge, and dissolution of polysulfides, resulting in rapid capacity fading [7,8,9,10]. It is worthy to note that the low specific volumetric energy density of the LSB is also a great bottleneck for its applications in EVs. Extensive studies have been devoted to solutions for these challenges. Graphene and reduced graphene oxide have been employed to confine the sulfur in its thin-film layers, thus trapping the polysulfides from dissolution [11,12,13,14,15]. Adding conductive additives including carbon black and carbon nanotubes in cathode materials has proven to be an effective way in overcoming the low conductivity problem [16]. Depositing nano sulfur on graphene layers and formulating a passivation layer on the surface of the anode can improve the coulombic efficiency and low-capacity fading [17,18,19,20].
However, experimental improvement and validations for battery applications are very tedious, time-consuming, and expensive. To expedite the LSB uses in EVs, it is essential to evaluate the effect of these limitations and further explore solutions. Modeling could be a powerful method to bridge the lab research of batteries and electric vehicle technology development, which not only plays an important role in scaled-up lab prototypes and practically applicable devices, but also identifies some critical bottlenecks and solutions for optimization of the prototypes, even shedding light on the development of some fundamental sciences in energy conversions. Battery modeling has been studied over many years, and in particular, electrochemical and equivalent circuit models have been extensively studied [21,22] with a focus on parameter identification to improve the accuracy of the models [23,24,25]. A variety of models have been established for different tasks. Li et al. built a model to investigate all the dynamic characteristics of a battery from nonlinear open-circuit voltage, current, temperature, and storage time dependent capacity to transient response [26]. Chen et al. presented an online model to estimate the battery state of charge (SOC) in terms of online-identifying the open-circuit voltage (OCV) and the intrinsic relationship of SOC versus OCV for eventually predicting the running time in EV operation [14]. To understand the environmental sustainability performance of the LSB in EV applications, a life cycle assessment (LCA) model was built for comprehensive environmental impact estimation of the LSB in actual EV applications [13]. For new battery technology such as the LSB, an accurate model could greatly help to predict the battery performance in EV applications and guide the research direction in the lab for the optimization of key factors.
The LSB is a quite a new energy resource for potential EV applications and thus has many scientific and technological problems to be investigated and solved. Modeling and simulation are very important and are widely used in automotive vehicle and system development. Therefore, we believe that an intensive and systematic investigation of modeling LSB EV applications could speed up the development of LSBs for industrialization and commercialization. In this study, a closed-loop modeling method was established to bridge lab research and scaled-up development for new battery technology in EV applications. We conducted verification of the prediction reliability of the closed-loop model by comparing model prediction and a real prototype vehicle, showing a variation value less than 3% and confirming the applicability for further study of LSB applications in EVs. Then, we further input our tested data of the LSB and LIB cells, especially some experimentally determined critical parameters, into the proven accurate model for simulation to predict LSB performance during EV operations under various driving cycles as well as fast-charging behavior. The simulation results showed that LSBs work well in electric passenger vehicles. Nevertheless, sulfur and its various discharge/charge products including intermediates (Li2Sx, x = 1–8) possess poor ionic and electronic conductivities, which increase the internal resistance of the battery very much [27]. Consistently, based on our configuration and testing, the internal resistance of the LSB pack is extremely higher than that of the LIB, thereby, the former has more obvious output voltage oscillation and more power and energy loss for automotive applications. Accordingly, the LSB takes a much longer time for a full charge than the LIB. This work vividly demonstrates the power of model simulation with uses of lab research data for the scaled-up development of applications while guiding further research and development directions.

2. Materials and Methods

2.1. Simulation Method

This work presents a closed-loop modeling system using lab research results to simulate the LSB in scaled-up electric vehicle applications for the first time. The LSB-based loop model was built with a battery model, driver model, and vehicle dynamic model through the equivalent circuit principle, vehicle driving force balance principle, and speed feedback mechanism. The system is schematically illustrated in Figure 1.

2.2. Battery Modeling

Electrical equivalent circuit networks [15,17,18] were used to establish the battery model as depicted in Supplementary Figure S1, in which uocv is the open-circuit voltage of the cell, r0 represents the internal resistance, and uout reflects the output voltage when a cell is connected to the system. A widespread coulomb-counting method was selected, and the SOC can be estimated by integrating the load current (I); thereby, the used capacity (cap) and that remaining can be monitored online [17].
The key parameters for the battery management system (BMS) can be defined as
SOC = SOC 0 t 0 t I / cap
where SOC0 is the initial SOC, and uout can be figured out from Supplementary Figure S1:
u o u t = u o c v I r 0
where uocv is a function of SOC:
u o c v = f o c v S O C
and r0 is a function of temperature (T) and SOC:
r 0 = f r T , S O C .

2.3. Vehicle Modeling

Vehicle modeling and simulation can be carried out to efficiently analyze the performance of electric vehicles and their subsystems in various driving conditions, and they have been widely used in the automotive industry. Herein, a vehicle model with a sub battery model was built to investigate the battery’s attributes in the electric vehicle application scenario and to distinguish the LSB and LIB through comparison. For the electric vehicle, the force analyses are shown in Supplementary Figure S2; the force condition of an electric vehicle can be described by the equation below:
F t = F f + F w + F i + F j
where F t is the driving force and F f ,   F w , F i ,   and   F j are the rolling, air, gravity, and acceleration resistances, respectively. These can be expressed as:
F f = m · g · f r
where f r is the rolling friction coefficient:
F w = C D A 21.15 V a 2
where 21.15 is a conversion factor of m/s to km/h, thus resulting in an air density of 1.209 kg/m3.
The force of gravity along the ramp as a grade resistance can be written as
F i = m · g · i .
Acceleration resistance, a force used for overcoming the inertia of its mass during vehicle acceleration, is in the form of
F j = δ · m d V a d t .
Driving force ( F t ) is actually the sum of various vehicle driving resistances that can also be expressed as
F t = T m · i 0 · η T r = m · g · f r + C D A 21.15 V a 2 + m · g · i + δ · m d V a d t .
Rotating mass conversion factor δ is used for converting the inertial resistance of rotating mass into translational inertial resistance, which can be defined as
δ = 1 + I w m r 2 + I f · i g 2 · i 0 2 · η T m r 2 .
For a middle-sized EV, the conversion factor can be simplified as
δ = 1 + 4 I w m r 2 + I m · i 0 2 · η T m r 2 .
The rolling resistance, air resistance, grade resistance, and the driving force modeled in the software are shown in Supplementary Figure S3.
Furthermore, a driver model was built to control the acceleration and brake pedals to simulate the instantaneous driving and braking forces that are required to overcome the aerodynamic, rolling, grade and inertia resistances, in order to adjust the actual vehicle speed to follow the target speed defined by the driving cycles, NEDC (New European Driving Cycle), WLTC (World-wide harmonized Light duty Test Cycle) and HWFT (Highway Fuel Economy Test) as depicted in Supplementary Materials Figure S4.

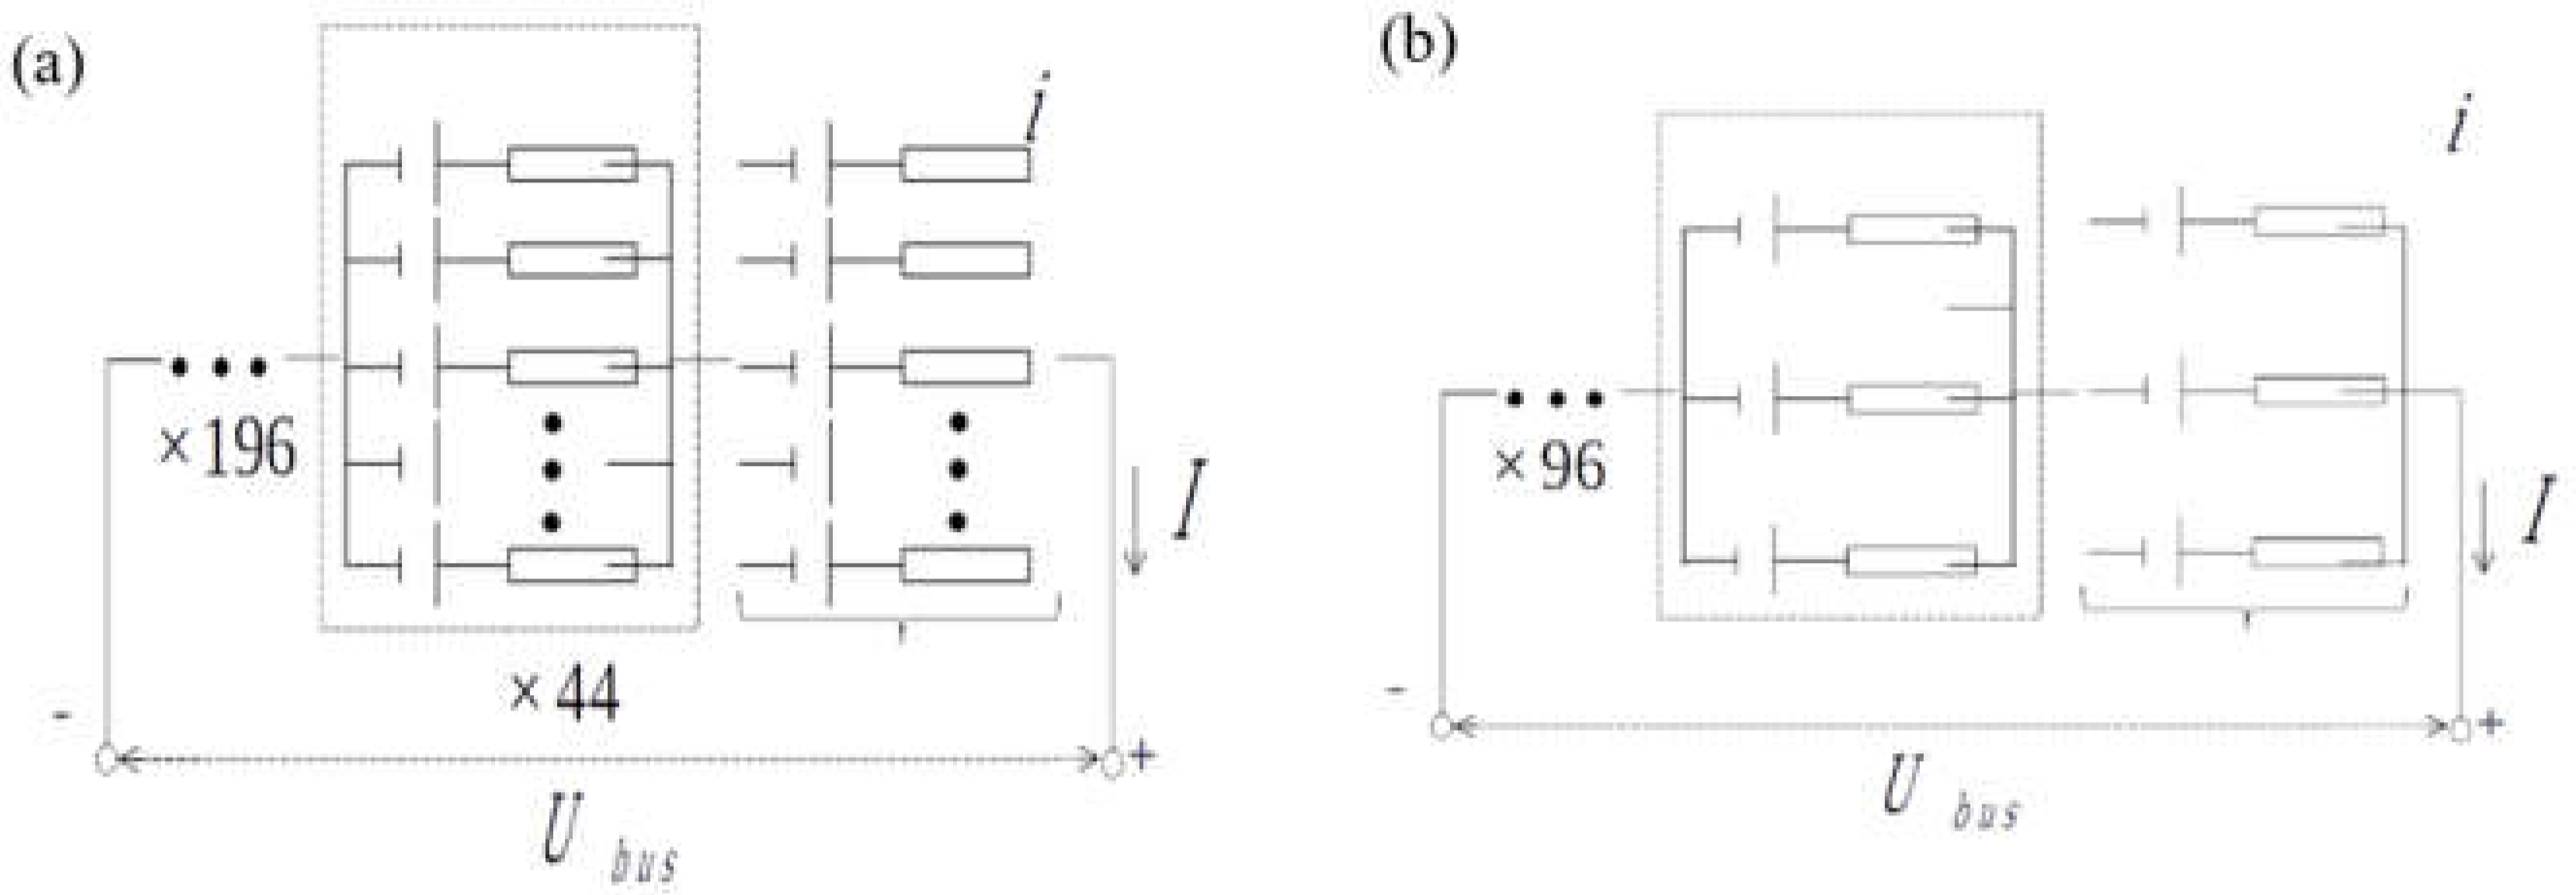
2.4. Battery Configuration

For scaled-up modeling of the LSB applications along with NCM (Ni, Co, Mn) LIB, both types of battery packs were configured with a similar energy of 60 kWh. The cells for the two types of packs were 50 Ah and 3.3 Ah, respectively, similar to the technical specifications used in industry and published studies [19,20]. The active material weight, sulfur loading, and lithium excess to active material in the LSBs were 15.7356 g, 48.64 g/m2, and 0.5 g, respectively, while the ratio of the electrolyte-to-sulfur loading was 3.997. Since LSBs have not been industrialized, their real battery packs have not been constructed. In the modeling work, they were designed and configured based on the lab results of cells. The designed configurations are presented in Figure 2a,b, in which both the LIB and LSB packs are a combination of single cells in mixed series and parallel. The pack output power is decided by ubus, which is the sum of the uoutt of all cells. Table 1 summarizes the technical information of the two battery packs.

2.5. Vehicle Configuration

The EV (electric vehicle) in which the LIB and LSB packs were configured to power was mid-sized, and the vehicle’s basic parameters are displayed in Table 2.

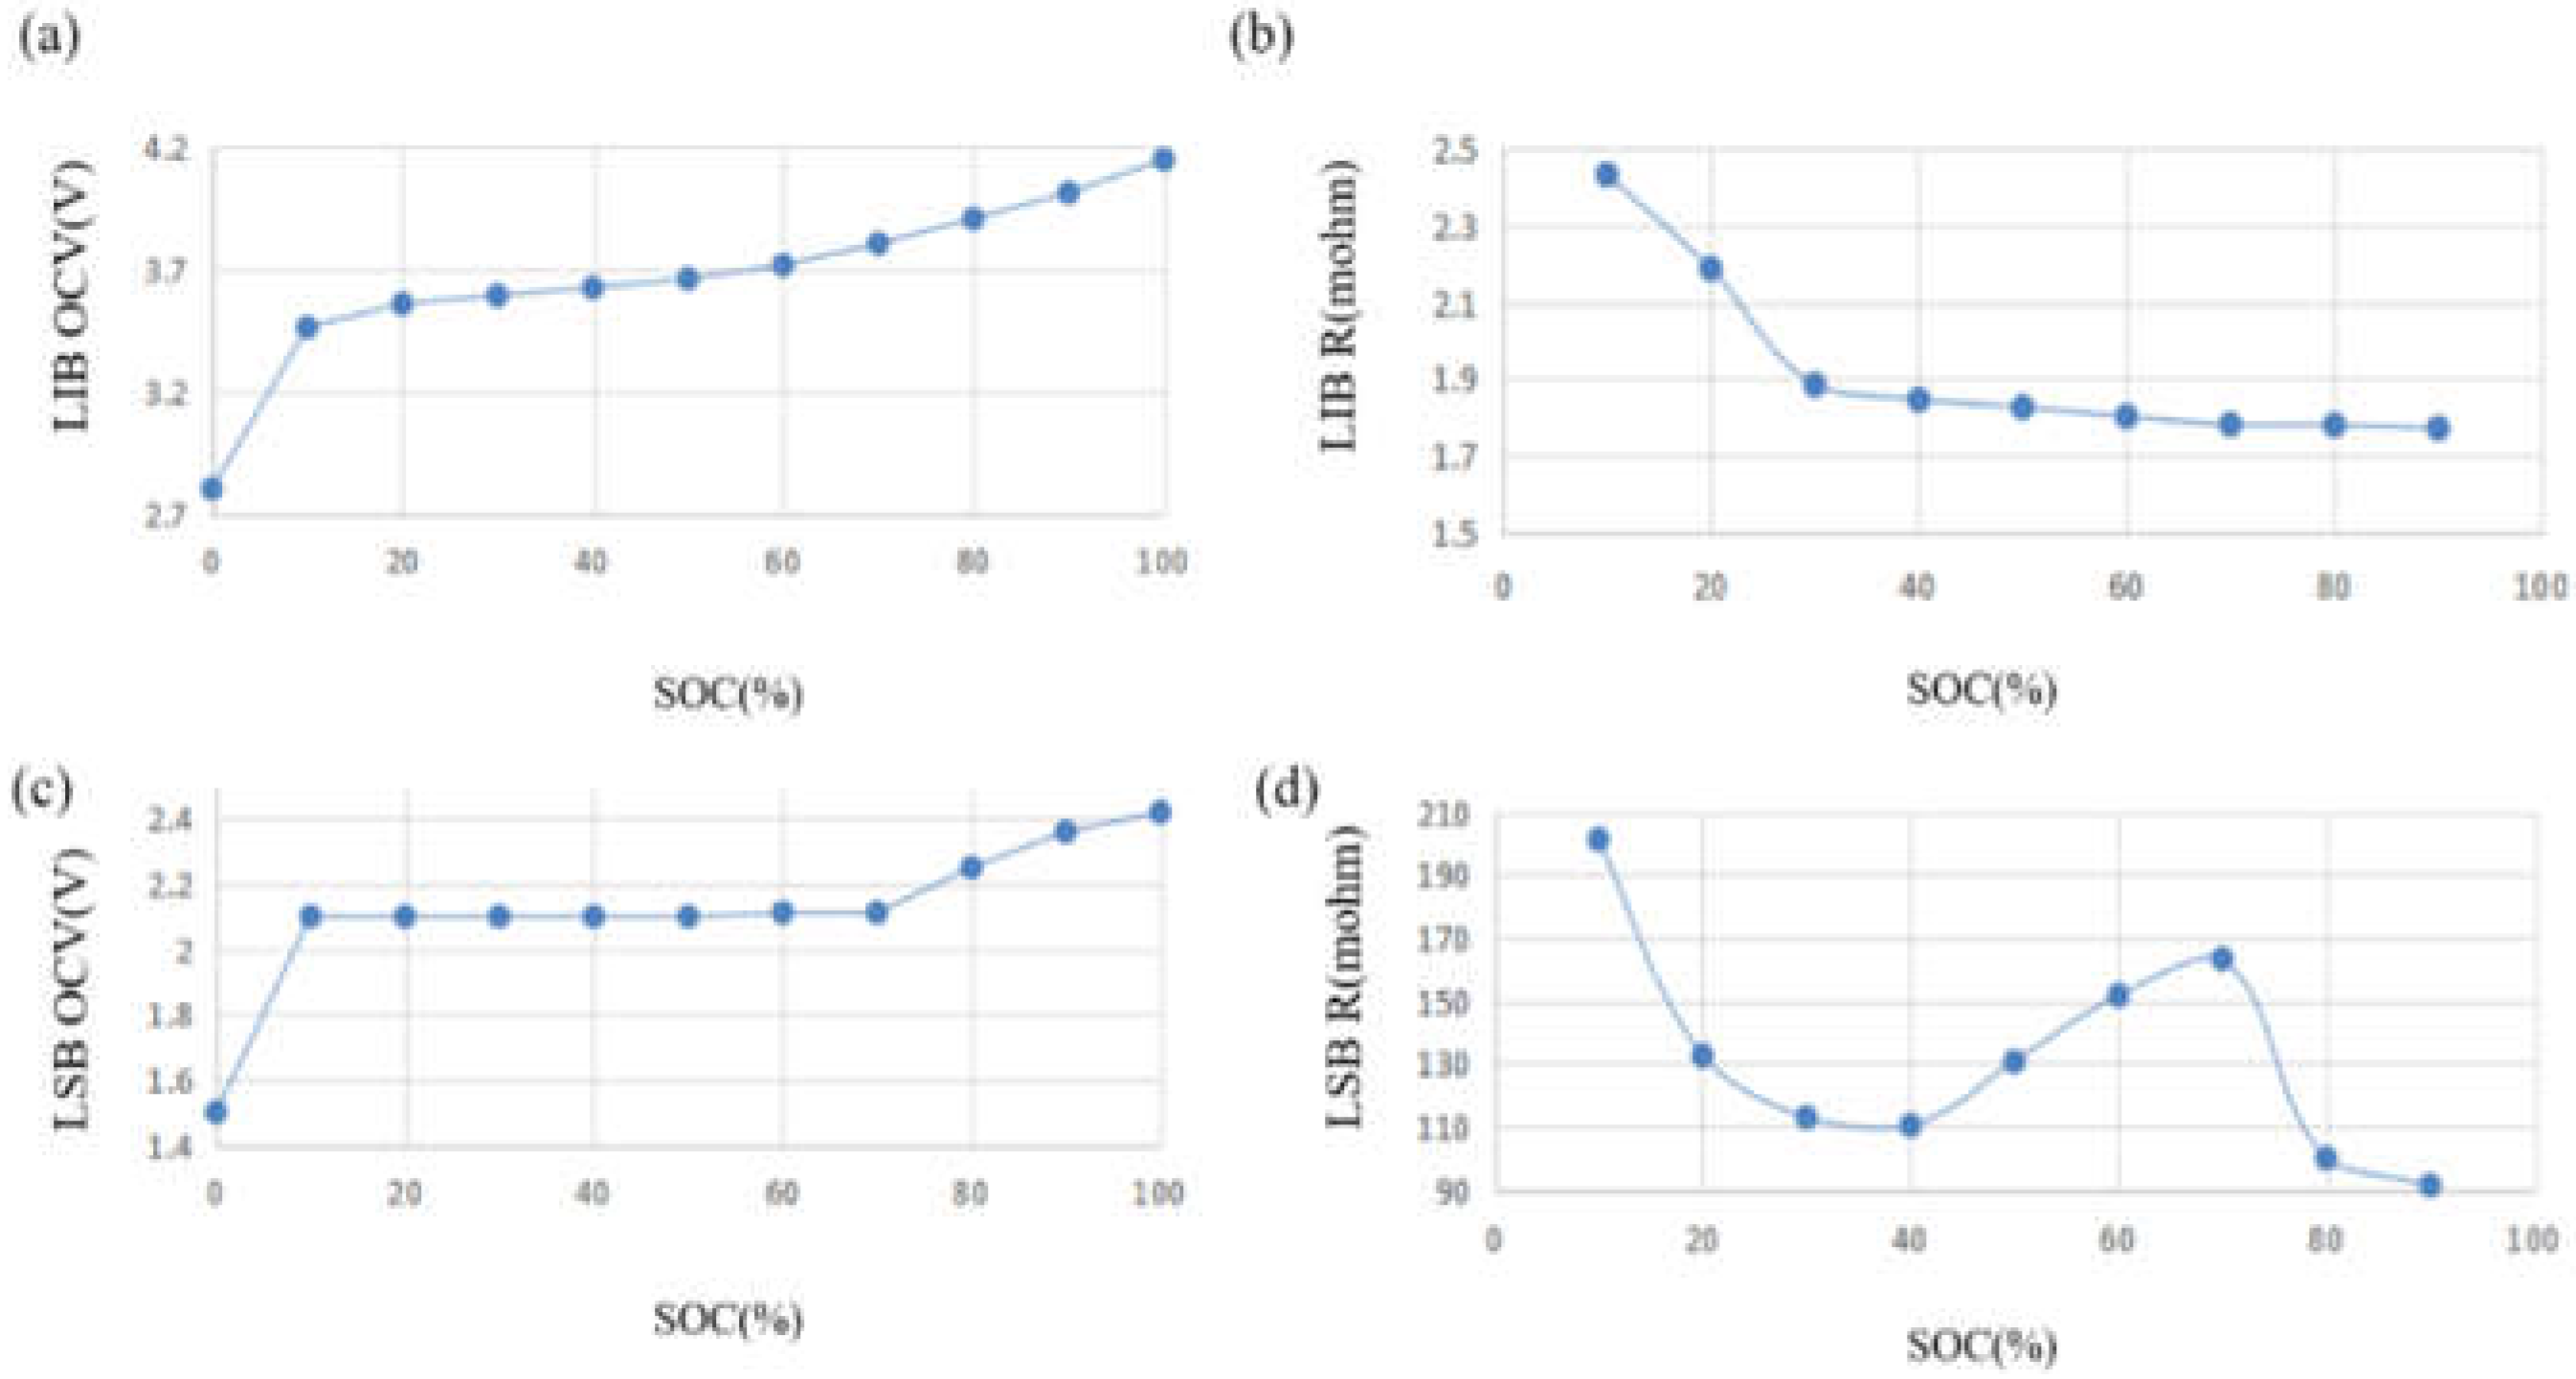
2.6. Test and Parameter Identification

A PEBC05-500 tester connected with both the LSB and LIB for the experiments is depicted in Supplementary Figure S5. The experiment started at a full-charge state and was carried out by applying various discharge currents to measure the voltage until the terminal voltage dropped below the cutoff voltage. The NCM LIB and LSB voltage platforms were 2.5–4.5 V and 1.5–2.6 V, respectively. Accordingly, the parameters of the cells including OCV and r0 at room temperature were recorded at different SOC levels. The test results are shown in Figure 3. It is noted that Figure 3d exhibits a sudden increase in resistance from 40 to 70% SOC for LSB. Theoretically, a battery internal resistance is the sum of the liquid phase (electrolyte) and solid phase (electrode) resistance. The sudden increase in resistance is very likely to result from the poor conductivity of the sharply increased various charge products including intermediates (Li2Sx, x = 1–8) [27]. However, when SOC becomes deeper, the high order Li2Sx forms with better conductivity, decreasing the resistance. Similar resistance–vibration phenomena have been reported in previous reported works [18]. Furthermore, Figure 3b,d shows that the internal resistance of LSB was much higher than that of LIB, which apparently can be ascribed to the same reason as discussed above. Nevertheless, it is noteworthy that the testing was conducted on a 3 Ah LSB battery cell and 50 Ah LIB cell, so an accurate resistance difference between two kinds of batteries should be obtained after configuring the cells to battery packs with comparable energy.

2.7. Pack Parameter Identification

The cell parameters’ OCV and r0 at different SOCs were measured, which were identical to that of the previously reported LSB pouch cells [17,18,19]. The test results for both the LSB and LIB cells are illustrated in Figure 3. The voltages of the LSB pack configuration in Figure 2 can be presented as
U L S B   p a c k = 1 196 u o u t
and the LIB pack voltage as
U L I B   p a c k = 1 96 u o u t .
From Equations (13) and (14), the voltage platforms for the LIB and LSB packs were 268–384 V and 290–470 V, respectively. However, the internal resistance, r0, of the former was 100 times higher than that of the latter. The pack levels of the LSB with a mixed configuration of 196 in serial and 44 in parallel was still 10 times higher than that of the LIB pack with the same configuration. The data obtained above were employed in the closed-loop model to simulate and compare the performance of the two battery systems for three driving cycles and a fast-charge feature.

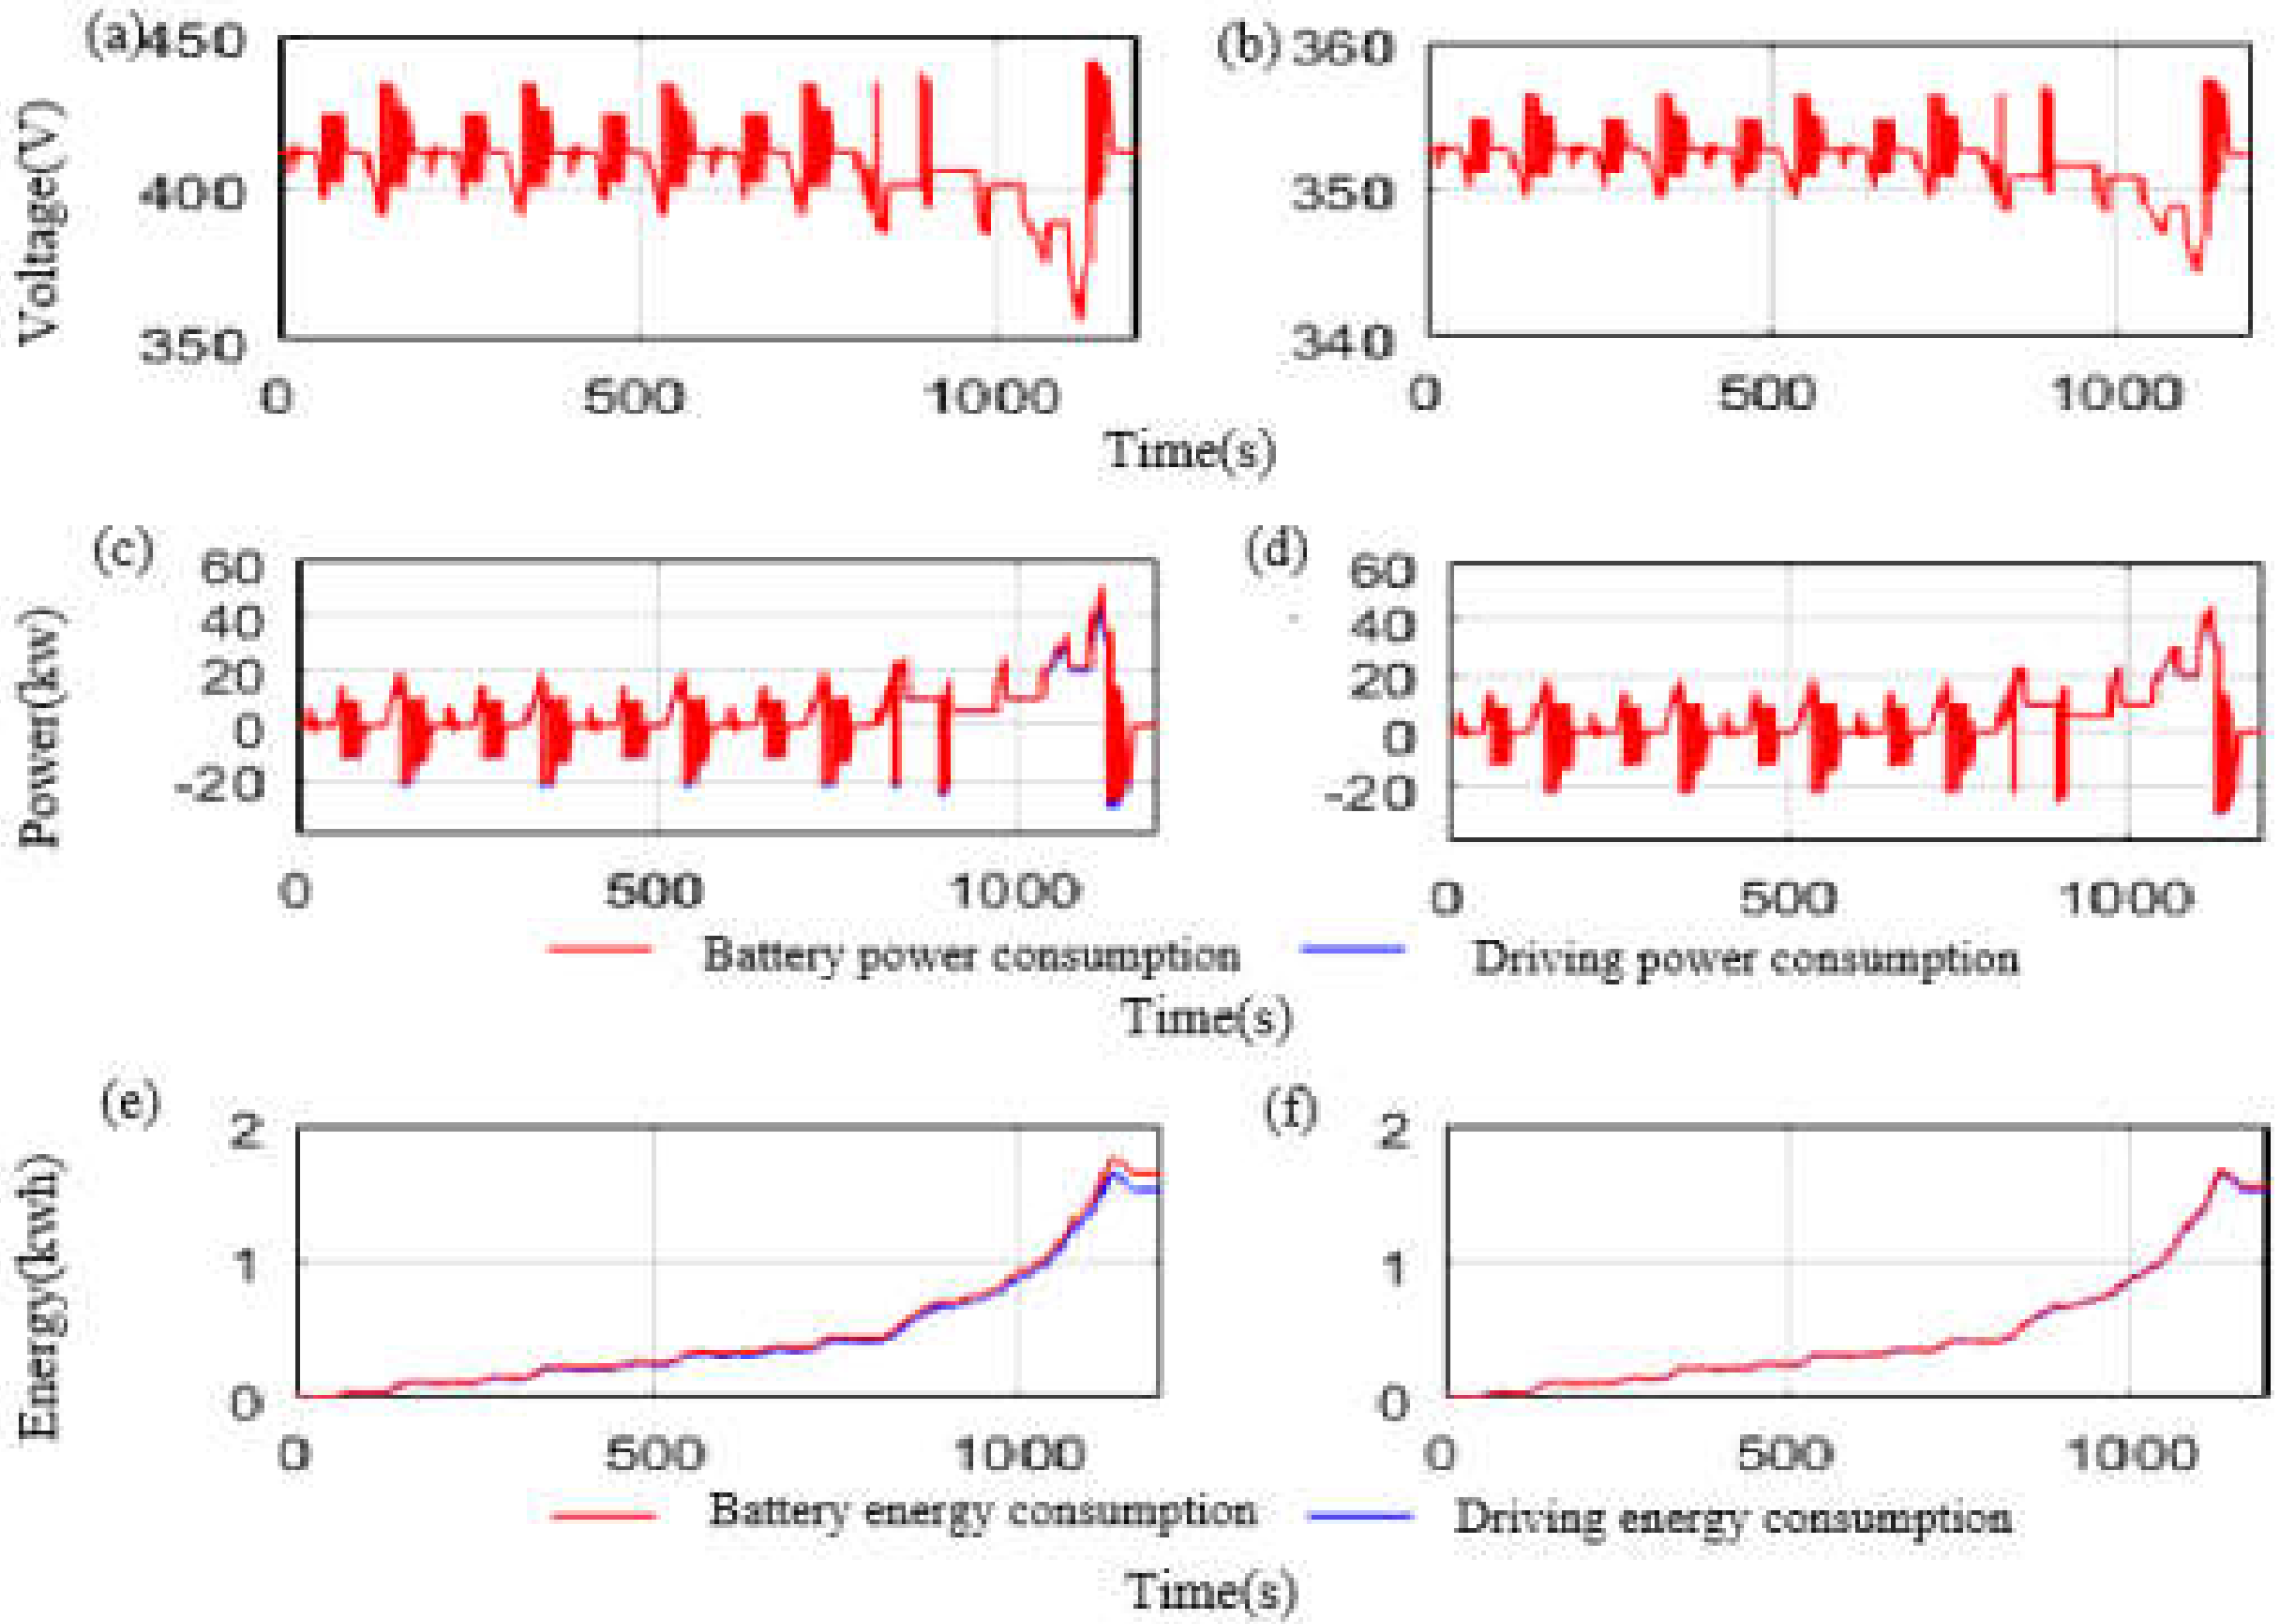
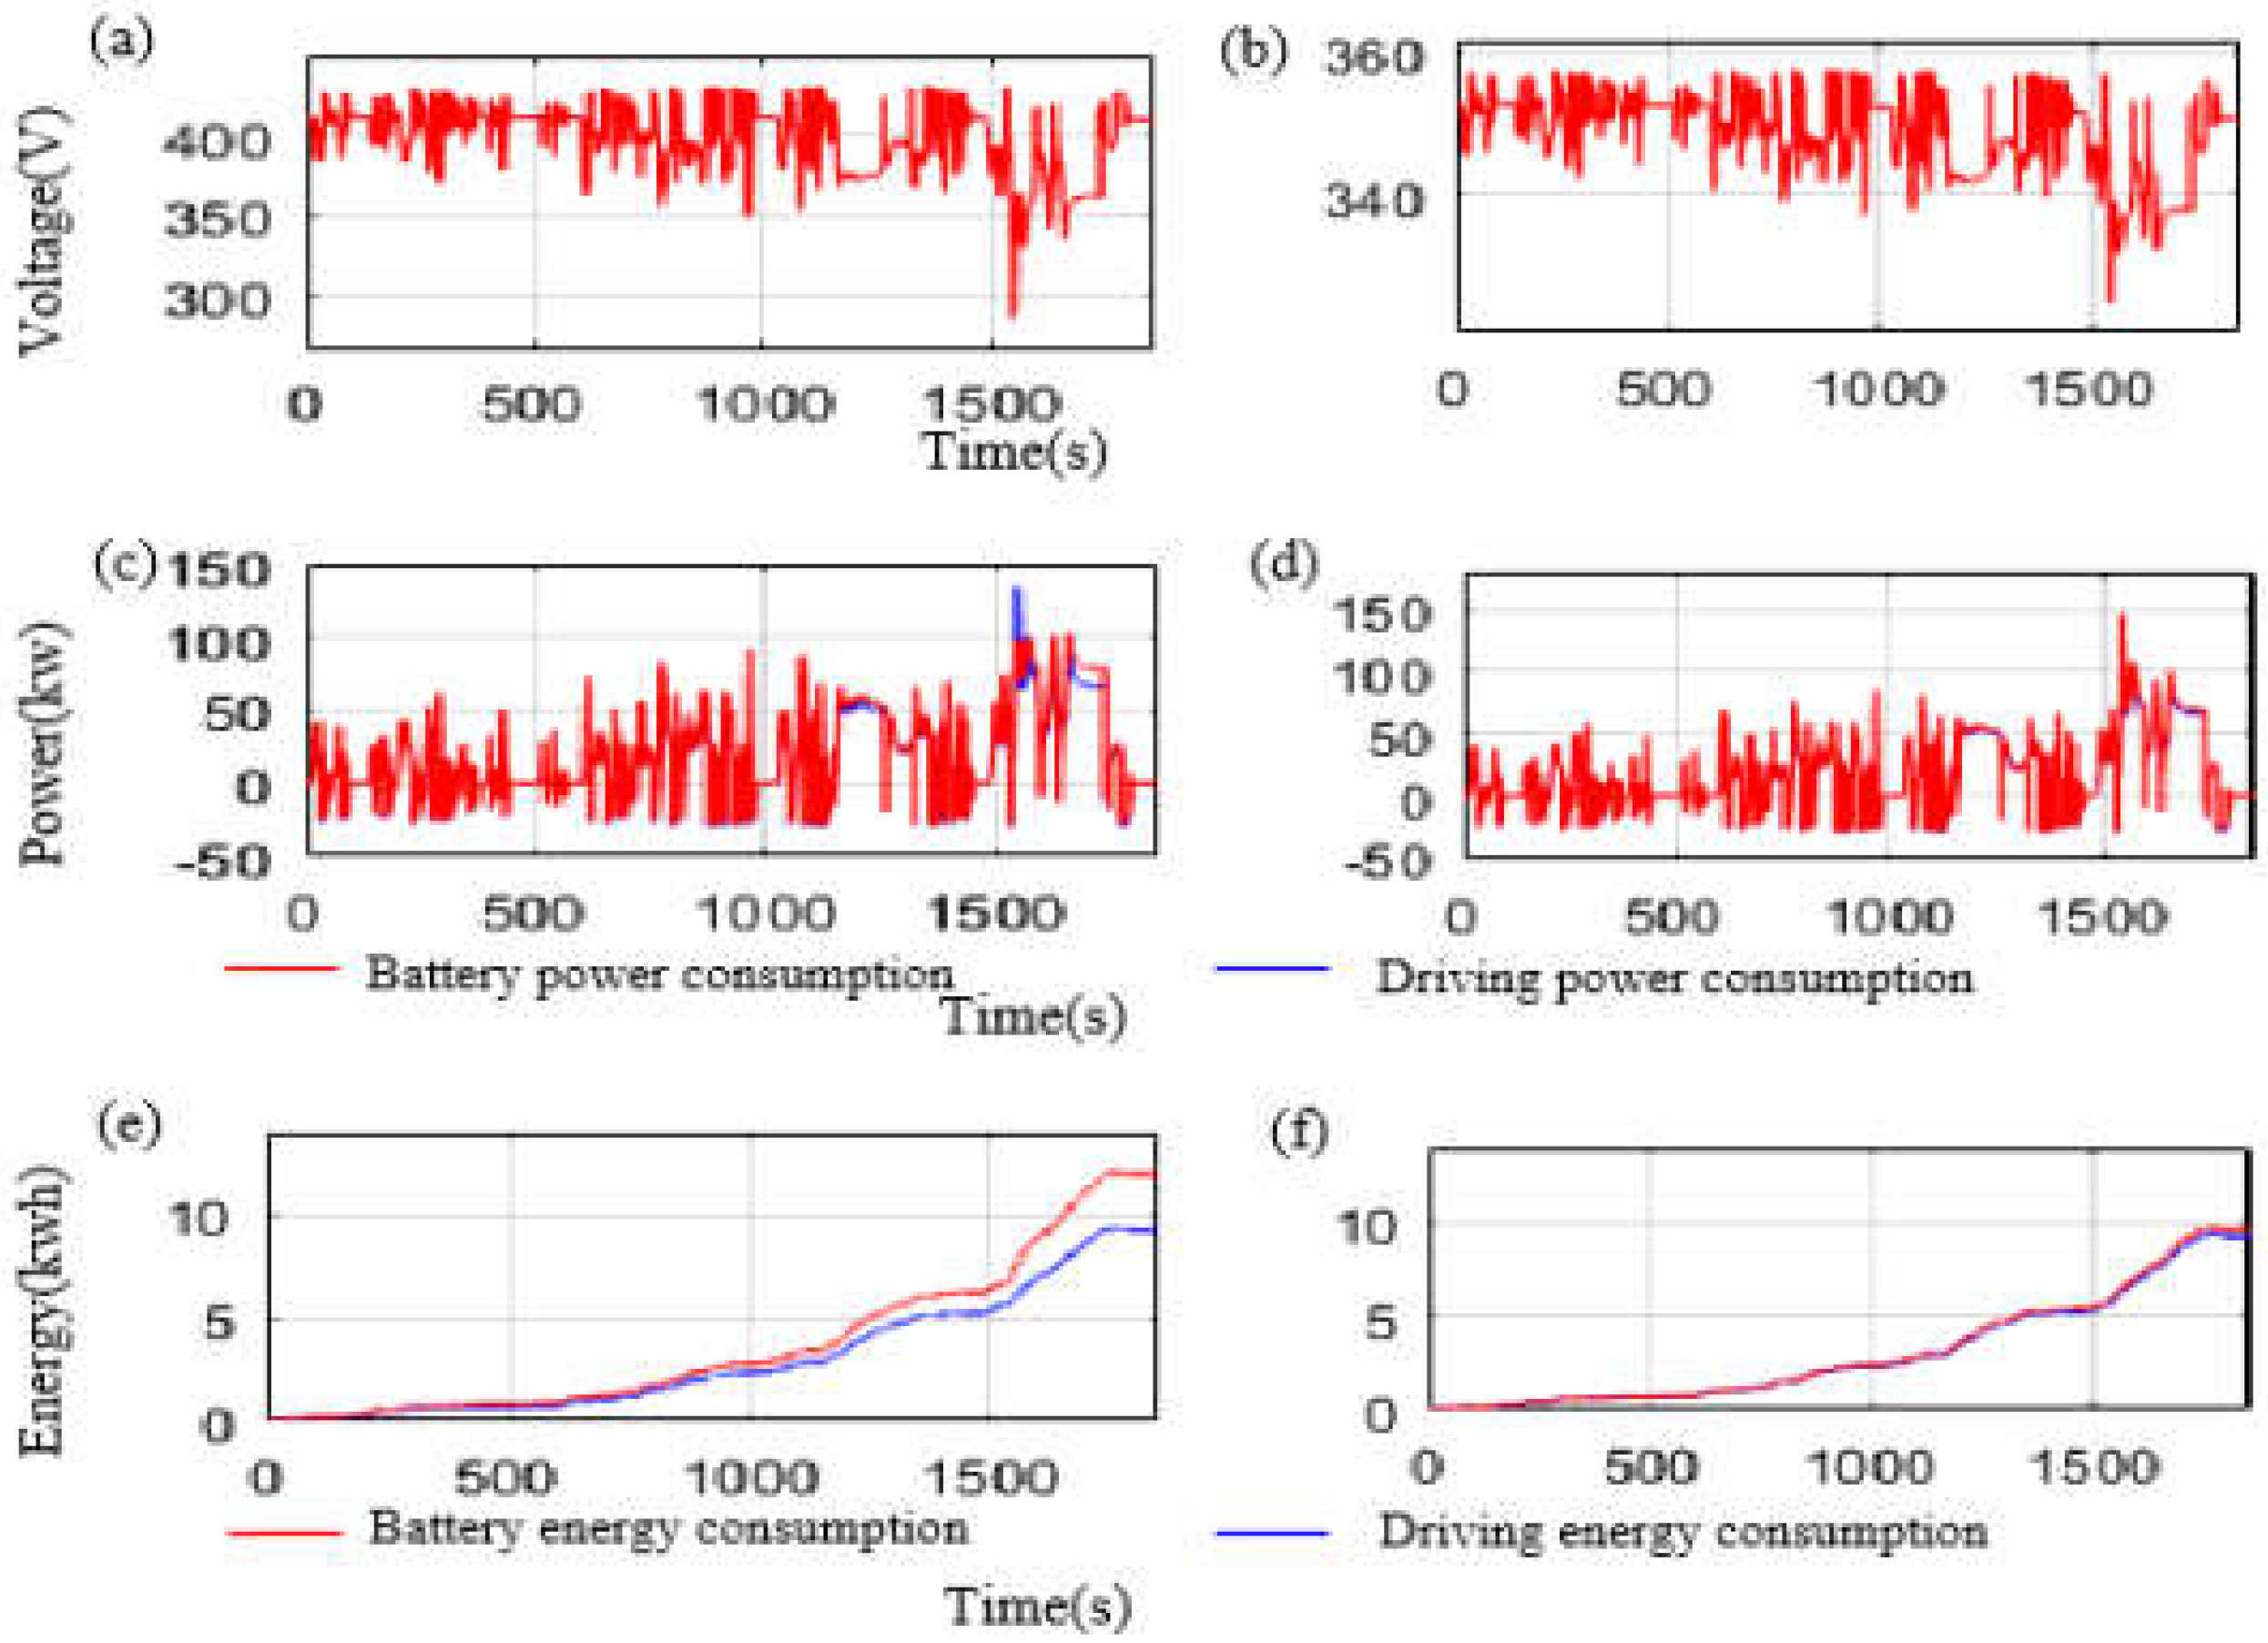
2.8. Model Accuracy Verification

Before the application of a model, its accuracy should be verified to confirm the closeness to a real vehicle. A comparison testing was executed separately with the real prototype vehicle and the simulation model. We used the same driving and charging cycles for both the real prototype vehicle and the simulation model to characterize the battery performance and parameters changed during charging and discharging, and then we analyzed the variations between the real vehicle and the simulation model for evaluating the model reliability. A vehicle dynamometer was used for the real vehicle testing (Supplementary Figure S6). The driving condition and charging condition were set up for the comparison testing. Battery voltage, SOC, and current were recorded and analyzed to evaluate the matching degree between the model and reality, as shown in Supplementary Figure S7.
The difference ratio between the model and reality is defined as
Difference Ratio = 0 t V a l u e m o d e l V a l u e v e h i c l e V a l u e v e h i c l e 2 t   100 %
Using Equation (15), the difference ratio between the simulation model and the real vehicle is summarized in Supplementary Table S1. It clearly shows that the simulation model has high accuracy with the real tested pack, thus proving that this model can be used to reliably predict the battery performance in real vehicle application to provide valuable research, optimization, and scaled-up fabrication information for LSBs.

3. Results and Discussion

Based on the battery lab tests and simulated parameters, the internal resistance level of the LSB pack was around 10 times higher than that of the LIB. The internal resistance has a great influence on LSB applications in an electric vehicle. In an electric vehicle operation, the electric load of the battery pack contains the electric power-train system and other electric auxiliaries such as DCDC, air compressors, etc. The battery output voltage is the actual voltage, uout, applied on the electric load. For certain vehicle drive cycles, the electric load usage was determined; however, the uout applied on the electric load is affected by the difference in internal resistance. Equation (2) can be used to explain the internal-resistance-effect mechanism, in which the deviation of uout from uocv is directly related to the internal resistance, r0, and a large internal resistance will increase the voltage variance between uocv and uout, resulting in an unstable output voltage on the vehicle’s electric load, which would shorten the service life of the auxiliaries.
Considering the efficiency from the electric vehicle system level, the power and energy usage on the electric load (power-train and auxiliaries) is battery-effective work. The effective work power, Pout, and the effective energy, E o u t , can be determined by Equations (16) and (17), respectively:
P o u t = u o u t · I
E o u t = P o u t .
Meanwhile, the internal-resistance-generated heat is useless work for the electric vehicle, and the battery power loss, P l o s s , and useless heat energy, E l o s s , are expressed in Equations (18) and (19), respectively:
P l o s s = I 2 · r 0  
E l o s s = P l o s s .
For certain drive conditions, Pout is determined by the power demand of the vehicle, which is affected directly by the battery internal resistance. It has been found that a larger internal resistance causes larger battery power loss and battery energy loss. Simulations were conducted to analyze the operation performance of the LSB and the LIB in an electric vehicle application for three typical driving conditions. In all driving cycles, namely the NEDC, WLTC and HWFT, the gradient was 0.
The NEDC was chosen as the first simulation condition. As shown in Supplementary Figure S8a [28,29], the entire driving cycle (total time, 1180 s) included urban driving cycles (UDCs) and extra-urban driving cycles (EUDCs). The first 780 s was the UDC (maximum speed 50 km/h), and the next 400 s was the EUDC (maximum speed 120 km/h). This driving cycle has been widely used to test vehicle energy consumption, emissions, and driving range [30,31,32].
Figure 4a,b exhibits the voltage variation curve under the NEDC for the LSB and the LIB, respectively, indicating that the charge and discharge voltage output of an EV battery increases and decreases, respectively, due to internal resistance. A large battery internal resistance causes a sharp voltage vibration. Since the LSB has a larger internal resistance, it experienced a more severe voltage vibration (from 359.9 to 441.5 V) in comparison to the LIB (344.9–357.5 V). It can be concluded that the high LSB internal resistance, and resulting unstable output voltage, is one of the main obstacles for the LSB’s electric vehicle application.
During the driving-cycle simulation, the battery power and energy to overcome all the mechanical drag force were defined as driving power/energy, while the internal-resistance-resulting power and energy loss was ascribed to battery power/energy loss. In reality, the usage of battery power and energy contains driving power/energy and power/energy loss. Hence the gap between the driving power and the battery power at certain time points is the battery power loss, and a cumulative energy loss indicated by the gap between driving energy consumption and battery energy consumption can vividly indicate the battery performance in EV applications.
NEDC simulation results for the power consumption of the LSB and LIB in Figure 4c,d, respectively, indicate that the LSB had an obvious larger power loss during vehicle driving, and the peak loss of the LSB during the NEDC cycle was 9.2 kW at 1120 s, while that of the LIB was 1.2 kW at 1121 s. The simulation energy consumption by the end of the NEDC driving cycle at 1200 s is shown in Figure 4e,f for the LSB and LIB, respectively, revealing that the driving energy consumption and battery energy consumption for the LSB were 1.526 kWh and 1.646 kWh, respectively, in other words, a battery energy loss of 0.12 kWh, while for the LIB, they were 1.542 kWh and 1.558 kWh, respectively, a battery energy loss of 0.016 kWh. This simulation clearly indicated that the LSB had a very notable battery energy loss, which was much higher than that of the LIB.
The WLTC was the second driving cycle for the simulation analysis. The WLTC adds real road emissions requirements and significantly strengthens evaporative emissions control, which is closer to the realistic vehicle driving condition, and thus is a very important driving condition to evaluate the power-train system and is referred to by many vehicle test standards [33,34,35]. The WLTC speed curve is shown in Supplementary Figure S8b, and the simulation voltage curves under the WLTC for the LSB and LIB in Figure 5 reveal that the LSB underwent an extremely more severe output voltage vibration (288.2–440.9 V) than the LIB (324.5–357.1 V), and was also worse than that under the NEDC, as the WLTC has more frequent driving and braking demand change [36]. The results showed that the LSB’s unstable voltage caused by a large internal resistance becomes worse in more aggressive driving conditions.
Figure 5c,d shows the WLTC simulation of the power consumption for the LSB and LIB; the gap between driving power and battery power at certain time points indicates the battery power loss. Figure 5c,d indicates that the LSB had an obvious power loss during vehicle driving; the peak power loss during the WLTC was 19.4 kW at 1648 s, while the peak power loss of the LIB battery was 3.8 kW at 1652 s. The energy consumption during the WLTC is shown in Figure 5e,f; by the end of the WLTC, the driving energy consumption was 9.521 kWh, the battery energy consumption for the LSB was 11.98 kWh, with a battery energy loss of 2.459 kWh, while the energy consumption for the LIB was 9.277 kWh, with a battery energy loss of 0.056 kWh. Under the aggressive acceleration/deceleration defined by the WLTC, the large LSB internal resistance created more significant power loss and energy loss, significantly reducing the electric vehicle energy efficiency. Finally, the HWFT cycle was used for this simulation to observe the battery performance under a continuous high-speed driving condition. The HWFT cycle is a chassis dynamometer driving schedule developed by the US EPA for light-duty vehicles. The speed curve of the HWFT cycle is shown in Supplementary Figure S8c.
The LSB and LIB were further simulated using the HWFT cycle with an aggressive acceleration operation, thereby consuming a large current to result in an extremely severe output voltage vibration for the LSB (310.1–441.3 V), a much larger value than that of the LIB (339.7–357.6 V) in Figure 6a,b. Figure 6c,d discloses that the LSB had an obvious power loss during highway driving, and the peak power loss during the HWFT was 28.1 kW at 10.3 s, while the power loss for the LIB battery was only 6.2 kW at 10.1 s during the fast acceleration of the vehicle. The driving and battery energy consumptions by the end of the HWFT cycle, shown in Figure 6e,f, were 2.098 kWh and 2.334 kWh, respectively, for the LSB, there was a battery energy loss of 0.236 kWh, while they were 2.136 kWh and 2.174 kWh, respectively, while for the LIB, there was a battery energy loss of 0.038 kWh, clearly symbolizing that the LSB had a very notable battery energy loss in the HWFT cycle, further confirming its notable internal resistance.
Supplementary Figure S9 summarizes the voltage oscillation, peak power loss, and total energy loss comparison between the LSB and the LIB. Due to its large internal resistance, the output voltage of the LSB is affected sensitively by unstable output voltage and more power loss, worse than that of the LIB.
To evaluate the LSB performance during fast charge, a charging simulation was set up to observe the potential charge capability for EV. A fast-charge simulation strategy was designed as in the following List:
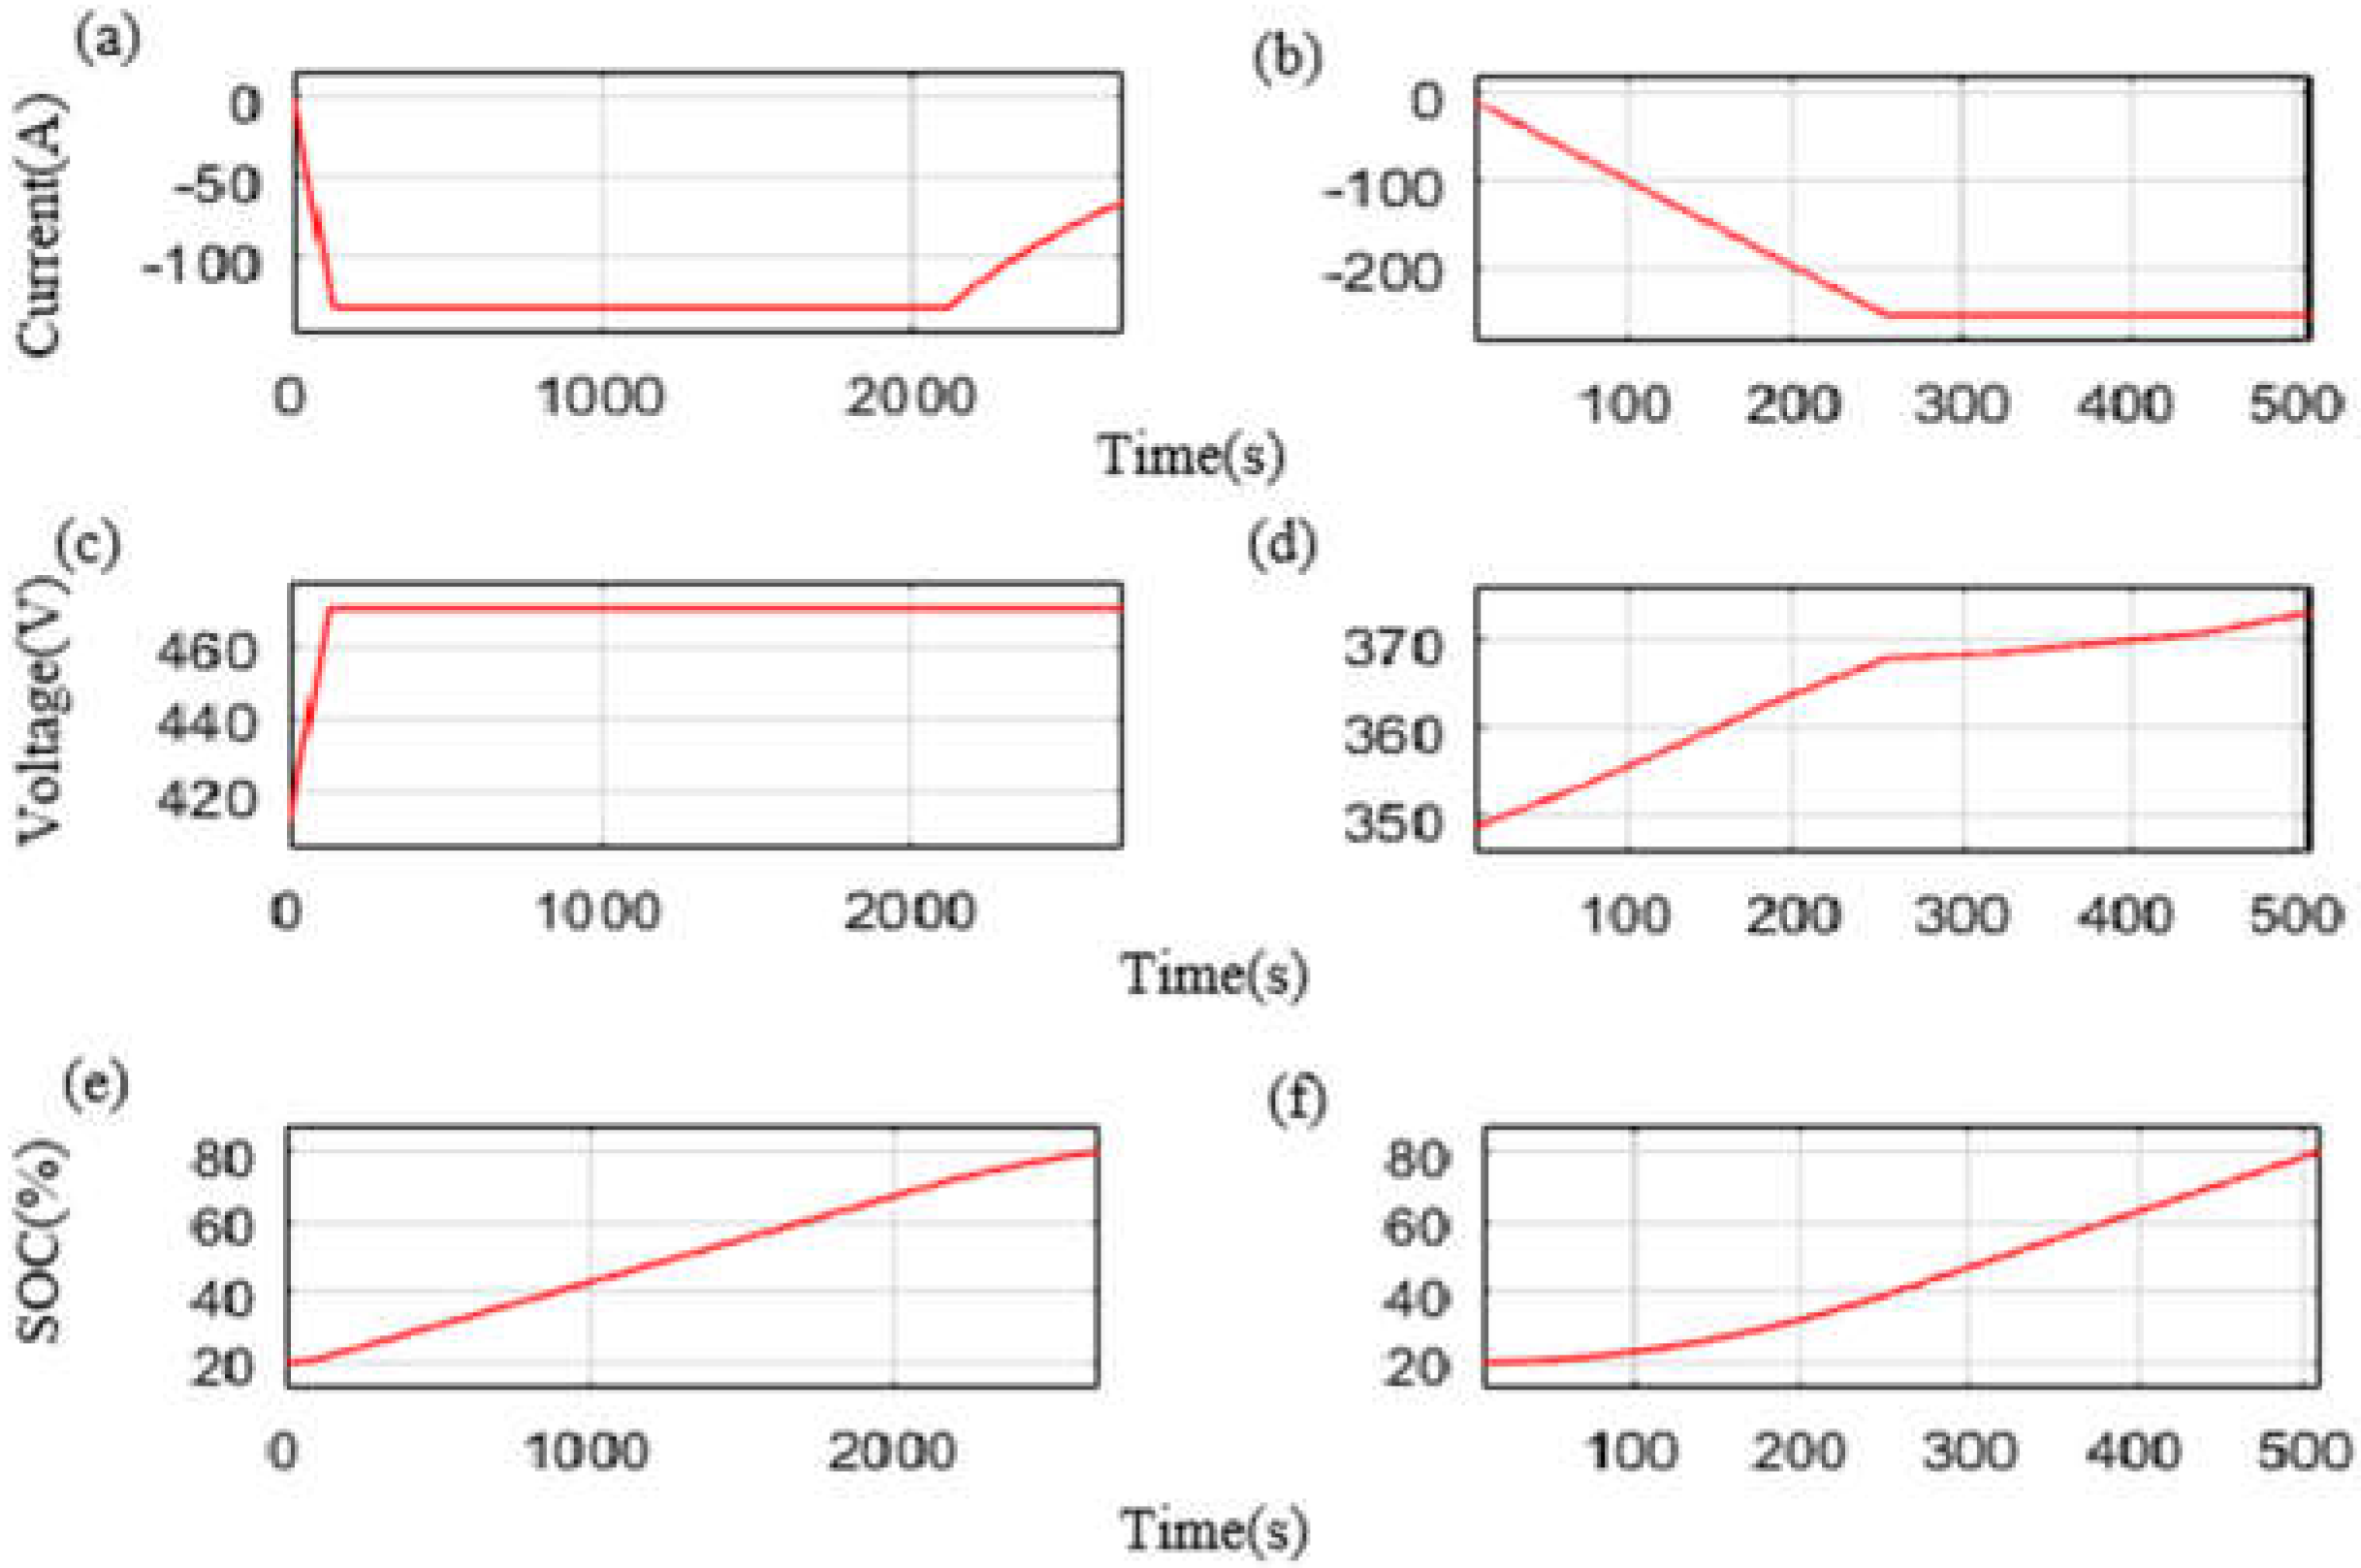
  • Charge start: start the charge when the battery SOC is 20%.
  • Charge current ramp: ramp the charge current 1 A per second, until the charge current reaches the configured constant-charge current value.
  • Constant current charge: continuously charge with the configured current and decrease the charge current accordingly to avoid the battery output voltage reaching the voltage limit.
  • Charge stop: when battery SOC reaches 80%, stop charging.
The fast-charge simulation results for the LSB are shown in Figure 7a–e. In a previous analysis, it can be noted from Equation (1) that the large internal resistance will raise the output voltage variance. Under certain fast-charge currents, the output voltage of the LSB increases more easily to reach the voltage limit because of its 10 times higher internal resistance compared to the LIB, and its charge current has to be limited to avoid the output voltage exceeding its limit threshold. To avoid exceeding the battery voltage limit (470 V), the charge current was set to 131 A for a constant current charge after the SOC reached 70%, at which point the OCV platform began to rise and the charge current had to be reduced for the voltage below the battery limit. Using this fast-charge strategy, it took 2681 s to charge the LSB from SOC 20% to SOC 80%. The fast-charge simulation results for the LIB battery are shown in Figure 7b–f. The charge current could be set to 255 A for a constant current charge, the LIB battery could be charged to 80% SOC with a 255 A constant voltage, and the battery voltage never exceeded the voltage limit (384 V) during the entire charging process. It took 508 s to charge the LSB from SOC 20% to SOC 80% by using the fast-charge simulation strategy. The charging simulation results are summarized in Table 3. From the simulation results, we found that the LSB’s performance was good and that the LSB could adapt to the application of an electric vehicle under mild driving conditions; however, the high internal resistance of the LSB resulted in a sharp output voltage vibration, significant loss of peak power, and energy in the aggressive driving condition, which could affect the life and safety of the electrical systems, reduce the dynamic performance, and shorten the driving range of the EV. The charging time was five times longer than for the LIB, so the LSB could not meet the fast-charging requirement.

4. Conclusions

In summary, a closed-loop modeling method was established here to bridge a new battery technology from lab research to scaled-up development for its development in EV applications. The results exhibit a small variation (2.8/2.6% voltage difference ratio, 2.9/0.6% current difference ratio, and 1.2/2.6% SOC difference ratio) in comparison to a real vehicle, indicating its high accuracy. Based on the model systems, the performed simulations under the NEDC, WLTC, and HWFT and fast-charge schedule clearly indicates that the LSB holds great promise and confidence for its applications in electric vehicles. However, the LSB has a much larger internal resistance than that of LIB, thereby generating more obvious output voltage oscillation as well as higher power and energy loss than that of the LIB, highlighting some difficulties in automotive applications. In particular, the fast charging of the LSB takes nearly five times longer than that of the LIB, impeding the LSB’s EV commercialization.

Supplementary Materials

The following are available online at https://www.mdpi.com/article/10.3390/app11209593/s1, Figure S1: Electrical equivalent circuit model. Figure S2: Vehicle force analysis. Figure S3: (a) Rolling resistance in driving model; (b) air resistance model; (c) grade resistance model; (d) driving force model. Figure S4: Driver model with driving-cycle targets. Figure S5: (a) PEBC05-500 tester; (b) LSB and LIB cells are fixed and tested in the box next to the tester. Figure S6: Vehicle testing with dynamometer. Figure S7: (a) Model and real vehicle battery current comparison in driving cycle; (b) model and real vehicle battery current comparison in charging condition; (c) model and real vehicle battery voltage comparison in driving cycle; (d) model and real vehicle battery voltage comparison in charging condition; (e) model and real vehicle battery soc comparison in driving cycle; (f) model and real vehicle battery SOC comparison in the charging condition. Figure S8: (a) NEDC speed curve; (b) WLTC speed curve; (c) HWFT speed curve. Figure S9: Comparison summarization between LSB and LIB under NEDC, WLTC and HWFY cycles. (a) Voltage oscillation. (b) Peak power. (c) Energy loss. Table S1: Difference ratio between the simulation model and the real vehicle.

Author Contributions

Conceptualization, Q.Z. and C.L.; Methodology, Q.Z., Z.Z. and J.C.; Software, Q.Z.; Validation, Y.J. and Q.Z.; Formal analysis, Q.Z.; Investigation, L.Z.; Resources, C.L.; Data curation, Q.Z.; Writing—original draft preparation, Q.Z.; Writing—review and editing, Q.Z. and C.L.; Visualization, J.C.; Supervision, C.L. All authors have read and agreed to the published version of the manuscript.

Funding

This work was financially supported by the School of Materials and Energy, Southwest University, Chongqing, China.

Institutional Review Board Statement

Not applicable.

Informed Consent Statement

Not applicable.

Data Availability Statement

Not applicable.

Conflicts of Interest

The authors declare no conflict of interest.

Abbreviations

SOC Battery’s state of charge
IBattery’s current
u o u t Output voltage of the battery cell
u o c v Open-circuit voltage of the battery cell
TTemperature of the battery
r 0 Internal resistance of the battery
F t Driving force of a vehicle
F w Vehicle’s wind drag force (air resistance)
F f Friction resistance of a vehicle
F i Gradient resistance
F j Acceleration resistance
f r Rolling friction coefficient
C d Air resistance coefficient
AFrontal area of the vehicle
V a Vehicle’s longitudinal speed
mVehicle’s mass
GAcceleration of gravity
i Slope indexes
δ Rotating mass conversion factor
I w Inertia of a single wheel
I f Inertia on the flywheel
I m Inertia of the traction motor
rWheel’s radius
i g Transmission ratio of the gearbox
i 0 Transmission ratio of the main reducer box

References

  1. Von Schneidemesser, E.; Steinmar, K.; Weatherhead, E.C.; Bonn, B.; Gerwig, H.; Quedenau, J. Air pollution at human scales in an urban environment: Impact of local environment and vehicles on particle number concentrations. Sci. Total Environ. 2019, 688, 691–700. [Google Scholar] [CrossRef]
  2. Ventura, L.M.B.; Pinto, F.D.O.; Gioda, A.; D’Agosto, M.D.A. Inspection and maintenance programs for in-service vehicles: An important air pollution control tool. Sustain. Cities Soc. 2019, 53, 101956. [Google Scholar] [CrossRef]
  3. Guo, J.; Zhang, X.; Gu, F.; Zhang, H.; Fan, Y. Does air pollution stimulate electric vehicle sales? Empirical evidence from twenty major cities in China. J. Clean. Prod. 2019, 249, 119372. [Google Scholar] [CrossRef]
  4. Tie, S.F.; Tan, C.W. A review of energy sources and energy management system in electric vehicles. Renew. Sustain. Energy Rev. 2013, 20, 82–102. [Google Scholar] [CrossRef]
  5. BloombergNEF. 2019. Available online: https://about.bnef.com/blog/battery-pack-prices-fall-as-market-ramps-up-with-market-average-at-156-kwh. (accessed on 25 May 2021).
  6. Tiwari, V.K.; Song, H.; Oh, Y.; Jeong, Y. Synthesis of sulfur-co-polymer/porous long carbon nanotubes composite cathode by chemical and physical binding for high performance lithium-sulfur batteries. Energy 2020, 195, 117034. [Google Scholar] [CrossRef]
  7. Hofmann, A.F.; Fronczek, D.N.; Bessler, W.G. Mechanistic modeling of polysulfide shuttle and capacity loss in lithium–sulfur batteries. J. Power Sources 2014, 259, 300–310. [Google Scholar] [CrossRef] [Green Version]
  8. Rosenman, A.; Markevich, E.; Salitra, G.; Aurbach, D.; Garsuch, A.; Chesneau, F.F. Review on Li-Sulfur Battery Systems: An Integral Perspective. Adv. Energy Mater. 2015, 5, 1500212. [Google Scholar] [CrossRef]
  9. Manthiram, A.; Fu, Y.; Chung, S.H.; Zu, C.; Su, Y.S. Rechargeable lithium–sulfur batteries. Chem. Rev. 2014, 114, 11751–11787. [Google Scholar] [CrossRef]
  10. Manthiram, A.; Fu, Y.; Su, Y.-S. Challenges and Prospects of Lithium–Sulfur Batteries. Acc. Chem. Res. 2012, 46, 1125–1134. [Google Scholar] [CrossRef]
  11. Ji, L.; Rao, M.; Zheng, H.; Zhang, L.; Li, Y.; Duan, W.; Guo, J.; Cairns, E.J.; Zhang, Y. Graphene Oxide as a Sulfur Immobilizer in High Performance Lithium/Sulfur Cells. J. Am. Chem. Soc. 2011, 133, 18522–18525. [Google Scholar] [CrossRef]
  12. Chen, Z.; Cheng, S.; Chen, Y.; Xia, X.; Liu, H. Pomegranate-like S@N-doped graphitized carbon spheres as high-performance cathode for lithium-sulfur battery. Mater. Lett. 2019, 263, 127283. [Google Scholar] [CrossRef]
  13. Deng, Y.; Li, J.; Li, T.; Gao, X.; Yuan, C. Life cycle assessment of lithium sulfur battery for electric vehicles. J. Power Sources 2017, 343, 284–295. [Google Scholar] [CrossRef] [Green Version]
  14. Chen, M.; Rincon-Mora, G. Accurate Electrical Battery Model Capable of Predicting Runtime and I–V Performance. IEEE Trans. Energy Convers. 2006, 21, 504–511. [Google Scholar] [CrossRef]
  15. He, H.; Xiong, R.; Fan, J. Evaluation of Lithium-Ion Battery Equivalent Circuit Models for State of Charge Estimation by an Experimental Approach. Energies 2011, 4, 582–598. [Google Scholar] [CrossRef]
  16. Pang, Q.; Liang, X.; Kwok, C.Y.; Nazar, L.F. Advances in lithium–sulfur batteries based on multifunctional cathodes and electrolytes. Nat. Energy 2016, 1, 16132. [Google Scholar] [CrossRef]
  17. Thele, M.; Bohlen, O.; Sauer, D.U.; Karden, E. Development of a voltage-behavior model for NiMH batteries using an imped-ance-based modeling concept. J. Power Sources 2007, 175, 635–643. [Google Scholar] [CrossRef]
  18. Fotouhi, A.; Auger, D.J.; Propp, K.; Longo, S. Electric vehicle battery parameter identification and SOC observability analysis: NiMH and Li-S case studies. IET Power Electron. 2017, 10, 1289–1297. [Google Scholar] [CrossRef] [Green Version]
  19. Fotouhi, A.; Auger, D.J.; Propp, K.; Longo, S.; Wild, M. A review on electric vehicle battery modelling: From Lithium-ion toward Lithium–Sulphur. Renew. Sustain. Energy Rev. 2016, 56, 1008–1021. [Google Scholar] [CrossRef] [Green Version]
  20. Fotouhi, A.; Auger, D.J.; Propp, K.; Longo, S. Lithium–Sulfur Battery State-of-Charge Observability Analysis and Estimation. IEEE Trans. Power Electron. 2017, 33, 5847–5859. [Google Scholar] [CrossRef]
  21. Li, Y.; Wei, Z.; Xiong, B.; Vilathgamuwa, D.M. Adaptive Ensemble-Based Electrochemical-Thermal-Degradation State Estimation of Lithium-Ion Batteries. IEEE Trans. Ind. Electron. 2021, 99, 1. [Google Scholar]
  22. Hu, J.; He, H.; Wei, Z.; Li, Y. Disturbance-Immune and Aging-Robust Internal Short Circuit Diagnostic for Lith-ium-Ion Battery. IEEE Trans. Ind. Electron. 2021, 99, 1. [Google Scholar]
  23. Ruan, H.; He, H.; Wei, Z.; Quan, Z.; Li, Y. State of Health Estimation of Lithium-ion Battery Based on Constant-Voltage Charging Reconstruction. IEEE Trans. Emerg. Sel. Top. Power Electron. 2021, 70, 1. [Google Scholar]
  24. Wei, Z.; Zhao, J.; Xiong, R.; Dong, G.; Pou, J.; Tseng, K.J. Online Estimation of Power Capacity with Noise Effect Attenuation for Lithium-Ion Battery. IEEE Trans. Ind. Electron. 2018, 66, 5724–5735. [Google Scholar] [CrossRef]
  25. Wei, Z.; He, H.; Pou, J.; Tsui, K.L.; Quan, Z.; Li, Y. Signal-disturbance interfacing elimination for unbiased model parameter identi-fication of lithium-ion battery. IEEE Trans. Ind. Inform. 2020, 17, 5887–5897. [Google Scholar] [CrossRef]
  26. Li, Y.; Wang, C.; Gong, J. A combination Kalman filter approach for State of Charge estimation of lithium-ion battery considering model uncertainty. Energy 2016, 109, 933–946. [Google Scholar] [CrossRef]
  27. Yin, Y.X.; Xin, S.; Guo, Y.G.; Wan, L.J. Lithium–sulfur batteries: Electrochemistry, materials, and prospects. Angew. Chem. Int. Ed. 2013, 52, 13186–13200. [Google Scholar] [CrossRef] [PubMed]
  28. Mohammadi, F.; Nazri, G.-A.; Saif, M. A Bidirectional Power Charging Control Strategy for Plug-in Hybrid Electric Vehicles. Sustainability 2019, 11, 4317. [Google Scholar] [CrossRef] [Green Version]
  29. Chen, J.-S. Energy Efficiency Comparison between Hydraulic Hybrid and Hybrid Electric Vehicles. Energies 2015, 8, 4697–4723. [Google Scholar] [CrossRef] [Green Version]
  30. Shim, B.J.; Park, K.S.; Koo, J.M.; Jin, S.H. Work and speed based engine operation condition analysis for new European driving cycle (NEDC). J. Mech. Sci. Technol. 2014, 28, 755–761. [Google Scholar] [CrossRef]
  31. Tsiakmakis, S.; Fontaras, G.; Ciuffo, B.; Samaras, Z. A simulation-based methodology for quantifying European passenger car fleet CO 2 emissions. Appl. Energy 2017, 199, 447–465. [Google Scholar] [CrossRef]
  32. Pacheco, A.F.; Martins, M.E.S.; Zhao, H. New European Drive Cycle (NEDC) simulation of a passenger car with a HCCI engine: Emissions and fuel consumption results. Fuel 2013, 111, 733–739. [Google Scholar] [CrossRef]
  33. Tutuianu, M.; Bonnel, P.; Ciuffo, B.; Haniu, T.; Ichikawa, N.; Marotta, A.; Pavlovic, J.; Steven, H. Development of the World-wide harmonized Light duty Test Cycle (WLTC) and a possible pathway for its introduction in the European legislation. Transp. Res. Part D Transp. Environ. 2015, 40, 61–75. [Google Scholar] [CrossRef]
  34. Cioroianu, C.C.; Marinescu, D.G.; Iorga, A.; Sibiceanu, A.R. Simulation of an electric vehicle model on the new WLTC test cycle using AVL CRUISE software. IOP Conf. Series Mater. Sci. Eng. 2017, 252, 12060. [Google Scholar] [CrossRef]
  35. Mock, P.; Kühlwein, J.; Tietge, U.; Franco, V.; Bandivadekar, A.; German, J. The WLTP: How a new test procedure for cars will affect fuel consumption values in the EU. ICCT 2014, 9, 1–20. [Google Scholar]
  36. Fontaras, G.; Ciuffo, B.; Zacharof, N.; Tsiakmakis, S.; Marotta, A.; Pavlovic, J.; Anagnostopoulos, K. Anagnostopoulos, the difference between re-ported and real-world CO2 emissions: How much improvement can be expected by WLTP introduction? Transp. Res. Procedia 2017, 25, 3933–3943. [Google Scholar] [CrossRef]
Figure 1. Closed-loop modeling system illustration.
Applsci 11 09593 g001
Figure 2. Design of lab-cell-result-based battery pack configuration: (a) LSB pack configuration; (b) LIB NCM battery pack configuration.
Applsci 11 09593 g002
Figure 3. (a) LIB battery OCV at different SOC; (b) LIB battery internal resistance at different SOC; (c) LSB OCV at different SOC; (d) LSB internal resistance at different SOC.
Applsci 11 09593 g003
Figure 4. (a) LSB voltage under the NEDC; (b) LIB voltage under the NEDC; (c) LSB power consumption; (d) LIB power consumption; (e) LSB energy consumption; (f) LIB energy consumption.
Applsci 11 09593 g004
Figure 5. (a) LSB voltage under the WLTC (b); LIB voltage under the WLTC; (c) LSB power consumption under the WLTC; (d) LIB power consumption under the WLTC; (e) LSB energy consumption under the WLTC; (f) LIB energy consumption under the WLTC.
Applsci 11 09593 g005
Figure 6. (a) LSB voltage under the HWFT cycle; (b) LIB voltage under the HWFT cycle; (c) LSB power consumption under the HWFT; (d) LIB power consumption under the HWFT; (e) LSB energy consumption under the HWFT; (f) LIB energy consumption under the HWFT.
Applsci 11 09593 g006
Figure 7. (ae) Fast-charge simulation results for the LSB; (bf) fast-charge simulation results for the LIB.
Applsci 11 09593 g007
Table 1. Comparison of the technical parameters of the LSB and LIB NCM battery packs.
ParametersLSB PackNCM LIB Battery Pack
Cell Nominal Capacity3.3 Ah50 Ah
Cell Weight74.956 g961.77 g
Cell Size90·60·6.36 (mm)28.7·148.6·103.7 (mm)
Pack Nominal Energy60 kWh57.6 kWh
QTY of Serial cells196 Serials96 Serials
QTY of Parallel cells44 Parallel3 Parallel
Pack Nominal Voltage400 v384 v
Table 2. Vehicle’s basic parameters.
Basic ParameterUnitValue
Curb Weightkg1610
Maximum Masskg1610 + 375
Maximum windward aream22.26
Rolling resistance coefficient/0.0132
Air resistance coefficient/0.331
Wheel radiusm0.308
Gravitational accelerationm/s29.8
Maximum torque of e-motorN·m245
Maximum motor speedr/min8950
Final ratio/7.816
Transmission mechanical efficiency/0.96
Moment of inertia of the wheelkg·m23.45 (experience value)
Motor inertiakg·m20.04
Table 3. Fast-charging simulation result summary.
ItemsLSBLIB
ChargingAcceptable Fast-Charge Current (A)131255
Charge Time from SOC 20% to SOC 80% (s)2681508
Publisher’s Note: MDPI stays neutral with regard to jurisdictional claims in published maps and institutional affiliations.

