Article

Kinetic Study on Acrylic Acid Polymerisations in Isopropanol

Institute for Technical and Macromolecular Chemistry, University of Hamburg, Bundesstraße 45, 20146 Hamburg, Germany
*
Author to whom correspondence should be addressed.
Appl. Sci. 2021, 11(20), 9719; https://doi.org/10.3390/app11209719
Submission received: 6 August 2021 / Revised: 29 September 2021 / Accepted: 11 October 2021 / Published: 18 October 2021
(This article belongs to the Section Chemical and Molecular Sciences)

Abstract

:
The radical polymerisation of acrylic acid is largely concentration dependent and affected by the type of the surrounding solvent. This work investigates reaction rate constants, the activation energy, heat flux and the molecular weight in the industrially relevant synthesis of low molecular mass acrylic acid polymers in 2-propanol. The polymerisations were carried out isothermally in an RC1e calorimeter with inline Raman spectroscopy for monomer concentration monitoring. For a non-neutralised acrylic acid in isopropanol (150 g/L), a monomer reaction order of 1.73 ± 0.15, an activation energy of 58.6 ± 0.8 kJ/mol (0.5 mol% AIBN) and 88.5 ± 1.5 kJ/mol (1.0 mol% AIBN), and a reaction enthalpy of 66.4 ± 4.8 kJ/mol could be shown. This data is in accordance with the literature values for acrylic acid polymerisation in water. In addition, linear correlations between the respective reaction parameters and the molecular weight for customised polymer synthesis in the range from 1.2 to 1.7 × 10⁴ g/mol could be established. In comparison with aqueous acrylic acid polymerisation, it was found that the reaction rate constants in isopropanol were slower by a factor of approximately 10 under similar reaction conditions.

1. Introduction

Polymers of acrylic acid are versatile and have a wide range of applications. Their partial biodegradability [1] in particular makes their applications in cosmetic products attractive. Poly(acrylic acid) is a weak polyelectrolyte which can be used, if cross-linked, as a powerful, super absorbent material. Furthermore, it is used as a thickener, emulsifier and deflocculating agent in industry [2,3,4,5]. Particularly low-molecular polyacrylic acid from polymerisation in isopropanol or mixtures of isopropanol and water is used as a dispersant for inorganic pigments [6] in, e.g., the oil industry or water treatment due to its salt scale inhibiting effect [7,8].
Just like other polymers, acrylic acid polymers are defined as “products-by-process”, meaning that their performance is not only defined by their educts, but also highly dependent on all process parameters. The polymerisation outcome and thus the later performance of the product in its further applications is usually not only defined by the conversion over time, but also by molecular weight distribution [9]. Acrylic acid polymers are typically produced in a free radical polymerisation. Because this polymerisation method in particular is highly exothermic, both the adherence to all process parameters and the guarantee of safe process controls are not trivial. The high interest in this type of polymerisation has led to many publications examining polymerisation kinetics [3,10,11,12,13,14], the reaction steps and the heat generated [15]. Strategies to produce specific molecular weights are presented [5].
All aforementioned studies were performed in water, mostly because it is a great and low-cost solvent for polyacrylic acid. The same applies to the also non-toxic solvent isopropanol, which is often added to the polymerisation process in industrial applications to control molecular weights. However, due to industrial interest, acrylic acid polymerisations in isopropanol or in mixtures of isopropanol and water are more commonly described in patents [6,16,17], but are rarely investigated in academic publications.
Regarding the solvent influence, Kuchta et al. described that the propagation rate kp of methacrylic acid and also acrylic acid can increase by up to a factor of 10 for decreasing concentrations in water [18]. Beuermann and García confirmed this by observing the differences between the local propagation rate at the end of the radical chain in solution and the propagation rate in bulk [19]. This was taken up and calculated by Deglmann et al. using the transition state theory [20]. For acrylic acid, no difference between the respective propagation rates could be determined in the solvents DMF and DMSO, whereas differences were determined for methanol and water and strong effects of the solvent on the monomer are to be expected. It can therefore be assumed that these solvent effects also play an important role in isopropanol and suggest that the reactions could be comparable. Propagation rates were not obtained in this work as they are rather difficult to calculate and can only be accurately determined using PLP-SEC methods. Rather, a general kinetic investigation of the polymerisation in isopropanol was conducted. Based on the polymerisation rate, which is also influenced by the solvent, the reaction rate constants are compared with values from the literature.
Inline Raman spectroscopy is a powerful tool used to simultaneously monitor the formation and consumption of multiple reactants during chemical or biotechnological reactions [21,22]. The process analytical engineering term inline means that the measurement is directly taking place in the reactor vessel, minimising the delay from an event in the reaction to its display on a screen. Similar to data gained from the widely employed IR spectroscopy, the monitoring data can be used to ensure safety during the reaction, achieve a uniform synthesis of products and to find a starting point for later product optimisation. While Raman spectroscopy can be used complementarily to IR spectroscopy, it has advantages especially in monitoring conventional aqueous acrylic acid polymerisation due to the lack of spectroscopic signals of water.
In this work, we employ inline Raman spectroscopy to monitor the polymerisation of acrylic acid in isopropyl alcohol. Due to the chain transfer properties of isopropyl alcohol, the kinetic chain length is significantly reduced and thus the global heat transfer through the reactor jacket is significantly improved. In addition, a reaction calorimeter is used to actively regulate the temperature while gaining access to safety-relevant heat flow data. The chain transferring solvent and temperature control ensure low molecular weights and an isothermal reaction control so that kinetic data such as polymerisation rates can be acquired in situ.

2. Materials and Methods

2.1. Reactor Setup

All polymerisation reactions were carried out in a double jacket steel reactor (HP60) manufactured by Mettler Toledo, which was attached to a reaction calorimeter (Mettler Toledo RC1e). The reactor vessel and jacket had a nominal volume of 1.8 L and 0.6 L, respectively. The maximum allowable working pressure in both are 60 bar and 12 bar, with a maximum allowable working temperature of 250 °C. The reactor had an inner diameter of 10.3 cm and was sealed with a steel lid, allowing for several screw-in fittings. Next to the central steel anchor stirrer with a total width and height span of 9 cm and the calorimeter-specific sensor from Mettler Toledo, two valves were attached for gas in- and output. The first valve was used to regulate nitrogen input to the reactor for degassing, which could escape via the second valve. During the entire reaction, all valves were closed so that there was no mass transfer with the environment. Additionally, to ensure safe execution of the reactions, a pressure gauge and an overpressure valve, which was set to open at an excess pressure of 5 bar, was attached. To avoid heat loss during the reaction, the reactor lid was heated before the calorimeter calibration and throughout the whole reaction. The lid was heated via a heat transfer medium with an exchange of approx. 7 L/min. To keep the lid temperature above the boiling point of the reaction mixture (~93 °C for 150 g/L acrylic acid in isopropanol, ~105 °C for 150 g/L AA in water), the heat transfer medium was heated to 140 °C and 170 °C, respectively. This was verified via a PT100 thermometer inside the lid and additional thermographic imaging. The lid was heated before the start-point calibration of the calorimeter until a constant lid temperature was reached.

2.2. Acrylic Acid Polymerisations

A total volume of 500 mL consisting of an acrylic acid (Alfa Aesar, 98.5%, stab. with ca. 200 ppm 4-methoxyphenol (MEHQ), ~3% dimer content) concentration of 150 g/L in isopropyl alcohol was placed inside the reactor. The inhibitor MEHQ was not removed prior to the reactions. To remove dissolved and atmospheric oxygen inside the reactor vessel, the reaction mixture was overflowed with a mild but detectable stream of nitrogen while stirring at 200 rpm for 45 min at room temperature with an anchor stirrer (defined in Section 2.1). For the heat-flow calibration (waiting time t = 10 min, TR = 3 K) and the subsequent polymerisation reaction, the reactor vessel was sealed, generating an excess nitrogen pressure of 0.5 bar. The vessel was further heated up to the reaction temperature (60−75 °C) and the stirring speed was reduced to 70 rpm. To start the polymerisation, AIBN (0.5, 1.0 and 1.5 mol% based on acrylic acid content), suspended in 20 mL isopropanol, was injected in nitrogen countercurrent without prior degassing of the suspension. To minimise any initiator residues in the syringe and the injection port, 10 mL of pre-warmed (30−40 °C) and degassed (5 min) isopropanol was injected subsequently. Isothermal reaction conditions were possible by using a closed-loop control (P: 2, I: 999999) of the reactor jacket temperature. After 2−3 h, when no significant heat-flow could be detected by the calorimeter, the final heat-flow calibration (waiting time t = 15 min, TR = 3 K) was performed and the reaction mixture was cooled down. An exemplary calibration is shown in Figure 1. For later size-exclusion chromatographic analysis, a sample of the slightly viscous and colourless polyacrylic acid was taken from the reactor outlet.
Samples were also taken via the reactor outlet to determine a pH value during the reaction. Experiments involving taking samples before the end of the reaction were not used for calorimetric analysis due to the violation of the balance. The pH value was determined in each case with the pH-meter 765 Calimatic from Knick which was calibrated with regular aqueous calibration solutions.
The reaction heat data was integrated in Mettler Toledo’s iControl to use the suggested conversional proportional baseline subtraction. The integration frame was set to a point before the addition of the initiator suspension and to the point right before the end point calibration. When choosing these points, peaks in the baseline fluctuation were avoided. The insignificant drop in reaction heat due to the temperature difference of the initiator suspension was included in the integration.
The control experiments in aqueous media were carried out under comparable conditions. However, VA-057 was chosen in place of AIBN as an initiator. When isopropanol was employed as a CTA for the polymerisation in water, the concentration of CTA/AA = 0.16 suggested by Montenegro et al. was used [5]. In addition, the temperature range was reduced to 40−55 °C to maintain similar reaction times.

2.3. Inline Raman Spectroscopy and Data Processing

To determine the acrylic acid concentration in the solution and thus the reaction conversion at any time during the reaction, the RamanRxn1-785 system was used (Kaiser Optical Systems, IO-1/2S-NIR probe, laser power 10.1 mW at the probe) to monitor the stretching vibration of ν(C=C) at 1635 cm−1. Spectra were collected every 32 s with an integration time of 30 s. The spectral data were processed using Spectragryph 1.2 software to apply SNV standardisation between 1850 and 350 cm−1 and to integrate the C=C band between 1580 and 1660 cm−1 using individual baselines. The linear decrease of the band with an increasing conversion can be observed during the polymerisation.

2.4. Molecular Weight Analysis

The polyacrylic acid samples were dried and analysed by size exclusion chromatography (SEC). The SEC system consisted of a Knauer A5327 degasser, combined with a Dionex P580 pump, attached to two PSS SUPREMA Linear M columns heated to 40 °C with a Schambeck SFD 150–600 oven. A Shodex RI-71 detector was used. The samples were prepared at a concentration of 3–5 mg/mL in the eluent solution of 0.05% NaN3 in 0.1 M NaNO3 (pH 7.03). The mobile phase was run at a flow rate of 1 mL/min. For the calibration, a polymer standard consisting of Polyethylene Glycol (PEG)/Polyethylene Oxide (PEO) in the range of 300 to 700,000 g/mol was used.

3. Results and Discussion

3.1. Isothermal Reaction Control

By using the PI controller of the RC1e calorimeter, quasi-isothermal reaction control could be ensured during the acrylic acid (AA) polymerisation reaction, as shown in Figure 2. The reactions were carried out at four different temperatures (60, 65, 70 and 75 °C) with 1.0 mol% (regarding AA content) of AIBN.
Figure 3 shows the temperature development of the reactor temperature and the corresponding jacket temperatures over the course of the reaction conversion. In the beginning of the polymerisation, it was observed that especially with higher starting temperatures a closed-loop temperature control is advisable. When using thermal initiators such as AIBN, cooled initiator solutions are usually used in order not to generate radicals before the solution is joined with the reaction mixture. As a result, the reactor temperature dropped briefly by up to 3.3 K at the beginning of the reaction. The heat released by the reaction then exceeded the set reaction temperature by up to only 3.5 K for the reaction at 75 °C. Due to the jacket counter-cooling, the temperature stroke was quickly damped so that quasi-isothermal conditions (TTset < 1 K) were reached 4–7 min (corresponding to 20–45% conversion) after the peak temperature. While the temperature stroke was independently reached after 2 min, it was reached at higher conversions with an increasing setpoint temperature. During the rest of the reaction, the temperature was always 0.5 K below the respective target temperature.

3.2. Inline Monitoring and Polymerisation Rate Determination

Similar to the widespread application of NIR spectroscopy for in situ monitoring of chemical reactions, particularly polymerisation reactions [23,24], Raman spectroscopy can be employed. Previous research by Klement et al. has shown that the integral of the C=C stretching vibration band can be correlated linearly to the acrylic acid (AA) concentration in aqueous solutions from 20 g/L up to 400 g/L [
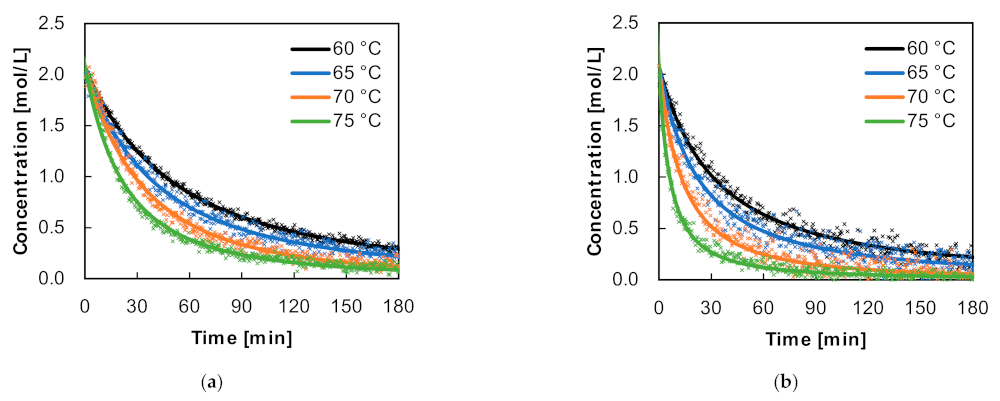
25]. Because the Raman spectrum of isopropyl alcohol does not overlap with this band, the AA concentration could be measured throughout the whole polymerisation reaction. AA concentration profiles of the reactions carried out with 0.5 mol% and 1.0 mol% AIBN regarding the AA content are shown in Figure 4.
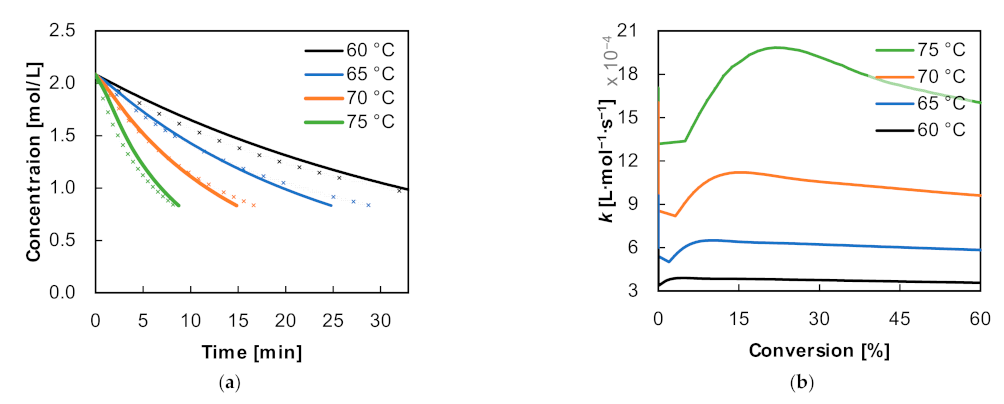
Here, the shown data points were acquired by multiplying the normalised concentration acquired from the band integration with the initial AA concentration. Raman measurements can have some fluctuations due to temperature changes, variations in viscosity, ascending bubbles, and the stirred reaction mass. However, depending on the desired spectra resolution, Raman laser intensity and the optical path length of the immersion probe, a single spectrum can be acquired in a fraction of a second. Over the course of the reaction, if spectra are acquired every 32 s, the data are sufficient to fit the concentration profiles using ideal kinetics. Under the initially classically expected assumption of a monomer reaction order of 1, however, curve fitting did not lead to a coverage of all measurement values during the reactions. Therefore, only if the reaction is to be examined up to lower conversions of about 30%, is it tenable to express the reaction with an order of 1 (see Figure 5a). The fit error σ2 is calculated as the sum of squares described as follows (Equation (1)):
σ   2 = i = 1 N [ P i , meas P i , calc ] 2 N K ,
where P denotes the fitted value (in this case the normalised concentration), N the amount of data points and K the number of parameters to adjust the fit. In order to determine to what extent the reaction with a fit according to a reaction order n = 1 is valid, the data points were only fitted up to a certain conversion section (in 10% steps); this is plotted in Figure 5a. The error resulting from this fit is called the local error of the local fit. From these so-called local fits, the error that results when all measuring points of a reaction, i.e., the entire conversion range, are considered is then determined. This is called the global error of the local fit. In addition, these errors were compared with the fit used for the later described final evaluation according to reaction orders of n > 1 (Equation (2)). For this purpose the fit applied to the entire reaction was used, but the error was determined in the respective conversion interval.
It can be concluded from the graph in Figure 5a that the local fit errors for n = 1, for the fit up to a 20% conversion to the fit up to a 70% conversion, are similar in magnitude. However, if the error of these fits is determined for the whole reaction range (>95% conversion) (local fit, global error), a constant yet significantly higher error can be achieved when fitting at least up to a conversion of 30%. Higher errors are to be expected for fits up to higher conversions due to the increasing relevance of the Raman measurement fluctuations. The error for the fit up to a conversion of 10% is not displayed on the graph because of its high value of 0.54. If the error of the global fit for the reaction order n > 1 is considered in the respective conversion ranges, a constantly decreasing error results, which on the one hand is always lower than the global error for the fits according to reaction order 1 and from a fit up to 80% conversion is also lower than the corresponding local error for n = 1.
As an example, for fitting the concentration profiles using the first order, the fit up to a conversion of 30% is shown. Up to that point an approximately constant local and global error can be obtained. This is shown in Figure 5b. It shows that although the beginning of the reaction can be well represented, the monomer content is overestimated towards the middle of the reaction and underestimated in the end. This error increases with increasing temperature. Explanations as to why a reaction order of 1 cannot be assumed are discussed in more detail in the following.
The raw data was fitted using the integrated differential equation for reactions of any reaction order n with [AA]0 and [AA] denoting the initial and current acrylic acid concentration, respectively, and kn being the reaction rate constant:
AA = AA 0 1 + n 1 [ AA ] 0 n 1 k n t n - 1   ,
Here, the average deviation from the calculated concentration to the fitted ideal kinetics according to Equation (2) is 4%. Since the data can be well represented by ideal kinetics, it can be concluded that the Trommsdorff–Norrish effect plays a subordinate role in the performed reactions. This suggests that the expected chain-regulation function of the solvent could provide for low molar masses and therefore uniform mixing. Based on the accuracy of fit of the data in Figure 4, the conversion of the reactions can be calculated by dividing each concentration data point by the maximum measured concentration, shown in Figure 6.
The conversion chart shows that for 0.5 mol% of initiator used, a conversion of 80% was reached after 151, 111, 76 and 59 min, respectively, for each temperature. Doubling the AIBN concentration to 1.0 mol% led to noticeably steeper curves, shortening the reaction time up to an 80% conversion 1.5- to 3-fold and allowing for a conversion close to 100% after the displayed 180 min for 70 °C and 75 °C.
In free radical homopolymerisations, the polymerisation rate Rp is defined as the decay of the monomer concentration over time. In complex forms of polymerisations where the steady-state radical concentration also depends on the monomer concentration [M], the polymerisation rate is proportional to the initiator and monomer concentration with their respective reaction orders α and β [10,13,26] and can be generally defined as:
R p = d [ M ] d t = k   I α   M β .
In this study, AIBN was used as an initiator. Because it is widely used and well known for free radical polymerisations, it is safe to assume classical kinetic considerations. The square root proportionality of the propagation rate to the initiator concentration (α = 0.5) is implied [27]. Since the polymerisations shown in this work were also carried out at three different initiator concentrations, this assumption can also be confirmed by the straight line in Figure 7. Ideally, the straight line in the graph would intersect the origin, which is not the case here. This is presumably due to the fact that no lower initiator concentrations than 0.5 mol% were used. Another possible reason would be that radicals are being scavenged by, e.g., MEHQ (4-methoxyphenol), which was included in the acrylic acid as a stabiliser. However, this effect should be negligible in the absence of dissolved molecular oxygen [28] and was also confirmed again for our experimental set-up (Figure A2).
From this, the rate constant k is defined as a product of the chain propagation rate constant kp with the classical description for the concentration of growing chains depending on the square root of the initiator concentration [27]. Here, f is the initiator efficiency, kd and kt stand for the initiator decomposition and polymer chain termination rate constant, respectively:
  k = k p   f   k d k t 0.5 .
It is worth noting, however, that kinetics in the case of AA polymerisations are much more complex. Because growing AA polymer chains undergo backbiting and transfer reactions, it is important to differentiate between secondary and tertiary radicals and their different rate constants [3]. Additionally, it has been found that the polymerisation rate of AA is highly dependent on the degree of neutralisation [2,4,10,11,14]. This is explained by the increase of ionised species with an increasing pH, resulting in different types of propagation rate constants between the differently ionised species [2,14]. In our study, the acrylic acid solution was not neutralised and only a single initial monomer concentration was used. Nonetheless, the pH value was measured throughout the reaction. It should be noted that the pH value obtained here cannot be directly compared with the meaning of the pH value in aqueous solutions [29], but it serves as a reproducible reference value in the experimental procedure. In the beginning, the solution of AA in isopropanol (150 g/L) had a pH of 3.0. After 15 min (60 °C, 0.5 mol% AIBN), the pH had risen to 3.6 and a final value of 4.0 was reached at the end of the reaction.
While the classical assumption for the monomer reaction order β in Equation (3) would suggest a value of 1, previous studies have suggested orders above 1 due to an interaction of the monomer with the initiator itself or its caged radicals [10]. While Cutié et al., Manickam et al. and Kabanov et al. found the order to be 1.5 [10,11,30,31], others such as Ito et al. and Scott et al., respectively, suggested values of 2 and 1.16–1.25 [2,32]. In this work, we could confirm a reaction order of 1.73 ± 0.15 in isopropyl alcohol across three different initiator concentrations. The resulting data from the experiments for the reaction order n and kn are listed in Table 1.
In comparison to data found in the literature [10,11,31,32,33] for the acidic (non-neutralised) AA polymerisation in water across different pH values at mostly temperatures between 50–60 °C, the rate constants found for isopropyl alcohol in this work are noticeably (up to 10-fold) slower. In acidic water (pH < 4) with different initiators and different concentrations thereof, rate constants were ranging from 0.14 to 0.90 L·mol−1·min−1 at 50–60 °C [31,32,33]. The observed rates in isopropanol seem more comparable to neutralised AA polymerisations in water, ranging from 0.003 to 0.045 L·mol−1·min−1, also at 50–60 °C [31,32,33]. However, it must be kept in consideration that AA polymerisation is strongly pH-dependent, but that the pH scale also behaves differently in solvents other than water [29].
Using the data from Figure 4 and Figure 6, the rate of polymerisation can additionally be shown as a function of conversion (Figure 8).
This graph shows that the maximum polymerisation rate was also the initial polymerisation rate. Initial polymerisation rates of 0.1–0.04 mol⸱L−1⸱min−1 with 0.5 mol% of AIBN and 0.35–0.06 mol⸱L−1⸱min−1 with 1.0 mol% of AIBN were observed, displaying a strong temperature dependence. The rates decreased with an increasing conversion, corresponding to the depletion of AA monomers. The commonly known autoacceleration of the polymerisation rate after the start of polymerisation due to the gel-effect [34] was not present here due to the short polymer chains. Rather, an almost linear decrease in the polymerisation rate, especially at 60 °C, could be observed.
From the initial polymerisation rates, k values were calculated according to Equation (3) and their natural logarithm was plotted against the reciprocal reaction temperatures to solve the Arrhenius equation. Due to the fact that the classical Arrhenius plot could be distorted by the temperature drop caused by the initiator addition and the subsequent temperature stroke, the Arrhenius parameters were estimated within a basic simulation using Predici 11. For this purpose, the reactions carried out were fed into Predici with their recipes and the experimental temperature and concentration curves. Based on the values obtained from the Arrhenius plots, the initial values for the parameter estimation were determined. The algorithm tried to map the experimental concentration profiles with the simulated ones up to a conversion of 60% (to cover the temperature profiles deviating from the ideal temperatures in Figure 3). This is shown in Figure 9 together with the development of the k values.
The parameter estimation resulted in activation energies Ea of 57.6 ± 0.8 kJ/mol for 0.5 mol% of AIBN and 88.5 ± 1.5 kJ/mol for 1.0 mol% of AIBN. These values are lower than the activation energies determined by the classical linear regression (65 ± 11 kJ/mol for 0.5 mol% of AIBN and 102 ± 14 kJ/mol for 1.0 mol% of AIBN). The frequency factors were estimated to be 2.69 × 10⁵ ± 3.80 × 10⁴ L·mol−1·s−1 and 2.65 × 10¹⁰ ± 6.61 × 10⁹ L·mol−1·s−1, respectively. In the literature, reaction temperatures starting at 70 °C and above have showed a shift in the Arrhenius plot, resulting in different slopes [2,30]. The higher temperature most likely induced a higher solution viscosity and thus an autoaccelerating behaviour. In this work, this was circumvented by the chain transferring solvent. Nevertheless, the activation energies found in this work are in accordance with the literature data, which lie between 40.1 and 98.1 kJ/mol [2,10,11,13,30].

3.3. Calorimetry: Heat of Reaction Curves, Reaction Enthalpy

The reaction calorimetry, which was used to complement the Raman spectroscopy, is another important analytical tool to evaluate the safety of chemical reactions and optimise industrial processes. Especially since the thermal runaway of acrylic acid polymerisations have caused many accidents in the chemical industry, it is important to know and understand thermal behaviour during controlled polymerisations. A detailed analysis of runaway scenarios of bulk acrylic acid has already been performed using accelerating rate calorimetry (ARC) by Fujita et al. [15].
The reaction heat was recorded for the polymerisation of acrylic acid in isopropanol and is shown for different temperatures in Figure 10. The time point t = 0 does not correspond to the respective start of the polymerisation but is set so that the negative heat input of the injection of the initiator solution is shown. In addition, the time for each curve was shifted to align with the reaction start according to the calorimetric global conversion.
It was shown that the initiator injection with differently pre-warmed initiator suspensions led to a drop in the reaction heat by up to 100 W in the worst case. This was due to the difficulties in handling the initiator suspension and could be avoided by using an initiator that dissolves well in isopropyl alcohol, such as V-601 (Dimethyl 2,2′-azobis(2-methylpropionate)). Nevertheless, it can be observed that the maximum reaction heat increased with an increasing temperature. Additionally, the maximum heat was reached later with higher temperatures. A drastic increase occurred at temperatures above 65 °C as expected due to this being the 10-h half-life decomposition temperature of AIBN. The heat of the reaction curves did not reach 0, indicating that the reaction never came to a halt and thus the conversion could not reach 100%. As expected, due to the higher conversion and hence higher viscosity, the final heat was lower for higher temperatures. In the end all reactions were so slow that the heat recordings were stopped prematurely, and the end-point calibrations of the heat flow were allowed, leading to minor deviations. Diagrams for the heat of reaction were not shown in the literature for the polymerisation of AA in neither water nor isopropanol.
From the plotted reaction heat, the integral under the curves can be calculated. With respect to the amount of monomer used, this corresponds to the enthalpy generated during the reaction ΔHR. Using the conversion determined by Raman spectroscopy, the values obtained were related to a reaction turnover of 100% and the average was calculated. Thus, for the polymerisation of acrylic acid in IPA at 0.5, 1.0 and 1.5 mol% of AIBN in the temperature range of 60–75 °C, a reaction enthalpy of 67.37 ± 4.83 kJ/mol was determined. This value is in accordance with the data for the aqueous polymerisation found in the literature. It should also be noted that, in general, the polymerisations with higher initiator concentrations also gave slightly higher results for the enthalpy of reaction. Staudinger and Schläpfer determined a heat of combustion of 62.76 kJ/mol in 1939 [35]. In 1947, Evans and Tyrall [36] then obtained a value of 77.36 kJ/mol by calorimetric determination in water. For comparative reasons, reactions in water were also carried out in this work using isopropanol only as a chain-transferring agent. These were carried out in the temperature range of 40–55 °C with 0.5 mol% VA-057 as the initiator. The recorded reaction enthalpy was 75.4 ± 3.6 kJ/mol, which aligns with the literature data as well but is marginally higher than the enthalpy found for the polymerisation in isopropanol.
Assuming that the polymerisation reaction is the main reaction occurring, the polymerisation rate Rp can be defined as the quotient of the reaction heat Q . r and the reaction enthalpy −ΔH [37]:
R p   =   Q . r Δ H .  
Furthermore, the calorimetric global conversion Xcalor can be calculated by integrating the polymerisation rate over the time t and dividing it by the initially fed amount of monomer M0 [37,38]:
X calor   =   0 t   R p M 0 .  
The calorimetric conversion was used here as an aid to determine the start of polymerisation in the plotted curves for reaction heat. However, since only Raman spectroscopic conversion determination was used for the evaluations within this article, the following figure compares the conversion curves that can be obtained from calorimetry with those from Raman spectroscopy.
Figure 11 shows an example of this for the polymerisations in isopropanol with 1.0 mol% AIBN. It is noticeable that the conversion curves coincide somewhat better at higher temperatures than at lower temperatures. The course at 75 °C is almost completely congruent. Since isothermal calorimetry in this case involved small differences between TR and TJ, and only Raman spectroscopy specifically measures the decrease in the monomer band in the reaction mass, deviations are conceivable here.

3.4. Effects on Molecular Weight

Since the polymerisation of AA was carried out in a chain-transferring solvent, it is to be expected that polymers with low molecular weights were produced. At the end of each of the performed reactions, a sample was taken from the reactor outlet and analysed via size exclusion chromatography (SEC). In addition, polymerisations in water with the addition of 2-propanol (IPA/AA = 0.16) as a chain-transferring agent (CTA) were carried out for comparison purposes. A reaction in pure water (without CTA) was also meant to serve as a further comparison, but under comparable conditions a highly viscous reaction mass was produced in the batch reactor. Because of this, neither the stirrer could ensure reliable mixing, nor could the Raman spectra provide trustworthy spectra, since the measurements could only show one spot in an unevenly mixed medium. Comparative literature data from AA polymerisation in water or in water with the addition of a CTA were used but these were mostly carried out in a continuous or semi-batch process with different initiators and concentrations. Moreover, in contrast to the literature, here the molecular weight was considered after close to complete conversion for the most part.
In the following Figure 12, first the influence of the initiator concentration, as well as the solvent on the molecular weight is shown.
First, it is shown in Figure 12a that the number-average molecular weight is relatively low at 1.5 × 10⁴ g/mol. No effect of initiator concentration was observed here for different initiator concentrations of 0.5, 1.0 and 1.5 mol% of the AIBN. The right part of the figure shows the corresponding molar mass distribution. The reaction in pure isopropanol led to a distribution with an average PDI of 1.64 ± 0.05 (1.67 in Figure 12b). This is compared to different solvents under similar reaction conditions. The polymerisation in water with the addition of isopropanol as the CTA (IPA/AA = 0.16) is not much broader with an average PDI of 2.06 ± 0.31 (1.77 in Figure 12b), but the molecular weight is 25 times higher (Mn = 3.8 × 10⁵ g/mol) than the molecular weight of the polymers made in pure isopropanol. The molar mass distribution of the reaction in pure water could not be directly compared with the other results here, as it did not show a completely unimodal distribution. Additionally, the observations during the reaction and sample preparation indicated a very high gel fraction, which presumably was adhered to the guard column during the SEC measurement due to reduced solubility in the eluent. In the literature, values for Mn range up to 2 × 10⁶ g/mol during AA polymerisation in water [10].
Figure 13 shows the effect of temperature and initial monomer concentration on molecular weight.
In both graphs an expected linear dependence can be observed. Additional graphs for the temperature dependence of the polymerisations with 0.5 mol% and 1.5 mol% of AIBN are shown in Figure A1. Here, the initial monomer concentration had a stronger influence on the molecular weight.

4. Conclusions

The synthesis of especially low molecular acrylic acid polymers is an interesting topic for industrial applications, mainly as dispersing agents for inorganic pigments or salt scaling inhibitors [6,7,8]. However, since acrylic acid polymerisation has so far been studied almost exclusively in an aqueous environment in the literature, the aim of this work was to collect, in particular, kinetic data on polymerisation in isopropanol and to compare these with the literature values for water. Since isopropanol is normally only used as a chain-transferring agent, as a solvent it ensures particularly low molecular weights and thus also a low viscosity. As a result, problems such as poor mixing and a correspondingly strong temperature increase, which occur particularly in the aqueous environment, play a subordinate role which should ensure more accurate values. The comparison could show the influence of the solvent alteration on polymerisation.
Inline Raman spectroscopy was used to record the concentration profiles during the reactions so that they could ultimately be fitted using ideal kinetics. This confirmed the findings in the literature that the polymerisation of AA cannot be described by means of a first-order decay. This unpredicted phenomenon is explained in the literature by an interaction of the monomer with the initiator or with the initiator fragments, which are trapped in a solvent cage [10]. Acrylic acid additionally has the tendency to form dimers independent of the presence of radicals. This reaction is proton catalysed and favoured by high temperatures [39]. Influences of the dimer species on regular AA polymerisation are therefore also conceivable. In this work, a reaction order of the monomer of 1.73 ± 0.15 was obtained by fitting with n-th-order kinetics, which is similar to literature values of around 1.5 determined in water. Arrhenius plots could be generated via the initial polymerisation rate obtained from the conversion diagrams of the reactions. These then revealed activation energies of 57.6 ± 0.8 kJ/mol for 0.5 mol% of AIBN and 88.5 ± 1.5 kJ/mol for 1.0 mol% of AIBN, which also aligns well with other literature data for polymerisation in water. However, the comparison of the reaction rate constants obtained showed that these were lower in isopropanol by up to a factor of 10 (kn = 0.0170–0.0333 L·mol−1·min−1 at 60 °C) than the literature values for comparable reaction conditions in water [10,11,32,33]. For instance, Kabanov et al. obtained a kn of 0.14 L·mol−1·min−1 at a pH of 1, 1.2 mol/L AA in water with a 0.005 mol/L AIBN, whereas we obtained a kn of 0.0170 L·mol−1·min−1 at a pH of 3 at 60 °C and 2 mol/L AA in isopropanol with 0.01 mol/L AIBN. With a doubled initiator concentration and a temperature of 75 °C values in this direction could be recorded here with kn = 0.1543 L·mol−1·min−1. Such low values as obtained here are more likely to be found in the literature for polymerisation in water at pH values of 7. This behaviour could be explained by the differences of the pH scale in different solvents [29].
Since the RC1e reaction calorimeter served as a reactor for the investigations, it was also possible to record the heat flows during the AA polymerisations in isopropyl alcohol. These confirmed that the reactions were performed without the autoaccelerating gel effect having occurred. This indicates that that AA was polymerised at low molecular weights. Moreover, the reaction enthalpy was calorimetrically determined at a value of 67.37 ± 4.83 kJ/mol. While this does fit in the range of the data found for the polymerisation in water (63–77 kJ/mol) [35,36], it is marginally lower than the enthalpy recorded in control experiments of the AA polymerisation in water with isopropanol added as a CTA (75.4 ± 3.6 kJ/mol).
Analysing the molecular weight distribution of the produced poly(AA) showed that polymerisation in isopropanol led to molecular weights around 1.5 × 10⁴ g/mol with an average PDI of 1.64 ± 0.05. As expected, this is much lower and narrower than poly(AA) produced in water in similar conditions. It was also shown that the molecular weight can be easily influenced by reaction temperature but mainly by the initial monomer concentration. As a result, using this data, tailor-made low-molecular poly(AA) can be produced according to industrial requirements using a robust reaction process such as is presented here.

Author Contributions

K.C.B. and W.P. conceived the experiments; K.C.B. and A.W. performed the experiments and analysed the data; K.C.B. and W.P. designed and created the original draft; W.P. supervised the project. All authors have read and agreed to the published version of the manuscript.

Funding

This research received no external funding.

Institutional Review Board Statement

Not applicable.

Informed Consent Statement

Not applicable.

Data Availability Statement

The data presented in this study are available on request from the corresponding author upon reasonable enquiry.

Acknowledgments

In addition to the author contributions, we would also like to thank Torsten Klement (TU Dortmund) for discussing and comparing the conceived experiments and the spectroscopic data analysis.

Conflicts of Interest

The authors declare no conflict of interest.

Appendix A

Figure A1. Effect of temperature on the number- and weight-average molecular weight during the polymerisation of acrylic acid in 2-propanol. (a) 150 g/L, 0.5 mol% AIBN and (b) 150 g/L, 1.5 mol% AIBN.
Applsci 11 09719 g0a1
Figure A2. Effect of MEHQ content (measured by HPLC with 40% acetonitrile/60% water at 280 nm with a flow rate of 0.5 mL/min at a column temperature of 50 °C) on the polymerisation of acrylic acid in 2-propanol (150 g/L, 0.5 mol% AIBN) in a nitrogen atmosphere. The percentage values above the bars indicate the respective deviation.
Applsci 11 09719 g0a2

References

  1. Larson, R.J.; Bookland, E.A.; Williams, R.T.; Yocom, K.M.; Saucy, D.A.; Freeman, M.B.; Swift, G. Biodegradation of Acrylic Acid Polymers and Oligomers by Mixed Microbial Communities in Activated Sludge. J. Environ. Polym. Degrad. 1997, 5, 41–48. [Google Scholar] [CrossRef]
  2. Scott, R.A.; Peppas, N.A. Kinetic Study of Acrylic Acid Solution Polymerization. AIChE J. 1997, 43, 135–144. [Google Scholar] [CrossRef]
  3. Wittenberg, N.F.G.; Preusser, C.; Kattner, H.; Stach, M.; Lacík, I.; Hutchinson, R.A.; Buback, M. Modeling Acrylic Acid Radical Polymerization in Aqueous Solution. Macromol. React. Eng. 2016, 10, 95–107. [Google Scholar] [CrossRef]
  4. Khanlari, S.; Dubé, M.A. Effect of PH on Poly(Acrylic Acid) Solution Polymerization. J. Macromol. Sci. Part A Pure Appl. Chem. 2015, 52, 587–592. [Google Scholar] [CrossRef]
  5. Montenegro, G.C.; Gutierrez, C.G.; Vaillard, S.E.; Minari, R.J.; Vega, J.R.; Gugliotta, L.M. A Safety Strategy for Producing Poly(Acrylic Acid) of Low Molar Mass. Macromol. React. Eng. 2017, 11, 1600049. [Google Scholar] [CrossRef]
  6. Muenster, A.; Rohmann, M. Manufacture of Polymers of Acrylic Acid or Methacrylic Acid. U.S. Patent 4,301,266, 17 November 1981. [Google Scholar]
  7. Moulay, S.; Boukherissa, M.; Abdoune, F.; Benabdelmoumene, F.Z. Low Molecular Weight Poly(Acrylic Acid) as a Salt Scaling Inhibitor in Oilfield Operations. J. Iran. Chem. Soc. 2005, 2, 212–219. [Google Scholar] [CrossRef]
  8. Hou, Y.; Jin, X.; Sun, J.; Wang, H.; Zhao, X. Ultralow Molecular Weight Polyacrylic Acid Synthesis Method. CN Patent 105,481,676, 13 April 2016. [Google Scholar]
  9. Nauman, E.B. Polymer Reaction Engineering; Asua, J.M., Ed.; Blackwell Publishing Ltd.: Oxford, UK, 2007; ISBN 9780470692134. [Google Scholar]
  10. Cutié, S.S.; Smith, P.B.; Henton, D.E.; Staples, T.L.; Powell, C. Acrylic Acid Polymerization Kinetics. J. Polym. Sci. Part B Polym. Phys. 1997, 35, 2029–2047. [Google Scholar] [CrossRef]
  11. Manickam, S.P.; Venkatarao, K.; Subbaratnam, N.R. Peroxo Salts as Initiators of Vinyl Polymerization-2. Kinetics of Polymerization of Acrylic Acid and Sodium-Acrylate by Peroxodisulphate in Aqueous Solution-Effect of PH and Ag+ Catalysis. Eur. Polym. J. 1979, 15, 483–487. [Google Scholar] [CrossRef]
  12. Barth, J.; Meiser, W.; Buback, M. SP-PLP-EPR Study into Termination and Transfer Kinetics of Non-Ionized Acrylic Acid Polymerized in Aqueous Solution. Macromolecules 2012, 45, 1339–1345. [Google Scholar] [CrossRef]
  13. Qiu, L.; Wang, K.; Zhu, S.; Lu, Y.; Luo, G. Kinetics Study of Acrylic Acid Polymerization with a Microreactor Platform. Chem. Eng. J. 2016, 284, 233–239. [Google Scholar] [CrossRef]
  14. Lacik, I.; Beuermann, S.; Buback, M. PLP-SEC Study into the Free-Radical Propagation Rate Coefficients of Partially and Fully Ionized Acrylic Acid in Aqueous Solution. Macromol. Chem. Phys. 2004, 205, 1080–1087. [Google Scholar] [CrossRef]
  15. Fujita, M.; Izato, Y.I.; Iizuka, Y.; Miyake, A. Thermal Hazard Evaluation of Runaway Polymerization of Acrylic Acid. Process Saf. Environ. Prot. 2019, 129, 339–347. [Google Scholar] [CrossRef]
  16. Dnebosky, J.; Jedlicka, P.; Kocianova, M.; Kristek, J.; Parizek, R. Process for Preparing Low-Molecular Polyacrylic Acids or Salts Thereof. CZ Patent 278,382, 15 December 1993. [Google Scholar]
  17. Matsuda, M.; Yamamoto, N. Production of Aqueous Solution of Low-Mw Polysodium Acrylate. JP Patent H01-190,702, 31 July 1989. [Google Scholar]
  18. Kuchta, F.D.; Van Herk, A.M.; German, A.L. Propagation Kinetics of Acrylic and Methacrylic Acid in Water and Organic Solvents Studied by Pulsed-Laser Polymerization. Macromolecules 2000, 33, 3641–3649. [Google Scholar] [CrossRef]
  19. Beuermann, S.; García, N. A Novel Approach to the Understanding of the Solvent Effects in Radical Polymerization Propagation Kinetics. Macromolecules 2004, 37, 3018–3025. [Google Scholar] [CrossRef]
  20. Deglmann, P.; Hungenberg, K.D.; Vale, H.M. Dependence of Propagation Rate Coefficients in Radical Polymerization on Solution Properties: A Quantitative Thermodynamic Interpretation. Macromol. React. Eng. 2018, 12, 1800010. [Google Scholar] [CrossRef]
  21. Wikström, H.; Marsac, P.J.; Taylor, L.S. In-Line Monitoring of Hydrate Formation during Wet Granulation Using Raman Spectroscopy. J. Pharm. Sci. 2005, 94, 209–219. [Google Scholar] [CrossRef] [PubMed]
  22. Abu-Absi, N.R.; Hausladen, M.C.; Sakhamuri, S.; Li, Z.J.; Cuellar, M.E.; Borys, M.C.; Kenty, B.M.; Strachan, D.J. Real Time Monitoring of Multiple Parameters in Mammalian Cell Culture Bioreactors Using an In-Line Raman Spectroscopy Probe. Biotechnol. Bioeng. 2010, 108, 1215–1221. [Google Scholar] [CrossRef]
  23. Giammarise, A. Near-Infrared Analysis of the Styrene Content of Copolymers with Aliphatic Acrylates and Methacrylates. Anal. Lett. 1969, 2, 117–121. [Google Scholar] [CrossRef]
  24. Vieira, R.A.M.; Embiruçu, M.; Sayer, C.; Pinto, J.C.; Lima, E.L. Control Strategies for Complex Chemical Processes. Applications in Polymerization Processes. Comput. Chem. Eng. 2003, 27, 1307–1327. [Google Scholar] [CrossRef]
  25. Klement, T.; Kockmann, N.; Röder, T. Reactor Concept for Contactless Kinetic Measurement in Oscillating Droplets via Raman Spectroscopy. Chemie-Ingenieur-Technik 2019, 91, 651–656. [Google Scholar] [CrossRef]
  26. Mohammed, A.H.; Mahmood, T.A.; Yousif, S.A.; Hussin, N.A.; Obaid, N.N. Kinetic Investigation of Polymerization Methyl Methacrylate in Benzene. Dusunen Adam 2019, 10, 1839–1847. [Google Scholar]
  27. Edmondson, S.; Gilbert, M. The Chemical Nature of Plastics Polymerization. Brydson’s Plast. Mater. 2017, 19–37. [Google Scholar] [CrossRef]
  28. Becker, H.; Vogel, H. The Role of Hydroquinone Monomethyl Ether in the Stabilization of Acrylic Acid. Chem. Eng. Technol. 2006, 29, 1227–1231. [Google Scholar] [CrossRef]
  29. Bates, R.G.; Paabo, M.; Robinson, R.A. Interpretation of ph measurements in alcohol—Water solvents. J. Phys. Chem. 1963, 67, 1833–1838. [Google Scholar] [CrossRef]
  30. Lorber, N.; Pavageau, B.; Mignard, E. Droplet-Based Millifluidics as a New Miniaturized Tool to Investigate Polymerization Reactions. Macromolecules 2010, 43, 5524–5529. [Google Scholar] [CrossRef]
  31. Kabanov, V.A.; Topchiev, D.A.; Karaputadze, T.M. Some Features of Radical Polymerization of Acrylic and Methacrylic Acid Salts in Aqueous Solutions. J. Polym. Sci. Part C Polym. Symp. 1973, 183, 173–183. [Google Scholar] [CrossRef]
  32. Ito, H.; Shimizu, A.; Suzuki, S. Polymerization of Acrylic Acid and the Effect of PH. J. Chem. Soc. Jpn. Ind. Chem. Sect. 1955, 58, 194. [Google Scholar]
  33. Kabanov, V.A.; Topchiev, D.A.; Karaputadze, T.M.; Mkrtchian, L.A. Kinetics and Mechanism of Radical Polymerization of Weak Unsaturated Acids in Aqueous Solutions. Eur. Polym. J. 1975, 11, 153–159. [Google Scholar] [CrossRef]
  34. Achilias, D.S.; Verros, G.D. Modeling of Diffusion-Controlled Reactions in Free Radical Solution and Bulk Polymerization: Model Validation by DSC Experiments. J. Appl. Polym. Sci. 2010, 116, 1842–1856. [Google Scholar] [CrossRef]
  35. Staudinger, H.; Schläpfer, P. Unpublished data. In Chemie und Technologie der Kunststoffe; Schulz, G., Houwink, R., Eds.; Akademische Verlagsgesellschaft m. b. H.: Leipzig, Germany, 1939; p. 79. [Google Scholar]
  36. Evans, A.G.; Tyrrall, E. Heats of Polymerization of Acrylic Acid and Derivatives. J. Polym. Sci. 1947, 2, 387–396. [Google Scholar] [CrossRef]
  37. Esposito, M.; Sayer, C.; Machad, R.A.F.; Araújo, P.H.H. Application of Calorimetry Technique to Estimate Conversion of Polymerization Reactions in a Standard Lab-Scale Reactor. Macromol. Symp. 2006, 245–246, 390–397. [Google Scholar] [CrossRef]
  38. de la Rosa, L.V.; Sudol, E.D.; El-Aasser, M.S.; Klein, A. Details of the Emulsion Polymerization of Styrene Using a Reaction Calorimeter. J. Polym. Sci. Part A Polym. Chem. 1996, 34, 461–473. [Google Scholar] [CrossRef]
  39. Pfeifer, C. Mechanistische Untersuchung Der in Acrylsäure Ablaufenden Prozesse. Ph.D. Thesis, Ernst-Berl-Institut für Technische und Makromolekulare Chemie der Technischen Universität Darmstadt, Darmstadt, Germany, 2015. [Google Scholar]
Figure 1. Automatic RC1e calibration for the determination of the heat passage term UA and the heat capacity cp of the reactor content. This is an example of the calibration before the reaction of 150 g/L acrylic acid in isopropanol at a reaction temperature of 70 °C. The left axis shows the heat flow of the calibration (QC) and the reaction (QR), the right axis the reactor temperature (TR) and the jacket temperature (TJ).
Applsci 11 09719 g001
Figure 2. Raman spectra of the reaction of 150 g/L acrylic acid in isopropyl alcohol at 75 °C every 32 s up to a conversion of 95%, determined by the integration of the highlighted band at 1635 cm−1 corresponding to the C=C stretching vibration.
Applsci 11 09719 g002
Figure 3. Temperature profile of acrylic acid polymerisations in isopropyl alcohol (150 g/L) initiated with AIBN (1 mol%). Solid lines show the temperatures in the reactor vessel, dotted lines display the corresponding jacket temperatures.
Applsci 11 09719 g003
Figure 4. Concentration profiles of acrylic acid polymerisations in isopropyl alcohol (150 g/L) initiated with AIBN: 0.5 mol% (a), and 1.0 mol% (b). Crosses denote the normalised integral of the C=C stretching vibration band acquired by Raman spectroscopy, multiplied by the initial acrylic acid concentration. Solid lines are fitted according to n-th order kinetics.
Applsci 11 09719 g004
Figure 5. (a) Plot of the respective fit errors for the fit of all conversion curves or concentration profiles according to reaction order n = 1 and n > 1 up to a certain conversion. The local error describes the error in the respective conversion range, the global error includes all measuring points of the reaction. Exemplary here were the acrylic acid polymerisations in isopropyl alcohol (150 g/L) initiated with 1 mol% AIBN. (b) Normalised concentration profile for a fit with first order kinetics considering only the first 30% of the reaction conversion. Curves for 70 °C and 75 °C are congruent.
Applsci 11 09719 g005
Figure 6. Conversion of acrylic acid polymerisations in isopropyl alcohol (150 g/L) at different temperatures determined by Raman spectroscopy: 0.5 mol% AIBN (a), and 1.0 mol% AIBN (b).
Applsci 11 09719 g006
Figure 7. Linear dependence of the square root of the initiator concentration on the initial polymerisation rate.
Applsci 11 09719 g007
Figure 8. Polymerisation rate of acrylic acid polymerisations in isopropyl alcohol (150 g/L) at different temperatures as a function of conversion determined by Raman spectroscopy: 0.5 mol% AIBN (a), and 1.0 mol% AIBN (b).
Applsci 11 09719 g008
Figure 9. Arrhenius parameter estimation plots of acrylic acid polymerisations in isopropyl alcohol (150 g/L, 1.0 mol% AIBN). (a) Plot of the simulated concentration profiles (solid lines) with the Arrhenius parameters estimated by Predici and the fitted experimental data (crosses). (b) Development of the k-values against the reaction conversion.
Applsci 11 09719 g009
Figure 10. Heat of reaction curves of acrylic acid polymerisations in isopropyl alcohol (150 g/L, 0.5 mol% AIBN). Here, the reaction times are aligned to the beginning of the reaction according to the calorimetric global conversion. The inner graph is a copy using a logarithmically scaled time axis and displays the negative range of the reaction heat.
Applsci 11 09719 g010
Figure 11. Comparison of reaction conversion curves of acrylic acid polymerisations in isopropyl alcohol (150 g/L, 1.0 mol% AIBN) acquired from Raman spectroscopy (solid lines) and reaction calorimetry (dashed lines).
Applsci 11 09719 g011
Figure 12. (a) Influence of different AIBN initiator concentrations on the weight and number average of molecular weight during polymerisation of acrylic acid in 2-propanol (150 g/L, 65 °C). (b) Molar mass distribution during polymerisation of acrylic acid in pure isopropanol, water with isopropanol as the CTA (IPA/AA = 0.16) and pure water at 0.5 mol% initiator, respectively. Molecular weights were determined after a conversion of about 95%.
Applsci 11 09719 g012
Figure 13. (a) Effect of temperature on the number- and weight-average molecular weight during the polymerisation of acrylic acid in 2-propanol (150 g/L, 1 mol% AIBN). (b) Corresponding influence of the initial monomer concentration at a constant reaction temperature of 65 °C. Molecular weights were determined after a conversion of about 95%.
Applsci 11 09719 g013
Table 1. Initial concentrations of acrylic acid (AA) and AIBN with their resulting reaction order and rate constants depending on the reaction temperature.
c0,AIBN [mol·L−1]c0,AA [mol·L−1]nT [°C]kn [L·mol−1·min−1]
0.01022.031.56600.0170
0.01032.051.85650.0308
0.01022.051.74700.0388
0.01032.051.68750.0477
0.02092.081.72600.0312
0.02082.081.72650.0440
0.02082.081.60700.0719
0.02082.081.72750.1543
0.03122.081.90600.0333
0.03122.082.07650.0616
0.03122.081.58700.0679
0.03122.081.64750.1015
Publisher’s Note: MDPI stays neutral with regard to jurisdictional claims in published maps and institutional affiliations.

