Article

Microcalorimetry—Versatile Method of Describing Bacterial Growth

by
Mihnea Ioan Gabriel Popa
1,2,*,
Adrian Cursaru
1,2,*,
Bogdan Serban
1,2,
Bogdan Cretu
1,2,
Andrei Alexandru Muntean
1,3,
Vlad Tudor Popa
4,
Mariana Carmen Chifiriuc
5 and
Cătălin Cîrstoiu
1,2
1
General Medicine, “Carol Davila” University of Medicine and Pharmacy, 020021 Bucharest, Romania
2
Department of Orthopaedics and Traumatology, Emergency University Hospital, 050098 Bucharest, Romania
3
“Cantacuzino” National Medico-Military Institute for Research and Development, 050096 Bucharest, Romania
4
“Ilie Murgulescu” Institute of Physical Chemistry, 060021 Bucharest, Romania
5
Department of Microbiology & Immunology, Faculty of Biology, University of Bucharest, 060101 Bucharest, Romania
*
Authors to whom correspondence should be addressed.
Appl. Sci. 2021, 11(20), 9740; https://doi.org/10.3390/app11209740
Submission received: 30 August 2021 / Revised: 9 October 2021 / Accepted: 13 October 2021 / Published: 19 October 2021
(This article belongs to the Special Issue Antibacterial Strategies in Biomaterials)

Abstract

:

Featured Application

A detailed investigation (including kinetic analysis) of the reproductible thermal signal produced by bacterial growth can lead to the development of alternative means of rapid bacterial identification. In order to be able to use this method in a clinical study, numerous experiments are needed, following the impact of as many parameters as possible, in order to try to simulate the clinical conditions.

Abstract

(1) Background: Due to the aging population in industrialized countries and due to the increase in the number of traffic or sports accidents, the number of artificial joints and implants for osteosynthesis will increase in the coming years. Therefore, the risk of postoperative infections will be higher as well. (2) Methods: For this study, we combined classical bacterial identification with the description of bacterial growth curves using microcalorimetry. (3) Results: We evaluated the growth of S. aureus and S. epedermidis, but we believe that this can be applied to any anaerobic or aerobic bacterial colony. We discovered that the time interval after which we can identify a growth curve does not exceed 15–20 h. (4) Conclusions: The diagnosis made by combining the methods of sonication and microcalorimetry manages to provide a great deal of information about the bacteria we studied. Microcalorimetry has real potential as a method for obtaining quick diagnosis in various cases of infection, but many more experiments need to be done to ensure the correct use of this technique. A detailed investigation (including kinetic analysis) of the reproducible thermal signal of bacterial growth can lead to the development of alternative means of rapid bacterial identification.

1. Introduction

Orthopedics, in accordance with all medical specialties, is in a continuous development that has accelerated in recent years due to technological developments. More than in other branches of medicine, in orthopedics and traumatology, foreign materials are frequently used to treat fractures or degenerative pathologies. If we take into account the number of joint replacement procedures, in the USA alone, there are over one million total hip and total knee replacement procedures performed each year [1]. All the materials used both in the treatment of chronic pathologies and in the case of traumatic pathologies are made of substances with excellent biocompatibility. In the literature following multicenter studies, a risk of less than 10% for the development of lifelong complications after the implantation of a device is described [2]. Both due to the aging population in industrialized countries and the increase in the number of traffic or sports accidents, the number of artificial joints and implants for osteosynthesis will increase in the coming years.
The process through which bacteria reach the implants is a complex one; the source of the infection may be a contaminated implant, errors during the surgical process, wound healing disorders of various etiologies or distant infections with hematogenous dissemination. For these reasons, in the case of planned surgeries, it is mandatory to investigate, identify, and treat any infectious outbreak present at a distance. There are studies that describe a two to three times higher rate of infection in patients with a dental abscess or an infectious pathology of the skin or digestive tract [3,4]. Given the large number of surgeries in which foreign materials are implanted, the risk of postoperative infections has increased for several reasons related to the patient, as well as unrelated ones: the time of the surgery, the surgical technique, and the environment in which the surgery is performed. In order to prevent this risk, a series of measures have been adopted to reduce the number of septic complications related to orthopedic implants. Minimizing the operative time is another important factor, as well as the routine administration of prophylactic antibiotics and, of course, the use of antibiotic-loaded implants in the most severe cases [5,6].
A very important biological aspect that must be taken into account is that any foreign material implanted in the human body will undergo physiological changes. The first process is the coating of the material by serum proteins and platelets; these proteins facilitate the adhesion of pathogens through different receptors. In the case of Staphylococcus aureus: fibronectin, collagen, vitronectin, and fibrin are molecules that mediate the adhesion to the surface of the osteosynthesis material. Following the adhesion, the pathogens multiply slowly to form a biofilm that has the ability to withstand the host’s cellular and humoral immune response [7,8].
The classic method of diagnosing infections is based on harvesting a pathological product and performing a cell culture, followed by investigating the antibiotic susceptibility of the microbial agent identified (e.g., antibiogram, CMI, CMB, etc.) [9]. In orthopedics, for the assessment of an infection of an implant, it has been shown that intraoperative tissue sampling has a sensitivity of 93%, higher compared to harvesting the pathological product and seeding it, in which case the sensitivity reaches a value of about 70%. This method appeared more than 100 years ago and has not changed significantly since then. The ability of bacteria to develop biofilm is known, which gives them resistance to antibiotic treatment and the host’s immune system [10,11].
The generation of biofilm, both at the interface with the bone and at the interface with the implanted material, is also a problem in establishing the correct diagnosis. A number of techniques have been studied in an attempt to increase the chance of correct identification. Pravizi et al. recommend the collection of at least three samples from different areas of the operating field, and they must be sown on both aerobic and anaerobic culture media [9,12,13]. Other authors describe increasing the specificity to over 90% and the sensitivity to over 80% by introducing the synovial fluid into a culture tube on a blood culture medium, together with at least one more sample collected, and investigated by classical laboratory methods [14,15]. Molecular biology methods for DNA/RNA identification and implant sonication are new techniques that appear to facilitate the diagnosis of orthopedic infections [9,16].
Microcalorimetry, as a science, dates back to the 18th century, when microcalorimeters were used to record the heat emitted by various small animals. They have become more and more sophisticated, with various possibilities to record the temperatures produced in relation to them, as well as to the environment. The current microcalorimetry devices have the ability to record thermal energy of very low intensity, being one of the most sensitive methods of bacterial identification, theoretically managing to identify the energy produced by only 6250–25,000 microorganisms/mL. The vast majority of bacteria are prokaryotes and, according to studies, a single bacterium can produce 1–3 pW in the case of anaerobic growth [17,18] and 1–4 pW in the case of aerobic growth [19,20]. Microcalorimetry has the ability to identify a pathogen, with a short latency of about several hours, even if it is very diluted in the environment from which the sample is made, due to exponential replication [21,22,23]. This capacity increases with the improvement of the technical data of the apparatus used and is influenced by the experimental conditions, the culture medium, and the bacterial species [23,24,25,26].
Calorimetry becomes useful in medicine because, due to the active metabolism of living organisms, they produce heat, which can provide interesting information in many bioanalyses [27,28]. To date, numerous tests have been performed on living structures, which have presented interesting data. Microcalorimetry has been used to identify infections but also to verify the susceptibility of pathogens to antibiotics [29]; this technique has also been used successfully in interpreting parasite growth or food degradation [30]. Following microcalorimetric studies on bacterial growth, several stages of bacterial development have been defined depending on their metabolism, information that is useful in the detection of microorganisms. Studies using strains of Escherichia coli [31] or Lactococcus lactis [32] in environments with different glucose concentrations and under aerobic conditions have shown that a bacterial population emits a different amount of heat during growth processes, directly linked to the environmental factors present at the time of the experiment, which is easy to see in the growth curves generated by these bacteria. In the case of studies conducted by Kabanova et al., experiments were performed with high glucose concentrations (50–100 g/L) in which the bacterial growth was stopped due to the very low pH of 4.3 (probably developed by bacterial excretion), and, in the case of a low concentration of glucose (2 g/L), the growth was stopped by the depletion of food sources. It is interesting to note that, although due to the different concentration of glucose, the energy released was higher under the conditions described in the first point, yet the growth curves show the same pattern of arrangement, being able to ensure bacterial identification [30,32].

2. Materials and Methods

2.1. Classic Method of Infections Diagnosis

2.1.1. Isolation and Identification of Bacterial Strains

For this study, 3 infected implants were used, extracted from hospitalized patients in the orthopedics and traumatology department of SUUB. Sampling was performed with a sterile swab impregnated with SSF; the entire surface of the prosthesis was wiped using this swab. The SSF suspension obtained was centrifuged (4000 rpm, 10 min); the sediment obtained, as well as the tissue collected from the samples, were kept at −70 °C. The swab was discharged on Petri dishes with blood agar and with Sabouraud agar, but also in liquid medium—simple broth. Incubation was performed for 24 h at 37 °C (and at 28 °C for any fungi on the Sabouraud agar plate). After 24 h, a blood agar plate and a Sabouraud plate were seeded from the broth, the plates being incubated under the same conditions mentioned above.

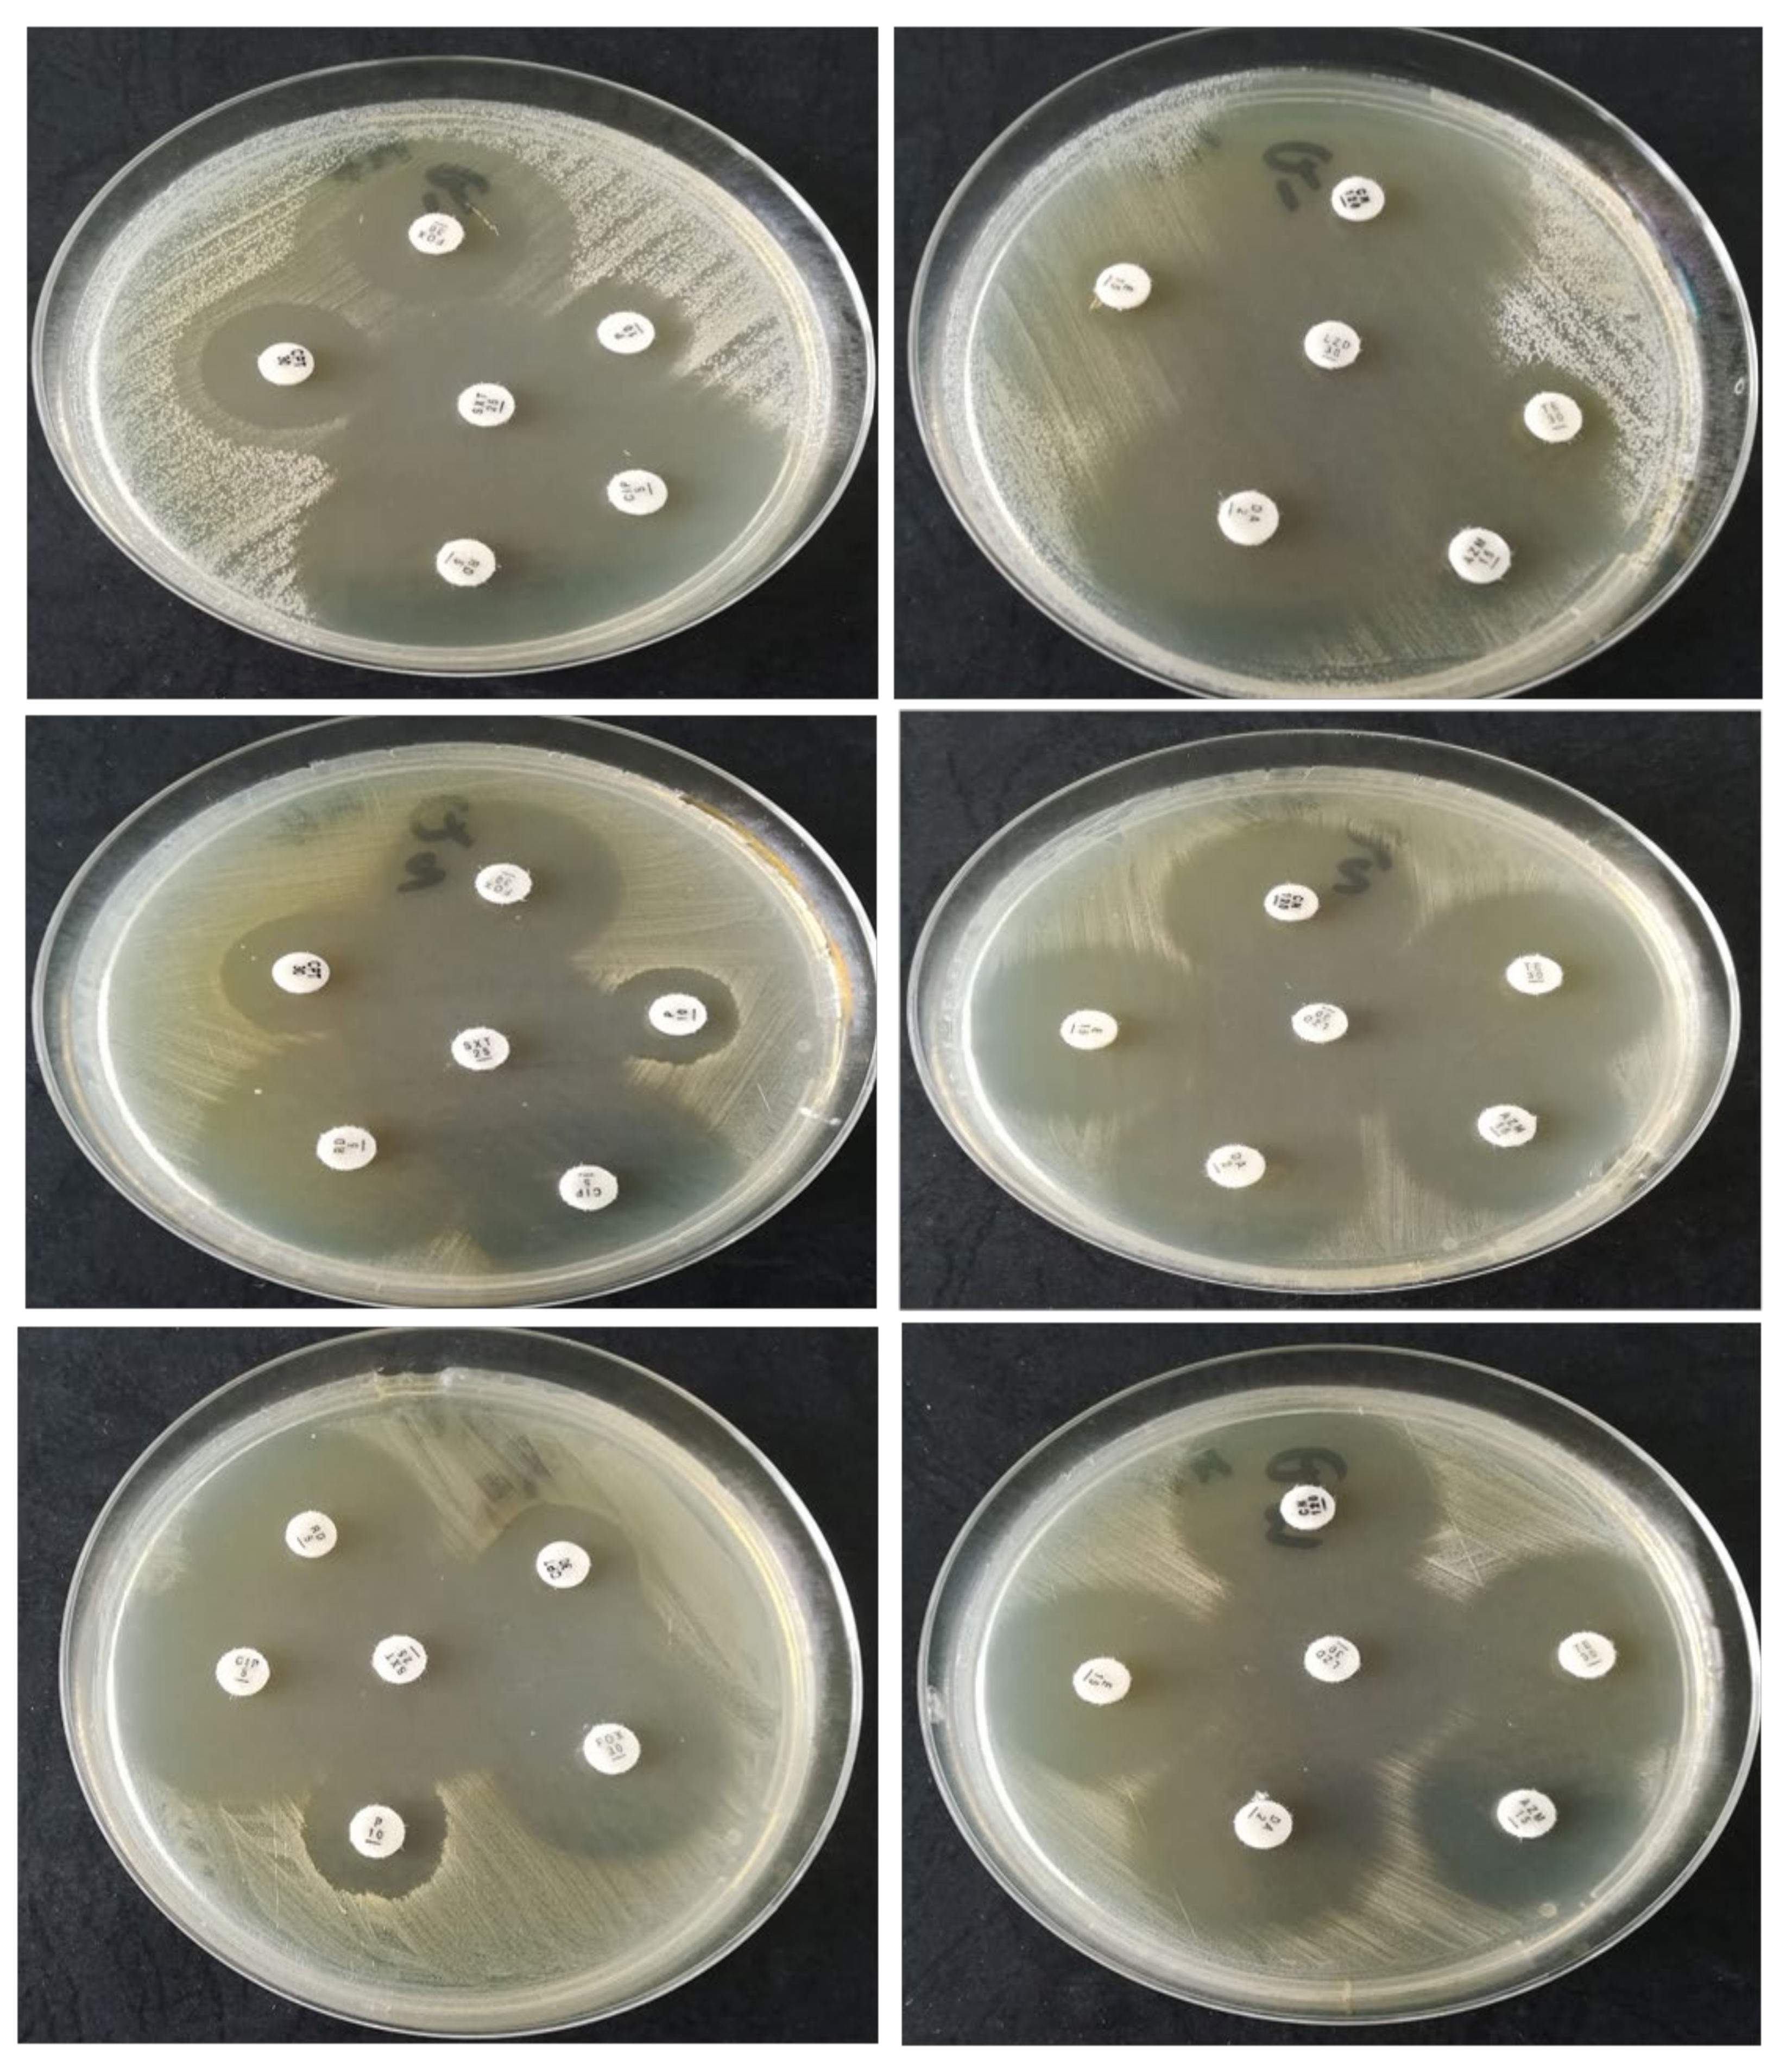
2.1.2. Strain Susceptibility Testing to Antibiotics—Kirby–Bauer Disk Diffusion Susceptibility Test Protocol

Following the recommendations of the 2018 edition, CLSI 2018, the bacterial suspensions made to obtain a 0.5 McFarland index were inoculated into the cloth on Müller Hinton (MH) agar test medium with the sterile swab. Disks inoculated with different antibiotic concentrations recommended by the standard procedures were applied to the inoculated plates. After incubation at 37 °C for 24 h, the results were determined by measuring the diameter of the zones of inhibition. The antibiotics tested were beta-lactam antibiotics: penicillin (P), cefoxitin (FOX), ceftaroline fosamil (CPT); aminoglycosides: gentamicin (CN); macrolides: azithromycin (AZM), erythromycin (E); tetracyclines: tetracycline (TE); fluoroquinolones: ciprofloxacin (CIP); lincosamides: clindamycin (DA); folic acid antagonists: trimethoprim sulfamethoxazole (SXT); ansamycins: rifampicin (RA); and oxazolidine: linezolid (LZD). The reference strain used as a control was S. aureus strain (ATCC 25923).

2.1.3. Testing the Virulence Factors Produced by the Analyzed Strains

The strains obtained in pure culture were seeded on media to highlight soluble, enzymatic virulence factors. The expression of soluble enzymatic virulence factors was determined using eight tests that aimed to highlight the following enzymes: hemolysins, amylase, caseinase, gelatinase, production of esculinase, DNase, lipase, and lecithinase.
(a) Hemolysin production
The strains were seeded on agar with the addition of 5% sheep blood. After incubation at 37 °C for 24 h, the appearance of hemolysis areas around the microbial culture indicated the production of hemolysins (pore-forming toxins).
(b) Lipase production
The bacterial strains were seeded in spot on agar with the addition of 1% Tween 80 (sorbitol 1-monooleate) and incubated for 72 h at 37 °C. The presence of an opaque precipitation zone around the culture spot, given by the formation of insoluble Ca oleate crystals (crystals formed between the released fatty acids and Ca2+, was considered a positive reaction.
(c) Lecithinase production
The strains were seeded in spot on agar containing egg yolk (2.5%) and incubated for 72 h at 37 °C. The appearance of a clear area around the microbial culture was considered a positive reaction (lecithinase production).
(d) Protease production (caseinase and gelatinase)
The strains were seeded in spot on agar with the addition of 15% casein and 3% gelatin, respectively. After incubation at 37 °C, for 72 h, the production of proteases was indicated by the appearance of precipitation areas around the culture spots due to the formation of calcium paracaseinate and transparent halos, respectively, due to the liquefaction of gelatin.
(e) Amylase production
Amylases were detected using simple agar to which starch was added, and hydrolysis was revealed by flooding the plate with Lugol’s solution (yellow ring around the culture spot, while the rest of the medium turned blue). The strains were seeded in spot on agar supplemented with 1% starch. After incubation at 37 °C for 72 h, the presence of the medium clarification zone around the culture spots of the positive strains was observed.
(f) Esculin hydrolysis
Esculin is hydrolyzed to glucose and esculetol. In the presence of Fe (C6H5FeO7) citrate (Fe3+) in the medium, the esculetol released under the action of a beta-galactosidase generates the formation of a black precipitate of ferric esculetin, composed of phenolic Fe with uncertain chemical structure. The strains were seeded in spot on medium with the addition of 1% esculin and iron citrate. After incubation at 37 °C for 72 h, following hydrolysis of esculin, esculetol was formed that, when combined with the iron salts in the medium (1% ferric ammonium citrate), causes the medium to blacken.
(g) DNase production
Bacterial DNases act on bacterial DNA by releasing mono- or dinucleotides. The strains were seeded in spot on agar with DNA (Merck, Germany) and toluidine blue and incubated at 37 °C for 72 h. DNases production was indicated by the appearance of a pink halo around the microbial culture.

2.2. Bacterial Identifications Using Microcalorimetry

For the experiments, our team used two microcalorimetry machines with a differential scanning mechanism: Set MicroDSC III and Micro Dsc VII. To protect the 3D sensor, we used pure argon in gaseous state (99.99% SIAD-TP). For data acquisition and then processing, a dedicated software was used, namely Setsoft 2000 v 3.05. In all experiments, we used microcalorimetric cells with a maximum capacity of 1 mL.
Müller–Hinton agar medium (MH) was used to isolate the bacteria, which is a common medium used to isolate pathogens and to perform antibiograms. This medium is composed of animal protein extract (2.0 g), hydrolyzed casein (17.5 g), starch (1.5 g), agar (17.0 g) diluted in a liter of distilled water, and the pH was made neutral at 25 °C. After making the medium in both liquid and solid form, its sterilization with wet heat was performed. Each batch was verified to be microbiologically pure.
The experiments were performed under the same conditions to keep a single unknown in the equation, namely the pathogen. We loaded both the reference type and the sample type microcalorimetric cell with 0.6 mL of medium, and the growth temperature maintained throughout the experiment was 37 °C.
In order to carry out a microcalorimetric experiment considering the fact that this method is a relatively new one, there is no extensive experimental basis in the literature at the global level, so, to describe a bacterium, we decided to perform several experiments to confirm the thermogram obtained. For each pathogen presented in this paper we performed 3 successive experiments with the same temperature conditions and maintaining all identical parameters. We illustrated a single image because they are superimposable. Without this control, we could not say for sure that the thermogram described represents the pathogen investigated. Of course, this method used by our team is one that satisfies the current experimental needs and, certainly, with obtaining new information, we will modify our working protocol accordingly to achieve the best results and be able to become as relevant as possible scientifically.
  • We introduced in a nephelometric tube 3000 µL of sterile medium of MH; using a nephelometer, we measured the McFarland index and wrote it down.
  • Using an inoculating loop, we extracted 10 µL to 20 µL of the pathological product and dispersed it in 300 µL of MH medium, ensuring that the microorganisms were homogeneously dispersed.
  • Repeated pipetting of 2 µL in the nephelometric tube described in the first point until the McFarland index rose by 1.0. We pipetted only 2 µL at once to be as precise as possible.
  • Sample cells were filled at room temperature and were hermetically sealed using a silicone o-ring. A batch cell containing 600 μL sterile MH was used as reference for differential scanning microcalorimetry (μDSC).
  • 600 μL of the medium inoculated in point 3 were introduced in a batch cell, hermetically sealed using a silicone o-ring, and then introduced in the microcalorimeter.
  • After the sample and the inoculated tubes were introduced in the cell, the acquisition program was turned on and set to maintain 37 °C temperature. We stopped and assessed the recording after the described curve went in the isothermal line for 2 up to 3 h.
After the experiments, all biological products were placed in a tank containing distilled water and chloramine to disinfect the instruments used. After completing an experiment, the microcalorimetric cells were placed in a sonication bath for 15 min and then sterilized in an autoclave at 126 °C and stored in the work hood.

3. Results

The strains collected (from the 3 implants, marked as P1, P2, P3) were identified by MALDI-TOF as P1—Staphylococcus epidermidis, P2—Staphylococcus aureus, P3—Staphylococcus aureus and using classic microbiology on blood agar and Sabouraud agar medium (Figure 1 and Figure 2).
The results showed that all the isolated strains were resistant to some beta-lactam antibiotics (penicillin and ceftaroline). The S. epidermidis strain, besides the resistance to beta-lactams, was also resistant to tetracycline and the tested macrolides (azithromycin and erythromycin) (Table 1, Figure 3).
The analyzed strains showed different virulence factors. The obtained results are presented in Figure 4.
Following the classic microbiology tests described above, we can see that, although the two bacterial, strains P2—Staphylococcus aureus and P3—Staphylococcus aureus, are different strains collected from different patients, they seem very similar and we cannot make a very clear difference between the two. This aspect is very beneficial for the current study, which aims to compare the classical method of bacterial diagnosis with microcalorimetry. As we will describe in the following experiments, in relation to the bacterial investigation in terms of the thermal growth curves generated by microcalorimetry, we can see changes in kinetics that help us differentiate the two. Of course, through further studies in which we can change different parameters, these differences may become even more obvious. The aim of this study and of our team in general is to find ways that we can characterize the pathogens with increasing sensitivity and specificity and then apply this method clinically, which, in our opinion, has an increased ability to bring innovation in medicine and in understanding the development of pathogens.
We conducted experiments with 2 S. aureus strains and one S. epidermidis strain obtained from patients intraoperatively after the sonication of the infected implants. All the experiments were conducted with samples of 0,6 mL to ensure reproducibility and at 37 °C, the normal temperature of the body at which the bacteria develop. All the experiments used the same bacterial concentration. The media used for the bacteria was Müeller–Hinton (MH). All the experiments displayed complex thermal signals.
For a better description of the growth curves of the bacteria, we proposed and analyzed the thermogram using key points on a set of quantitative parameters. These points are: thermal signal detection, establishment of the exponential growth, the peak, and the return to baseline. The associated quantities to these points (times, i.e., the corresponding positions or intervals on the time scale and heat flow values) can be used to characterize the raw bacterial growth thermograms as well as to differentiate the microorganisms.
We analyzed the thermogram of all three Staphylococcus strains and, as can be seen from the figures below, we observed similarities for all the experiments (Figure 5, Figure 6, Figure 7 and Figure 8); the time needed for the bacteria to grow as well as the heat flow generated by their growth was, for both experiments, in the same parameters.
In this study, we evaluated the growth of S. aureus and S. epedermidis, but we believe that this can be applied to any anaerobic or aerobic bacterial colony. As you can see in the adjacent figures, the time interval after which we can identify a growth curve does not exceed 15–20 h.

4. Discussion

A study by Romano et al. stressed the importance of correct and early bacterial identification in relation to the negative economic potential of administering empirical treatments or treating implants decementation or mobilization as having an aseptic cause. The economic benefit of sonication is that a single device is used at no additional cost and without the need for expensive reagents. It has been shown that making an incorrect diagnosis using this technique produces a burden on the health system of only 2%, compared to other more sophisticated methods whose failure to establish the correct diagnosis can raise costs by up to 20%. The precise identification of the microbial agents reduces the hospitalization period of some patients by applying the correct early treatment, which leads to facilitating their social reintegration and reducing costs for the health system [33,34].
Klouche et al. estimate that the costs of a septic revision total knee arthroplasty can be up to 2.6 times higher than an aseptic revision. Under these conditions, the question arises as to how to approach a case that is assumed to be aseptic but in which positive cultures are highlighted, this being possible only by using recent diagnostic methods, classical bacteriology giving, in many of these cases, false negative results [35].
It is assumed that many aseptic decementations may in fact be latent periprosthetic joint infections with a weak pathogenic microorganism, and, having no suggestive clinical and laboratory resonance, they are perceived as non-existent and overlooked. With this idea in mind, Saleh and colleagues assumed that the number of periprosthetic joint infections could be underestimated, especially among patients presenting for an implant revision with an atypical clinical and laboratory examination that does not indicate an infection [36].
In numerous studies in which sonication has been used to increase the sensitivity of the microbiological diagnostic testing for prostheses extracted during revisions for aseptic decementation, positive cultures have been identified. These results highlighted problems related to the current protocol applied for an assumed aseptic revision. In a study conducted by Renard et al., the identification rates of some microorganisms on the extracted implants were 15%. These data can also be observed in other studies by Berend et al., Wee et al., or Barrack et al., who identified microorganisms in assumed aseptic mobilizations of 6.8% [37], 7.5% [38], and 5.9%, respectively [39]. Another study by Saleh and colleagues, which included revisions of 1540 hip or knee prostheses, identified a pathogen detection rate of 10% [36]. In all these cases, antibiotic therapy was initiated and no infections were described in the first year after revision.
Morgenstern et al. stressed the importance of tests to identify periprosthetic tissue infection using histological identification due to its greater sensitivity and specificity. Another important method that can give us information about an infection in this regard is the search for leukocytes in the synovial fluid: the increased number of this cell will raise a question regarding possible infection in the region. However, classical microbiological tests cannot be abandoned [40]. From the study data, it appears that the sensitivity of the culture of synovial fluid was 52%, 8% lower than by using the multiplex PCR technique made from the same fluid. In addition to a relatively small difference related to the sensitivity between the two methods, the study team succeeded in demonstrating that the multiplex PCR technique can detect low virulence bacteria, such as Cutibacterium spp. or coagulase-negative staphylococci, providing, at the same time, a faster response, in about 5 h, compared to a classic bacterial culture [37,38,39,41].
The microcalorimeter has vats into which the cells used for studies are inserted; these vats manage to isolate the cells from the external environment. The ability of the microcalorimeter to isolate the cells is not perfect. For this reason, it is important to maintain a constant temperature in the room where the experiments take place because, otherwise, variations in the environment temperature may lead to errors in recording the signal by the device. Sensitivity is beneficial for performing precise experiments, but, if the working protocol is not followed, procedural flaws may occur that invalidate the experiments [42,43,44].
An important factor in conducting a successful experiment is related to how the experiment is designed. The formulation of medium and long-term goals is essential, because a successful experiment is one in which only one parameter is modified (temperature, environment, volume, bacterial dilution), and, if those who intend to perform an experiment do not follow a well-established protocol, there is the possibility of conducting an experiment that does not provide valid information because it cannot be interpreted in context [21,22,23,45].
The stages in which a test is prepared are important for a successful experiment. First, the microcalorimetric sample must be made from a freshly sown and incubated medium (12–24 h) because, otherwise, a significant amount of medium will be represented by secondary metabolic products, without caloric significance, which do not contribute as a substrate for bacterial growth and decrease the pH of the environment, making it a nutrient-depleted environment. The presence of these products influences the McFarland index identified with the help of the nephelometer thus performing blind experiments without knowing the amount of bacteria inside the sample. Conducting such studies cannot provide a way to conduct research because each experiment will be different due to a lack of predictability [46,47].
Microcalorimetry is a method that can be very successful in the medical field because it offers a significant number of capabilities. We can introduce any type of medium into the microcalorimetric cell so that any product harvested from the patient is potentially usable for a test, of course with the development of a working protocol before use. In addition to the ability to identify the basal metabolism of many living organisms, this method can be used to test the susceptibility of pathogens to antibiotics [21,22,23,24,48,49].
Because we are discussing a method that is still under development, we excluded samples because, for different reasons, they provided erroneous information about the thermal recording of bacterial growth. They showed errors for various reasons, such as, because microcalorimetry is very sensitive to a temporary change in the temperature of the room where the microcalorimeters are, thermal events appeared on the thermogram that invalidated the recording. Another such example is represented by the prolonged time from when the sample is prepared to when it is introduced in the microcalorimeter because, if the bacteria already start to develop, the beginning of the microcalorimetric recording is not from the isoelectric line, modifying the experiment, invalidating it.
Microcalorimetry is a method that has the potential to be used to describe the differences between two bacterial strains. Following the information obtained, the treatment can be aimed at the pathogen that causes the patient’s suffering. As we demonstrated in a previous article, bacterial populations of Staphylococcus aureus and Escherichia coli exhibit different microcalorimetric growth patterns in both qualitative and quantitative assessments. The discrimination method advanced has its limitations. For the time being, this method is not intended to be used in clinical practice with raw biological products as there is no control on the bacterial sample concentration and other cell populations that could contaminate the thermogram [50].

5. Conclusions

The diagnosis made by combining the methods of sonication and microcalorimetry manages to provide a great deal of information about the bacteria studied.
As observed in the presentation above, even if only three samples from three different patients were studied, the number of tests performed is very large and quite complex. The data obtained are encouraging and lead to the proposal to continue collaboration and study in this field.
Microcalorimetry has real potential as a method for obtaining quick diagnosis in various cases of infection, but many more experiments need to be done to ensure the correct use of this technique.
A detailed investigation (including kinetic analysis) of the reproducible thermal signal of bacterial growth can lead to the development of alternative means of rapid bacterial identification.
In order to be able to use this method in a clinical study, numerous experiments are needed, following the impact of as many parameters as possible, in order to try to simulate the clinical conditions.
Once sufficient stackable experiments are accumulated, by corroborating them, a working algorithm can be created with the ability to provide information quickly and with high sensitivity that can be viewed in real time.

Author Contributions

Conceptualization, M.I.G.P. and A.C.; methodology, A.A.M.; software, A.A.M.; validation, M.I.G.P., A.C. and B.S.; formal analysis, B.C.; investigation, B.C.; resources, M.I.G.P.; data curation, B.S.; writing—original draft preparation, M.I.G.P.; writing—review and editing, V.T.P.; supervision, M.C.C.; project administration, C.C. All authors have read and agreed to the published version of the manuscript.

Funding

This research received no external funding.

Institutional Review Board Statement

Not applicable.

Informed Consent Statement

Informed consent was obtained from all subjects involved in the study.

Conflicts of Interest

The authors declare no conflict of interest.

References

  1. Steiner, C.; Andrews, R.; Barrett, M.; Weiss, A. HCUP Projections: Mobility/Orthopedic Procedures 2003 to 2012. 2012. HCUP Projections Report # 2012-03. 2012 Sep 20. U.S. Agency for Healthcare Research and Quality. Available online: http://hcup-us.ahrq.gov/reports/projections/2012-03.pdf (accessed on 25 September 2021).
  2. Gheorghe, A.; Moran, G.; Duffy, H.; Roberts, T.; Pinkney, T.; Calvert, M. Health Utility Values Associated with Surgical Site Infection: A Systematic Review. Value Health 2015, 18, 1126–1137. [Google Scholar] [CrossRef] [Green Version]
  3. Li, H.K.; Rombach, I.; Zambellas, R.; Walker, S.; McNally, M.; Atkins, B.; Lipsky, B.; Hughes, H.; Bose, D.; Kumin, M. Oral versus intravenous antibiotics for bone and joint infection. N. Engl. J. Med. 2019, 380, 425–436. [Google Scholar] [CrossRef]
  4. Metsemakers, W.J.; Fragomen, A.T.; Moriarty, T.F.; Morgenstern, M.; Egol, K.; Zalavras, C.; Obremskey, W.; Raschke, M.; McNally, M. Evidence-based recommendations for Local antimicrobial strategies and dead space management in Fracture-Related Infection. J. Orthop. Trauma 2020, 34, 18. [Google Scholar] [CrossRef]
  5. Mattiassich, G.; Ortmaier, R.; Rittenschober, F.; Hochreiter, J. Diagnostic parameters in periprosthetic infections: The current state of the literature. Eur. J. Orthop. Surg. Traumatol. 2018, 28, 1573–1580. [Google Scholar] [CrossRef]
  6. Schwarz, E.M.; Parvizi, J.; Gehrke, T.; Aiyer, A.; Battenberg, A.; Brown, S.; Callaghan, J.; Citak, M.; Egol, K.; Garrigues, G. 2018 International Consensus Meeting on Musculoskeletal Infection: Research Priorities from the General Assembly Questions. J. Orthop. Res. 2019, 37, 997–1006. [Google Scholar] [CrossRef]
  7. Mauffrey, C.; Herbert, B.; Young, H.; Wilson, M.; Hake, M.; Stahel, P. The role of biofilm on orthopaedic implants: The “Holy Grail” of post-traumatic infection management. Eur. J. Trauma Emerg. Surg. 2016, 42, 411–416. [Google Scholar] [CrossRef] [PubMed]
  8. Mihailescu, R.; Furustrand Tafin, U.; Corvec, C.; Olivia, A.; Betrisey, B.; Borens, O.; Trampuz, A. High Activity of Fosfomycin and Rifampin against Methicillin-Resistant Staphylococcus aureus Biofilm In Vitro and in an Experimental Foreign-Body Infection Model. Antimicrob Agents Chemother. 2014, 58, 2547–2553. [Google Scholar] [CrossRef] [PubMed] [Green Version]
  9. Govaert, G.A.M.; Kuehl, R.; Trampuz, A.; Atkins, B.; Morgenstern, M.; Obremskey, W.; Verhofstad, M.; McNally, M.; Metsemakers, W. Diagnosing Fracture-related infection: Current concepts and recommendations. J. Orthop. Trauma 2020, 34, 8. [Google Scholar] [CrossRef] [PubMed]
  10. Conlan, T.; Beebe, M.; Weinlei, C. New Imaging, Diagnostic and Assessment Techniques in Orthopedic Trauma. Orthop. Clin. N. Am. 2019, 50, 47–56. [Google Scholar] [CrossRef] [PubMed]
  11. Mihai, M.M.; Holban, A.M.; Giurcaneanu, C.; Popa, L.G.; Oanea, R.M.; Lazar, V.; Chifiriuc, M.C.; Popa, M.; Popa, M.I. Microbial biofilms: Impact on the pathogenesis of periodontitis, cystic fibrosis, chronic wounds and medical device-related infections. Curr. Top. Med. Chem. 2015, 15, 1552–1576. [Google Scholar] [CrossRef]
  12. Parvizi, J.; Zmistowski, B.; Berbari, E.; Bauer, T.W.; Springer, B.D.; Della, C.J.; Garvin, K.L.; Mont, M.A.; Wongworwawat, M.D.; Zalavras, C.G. New definition for periprosthetic joint infection: From the workgroup of the Musculoskeletal Infection Society. Clin. Orthop. Relat. Res. 2011, 469, 2992–2994. [Google Scholar] [CrossRef] [PubMed] [Green Version]
  13. Zaharia, D.C.; Popa, M.G.; Steriade, A.T.; Muntean, A.A.; Balint, O.; Micuţ, R.; Popa, V.T.; Popa, M.I.; Bogdan, M.A. Microcalorimetry—A new method for bacterial characterisation. Pneumologia 2013, 62, 232–235. [Google Scholar] [PubMed]
  14. Renard, G.; Laffosse, J.; Tibbo, M.; Luceana, T.; Cavaignac, E.; Rouvillain, J.L.; Chiron, P.; Severyns, M.; Reina, N. Periprosthetic joint infection in aseptic total hip arthroplasty revision. Int. Orthop. 2019, 44, 735–741. [Google Scholar] [CrossRef] [PubMed]
  15. Cursaru, A.; Cretu, B.; Serban, B.; Lupu, A.G.; Iacobescu, G.; Popa, M.; Cursaru, R.; Cirstoiu, C. Mechanical Safety Study and Antibiotic-loaded Polumethylmethacrylate Spacers Threshold, Manufactured Intraoperatively, in orthopaedic Surgery. Mater. Plast. 2020, 57, 317–324. [Google Scholar] [CrossRef]
  16. Rak, M.; Kavcic, M.; Trebse, R.; Cor, A. Detection of bacteria with molecular methods in prosthetic joint infection: Sonication fluid better than periprosthetic tissue. Acta Orthop. 2016, 87, 339–345. [Google Scholar] [CrossRef] [PubMed] [Green Version]
  17. James, A.M. Thermal and energetic studies of cellular biological systems. Bristol. Wright. 1987, 1, 5–67 ISBN: 9781483193557. [Google Scholar]
  18. Tellapragada, C.; Hasan, B.; Antonelli, A.; Maruri, A.; Vogel, C.; Gijon, D.; Coppi, M.; Verbon, A.; Wamel, W.; Rossolini, G.M.; et al. Isothermal microcalorimetry minimal inhibitory concentration testing in extensively drug resistant Gram-negative bacilli: A multicentre study. Clin. Microbiol. Infect. 2020, 26, 1413.e1–1413.e7. [Google Scholar] [CrossRef] [Green Version]
  19. Beezer, A.E.; Bettelheim, K.; Newell, R.D.; Stevens, J. Diagnosis of bacteriuria by flow microcalorimetry: Preliminary report. Sci. Tools 1974, 21, 13–16. [Google Scholar]
  20. Maskow, T.; Wolf, K.; Kunze, W.; Enders, S.; Harms, H. Rapid analysis of bacterial contamination of tap water using isothermal calorimetry. Thermochim. Acta 2012, 543, 273–280. [Google Scholar] [CrossRef]
  21. Wadsö, I. Isothermal microcalorimetry in applied biology. Thermochim. Acta 2002, 394, 305–311. [Google Scholar] [CrossRef]
  22. Braissant, O.; Keiser, J.; Meister, I.; Bachmann, A.; Wirz, D.; Gopfert, B.; Bonkat, G.; Wadso, I. Isothermal microcalorimetry accurately detects bacteria, tumorous microtissues, and parasitic worms in a label-free well-plate assay. Biotechnol. J. 2015, 10, 460–468. [Google Scholar] [CrossRef] [Green Version]
  23. Braissant, O.; Muller, G.; Egli, A.; Widmer, A.; Frei, R.; Halla, A.; Wirz, D.; Gasser, T.C.; Bachmann, A.; Wagenlehner, F.; et al. Seven hours to adequate antimicrobial therapy in urosepsis using isothermal microcalorimetry. J. Clin. Microbiol. 2014, 52, 624–626. [Google Scholar] [CrossRef] [Green Version]
  24. Borens, O.; Yusuf, E.; Steinrucken, J.; Trampuz, A. Accurate and early diagnosis of orthopedic device-related infection by microbial heat production and sonication. J. Orthop. Res. 2013, 31, 1700–1703. [Google Scholar] [CrossRef]
  25. Zaharia, D.C.; Iancu, C.; Steriade, A.T.; Muntean, A.A.; Balint, O.; Popa, V.T.; Popa, M.I.; Bogdan, M.A. MicroDSC study of Staphylococcus epidermidis growth. BMC Microbiol. 2010, 10, 322. [Google Scholar] [CrossRef] [Green Version]
  26. Keiser, J.; Manneck, T.; Kirchhofer, C.; Braissant, O. Isothermal microcalorimetry to study the activity of triclabendazole and its metabolites on juvenile and adult Fasciola hepatica. Exp. Parasitol. 2013, 133, 265–268. [Google Scholar] [CrossRef]
  27. Marmor, S.; Kerroumi, Y. Patient-specific risk factors for infection in arthroplasty procedure. Orthop. Traumatol. Surg. Res. 2016, 102 (Suppl. 1), S113–S119. [Google Scholar] [CrossRef]
  28. Popa, M.G.; Popa, V.; Muntean, A.A.; Popa, V.T.; Dragomirescu, C.C.; Eremia, I.; Nica, S.; Popa, M.I.; Cîrstoiu, C. Microcalorimetric growth evaluation of Candida albicans in different condition. Situations 2020, 7, 9. [Google Scholar] [CrossRef]
  29. Graves, N.; Wloch, C.; Wilson, J.; Wilson, J.; Barnett, A.; Sutton, A.; Cooper, N.; Merollini, K.; McCreanor, V.; Cheng, Q.; et al. A cost-effectiveness modelling study of strategies to reduce risk of infection following primary hip replacement based on a systematic review. Health Technol. Assess. 2016, 20, 1–144. [Google Scholar] [CrossRef] [Green Version]
  30. Butini, M.E.; Abbandonato, G.; Trampuz, A.; Rienzo, C.D.; Di Luca, M. Isothermal microcalorimetry detects the presence of persister cells in a Staphylococcus aureus biofilm after vancomycin treatment. Front. Microbiol. 2019, 10, 332. [Google Scholar] [CrossRef]
  31. Xie, C.L.; Wang, H.; Qu, S.S. Microcalorimetric study on the aerobic growth of Escherichia coli. Thermochim. Acta 1995, 253, 175–182. [Google Scholar] [CrossRef]
  32. Kabanova, N.; Kazarjan, A.; Stulova, I.; Vilu, R. Microcalorimetric study of growth of Lactococcus lactis IL1403 at different glucose concentrations in broth. Thermochim. Acta 2009, 496, 87–92. [Google Scholar] [CrossRef]
  33. Song, Z.; Borgwardt, L.; Hoiby, N.; Wu, H.; Sorensen, T.S.; Borgwardt, A. Prosthesis infections after orthopedic joint replacement: The possible role of bacterial biofilms. Orthop. Rev. 2013, 5, 65–71. [Google Scholar] [CrossRef] [Green Version]
  34. Romano, C.L.; Trentinaglia, M.T.; De Vecchi, E.; Logoluso, N.; George, D.A.; Morelli, I.; Drago, L. Cost-beneft analysis of antibiofilm microbiological techniques for peri-prosthetic joint infection diagnosis. BMC Infect Dis. 2018, 18, 154. [Google Scholar] [CrossRef] [Green Version]
  35. Renz, N.; Yermak, K.; Perka, C.; Trampuz, A. Alpha defensin lateral flow test for diagnosis of periprosthetic joint infection. Not a screening but a confirmatory test. J. Bone Jt. Surg. Am. 2018, 100, 742–750. [Google Scholar] [CrossRef]
  36. Saleh, A.; Guirguis, A.; Klika, A.; Johnson, L.; Higuera, C.A.; Barsoum, W.K. Unexpected positive intraoperative cultures in aseptic revision arthroplasty. J. Arthroplast. 2014, 29, 2181–2186. [Google Scholar] [CrossRef]
  37. Berend, K.R.; Lombardi, A.V.; Adams, J.B. Unexpected positive intraoperative cultures and gram stain in revision total hip arthroplasty for presumed aseptic failure. Orthopedics 2014, 30, 1051–1053. [Google Scholar] [CrossRef]
  38. Wee, A.T.; Morrey, B.F.; Sanchez-Sotelo, J. The fate of elbows with unexpected positive intraoperative cultures during revision elbow arthroplasty. J. Bone Joint. Surg. Am. 2013, 95, 109–116. [Google Scholar] [CrossRef]
  39. Barrack, R.; Aggarwal, A.; Burnett, R.; Clohisy, C.J.; Ghanem, E.; Sharkey, P.; Parvizi, J. The fate of the unexpected positive International Orthopaedics (SICOT) intraoperative cultures after revision total knee arthroplasty. J. Arthroplast. 2007, 22, 94–99. [Google Scholar] [CrossRef] [Green Version]
  40. Morgenstern, C.; Cabric, S.; Perka, C.; Trampuz, A.; Renz, N. Synovial fluid multiplex PCR is superior to culture for detection of low-virulent pathogens causing periprosthetic joint infections. Diagn. Microbiol. Inf. Dis. 2018, 90, 115–119. [Google Scholar] [CrossRef]
  41. Suda, A.; Tinelli, M.; Beisemann, N.; Weil, Y.; Khoury, A.; Bischel, O.E. Diagnosis of periprosthetic joint infection using alpha-defenin test of multiple-PCR: Ideal diagnostic test still not found. Int. Orthop. 2017, 41, 1307–1313. [Google Scholar] [CrossRef]
  42. Calvet, E.; Prat, H. Recent Progress in Microcalorimetry; Macmillan Peergamon Press: Oxford, UK, 1963; pp. 12–45. ISBN 9781483280134. [Google Scholar]
  43. Muntean, A.A.; Zaharia, D.C.; Balint, O.; Steriade, A.T.; Popa Mihnea, G.I.; Tofolean, I. Microcalorimetry for bacterial strain discrimination—A first step in developing a novel technique for the diagnosis of severe infections. Eur. Respr. J. 2013, 42 (Suppl. 57), P2768. [Google Scholar]
  44. Popa, M.I.; Cursaru, A.; Popa, V.; Muntean, A.; Bogdan, S.; Cretu, B.; Iordache, S.; Cirstoiu, C. Study of bacterial proliferation using a method that shows bacterial growth depending on the heat released–microcalorimetry. Proc. Rom. Acad. Ser. B 2021, 23, 197–203. [Google Scholar]
  45. Popa, M.; Ene, R.; Streinu, C.; Popa, V.; Pleniceanu, M.; Nica, M.; Panti, Z.; Cirstoiu, M.; Cîrstoiu, M.; Cîrstoiu, C. Algic syndrome in osteoarticular infectious pathology; detection and rapid treatment of the causative agent using microcalorimetry. In Proceedings of the 14th National Congress of Urogynecology and the National Conference of the Romanian Association for the Study of Pain, Eforie, Romania, 17–19 September 2017; pp. 589–594, ISSN 978-88-95922-98-0. [Google Scholar]
  46. Alklint, C.; Wadsö, L.; Sjöholm, I. Accelerated storage and isothermal microcalorimetry as methods of predicting carrot juice shelf-life. J. Sci. Food Agric. 2005, 85, 281–285. [Google Scholar] [CrossRef]
  47. Popa, M.; Serban, B.; Popa, V.T.; Nedelcu, R.; Cursaru, A.; Cîrstoiu, C. Utility of microcalorimetru in describing the growth curve of Candida albicans at different temperatures–identitying the optimal growth temperature. Rom. J. Orthop. Surg. Traumatol. 2019, 2, 69–74. [Google Scholar]
  48. Di Luca, M.; Koliszak, A.; Karbysheva, S.; Chowdhary, A.; Meis, J.F.; Trampuz, A. Thermogenic characterization and antifungal susceptibility of Candida auris by microcalorimetry. J. Fungi 2019, 5, 103. [Google Scholar] [CrossRef] [PubMed] [Green Version]
  49. Corvec, S.; Wang, L.; Trampuz, A.; Seiler, E.; Moreno, M.G. Characterization of medical relevant anaerobic microorganisms by isothermal microcalorimetry. Anaerobe 2020, 66, 102282. [Google Scholar] [CrossRef] [PubMed]
  50. Zaharia, D.; Muntean, A.; Popa, M.G.; Steriade, A.; Balint, O.; Micut, R.; Iftene, C.; Tofolean, I.; Popa, V.T.; Baicus, C.; et al. Comparative analysis of Staphylococcus aureus and Escherichia coli microcalorimetric growth. BMC Microbiol. 2013, 13, 171. [Google Scholar] [CrossRef] [Green Version]
Figure 1. Aspects of the colonies obtained after inoculation on the blood agar medium.
Applsci 11 09740 g001
Figure 2. Aspects of the colonies obtained after seeding on the Sabouraud agar medium.
Applsci 11 09740 g002
Figure 3. Antibiogram of analyzed strains P1—S. epidermidis (first row of images), P2—S. aureus (second row of images), P3—S. aureus (the third row of images).
Applsci 11 09740 g003
Figure 4. Aspects of expression of virulence factors on culture media: top-left—medium with casein for highlighting caseinase; right-middle—medium with lecithin to highlight lecithinase; bottom-left—medium for highlighting lipases; right—medium with esculin for highlighting the ability of the tested strains to hydrolyze esculin.
Applsci 11 09740 g004
Figure 5. Graphical representation of the growth curve generated by the heat released by the active metabolism of S. Aureus—P2. Experiments performed at 37 °C and with a microcalorimetric cell load of 600 µL.
Applsci 11 09740 g005
Figure 6. Graphical representation of the growth curve generated by the heat released by the active metabolism of S. Aureus—P3. Experiments performed at 37 °C and with a microcalorimetric cell load of 600 µL.
Applsci 11 09740 g006
Figure 7. Graphical representation of the growth curve generated by the heat released by the active metabolism of S. epidermidis—P1. Experiments performed at 37 °C and with a microcalorimetric cell load of 600 µL.
Applsci 11 09740 g007
Figure 8. Graphical representation of the growth curves of the microorganisms studied and presented in Figure 5, Figure 6 and Figure 7, grouped in the same graph—to facilitate the observation of differences in thermal “footprint”.
Applsci 11 09740 g008
Table 1. Sensitivity pattern of the analyzed strains.
BacteriaPFOXCPTCIPSTXRIFCNAZMEDATELZD
S. epidermidisRRRSSSSRRSRS
S. aureusRSRSSSSSSSSS
Publisher’s Note: MDPI stays neutral with regard to jurisdictional claims in published maps and institutional affiliations.

