To demonstrate our approach, we used three smart city initiative documents that were generated by different administrative levels: at the international level we evaluated the United Smart Cities (USC) from United Nation [
44] which was created to address areas such as urban mobility, sustainable housing, clean energy, and waste management. At the national level we evaluated the United States Smart City fact sheet [
45] which was created to address issues such as changing climate and improving city services. At the regional level we evaluated the Philadelphia Smart City Road Map [
46] which was created to address issues related to city service delivery.
4.1. Experimental Setup
Using the procedure above, we extracted triplets from each of the three documents. The statistics related to this procedure are shown in
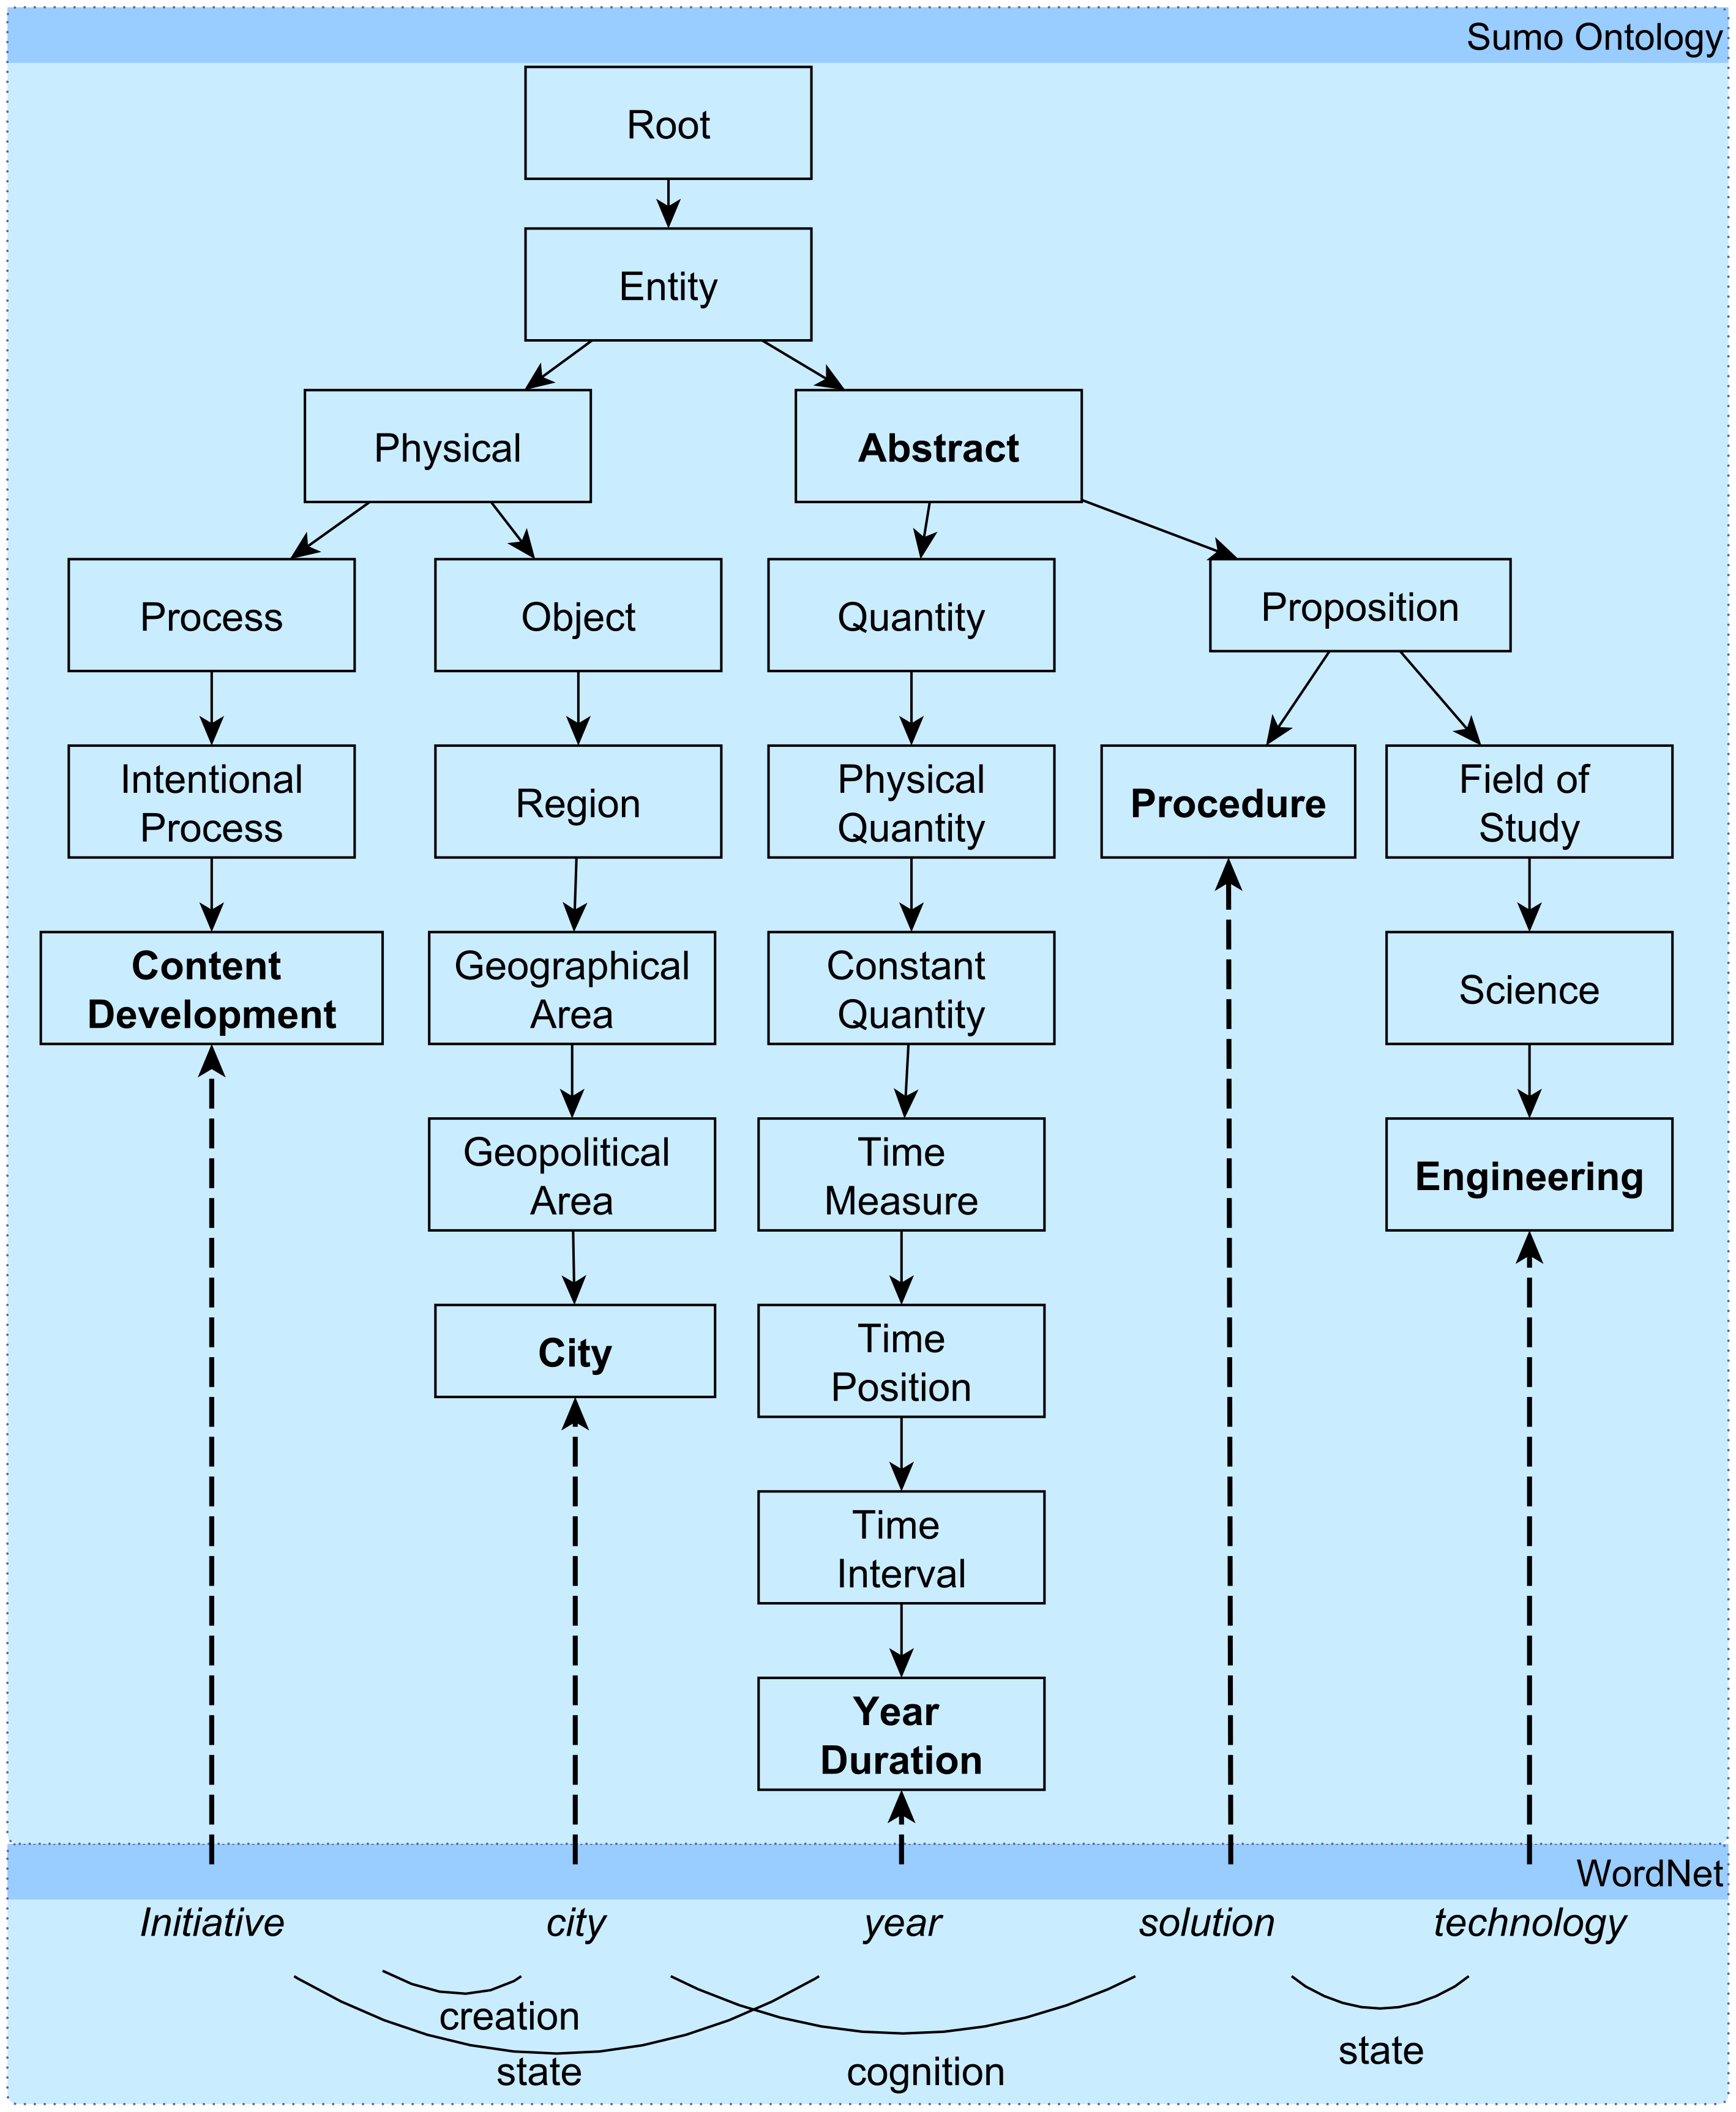
Table 4. For example, from the original United Nations, United States, and Philadelphia documents we extracted a number of 183, 425, and 496 unique subjects and objects. These words are connected by 30, 820, and 893 actions to form the triplets. When we further processed the generated triplets, the number of unique concepts typically declined due to abstraction. An exception to this trend was when we matched words into the SUMO ontology. This is because a single word can be mapped into multiple SUMO concepts. For example, in the triplet
organization reduce cost, the subject
organization is mapped into two SUMO concepts:
Organization and
Managing with different degrees of confidence. At the same time, the object
cost is also mapped into two SUMO concepts:
Process and
Attribute, also with different degrees of confidence. As a result of this step in our process, we added two concepts and three relationships.
Also, data in
Table 4 shows the process of abstraction of textual information in the three documents. For example, in the original text, words in the United Smart Cities text from United Nation were only 16.6% of the total number of words in the three documents and only 2.7% of these words were found in the other two documents. As we processed these documents, the percentage of concept overlap over documents increased to 37% after mapping words into the SUMO ontology, 49.5% after abstracting the SUMO concepts to level 5, and 55.2% after mapping the SUMO concepts into the SUMO subject files. The number of relationships/triplets also decreased but at a lower rate since relationships are not mapped in the SUMO ontology but rather into the WordNet lexical classes. This reduction in semantic graph elements will enable us to assess the differences and similarities between the three documents.
4.2. Results
With a complete set of triplets which resulted from the process above, we evaluated the level of correlation among the three documents. The results are shown in
Table 5. The correlation of concepts in the semantic map is shown in bold fonts above the main diagonal while the correlation for the relationships among concepts is shown below the main diagonal in italic fonts. These results show that the concepts are more correlated than the relationships. For example, the correlation of concepts between the US Smart City fact sheet and Philadelphia Smart City Road Map documents is very high at 0.67 which is expected since Philadelphia is a city in the US. At the same time, the correlation between how these concepts are related stands at 0.42 which hints to the fact that there may be differences in implementation of the topic of study. Although the concepts used in the USC from UN and Philadelphia Smart City Road Map document seem to have a good correlation, the way they are related is the lowest in our analysis and we attribute this fact to the difference in reach of those two organizations.
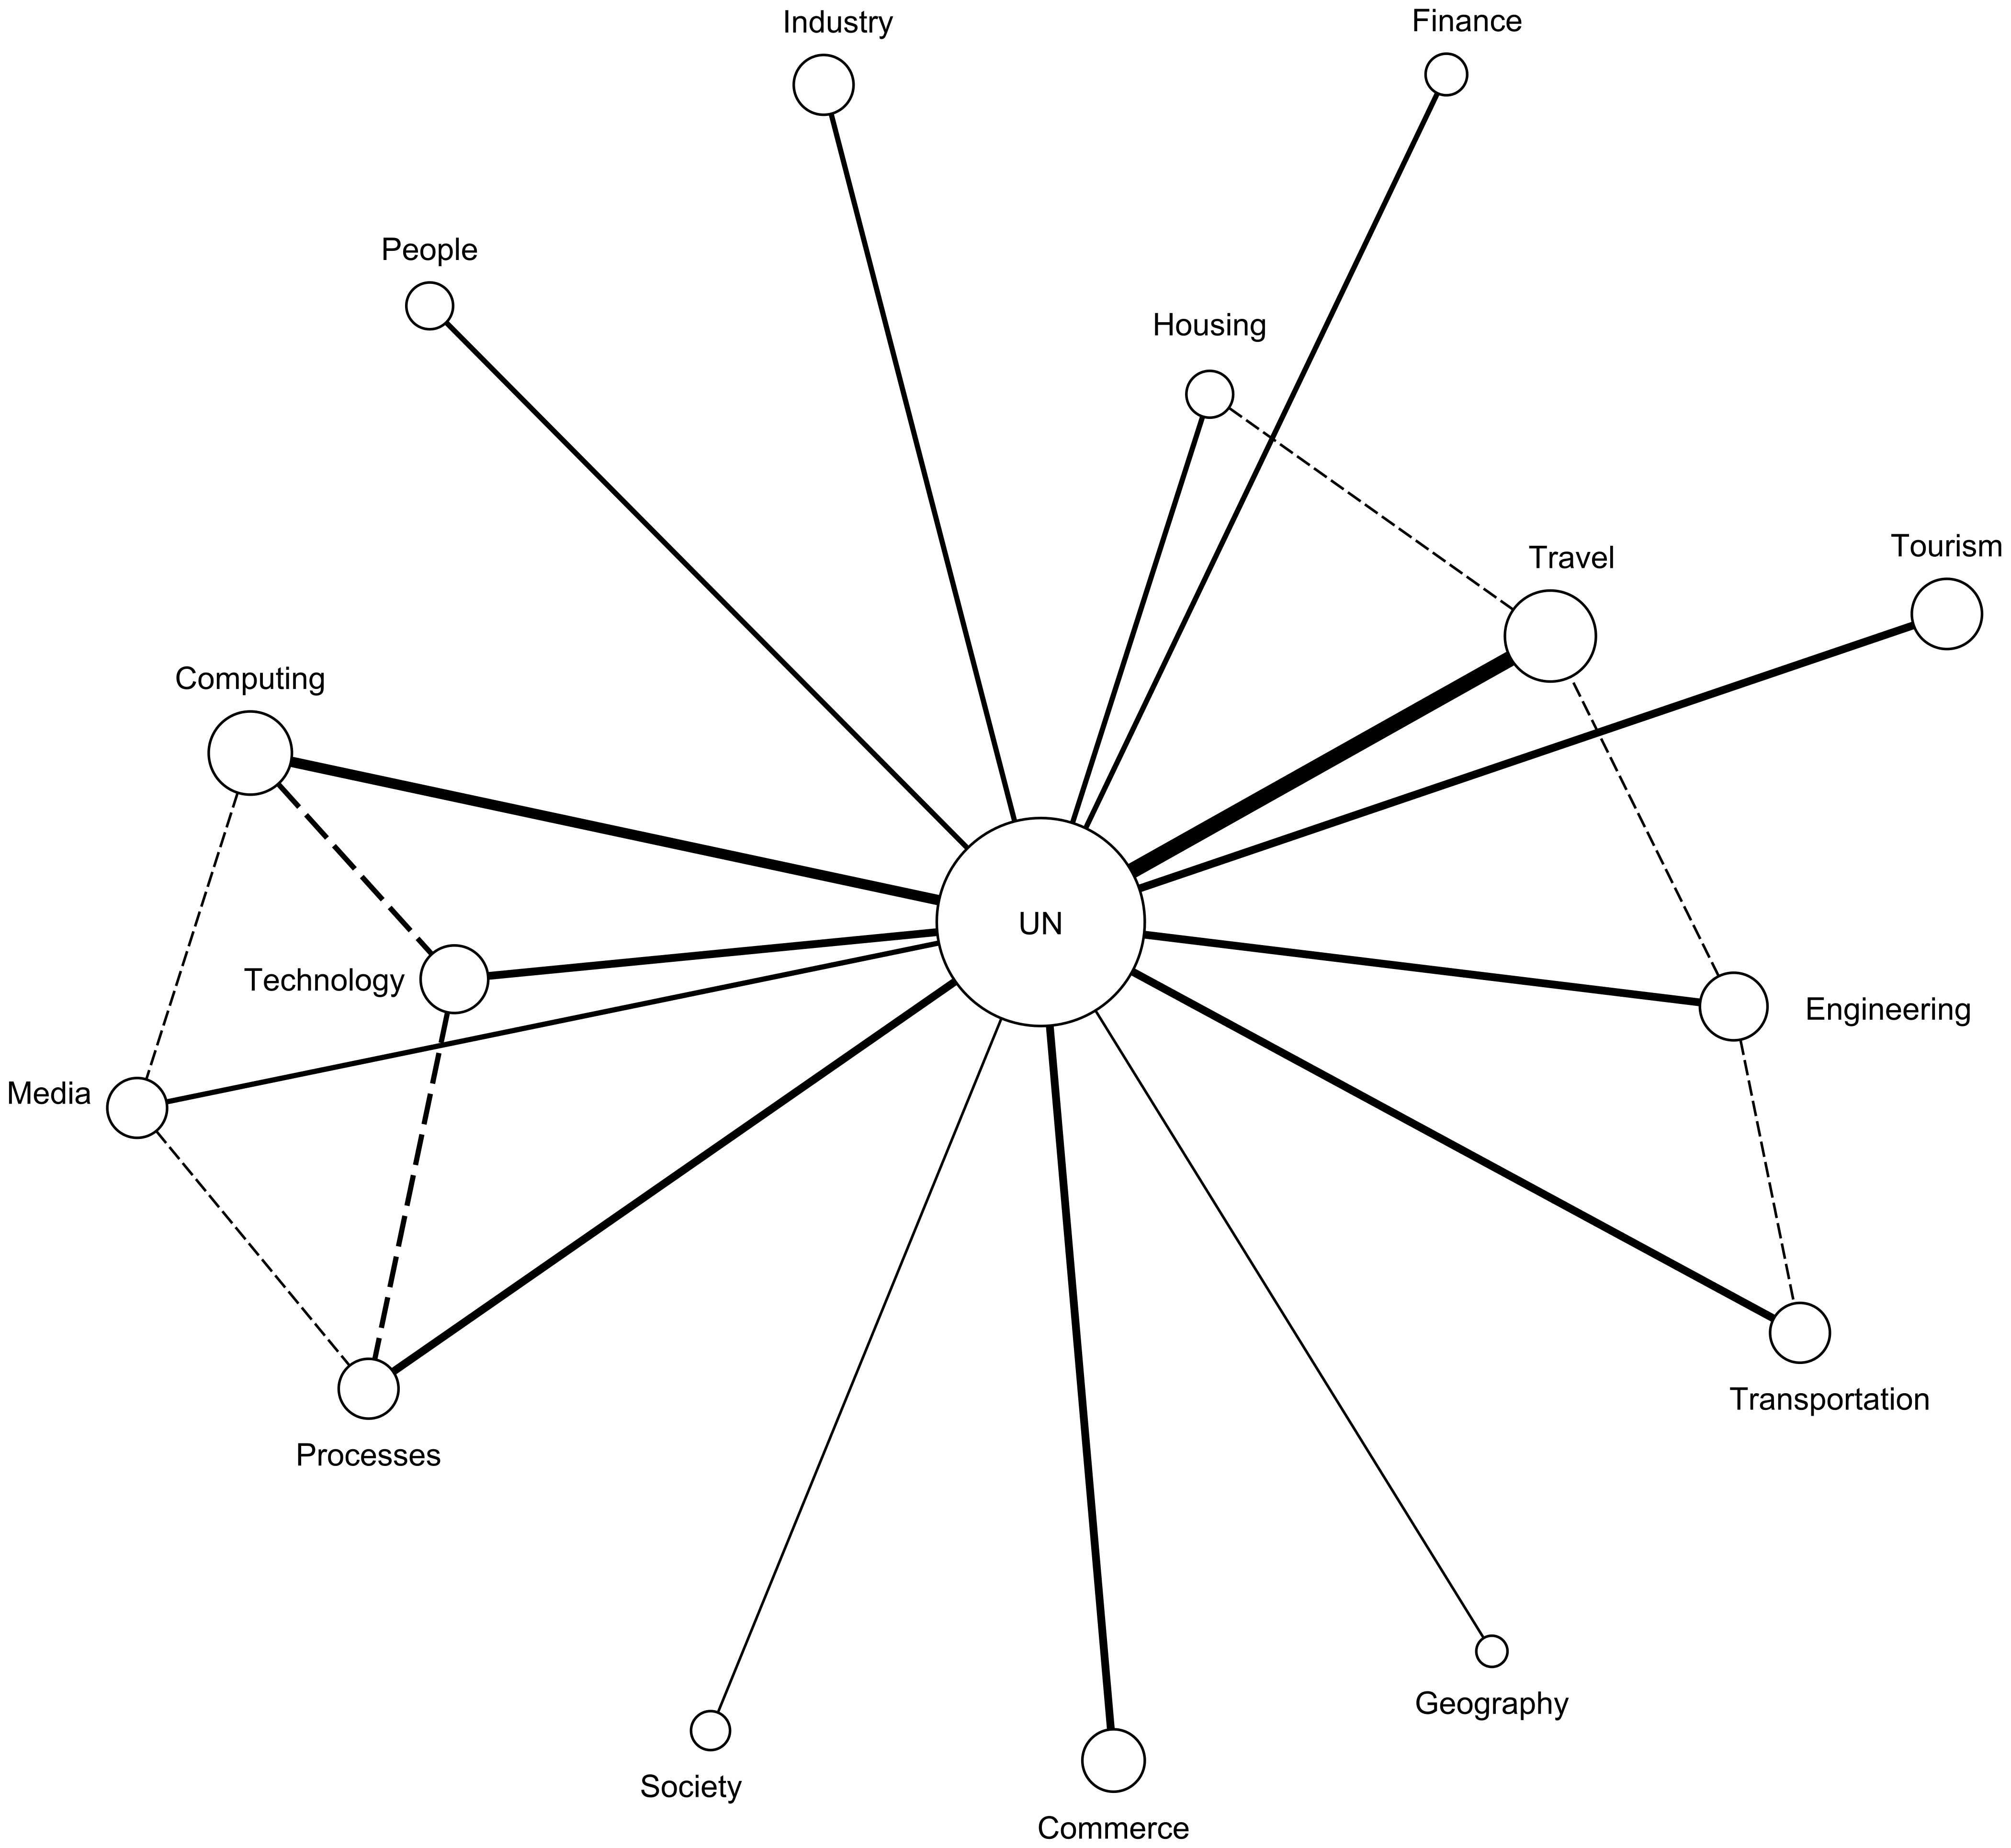
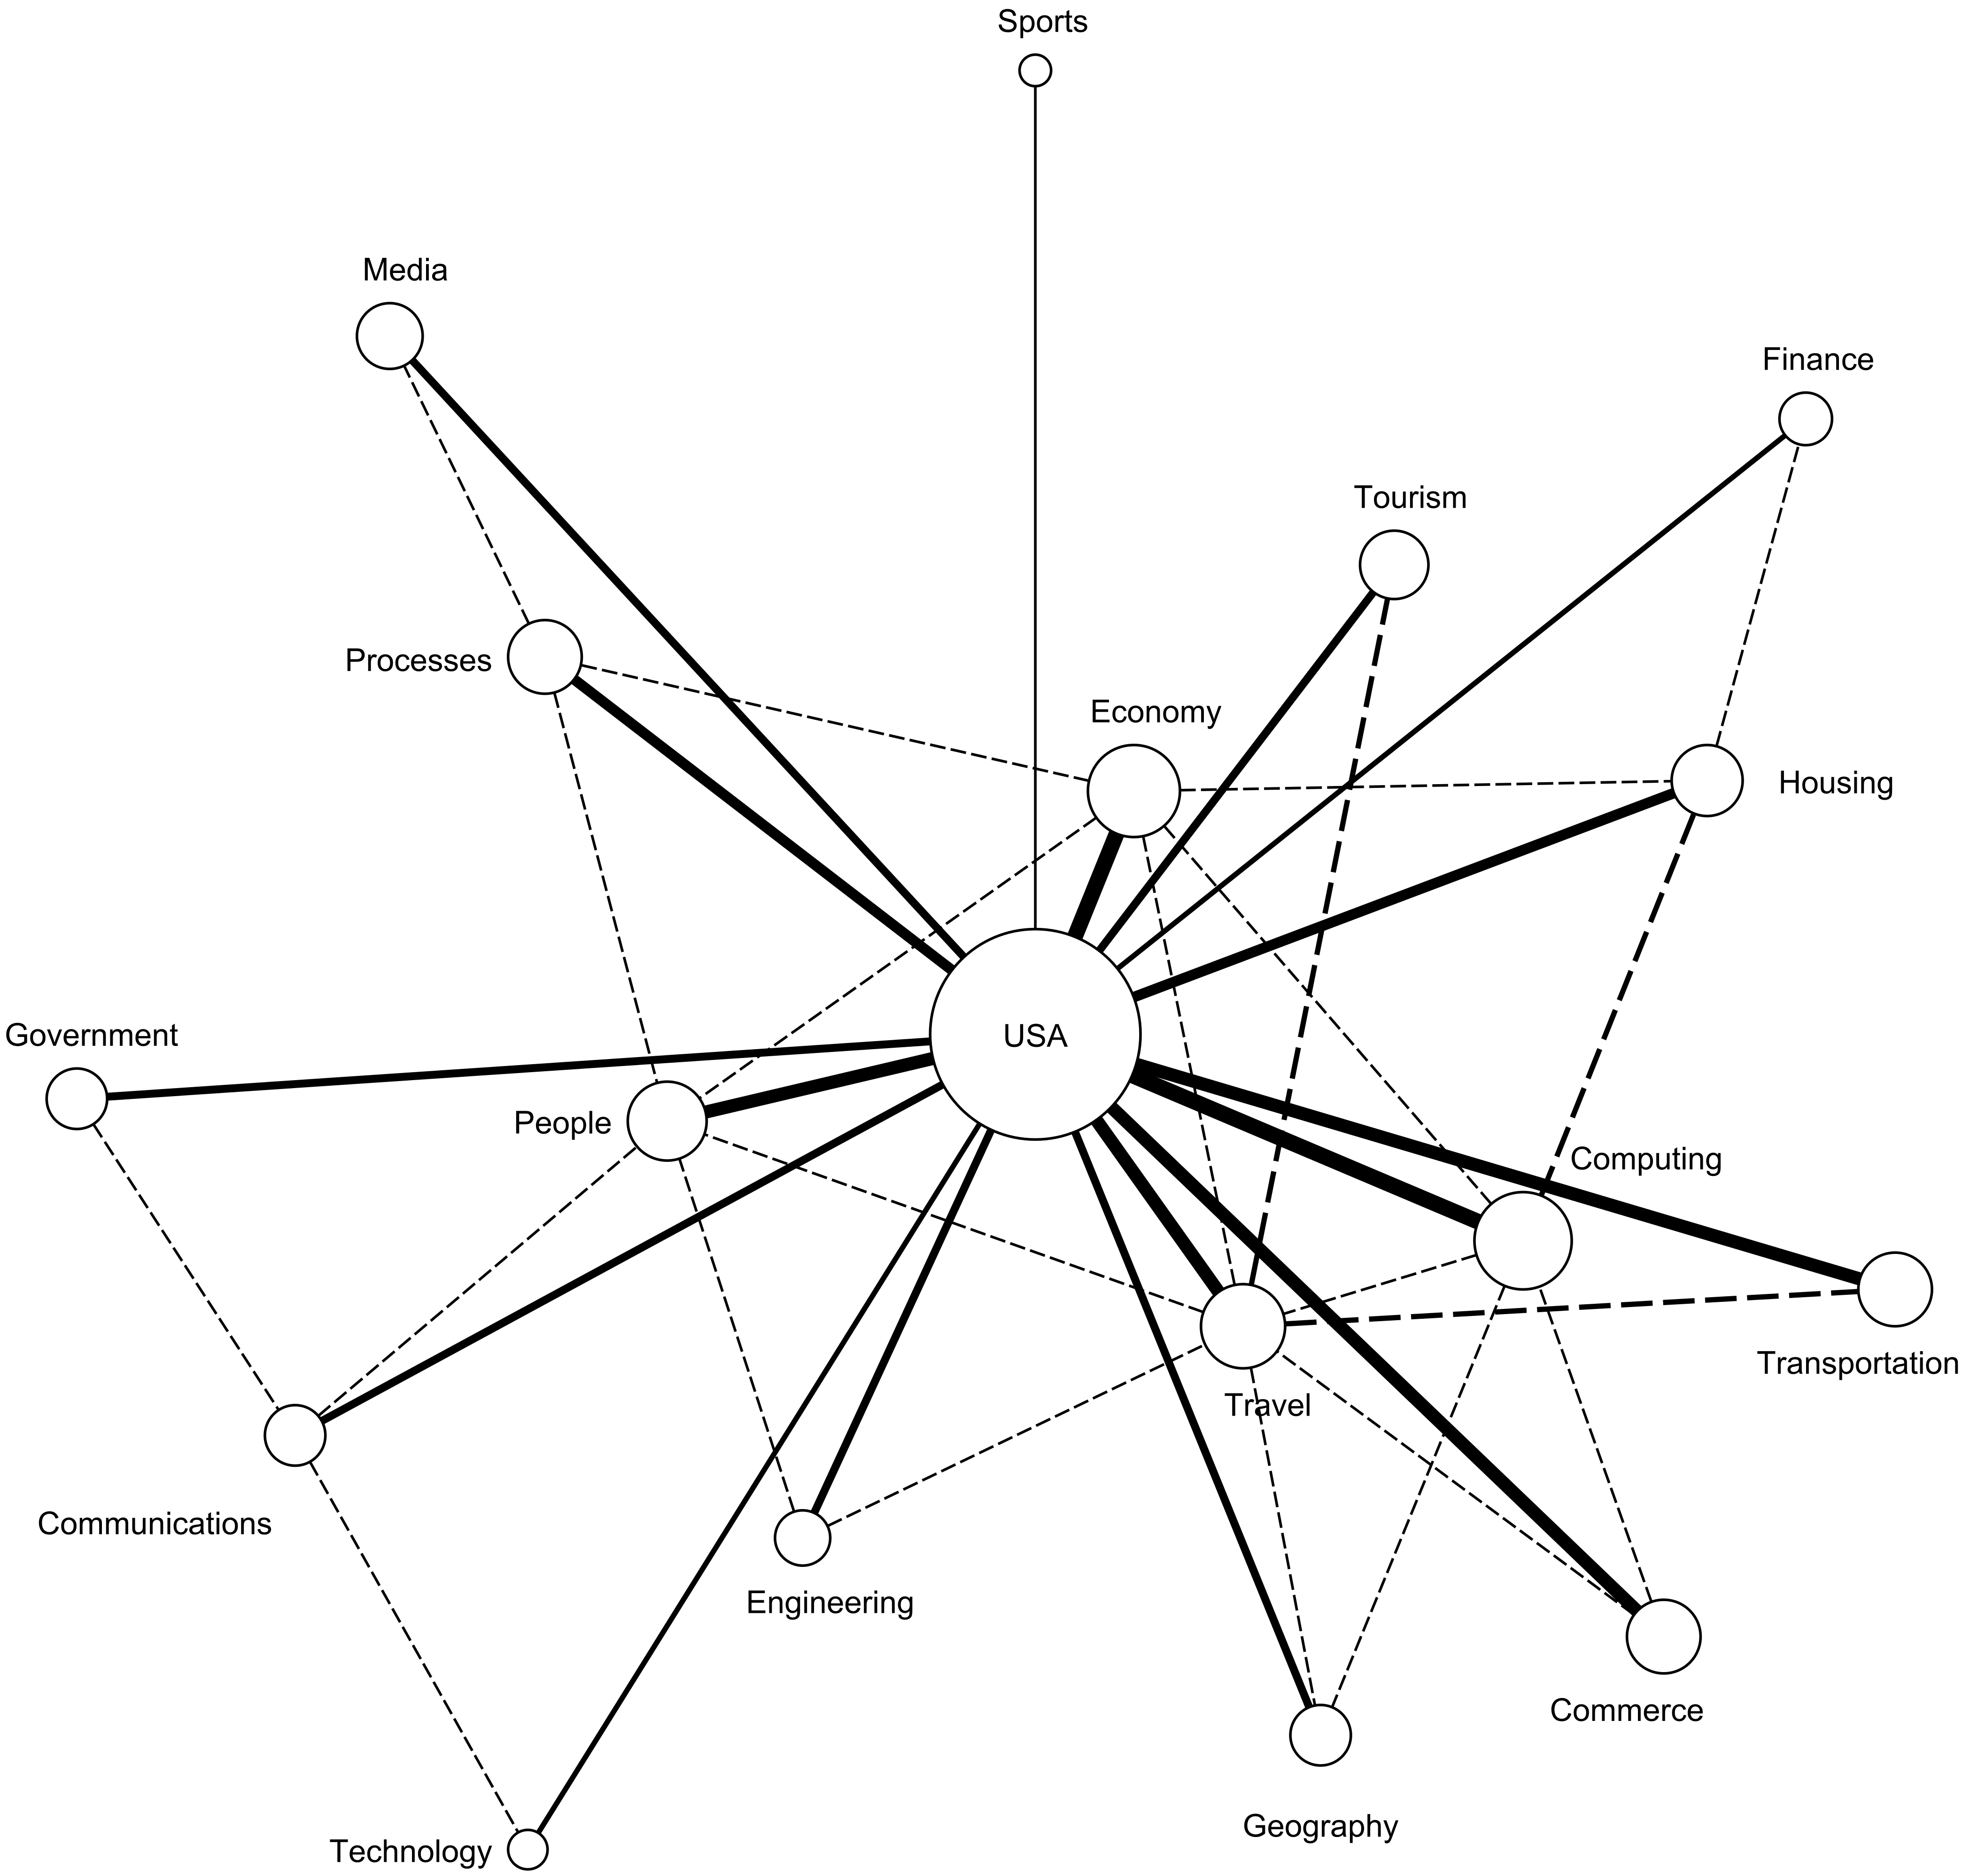
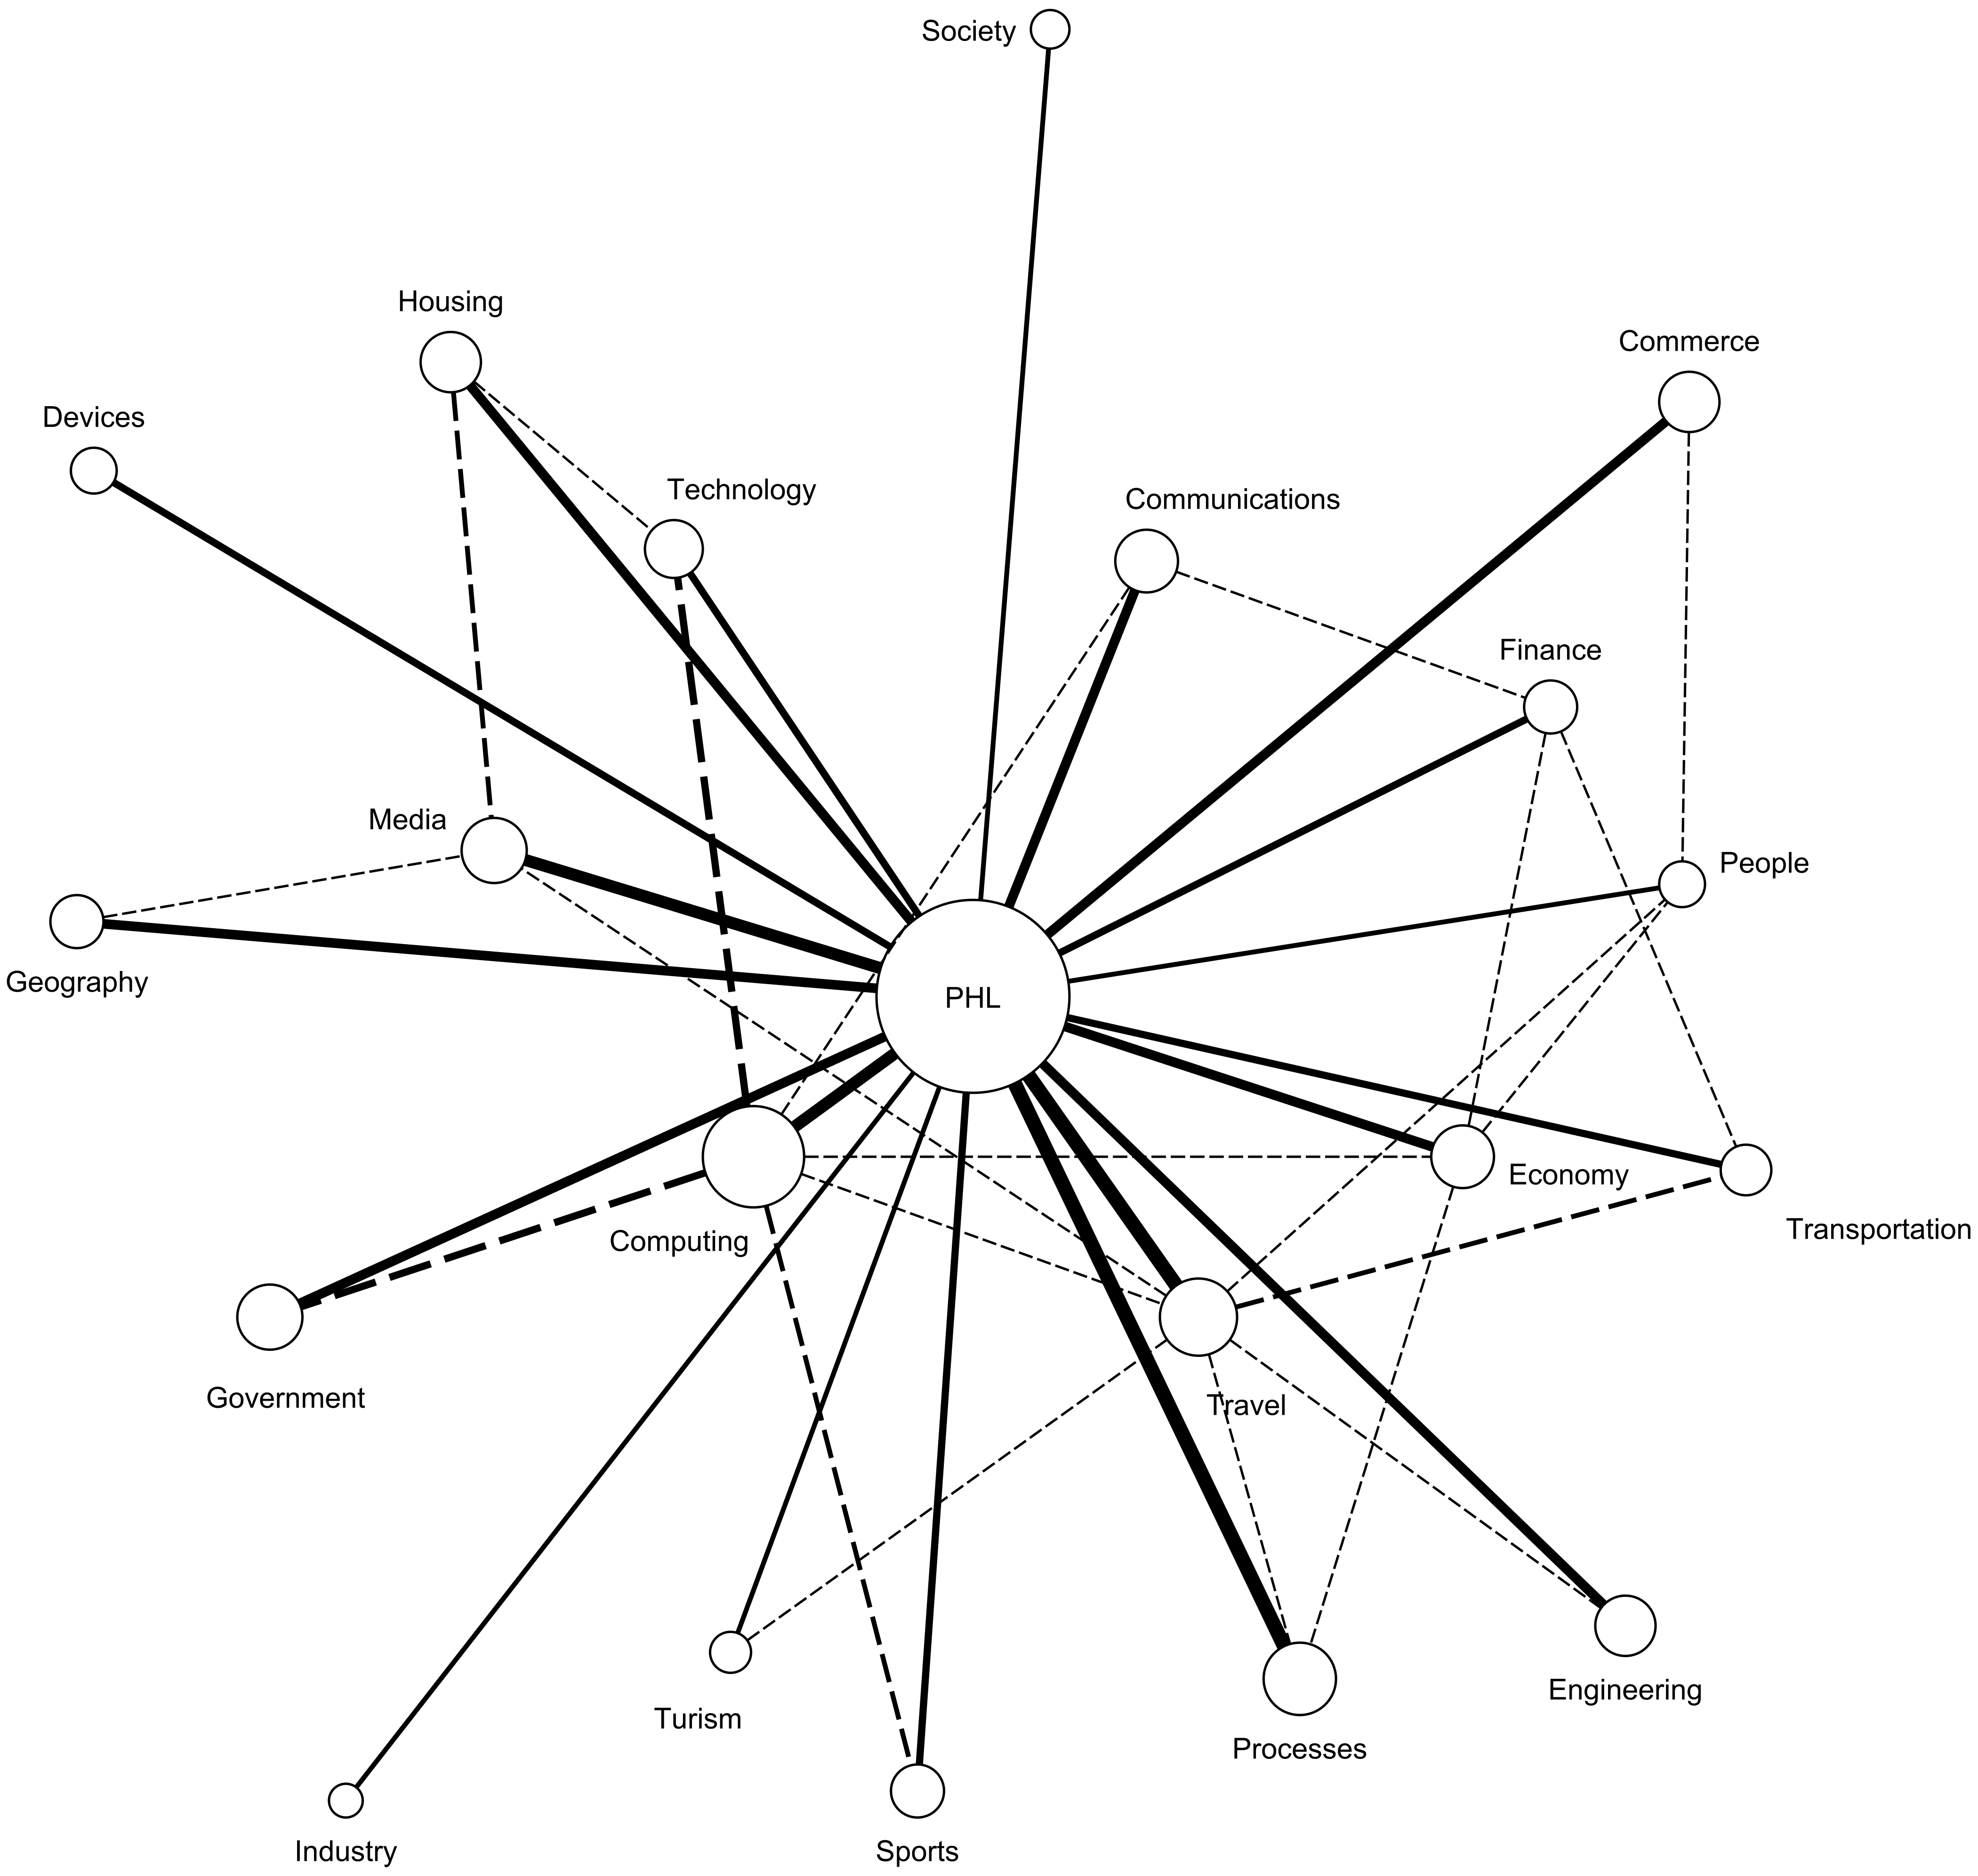
Further, we generated a conceptual map for each of the three documents. The generated maps varied in size and detail level. For example, the map for the USC from UN document contains 167 SUMO concepts and 967 relations among them, as shown in
Table 4. At the same time, the US Smart City fact sheet and Philadelphia Smart City Roadmap semantic maps are much larger, at the same level, with 297 and 327 concepts respectively. Even reducing these maps at the Level 5 in the SUMO ontology will result in rather large semantic maps which are difficult to present here. For that reason, we show the semantic networks at the SUMO subject file level for each document.
The generated networks are shown in
Figure 5,
Figure 6 and
Figure 7. We also applied the PathFinder networks algorithm [
43] to simplify these networks. The PathFinder networks algorithm simplify the semantic network by removing the most irrelevant relationships and maintaining an acyclical graph. In these figures, the relevant connections are represented in solid line having the width proportional with its relevance while the reduced/irrelevant relationships are shown in dotted line. For example, in
Figure 5 we notice that there is a relevant connection between
Housing and
Travel but this would be reduced when we applied the PathFinder Networks algorithm because each of those concepts have stronger relationships to the central node.
On these figures we can also observe a different approach to categories that relate to processes, geography, and society. The importance of these categories increases with an increase in the locality of the policy. At the most global level, the UN policy only talks about these issues in general terms without too much emphasis. We attribute this to the fact that these issues need to be addressed at a local level. The USA policy emphasizes more on these categories by stressing the role of related categories such as Government and Engineering. At the most local level, the Philadelphia policy has the strongest focus on these policies and adds information on specific topics that are used in the implementation of these policies such as technology, media and transportation. It is also important to mention that, as it will be shown later in this section, the subtopics addressed at each level vary with the locality degree. For example, climate change, which is typically included in these categories, is addressed differently by the three policies.
We also observe that the number of smart city concept areas vary from one document to the other with fewer concept areas addressed by higher level entities that cover more geographical area. The Philadelphia Smart City Roadmap document covers a total of 20 concept areas of the smart city with the most relevant ones being Computing, Travel, and Processes, in the order of their relevance. The US Smart City fact sheet document does not address concept areas such as Industry, Devices, or Society. We attribute this fact to the decentralized nature of the US administration, according to which these issues are decided at the local level. For the US Smart City fact sheet document, the most relevant areas are Computing, Economy, and Travel, in the order of their relevance. Lastly, the USC from UN document does not address concept areas such as Industry, Devices, Society, Engineering, or Communications. We attribute this to scope of UN which needs to address policies across many countries regardless of their technical implementations.
We further analyzed the strength of the relationships between concepts. For example, the USC from UN document elaborates the most on the current state of Travel and emphasizes on communication in this area. The social and social aspects of Travel are also addressed but to a much lesser degree. The US Smart City fact sheet document elaborates on the current state of the Economy and emphasizes on change and change in this area. The consumption aspect is also addressed but to a much lesser degree. Finally, the Philadelphia Smart City Roadmap document elaborates on the current state of the Computing and emphasizes on posession, perception, and change in this area. Several other aspects of this relationship are also addressed but to a much lesser degree.
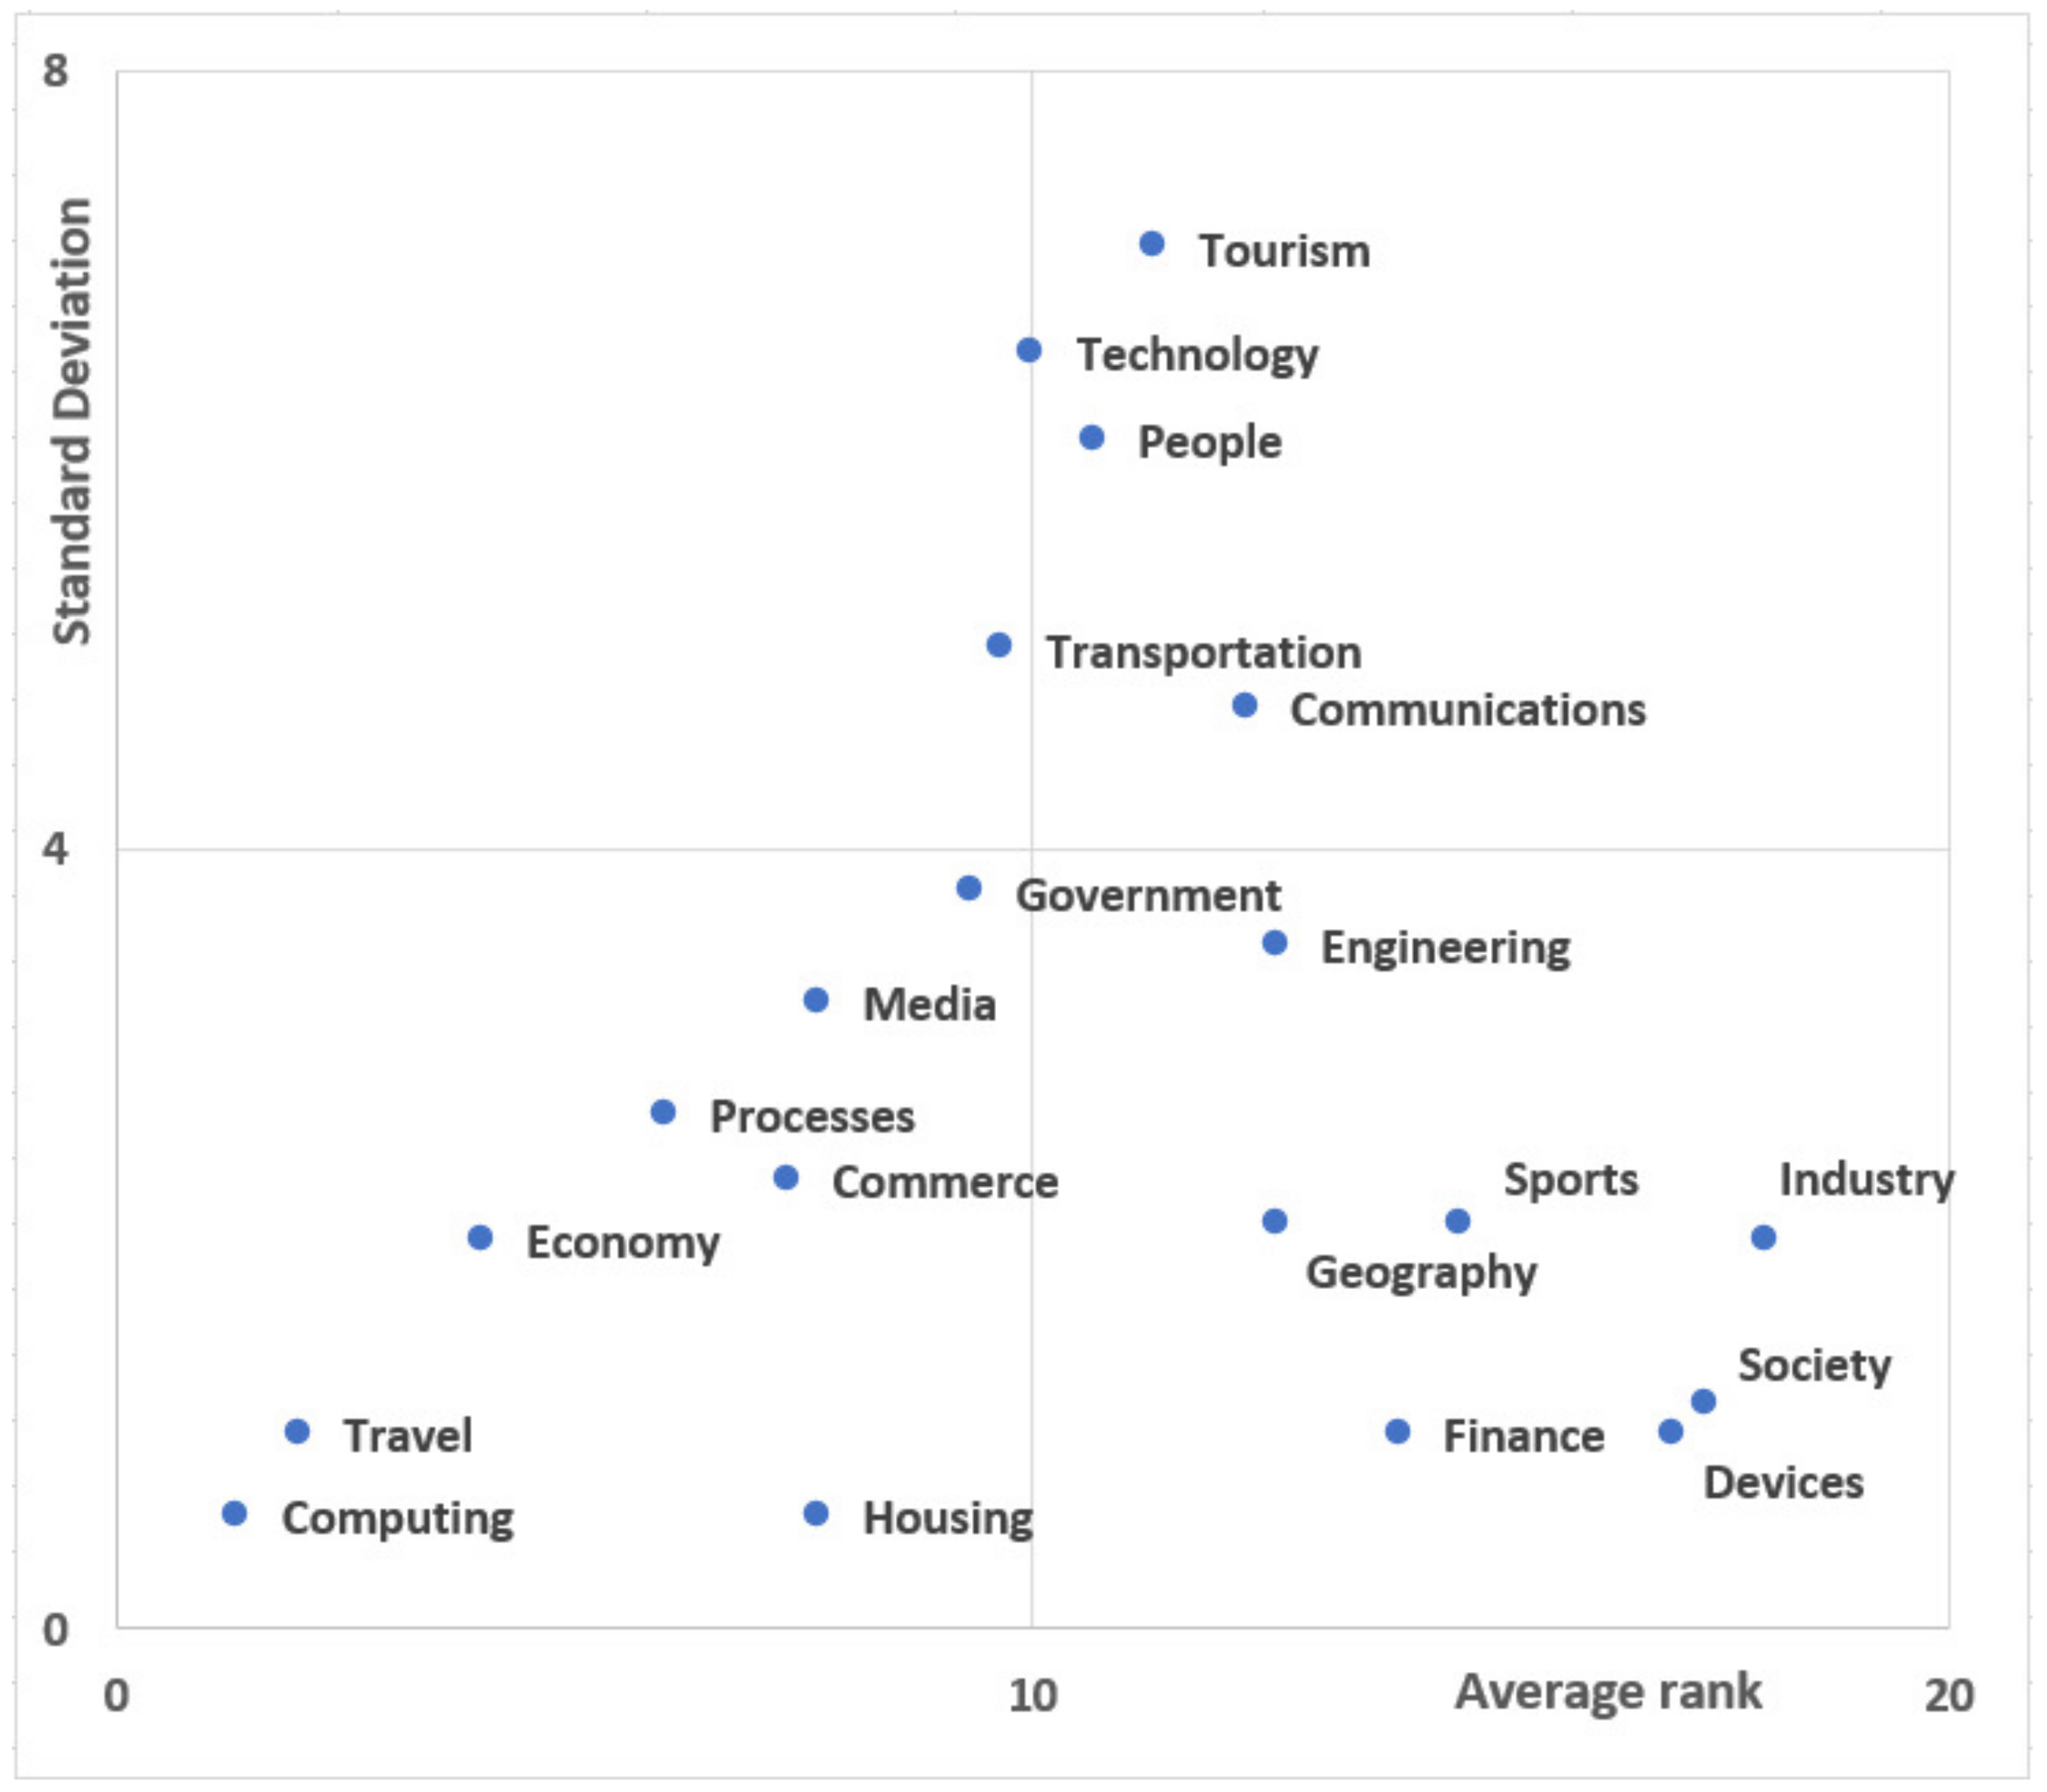
Finally we compared how the three documents address each smart city area comparatively. The results are shown in
Figure 8. In this figure, the lower left quadrant shows the high ranked low variation smart city areas. The right bottom quadrant shows areas that are consistently ranked low according to their relevance while the two top quadrants show areas that are ranked differently across the documents. As seen from this quadrant,
Computing and
Travel are consistently ranked high in all three documents. The
Society area is consistently ranked low in all three documents. On the other side of the spectrum, the
Tourism shows the highest variation in relevance, with the highest relevance in the USC from UN document and the lowest relevance in the Philadelphia Smart City Roadmap document.
4.3. Analysis and Discussion
To evaluate the effectiveness of our methodology, we analyzed each of the documents and manually extracted a list of smart city topics in those documents. A complete list of these goals is shown in
Table 6. For example, “climate change” is explicitly mentioned in the USC from United Nations and US Smart City fact sheet documents but not in the Philadelphia Smart City Roadmap document which mentions “climate resiliency” only. For each of the documents we ranked each topic by computing the similarity of each subject and object in the generated triplets to the description of the topic.
As seen in
Table 6 the topic
City Services is ranked consistently high as a topic for all the documents, while the
Urban Migration is correctly ranked high for the USC from UN document and low for the other two documents. However,
Public Safety is ranked consistently low although it should be ranked higher for the US Smart City fact sheet document. Overall, the average mean precision was 94% for the USC from UN document, 78% for the US Smart City fact sheet document and 91% for the Philadelphia Smart City Roadmap document. Also, the recall rate at the identified number of topic rate is 71% for the USC from UN document, 83% for the US Smart City fact sheet document, and 75% for the Philadelphia Smart City Roadmap document. For example, the UN document identifies seven relevant smart city areas. If we retrieved the top seven topic as ranked by our algorithm, we would recall 71% of the relevant topics. These results reveal that our methodology is promising in terms of automatically retrieving relevant smart city areas for the US and Philadelphia documents. Further refinement of the methodology is necessary to retrieve smart city areas more effectively for the UN smart city initiative document.
To summarize, our formalized semantic networks of UN, US, and Philadelphia smart city initiative documents provide a common framework which decision makers and policy analysts can utilize to analyze initiatives generated at different administrative levels. Since ambiguity and variations among text is reduced by analyzing semantic networks at the same abstraction or granularity level, comparative analysis can be constructed to understand how the initiatives align or differ from others. Our analysis revealed several smart city areas that are shared among all three initiatives including
Computing and
Travel. These smart city areas emerge as common concepts valued across international, national, and city level systems. Using the semantic networks in
Figure 5,
Figure 6 and
Figure 7, we also observe variations among initiatives that capture localized or system level smart city areas. For example, smart city area
Economy is important for US Smart City initiative, but this area does not explicitly show up in the Philadelphia smart city semantic network. If decision makers want to scale the Philadelphia smart city initiative to other US cities or across the USA, then they need to address
Economy area explicitly. A similar comparison can be done for high level administrators. Philadelphia smart city initiative emphasizes smart city areas that are important at local level such as
Housing,
Industry,
Devices, and
Society. If US government level decision makers could understand the contextual areas that are important for local administrations, then they can design incentives to promote these areas which ultimately would support
Economy area that is a priority at the country level. The analysis also provides means to evaluate how US initiatives differ from international initiatives such as the USC from UN initiative. Since UN initiative spans across countries, several smart city areas such as
Government and
Economy do not show up in the semantic network as these concepts reflect country level areas. In addition to comparison of formalized semantic networks, decision makers can utilize
Figure 8 to quantitatively evaluate the relevance variation among smart city initiative documents to understand the strengths or weaknesses of the documents. For example,
Tourism is a smart city concept that is shared among all three initiatives, but it has high relevance for UN initiative rather than US or Philadelphia initiatives. Analysts could use this information to check if there is a conceptual gap in their initiative and if further analysis is necessary to address this smart city area and align their initiative with higher level administrative initiatives.


