Article

Monitoring the Capillary Jet Breakage by Vibration Using a Fast-Video Camera

by
Marcella Chalella Mazzocato
1,2,*,
Sylvie Chevallier
1,
Carmen S. Fávaro-Trindade
2 and
Denis Poncelet
1,*
1
École Nationale Vétérinaire, Agroalimentaire et de L’Alimentation de Nantes-Atlantique (ONIRIS), Rue de la Géraudière, 44322 Nantes, France
2
Faculdade de Zootecnia Engenharia de Alimentos (FZEA), Universidade de São Paulo (USP), R. Duque de Caxias, 225-Jardim Elite, Pirassununga 13635-900, Brazil
*
Authors to whom correspondence should be addressed.
Appl. Sci. 2021, 11(21), 10222; https://doi.org/10.3390/app112110222
Submission received: 14 August 2021 / Revised: 13 October 2021 / Accepted: 22 October 2021 / Published: 1 November 2021
(This article belongs to the Section Biomedical Engineering)

Abstract

:
The production of beads by simple extrusion dropwise of an alginate solution in a calcium bath is a simple method. It may be done at room temperature without any toxic compound. However, simple extrusion drop by drop from a needle may result in large capsules and a low flow rate. The solution must be extruded as a jet to get a smaller size and higher flow rate, which breaks into droplets either by vibration or a cutting tool. The present contribution reports jet breakage observations into droplets under vibration by extruding an alginate solution varying some parameters during the study. The droplet formation was observed using a high-speed camera, and images were analyzed. The size, length before breakage, and droplet velocity were obtained by examining 50 droplets, and experiments were repeated three times. The high-speed camera allowed us to observe more precisely the capillary jet breakage. The study showed the importance of selecting a well-designed vibrating system, presented data while varying nozzle size, frequency, and flow rate to get optimum breakage keeping across all the same alginate solution. Further experiments would be interesting, modify the extruded solution concentration and composition, and find a precise criterion to identify optimum conditions.

1. Introduction

In 1977, Kierstan and Bucke [1] published alginate beads production using a simple extrusion dropwise of an alginate solution in a calcium bath. The migration of the calcium inside the alginate droplet provokes the gelification of the alginate. The method is simple, done at room temperature without any toxic compound. Therefore, it is not surprising that it has become the most usual cell encapsulation method, with more than 11,000 publications (Science Direct). Zhu [2], for instance, had prepared calcium alginate gel beads through a system under forced high-voltage electrostatic for the encapsulation and immobilization of microorganisms, enzymes, or cells. Bahry [3] also utilized alginate beads to immobilize Lactobacillus rhamnosus and explore another efficient way to valorize the residual carbohydrates of carob waste instead of work directly on pods, using Lactobacillus casei in the liquid phase. This method was demonstrated to be effective, mainly because it allows the reuse of microorganism due to easy separation of the biomass from the liquid phase.
Alginate has exceptional gelation properties. It allows the development of several alternatives to the simple alginate beads through different compositions, such as the mixture of alginate (20 g/L) with starch up to 300 g/L [4], or shellac up to 100 g/L [5]. Alginate also provides mechanical or gastric resistance. Besides presenting versatility in encapsulation, like core-shell capsules by inverse gelation, the extrusion of calcium suspension in alginate bath [6], or co-extrusion of core solution inside an alginate shell solution [5].
Initially, these methods were developed based on a simple extrusion drop by drop from a needle. It results in large capsules (2–3 mm) and a low flow rate (100 mL/h). Then, to reduce the size, different technologies were studied, such as electro-dripping, which is extrusion by applying an electrostatic potential between the needle and the gelation bath [7]. To get a smaller size and higher flow rate, the solution must be extruded as a jet and the jet itself broken into droplets either by a vibration [8] or a cutting tool [9]. Equipment for the first option has been developed by several companies (Buchi, Switzerland; Nisco, Switzerland; Brace, Germany), readily available commercially.
The jet breakage by applying a vibration was proposed by Savart in 1833 [10] and interpreted by Rayleigh in 1879 [11]. A liquid jet breaks in droplets with a mean diameter defined by the breakage frequency, mainly jet diameter, and linear speed. If all vibrations are eliminated, and the optimum frequency is applied, they would be monodispersed droplets. In fact, a size dispersion of 5% is generally observed.
Even though the obtention of alginate beads by simple extrusion is one of the most popular encapsulation techniques used, while often used to get small, monodispersed alginate beads, the nozzle resonance technology is not fully understood and not used optimally. Especially, operators assume that the size could be controlled by simply varying the frequency.
Many articles develop the Rayleigh’s theory, taking into account the rheology of the solution, its surface tension, and the formation of satellite droplets [12,13,14]. However, these models are difficult to apply for daily work. Alginate forms a shear-thinning solution but is not viscoelastic [8]. The solution generally has relatively low viscosity (<200 mPa·s). This contribution therefore wishes to verify that a simpler model developed for Newtonian solutions could be applied to hydrogel solutions like alginate solution.
Most data relating to the size and the operating conditions are based on the alginate beads and not directly the droplets. The present contribution reports direct observations of the alginate solution droplet formation with the assistance of fast recording cameras. It evaluates the impact of several parameters, such as frequency, type of membrane, nozzle size, and vibration amplitude on droplet size. Besides, the study compares and verifies those results with mathematical theories to better understand process optimizing and the importance of selecting a well-designed vibrating system.

2. Materials and Methods

2.1. Alginate Solution

The alginate powder Algol 3001 was kindly provided by Cargill (Puteaux, France). One liter of distilled water was introduced in a beaker (1.5 L, diameter 12 cm, Fischer Scientific, Illkirch, France) and agitated using a magnetic stirrer (MINI MR standard IKA, Fischer Scientific, Illkirch, France, equipped with 5 cm magnetic bar, and turning at 300 rpm). Eighteen grams of alginate were slowly added through a fine mesh strainer cooking sieve. The resulting suspension was maintained under agitation for one hour until alginate was dissolved entirely and hydrated. Then, the solution was let stand for one hour without agitation for deaeration. Finally, it was used directly or kept in the fridge at 4 °C.

2.2. Droplet Production

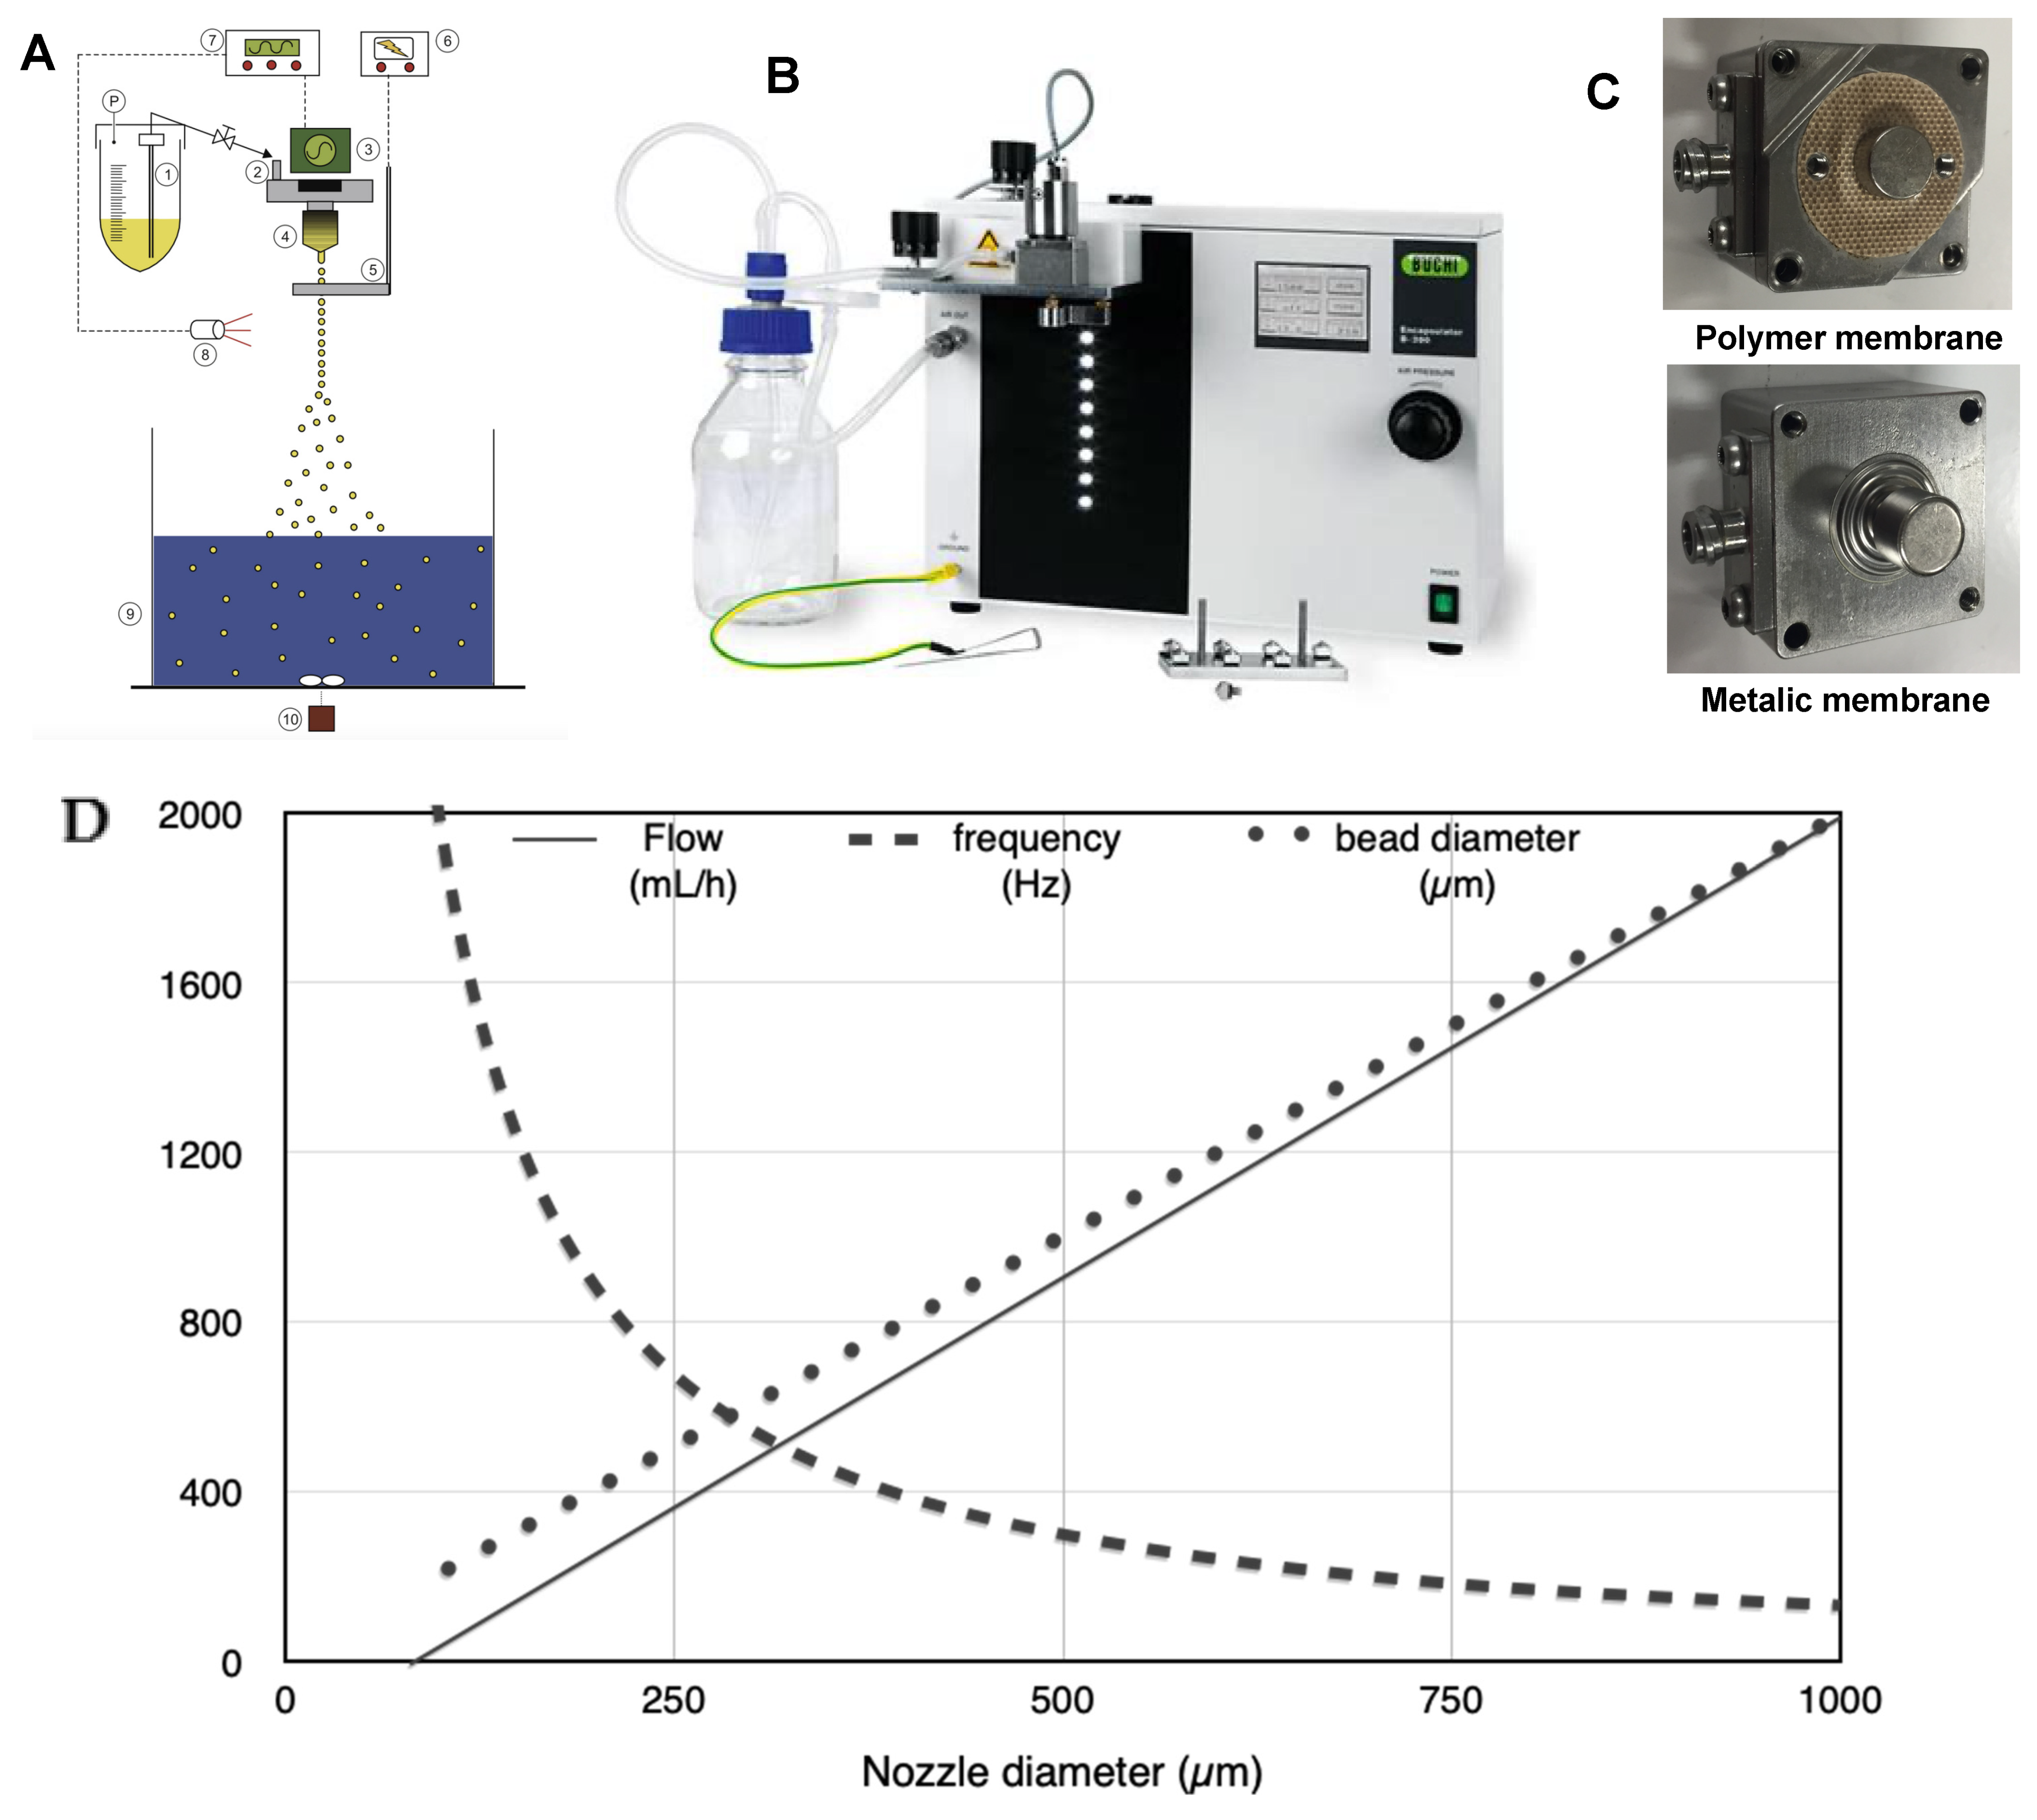
Figure 1A,B present the encapsulator B390 (Buchi, Flawil, Switzerland). The system comprises 1. Pressure bottle, 2. Dripping system, 3. Vibration system, 4. Nozzle, 5. Electrode, 6. Electric potential control, 7. Vibration controller, 8. LED/Stroboscope, 9. Gelation bath, 10. Magnetic stirrer. The dripping system is composed of a support to be connected to the nozzle and the feeding vessel (Figure 1C). It is closed on the top by a membrane on which a magnet is attached. A vibration system with a second magnet is placed on the dripping system, allowing vibration on the membrane and subsequently on the liquid. The control block allows adjusting the frequency and the amplitude of the vibration. The liquid flow rate is controlled by applying pressure on the feeding vessel and the tube’s opening connecting the vessel to the dripping device. The control block is equipped with LED flashing at the same frequency as the applied vibration on the capillary jet.
The feeding vessel was filled with the alginate solution. The frequency and amplitude were set following supplier recommendations corresponding to the selected nozzle. The liquid flow rate was then first adjusted following the same recommendations and adapted to get optimum breakage. The experiments were carried out with different nozzles sizes (450, 750, and 1000 µm), as well as with polymer and metallic membrane (Figure 1C).
The optimum breakage was determined by observing the droplet string in front of the LED. If optimum conditions are reached, the droplets must seem immobile, as if in each flash the droplets have the same position. However, if the optimum conditions are not reached, they seem to move up or down. As shown later, the optimum conditions constitute a range of flow rate/frequency couples. In practice, it represents an advantage but introduces a degree of incertitude while trying to fit the data with a model.
In the manual of the encapsulator B390 [15], some ranges of operating conditions are provided. Figure 1D presents the mean value of the frequency, the flow rate, and the resulting droplet size. These data were used as a starting point for the parameter set-up.

2.3. Droplet Formation Visualization

The droplet formation was observed using a high-speed camera (HighSpeedStar 6, Lavision, Paris, France), and images were recorded at 5000 to 7000 Hz. The images were analyzed using ImageJ software (National Institutes of Health, Bethesda, MD, USA). The camera was connected to PC Thinkpad X200, Lenovo running on windows XP. The video was recorded with the software Photron FASTCAM Viewer ver. 3.1.8 (Photron, Tokyo, Japan).
An example of capillary jet breakage recorded with the high-speed camera is displayed in Figure 2. The mean size and size dispersion were obtained by measuring 50 droplets and computing the mean value and the standard deviation. Experiments were repeated a minimum of three times to provide the final value. The length before breakage was defined as the distance between the nozzle before the first droplet had been formed. Droplet velocity was obtained by following one droplet over the image and dividing the droplet traveled distance by the time.

3. Theoretical Approach

Rayleigh [11] analyses the instability of the liquid jet and its tendency to break into droplets due to axial symmetric disturbances. He observed that the breakage occurs when the jet length is similar to the jet circumference. For Newtonian and low viscosity liquid, the optimum breakage wavelength, λ o p t , to obtain mono-dispersed droplets was given by:
λ o p t = π 2   d j
where dj is the jet diameter. The optimum frequency, ƒopt, is equal to:
ƒ o p t = λ o p t   u j
where u j is the linear velocity of the jet. According to Schneider and Hendricks [16], uniform droplets may be produced in a range of wavelengths defined by:
3.5   d j   < λ o p t < 7   d j  
This provides some freedom in selecting the conditions for droplet production. In 1931, Weber [17] extended the Rayleigh equation considering the impacts of the liquid physicochemical properties:
λ o p t = π 2   d j   1 + 3 η ρ σ d j
where η is the fluid viscosity, ρ is the liquid density, and σ   is the surface tension. Generally, the jet diameter, dj, is assumed equal to the internal nozzle diameter, dn [13]. However, at the exit of the nozzle, the jet is submitted to a pressure relaxation, leading to a jet expansion that could be expressed by [8]
d j d n = 4.33   W e 0.337
where Wen is the Weber number related to flow inside the nozzle:
W e n = ρ d n   u n 2 σ
The liquid flow rate, F, is the product of the jet section times the jet velocity:
F = π 4 d j 2 u j
The volume, ν , of the droplets may be predicted by:
ν = F ƒ o p t = π 6   d 3
and, combining Equations (1), (2), (7) and (8), the droplet diameter, d , is given by:
d = 2 3 d j 2 λ o p t 3 = 1.89 d j

4. Results and Discussion

4.1. Selection of the Optimum Vibration Frequency

Several authors declare that droplet size could be controlled by changing the frequency. However, this fact contradicts Equation (9), which states that the jet diameter directly defines the droplet size, generally assimilated to the internal nozzle diameters. Moreover, doubling the frequency would only increase the diameter by a factor of 1.26, and the frequency will not be at its optimum value.
Equation (4) shows that the liquid properties may affect the optimum wavelength (or frequency). Often, the liquid properties are not well known and could even vary during experiments if, for example, the liquid temperature increases. Therefore, the recommendations from the equipment suppliers (Figure 1D) may be considered as approximate values.
Fortunately, most equipment based on resonance technology is equipped with LED flashing at the same frequency that the vibration applied to the liquid. Figure 3 represents the droplet observations using the camera while varying the frequency around its optimum value. The series of images correspond to the time interval, simulating the LED flashes. If the breakage and the applied vibration (then the LED flashes or the image framing) are synchronized, the droplets will look stationary (stroboscopic effect). The jet tends to break at the natural frequency, even if the vibration is applied to the jet. If natural and applied breakage frequencies do not correspond, it is then a competition between the two breakage processes, leading to intermediate mean droplet size and larger size distribution. If so, the droplets will look like they are moving to the front of the flashing LED.
The optimum value for this experiment was approximately 500 Hz. It may be observed that if the frequency is too low, the droplets seem to move up. At the optimum frequency, they seem immobile (Figure 3b), while, at an overly high frequency, they seem to move down. In agreement with Equation (3), altering the optimum frequency (300 to 600 Hz) still allows obtaining relatively homogenous beads. However, if the frequency is too distant from the optimum, i.e., 700 Hz, the jet breakage is erratic, and coalescence between droplets is observed. Figure 3 shows that low size dispersion may be maintained while the optimum and applied vibration frequencies differ up to 20 %. The range of droplets having a narrow size distribution is ±20% in volume but ±6% in diameter. Moreover, filaments between droplets may break into smaller satellite droplets. It is then recommended to work near to the optimum frequency. Under these circumstances, the size is primarily defined by the nozzle size.
The previous observations allowed us to easily define the optimum frequency by varying the frequency at a fixed flow rate or varying the flow rate at a fixed frequency (depending on the equipment). However, the situation is not that simple. Images displayed in Figure 3 were obtained with an image recording duration of 0.2 ms, while LED flashes have slightly less than 1 ms.
The image displayed in Figure 3e simulates the direct observation of the jet without using a fast camera with a 0.7 ms recording duration. The image simulates the direct observation of the jet using the Encapsulator without the help of a fast camera. The image is blurred due to the fact that the droplets move during the flash length. While producing large beads and then using low frequency, the image remains relatively straightforward, but the optimum frequency determination requires some experience for the small bead production and then high frequency.

4.2. Selection of the Vibrated Membrane

The encapsulator B-390 was initially designed based on the encapsulator Inotech. Both systems transmit the vibration using a polymer membrane. However, the magnet glued on the membrane tended to detach. It was observed that the breakage was not stable over time, forcing the operator to reset the frequency to maintain the correct breakage. Buchi has modified the system by introducing a metallic membrane. Both systems were compared by producing alginate beads using different nozzles.
Finding the optimum conditions (i.e., conditions where the droplets seem immobile in front of the flashing LEDs) was generally more manageable with the metallic membrane. The droplet production was stable. The mean size and size distribution in optimum conditions were similar for both membranes (Figure 4A).
Before complete rupture, the droplets are connected by a liquid filament (Figure 2). The breakage of the filament itself may lead to tiny droplets called satellites. The number of satellites was lower than 1% of the droplets with both membranes, representing less than 1 ppm of the droplet volume.
The main difference between the two types of membranes is observed in length before breakage (Figure 4B). The metallic membrane seems able to transfer the vibration more efficiently, leading to a faster breakage. The magnet is glued on the polymer membrane, while it is screwed on the metallic one. Several times it was needed to reattach the magnet on the polymer membrane, assuming that the connection was probably not strong enough over time. The vibration amplitude (Amp) seems to be important. The length of breakage increases with the frequency. As the total energy supplies to the system remain similar, the energy per rupture decreases as the frequency increases.
The two alternatives to the Buchi encapsulator (Brace and Nisco) vibrate the support directly and not a membrane. It requires higher energy, which remains negligible. There is a higher risk of parasite vibrations, but some tests were done and showed that both systems overcome this problem. Buchi [18] and Nisco encapsulators [19] are initially designed for lab scale, even though they have a multi-nozzle system. Buchi has a model developed specifically for biomedical applications. Brace [20] is designed for industrial application with large-scale models.

4.3. Mean Diameter and Size Dispersion Distribution

The droplet diameter was determined by direct measurement using the image analysis. It could be determined from the volume of the droplet using Equations (7) and (8). A good correlation was found between these two approaches (Figure 5C).
The size distribution was fitted well on the normal log law displayed in Equation (10) (Figure 5A). The size dispersion varied between 5% and 9% without natural tendency in the nozzle size and frequency (Figure 4C). However, the size dispersion was lower with the metallic membrane.
ƒ ( x ) = 1 σ 2 π e 1 2 ( x x ¯ σ ) 2

4.4. Jet Expansion

In order to force the liquid through the nozzle, it is necessary to apply pressure on the feeding vessel. At the exit of the nozzle there is a pressure reduction, leading to a jet expansion. Brandenberger and Widner (1998) [8] propose one relation involving the jet expansion to the Weber number (Equation (5)). The equation was developed for a nozzle using precision drilled sapphire stone as an orifice. Such a nozzle is quite fragile, and the sapphire stone was easily damaged. Drilling technology has improved, and nowadays, the nozzle is made of stainless steel. It was verified that the equation was still valid while the nozzle is slightly different (Figure 5B).

5. Droplet Diameter versus Jet Diameter

The droplet diameter has been measured for three nozzle sizes and different frequencies while adapting the flow to remain in optimum breakage conditions (Figure 6A). The size shows an asymptotic decay with the frequency (Figure 6B). The theory, however, predicts that the frequency would not affect the droplet size.
The deviation between the experimental data and Equation (9), based on the nozzle diameter, may be explained by the jet expansion at the nozzle exit (Equation (5)). Figure 7A shows that the droplets’ size is mainly proportional to the jet diameter (Equation (5)).
Data from Figure 7A was converted to an optimal wavelength (Equation (9)) and plotted in Figure 7B. The theoretical value of the optimal wavelength (Equation (1)) was also plotted. A good correlation between the experimental and the theoretical data is observed (correlation coefficient 98%).

6. Conclusions

Alginate beads have been used in many applications, from relatively simple food and feed applications to advanced biomedical technologies. Monodispersion is sometimes the key to success, like in the case of Langerhans Islets encapsulation but not always requested. However, reasonable control of size is important to consider an industrial transfer or sophisticated applications. Nozzle resonance method allows to get such control both size and the size dispersion, but only if well driven.
The use of a fast-video camera allows observing, more precisely, the capillary jet breakage. Previously, the analysis was done based on the alginate bead size. However, during gelation, the size of the particles contract. This process is in the function of the alginate type and concentration and calcium chloride concentration. Additionally, it was not possible to observe the breakage quality (length before breakage, formation of satellite droplets, etc.).
As pointed out by all equipment providers, the first observation is that the operator must define the optimum conditions to get mono-dispersed droplets. Equipment supplier recommendations help to define approximate parameter values. An alternative is to use the equations cited above. However, fine tune-up has to be accomplished using the LED control system.
The present work shows the importance of selecting a well-designed vibrating system (membrane material in Buchi). A nozzle resonance device may be homemade, but it requires an exact design to avoid any parasite vibration. In addition, this contribution presents data while varying the nozzle size, the frequency coupled with the flow rate to get optimum breakage, but keeping all the experiments the same alginate solution. For future experiments, we would like to modify the concentration and composition of the extruded solution. It would also be interesting to find a precise criterium to identify the optimum conditions.

Author Contributions

Conceptualization, D.P.; Data curation, M.C.M. and D.P.; Formal analysis, M.C.M. and D.P.; Funding acquisition, M.C.M. and C.S.F.-T.; Investigation, M.C.M. and D.P.; Methodology, M.C.M. and S.C.; Project administration, M.C.M.; Resources, S.C.; Supervision, C.S.F.-T. and D.P.; Visualization, D.P.; Writing—original draft, D.P.; Writing—review & editing, M.C.M., C.S.F.-T. and D.P. All authors have read and agreed to the published version of the manuscript.

Funding

This research was funded by Fundação de Amparo à Pesquisa do Estado de São Paulo (FAPESP) grant numbers 2016/16692-7 and 2015/19376-6.

Acknowledgments

The authors thank the Fundação de Amparo à Pesquisa do Estado de São Paulo for the scholarships that were granted (Processes 2016/16692-7 and 2015/19376-6).

Conflicts of Interest

The authors declare no conflict of interest.

References

  1. Kierstan, M.; Bucke, C. The immobilization of microbial cells, subcellular organelles, and enzymes in calcium alginate gels. Biotechnol. Bioeng. 1977, 19, 387–397. [Google Scholar] [CrossRef] [PubMed]
  2. Zhu, J.; Xie, W.; Liu, X.; Zhang, Y.; Yu, W.; Wang, W.; Ma, X. A new multinozzle encapsulation system for the large-scale production of uniform alginate beads. J. Biotechnol. 2008, 136, S141–S142. [Google Scholar] [CrossRef]
  3. Bahry, H.; Abdalla, R.; Pons, A.; Taha, S.; Vial, C. Optimization of lactic acid production using immobilized Lactobacillus Rhamnosus and carob pod waste from the Lebanese food industry. J. Biotechnol. 2019, 306, 81–88. [Google Scholar] [CrossRef] [PubMed]
  4. Schoebitz, M.; Simonin, H.; Poncelet, D. Starch filler and osmoprotectants improve the survival of rhizobacteria in dried alginate beads. J. Microencapsul. 2012, 29, 532–538. [Google Scholar] [CrossRef] [PubMed]
  5. Silva, M.P.; Tulini, F.; Ribas, M.M.; Penning, M.; Favaro-Trindade, C.S.; Poncelet, D. Microcapsules loaded with the probiotic Lactobacillus paracasei BGP-1 produced by co-extrusion technology using alginate/shellac as wall material: Characterization and evaluation of drying processes. Food Res. Int. 2016, 89, 582–590. [Google Scholar] [CrossRef] [PubMed]
  6. Abang, S.; Chan, E.-S.; Poncelet, D. Effects of process variables on the encapsulation of oil in ca-alginate capsules using an inverse gelation technique. J. Microencapsul. 2012, 29, 417–428. [Google Scholar] [CrossRef] [PubMed]
  7. Poncelet, D.; Neufeld, R.; Bugarski, B.; Amsden, B.G.; Zhu, J.; Goosen, M.F.A. A Parallel plate electrostatic droplet generator: Parameters affecting microbead size. Appl. Microbiol. Biotechnol. 1994, 42, 251–255. [Google Scholar] [CrossRef]
  8. Brandenberger, H.; Widmer, F. A new multinozzle encapsulation/immobilisation system to produce uniform beads of alginate. J. Biotechnol. 1998, 63, 73–80. [Google Scholar] [CrossRef]
  9. Schwinger, C.; Koch, S.; Jahnz, U.; Wittlich, P.; Rainov, N.G.; Kressler, J. High throughput encapsulation of murine fibroblasts in alginate using the JetCutter technology. J. Microencapsul. 2002, 19, 273–280. [Google Scholar] [CrossRef] [PubMed]
  10. Savart, F. Memoire sur la constitution des veines liquides lancees par des orifices circulaires en mince paroi. Ann. Chim. Phys. 1833, 53, 337–386. [Google Scholar]
  11. Rayleigh, J.W.S. On the capillary phenomena of jets. Proc. R. Soc. Lond. 1879, 29, 71–97. Available online: https://www.jstor.org/stable/113738 (accessed on 23 March 2021).
  12. Yuen, M.C. Nonlinear capillary instability of a liquid jet. J. Fluid Mech. 1968, 33, 131–163. [Google Scholar] [CrossRef]
  13. Bousfield, D.W.; Keunings, R.; Marrucchi, G.; Denn, M.M. Nonlinear analysis of the surface driven breakup of viscoelastic filaments. J. Non-Newton. Fluid Mech. 1986, 21, 79–97. [Google Scholar] [CrossRef]
  14. Ardekani, A.M.; Sharma, V.; McKinley, G.H. Dynamics of bead formation, filament thinning and breakup in weakly viscoelastic jets. J. Fluid Mech. 2010, 665, 46–56. [Google Scholar] [CrossRef] [Green Version]
  15. Büchi Labortechnik AG. Buchi Encapsulator B-390-Operation Manual, Version E; BÜCHI Labortechnik AG: Flawil, Switzerland, 2016. [Google Scholar]
  16. Schneider, J.M.; Hendricks, C.D. Source of Uniform-Sized Liquid Droplets. Rev. Sci. Instrum. 1964, 35, 1349–1350. [Google Scholar] [CrossRef]
  17. Weber, C. Zum zerfall eines flussikeitstahles. Z. Angew. Math. Mech. 1931, 11, 136–155. [Google Scholar] [CrossRef]
  18. Buchi Corporation. Encapsulator B-390, Switzerland. 2018. Available online: https://www.buchi.com/us-en/products/spray-drying-and-encapsulation/encapsulator-b-390 (accessed on 23 March 2021).
  19. Nisco Engineering AG. Principle of Laminar Jet Break-up VAR D, Zurich. 2015. Available online: http://www.nisco.ch/working_principle_electromagnetic.htm (accessed on 23 March 2021).
  20. Brace GmbH. Spherisator M2, Germany. 2021. Available online: https://www.brace.de/en/spherisator-m2.html (accessed on 26 March 2021).
Figure 1. Buchi B-390 encapsulator. (A) Scheme of B-390 BUCHI encapsulator: (B) Equipment. (C) Details of the membranes (D) The optimal conditions for jet breakage according to the Buchi Encapsulator manual [15].
Applsci 11 10222 g001
Figure 2. Monitoring of a jet capillary breakage.
Applsci 11 10222 g002
Figure 3. Observation of the droplet production by varying the vibration frequency (alginate solution 18 g/L, nozzle 800 µm, flow rate 38.5 mL/min) with recording duration of 0.2 ms. In this figure: (a) 300 Hz, (b) 500 Hz, (c) 600 Hz, (d) 700 Hz, (e) simulation of recording with 0.7 ms duration.
Applsci 11 10222 g003
Figure 4. Impact of frequency for metallic and polymer membrane while selecting optimum breakage conditions (see Section 4.1) (A) on droplet size (750 µm nozzle, mean error 3%) (B) jet length before breakage for two different amplitudes of vibration (mean error 11%). (C) Droplet size dispersion (Nozzle 450 μm, amplitude 4, mean error 6%).
Applsci 11 10222 g004
Figure 5. (A) Droplet size distribution (Nozzle 750 µm, 300 Hz) in relation to the normal law. (B) Jet expansion versus the Weber number (Nozzle 450, 750, and 1000 µm, Amplitude 4). (C) Comparing the droplet diameter by direct measurement and volume of the droplet using three nozzle sizes.
Applsci 11 10222 g005
Figure 6. (A) Selected flow rate in function of the frequency to maintain optimum breakage. (B) Effect of the frequency on the droplet diameter for different nozzle sizes.
Applsci 11 10222 g006
Figure 7. (A) Droplet size versus the jet diameter. (B) The optimum wavelength versus the jet diameter.
Applsci 11 10222 g007
Publisher’s Note: MDPI stays neutral with regard to jurisdictional claims in published maps and institutional affiliations.

