Article

Analysis of Weighted Fraction of Length for Interfacial Gap in Cervical Composite Restorations as a Function of the Number of B-Scans of OCT Volume Scans

Department of Cariology, Endodontology and Periodontology, University of Leipzig, Liebigstraße 12, 04103 Leipzig, Germany
*
Author to whom correspondence should be addressed.
Appl. Sci. 2021, 11(21), 10285; https://doi.org/10.3390/app112110285
Submission received: 28 July 2021 / Revised: 26 October 2021 / Accepted: 30 October 2021 / Published: 2 November 2021
(This article belongs to the Special Issue Medical Imaging: Advanced Techniques and Applications)

Abstract

:

Featured Application

A method to determine the mean fraction of interfacial gap length in cervical composite restorations with SD-OCT is presented. Twenty-one images were required for the system to determine the mean, with an error of ±2.5%.

Abstract

In dental research, the morphometric assessment of restorations is a challenge. This also applies to the assessment of the length of interfacial adhesive defects in composite restorations as a measure of tooth-restoration bond failure. The determined mean fractions of interfacial gap length on enamel and dentin interfaces deviate from the true means (N ∞), depending on the number (Ni) of object layers assessed. Cervical composite restorations were imaged with spectral domain optical coherence tomography (SD-OCT). The mean fractions of interfacial gap length on enamel and dentin were determined for an increasing number of OCT cross-sectional images (B-scans) per restoration and were graphically displayed as a function of the number of B-scans. As the number of B-scans increased, the calculated object means approached a range of ±2.5%. This analysis is appropriate for displaying the relationship between the determined mean fraction of interfacial gap length at the enamel/dentin-restoration interface and the number of B-scans.

1. Introduction

The adhesive bonding of composites to hard tooth tissues has become the predominant restorative technique. The adaptation (adhesive bond) of restorations to the teeth determines their clinical durability. In clinical evaluations of composite restorations, according to FDI critera, marginal adaptation is one of the 16 evaluation criteria, belonging to the category of functional parameters [1]. However, this criterion does not necessarily indicate the degree of internal adaptation of the composite restoration to the tooth. Experimental studies therefore evaluate the internal adaptation of restorations to the enamel and dentin [2]. In this context, the extent of the interfacial adhesive defects (interfacial gaps) is considered a criterion for assessing the quality of the tooth–composite bond, or vice versa, for the failure of the bond. For this purpose, the restored teeth are sectioned and the extent (length) of the interfacial adhesive defects, or the microleakage, is determined on several tooth sections. A problem arises from the fact that for several sections no normal distribution of the values for interfacial gap length (or the fraction for the interfacial gap length) can be assumed. The smaller the number (Ni) of the sections, the more the mean values determined per restoration can deviate from the true values (N ∞), an error that results from the inherent statistical sampling error due to the geometrical properties of B-scans and interface defects. In other words, the quality of the mean value of the object depends on the number of object sections (sample size), or the larger the sample size, the more its amount should approach the true object mean value (N ∞).
In experimental studies, the sectioning of restorations is limited by their small size (cervical composite restorations (Class V), [2]). For tomographically obtained 3D image stacks with hundreds of cross-sectional images, the question arises at which sample size the calculated mean fraction of interfacial gap length or microleakage approaches the true value (N ∞) within an acceptable (statistical) range. Based on invasive preparation techniques for light and electron microscopic object imaging, the assessment of tooth–composite bond failure using the extent of interfacial gaps or microleakage was performed on two [3] to seven sections per object [2,4,5,6,7,8,9]. In contrast, based on nondestructive tomographic imaging, up to twenty-five, thirty-five [10,11,12,13] or several hundred cross-sectional images per tooth have been used [14,15]. Optical coherence tomography can generate 3D image stacks of teeth with hundreds of B-scans with high spatial resolution without invasive sample preparation. The aim of the study was to determine for Class V composite restorations (enamel, dentin) the dependence of the calculated mean fraction of interfacial gap length on the number of underlying B-scans in order to experimentally deduce N-values for defined errors compared to N ∞.

2. Materials and Methods

2.1. Study Design, Study Population, Restoration Procedure

One human canine tooth and two premolars from patients who had participated in a previous double-blind, randomized clinically controlled trial (RCT) were assessed. The parameters of the study have already been extensively described [16]. According to the Declaration of Helsinki, the study was conducted and approved by the ethics committee of the Medical Faculty of the University of Leipzig, Germany (no. 192/2008). The participants were informed about the study and they signed the informed consent form. The patients had received at least two or three Class V composite restorations. The lesions were restored according to the protocol and the manufacturer’s instructions [16], using the one-step self-etching adhesive system Futurabond® M (FbM) or the two-step etch-and-rinse system Solobond® M (SbM) in combination with the nano-hybrid composite Amaris® (all Voco GmbH, Cuxhaven, Germany) or the four-step etch-and-rinse system Syntac classic® (SyC) in combination with Tetric EvoCeram® (Ivoclar Vivadent AG, Schaan, Principality of Liechtenstein, control). The three restorations chosen for the study showed more or less distinct interfacial gaps 36 to 48 months after restoration placement (Table 1).

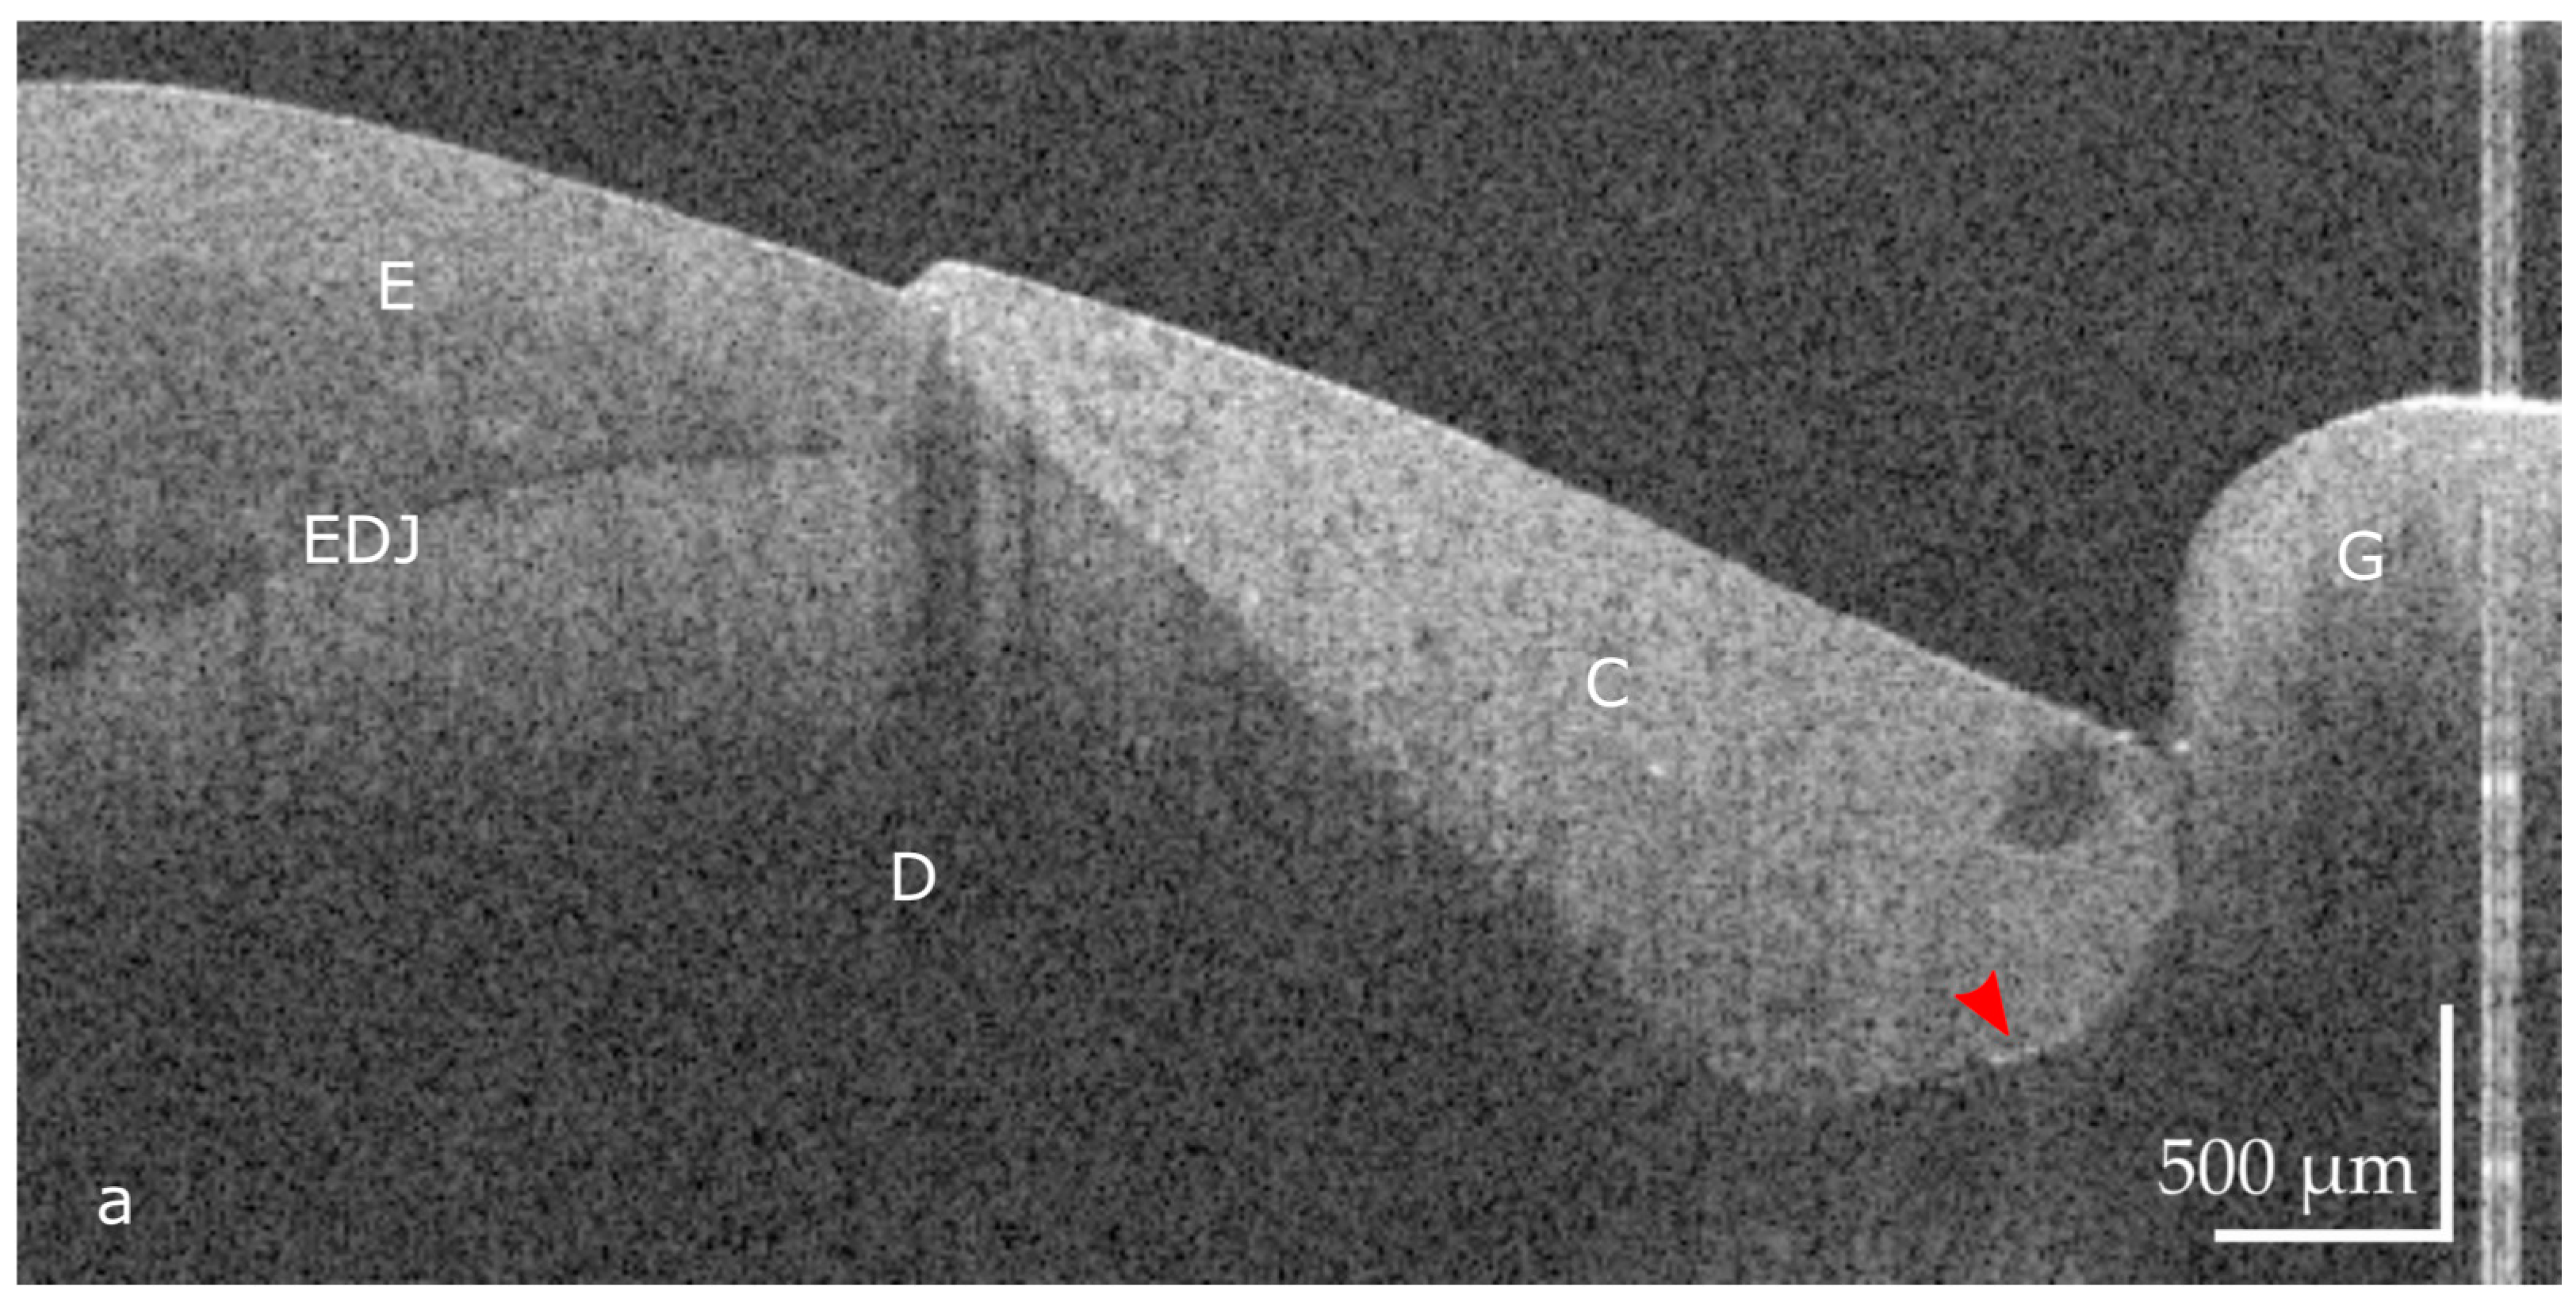
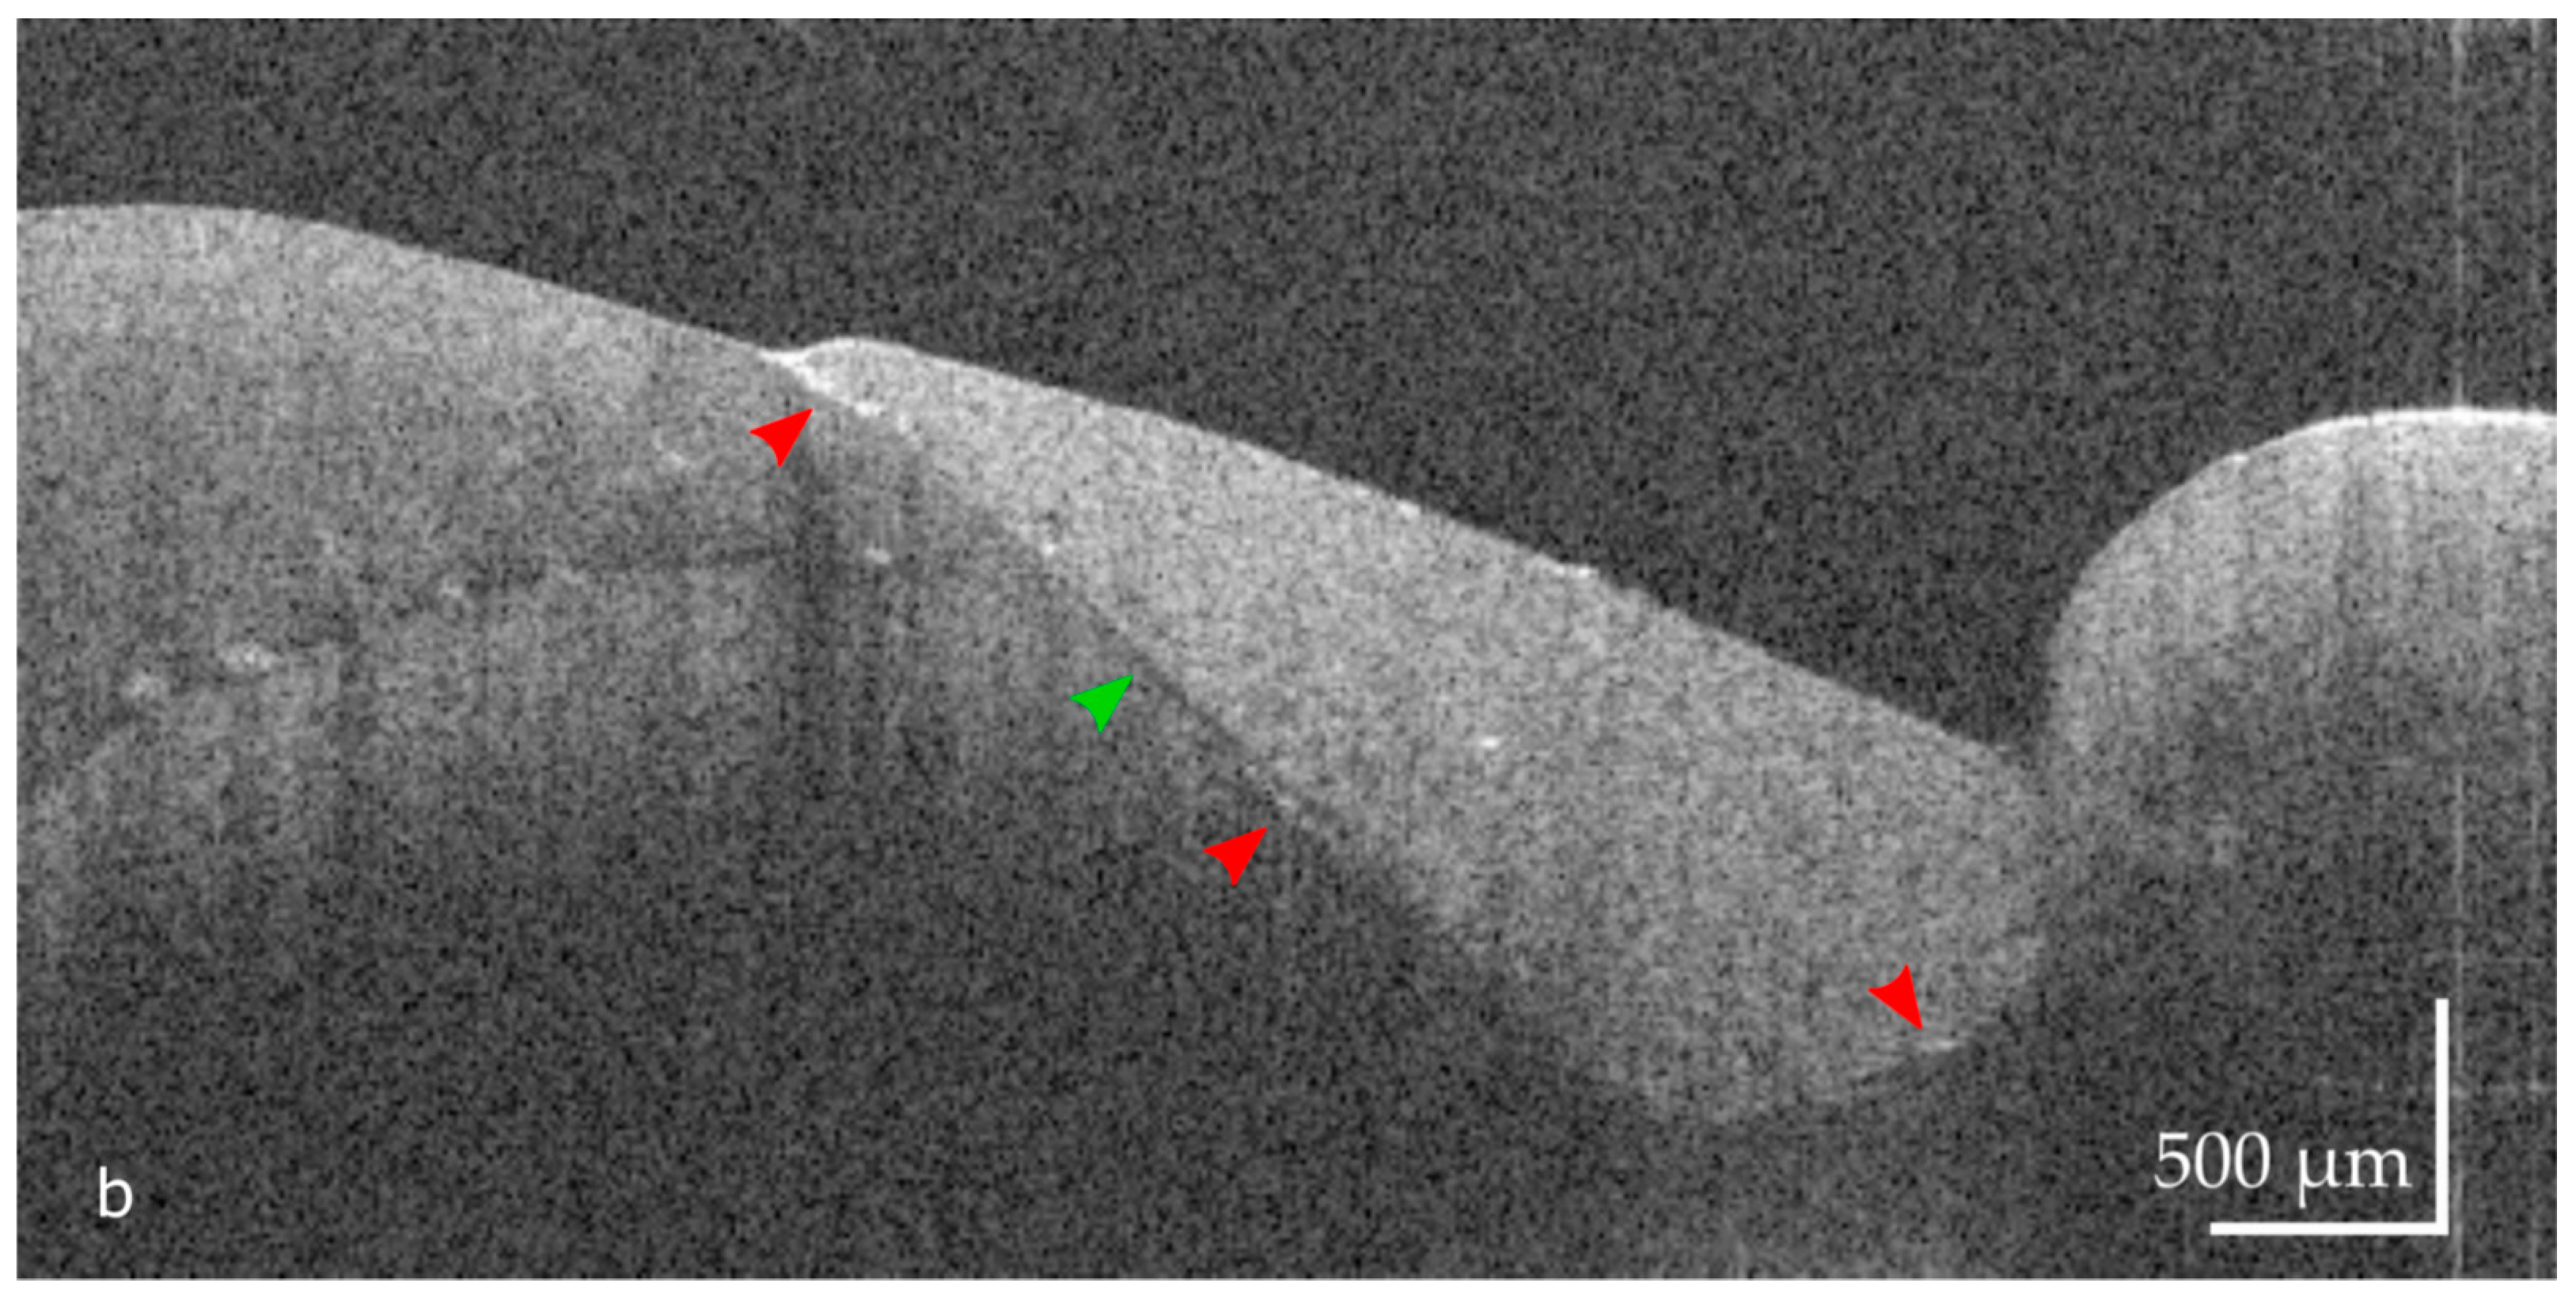
2.2. OCT Imaging, Image Analysis
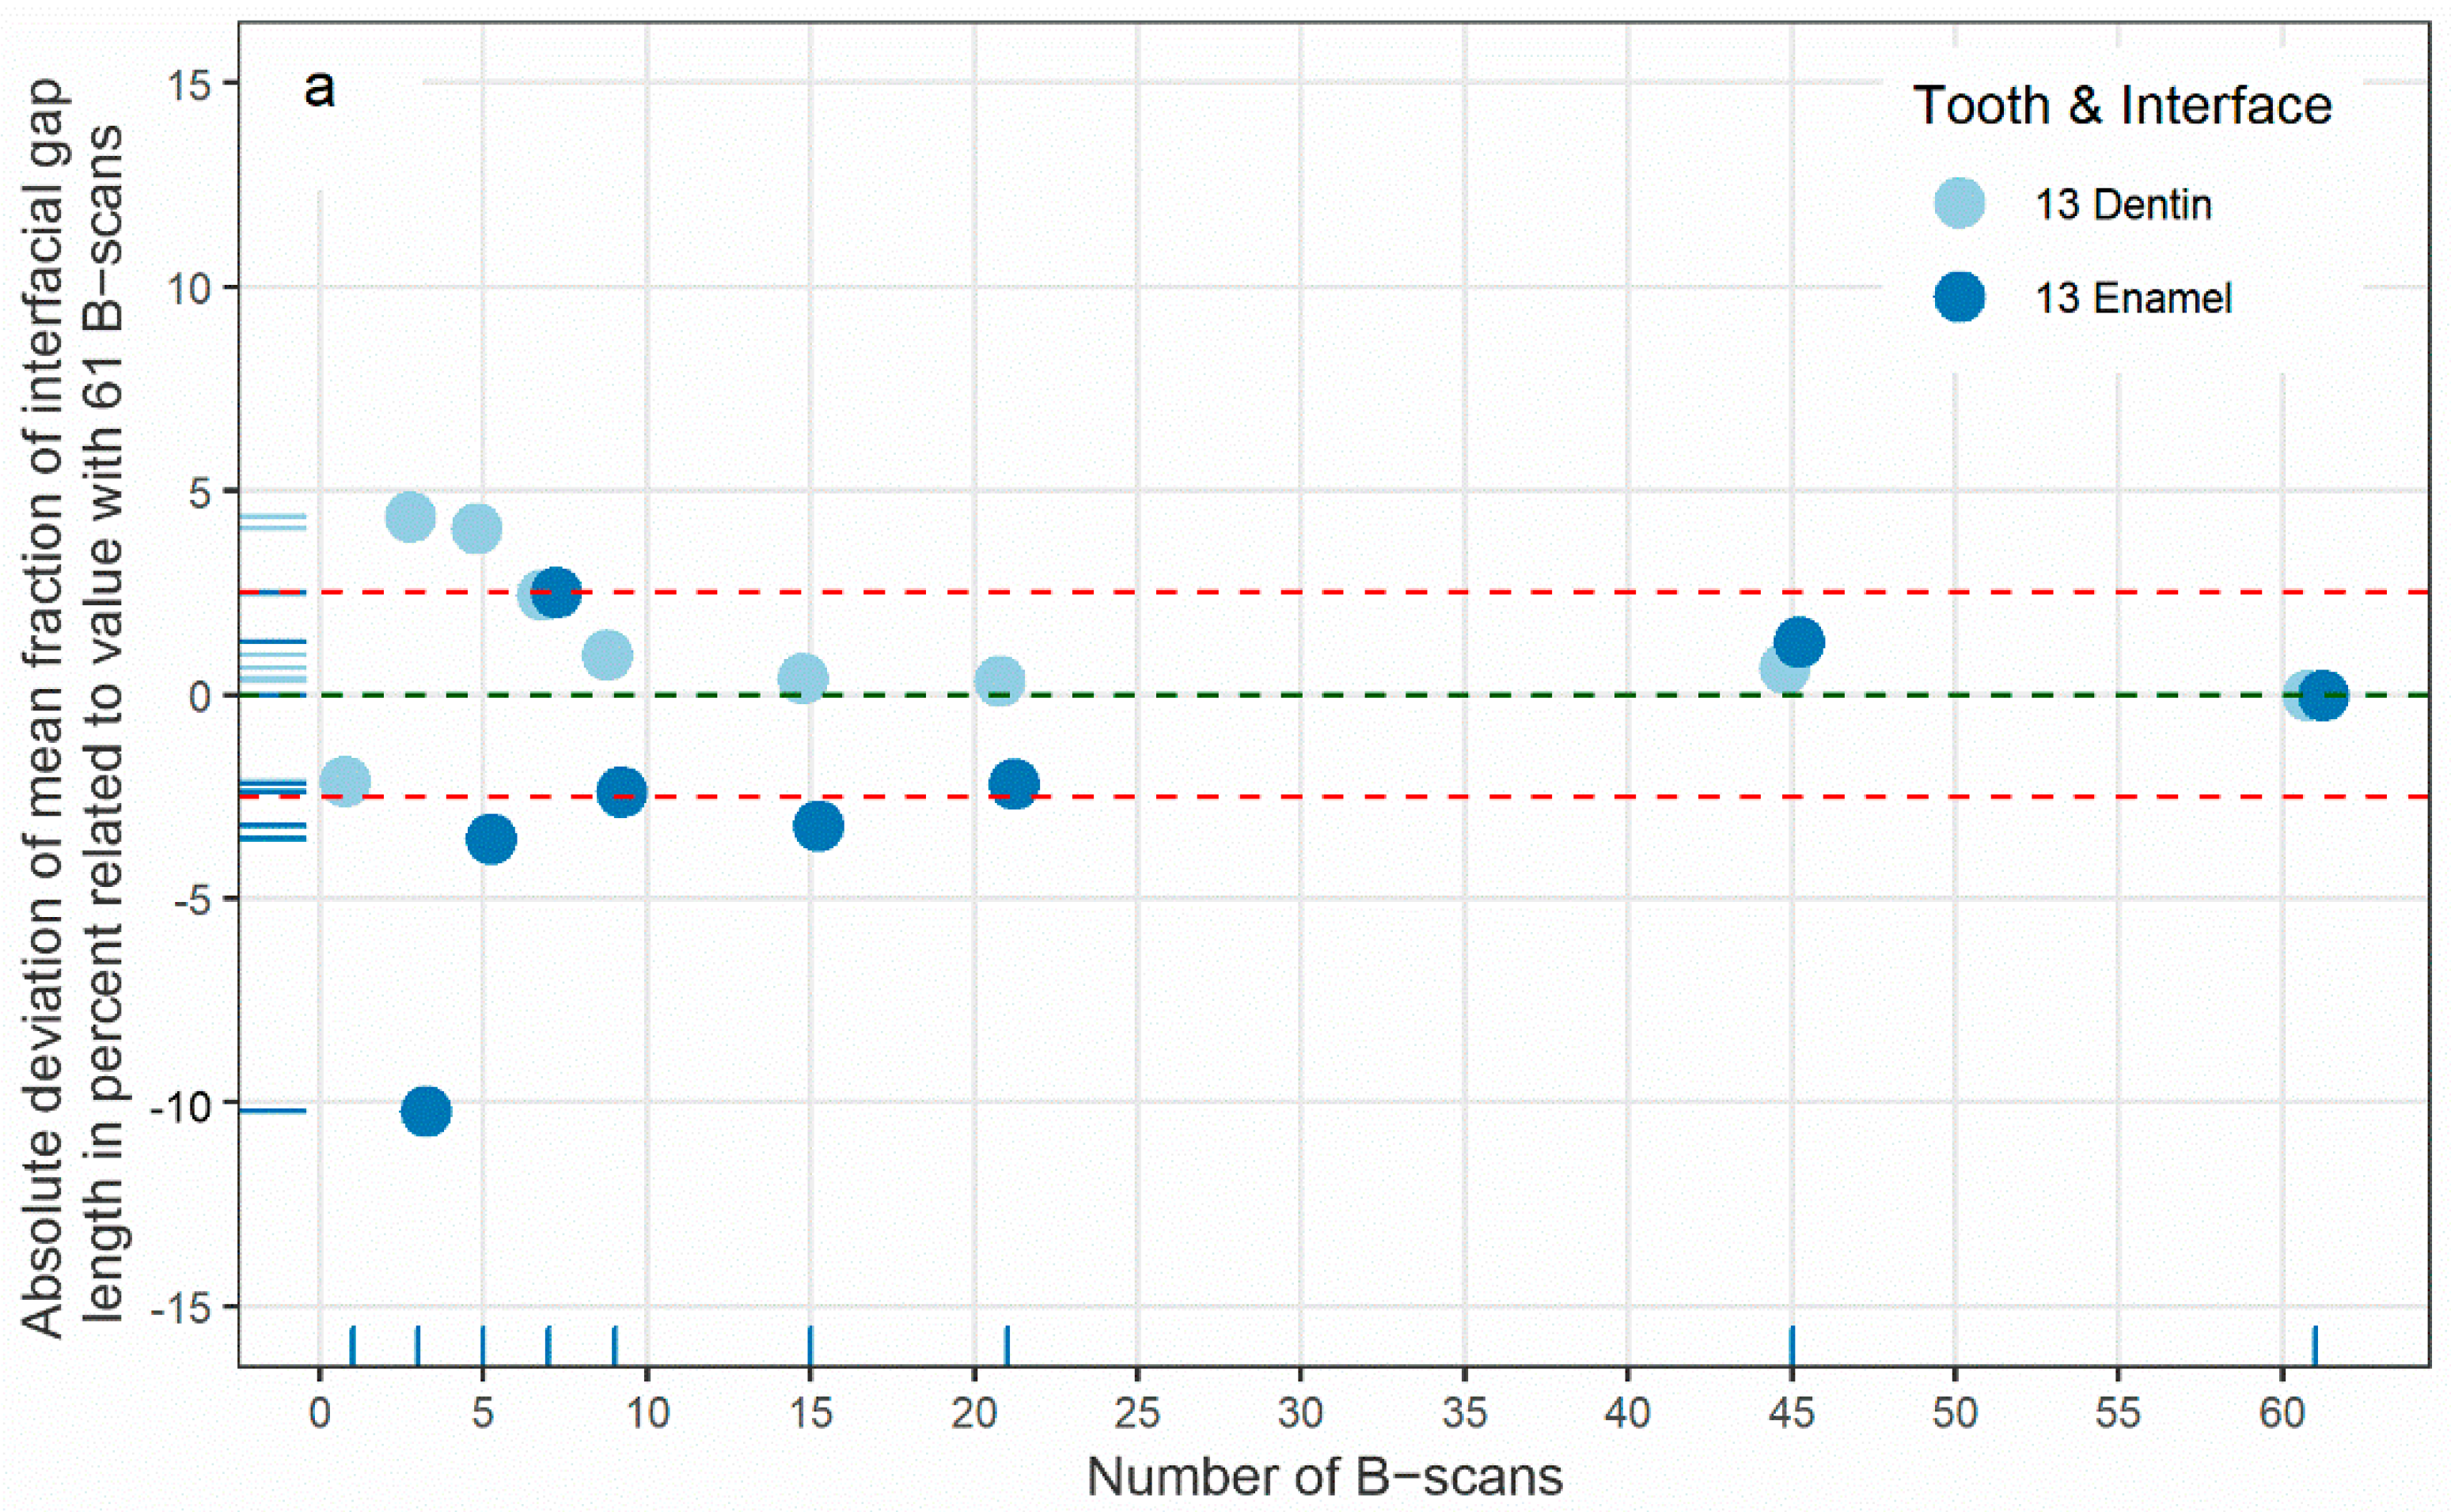
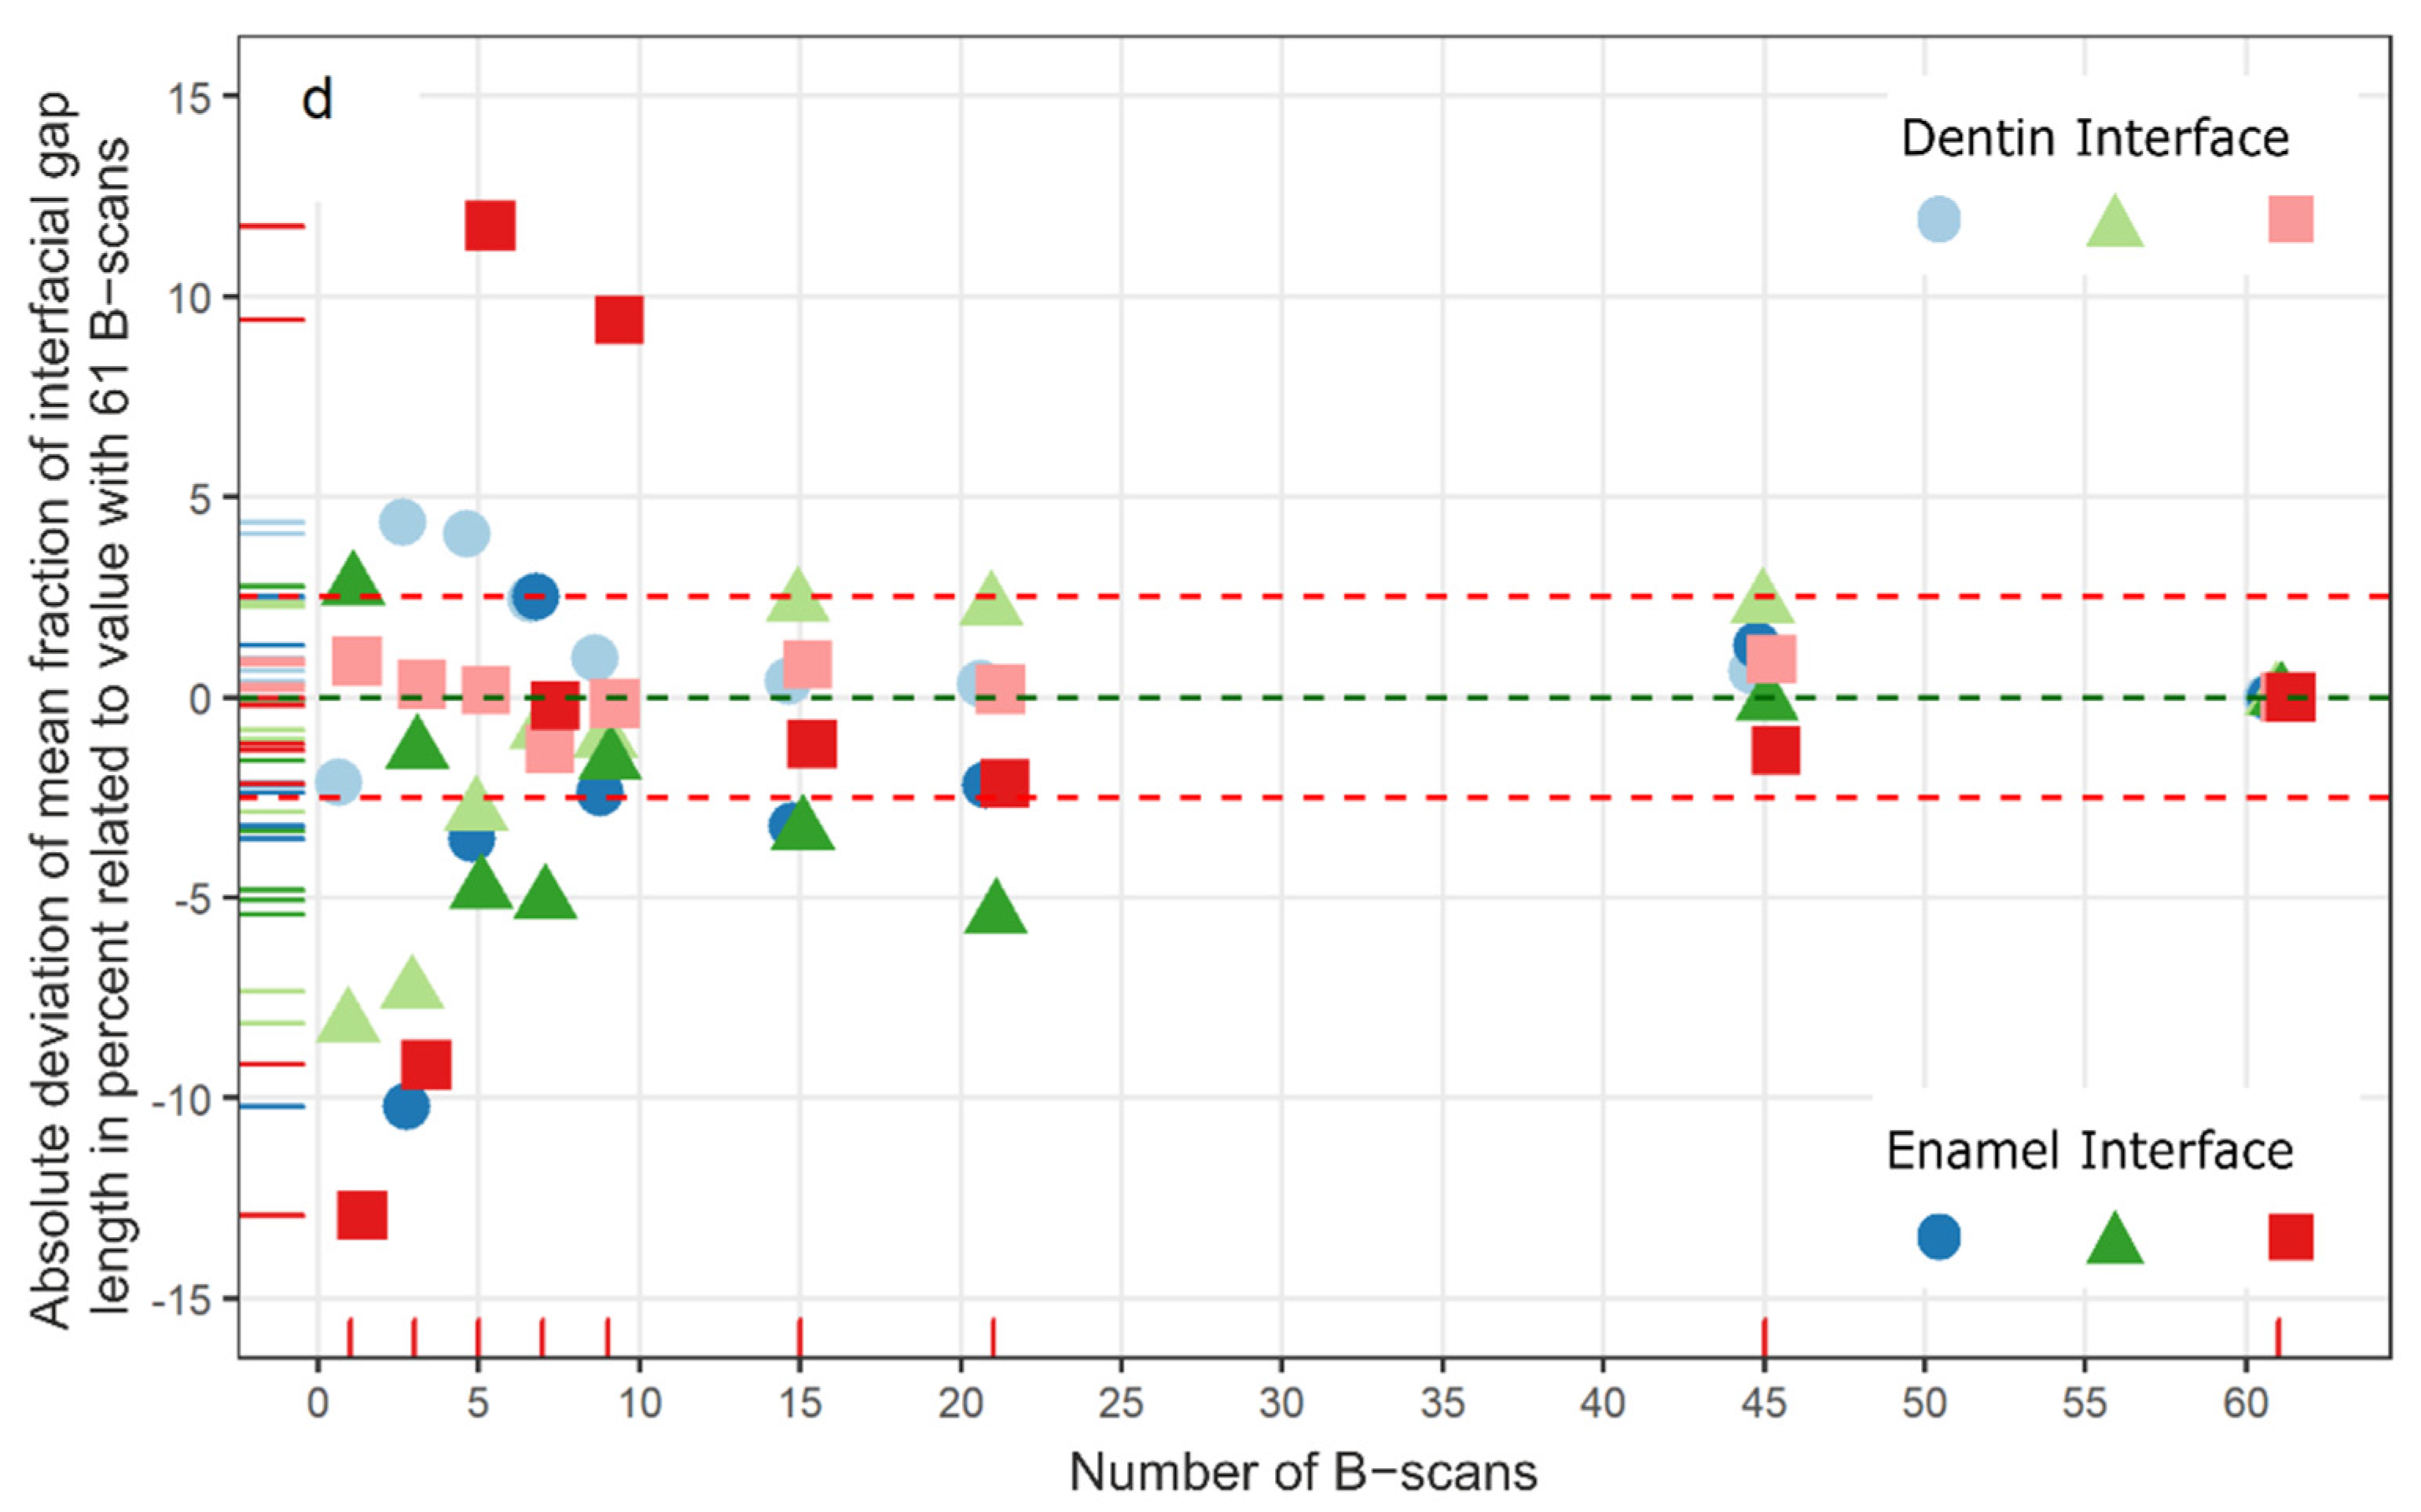
In parallel with the clinical evaluation of the restorations, according to the FDI criteria [1], they were imaged with spectral domain OCT (SD-OCT, Telesto II SP5, Thorlabs GmbH, Dachau, Germany). A detailed description of OCT and the equipment used has already been provided [12,17]. The restored tooth surfaces were scanned axially with a beam of broadband light in a field of view of a maximum of 10 mm × 10 mm × 3.5 mm (air, pixels maximum 1000 × 1000 × 512) point-by-point and line-by-line. The axial/lateral resolution was <5.5 (air) µm/20 µm. Further technical specifications of the OCT system were: center wavelength 1310 nm, imaging speed 76 kHz, sensitivity ≤ 106 dB, and an A-scan average of one.
OCT imaging was performed by an experienced, calibrated dentist (cleaning, drying of the restored surface, placement of the probe, separation of the lips and cheeks) who was blinded to the restorative materials. The operator-stabilized probe was perpendicularly positioned to the surface of the restoration at a distance of 30 to 35 mm. Depending on the mesial-distal extent of the restoration, 3D OCT images with 150 to 500 B-scans per image stack were generated and exported (Thorlabs SDOCT v. 3.2, Thorlabs GmbH).
An increasing number of evenly distributed B-scans (N: 1, 3, 5, 7, 9, 15, 21, 45, 61) were selected per restoration after alignment of the image stacks (registry plugin StackReg [18], FiJi (ImageJ 1.48, Wayne Rasband, National Institutes of Health, Bethesda, MD, USA)). Image analysis was performed, as previously described [10], at the same screen by one trained, blinded, calibrated examiner, who was introduced into the methodology of image evaluation. For this purpose, in each B-scan, the lengths of the interfaces on enamel and dentin, as well as the signals for the interfacial gap (Figure 1), were determined using ImageJ and CTAn 1.1.4.4.1+ (64 bit, Bruker microCT N.V., Kontich, B). A gap signal at the cavity floor is a cluster of a minimum of three image pixels with enhanced brightness compared to the image background, defined by rising and falling slopes in the A-scans located at the interface with a height above the maximum signal value of the range of the background.
The percentage for the length of adhesive defects in a B-scan was determined as follows:
total length defect signal/length specific interface × 100, %.
For each restoration, a weighted mean fraction of the interfacial gap length was calculated for enamel and dentin. Explanation: due to the cavity geometries, the lengths of the interfaces at enamel and dentin are unevenly distributed in the B-scans. Therefore, each B-scan contributes differently to the weighted mean fraction of the interfacial gap length with the proportion of the inherent length of the respective interface to the total length in the volume scan. In addition, interfacial gaps are unevenly distributed in the cavity. Furthermore, therefore, each B-scan does not contribute equally to the calculated mean value. Subsequently, the weighted means were graphically plotted as a function of the number of B-scans.
Semi-automatic segmentation of the enamel/dentin-composite interface for the restoration of tooth 24 was performed using Seg3D* 2.1.5, discriminating between areas with and without interfacial gap formation (NIH/NIGMS, University of Utah, Salt Lake City, UT, USA).

3. Results

Figure 1a,b shows exemplary SD-OCT cross-sectional images with interfacial gap formations on enamel and dentin, as used for the analysis.
Figure 2a–d shows the trends of the calculated mean fraction for interfacial gap length at enamel and dentin as a function of the number of underlying B-scans based on the absolute deviations from the values given for 61 B-scans. As the number of B-scans increases, the mean values approach a range of the width of about 5%. The approximation to the true mean (N ∞) becomes apparent when all B-scans are included (Figure 3, exemplarily for dentin of tooth 45). In Figure 4a–f, an example of semi-automatic 3D segmentation of the tooth–composite interface is demonstrated.

4. Discussion

The present study addresses a relevant question that must be raised in studies concerning the quality of the tooth–composite bond in cervical composite restorations. What deviation of the calculated mean from the true mean value (N ∞) of the fraction of interfacial gap length can be expected when using a certain number of cross-sectional images (or sections) of a restoration for the calculation? In the present case, the random error associated with the measurement is determined once by the reliability of the results (reproducibility, precision of measurement), as well as from the (random) deviation of the measured mean from the true mean with N ∞. The availability of non-destructive imaging tomographic techniques such as X-ray microtomography and optical coherence tomography allows the latter to be studied, both object- and parameter-specifically. In the quantification of interfacial gaps at the enamel and dentin of Class V composite restorations, it is helpful to use 3D OCT volume scans to segment the intact and defective interface areas using a suitable algorithm and to determine the proportion for the interfacial gap based on the measurement of the areas with and without gaps (Figure 4). However, this was accompanied by numerous difficulties. For example, the frequent occurrence of disturbances in the B-scans necessitates their individual analysis. The time required for semi-automatic segmentation was about four to six hours per object, depending on the size of the restoration, which is highly time-consuming. The manual evaluation of all B-scans in the volume scan, according to Figure 3, could not eliminate this dilemma, as the time required was still two to three hours per restoration.
The objective of the study was reached. More extensive ranges for the calculated mean fraction of interfacial gap length of up to ±13% were obtained, particularly when less than 15 evenly distributed B-scans were used. When looking at further B-scans with up to 61 images considered, the values approached a range of ±2.5% (Figure 2). With additional B-scans, this range narrowed more (Figure 3). However, the time required for analysis increased significantly with increasing sample size. For example, this was 20 to 30 min with 25 B-scans per restoration compared to 60 to 80 min when using 61 images.
In the literature, no information is usually given on the random error that arises from the deviation of the measured from the true mean with N ∞ [2,3,4,5,6,7,8,9,10,11,12,13,14,15]. However, the number of sections per sample should be sensibly considered, since larger deviations of the calculated mean are to be expected if only a few object levels are included in the analysis. For example, in two long-term clinical trials on the clinical performance of composite restorations with parallel OCT imaging of tooth–composite bond failure, 25 equidistantly distributed B-scans per restoration were assessed [10,11]. Compared to clinical assessment, OCT was more effective in statistically identifying group differences. It showed these earlier and more selectively, considering the restoration systems and gap formation specifically on enamel and dentin. In an in vitro study, in contrast, 35 cross-sectional images per tooth were considered adequate to determine group differences [13]. OCT imaging and analysis based on this are beneficial for estimating sample size to determine morphological criteria such as the length of interfacial gaps. Due to the increasing availability of equipment systems, this currently appears to be realistic.

5. Conclusions

To assess the failure of the tooth-composite bond in Class V composite restorations, more than 21 evenly distributed layers per object appear to be sufficient to determine the mean fraction of interfacial gap length within a range of ±2.5%.

Author Contributions

Conceptualization, H.S.; methodology, H.S. and T.M.; software, T.M.; validation, C.R. and T.M.; formal analysis, H.S. and T.M.; investigation, T.M. and C.R.; resources, R.H.; data curation, T.M.; writing—original draft preparation, editing H.S.; co-writing—review, R.H.; visualization, C.R. All authors have read and agreed to the published version of the manuscript.

Funding

OCT equipment was funded by the European Regional Development Fund/Saxon State Ministry of Science and the Arts (EFRE/SMWK grant 100175024), the research received no financial funding.

Institutional Review Board Statement

The study was conducted according to the guidelines of the Declaration of Helsinki and approved by the Institutional Ethics Committee of the Medical Faculty of the University of Leipzig, Germany (No 192/2008).

Informed Consent Statement

Written informed consent was obtained from all subjects involved in the study.

Data Availability Statement

Not applicable.

Acknowledgments

Patrick Scheibe, Image Processing Core Unit, Translational Centre for Regenerative Medicine Leipzig, University of Leipzig.

Conflicts of Interest

The authors declare no conflict of interest.

References

  1. Hickel, R.; Peschke, A.; Tyas, M.; Mjör, I.; Bayne, S.; Peters, M.; Hiller, K.-A.; Randall, R.; Vanherle, G.; Heintze, S.D. FDI World Dental Federation: Clinical criteria for the evaluation of direct and indirect restorations-update and clinical examples. Clin. Oral Investig. 2010, 14, 349–366. [Google Scholar] [CrossRef] [PubMed]
  2. Häfer, M.; Schneider, H.; Rupf, S.; Busch, I.; Fuchß, A.; Merte, I.; Jentsch, H.; Haak, R.; Merte, K. Experimental and clinical evaluation of a self-etching and an etch-and-rinse adhesive system. J. Adhes. Dent. 2013, 15, 275–286. [Google Scholar] [CrossRef]
  3. Kamalak, K.; Mumcu, A.; Altin, S. The Temperature Dependence of Micro-Leakage between Restorative and Pulp Capping Materials by Cu Diffusion. Open Dent. J. 2015, 9, 140–145. [Google Scholar]
  4. Kermanshah, H.; Khorsandian, H. Comparison of microleakage of Scotchbond™ Universal Adhesive with methacrylate resin in Class V restorations by two methods: Swept source optical coherence tomography and dye penetration. Dent. Res. J. 2017, 14, 272–281. [Google Scholar] [CrossRef] [PubMed]
  5. Al-Imam, H.; Michou, S.; Benetti, A.R.; Gotfredsen, K. Evaluation of marginal and internal fit of acrylic bridges using optical coherence tomography. J. Oral Rehabil. 2019, 46, 274–281. [Google Scholar] [CrossRef] [PubMed]
  6. Fronza, B.M.; Makishi, P.; Sadr, A.; Shimada, Y.; Sumi, Y.; Tagami, J.; Giannini, M. Evaluation of bulk-fill systems: Microtensile bond strength and non-destructive imaging of marginal adaptation. Braz. Oral Res. 2018, 32, e80. [Google Scholar] [CrossRef] [PubMed]
  7. Bortolotto, T.; Bahillo, J.; Richoz, O.; Hafezi, F.; Krejci, I. Failure analysis of adhesive restorations with SEM and OCT: From marginal gaps to restoration loss. Clin. Oral Investig. 2015, 19, 1881–1890. [Google Scholar] [CrossRef] [PubMed] [Green Version]
  8. Turkistani, A.; Almutairi, M.; Banakhar, N.; Rubehan, R.; Mugharbil, S.; Jamleh, A.; Nasir, A.; Bakhsh, T. Optical Evaluation of Enamel Microleakage with One-Step Self-Etch Adhesives. Photomed. Laser Surg. 2018, 36, 589–594. [Google Scholar] [CrossRef] [PubMed]
  9. Haak, R.; Näke, T.; Park, K.J.; Ziebolz, D.; Krause, F.; Schneider, H. Internal and marginal adaptation of high-viscosity bulk-fill composites in class II cavities placed with different adhesive strategies. Odontology 2019, 107, 374–382. [Google Scholar] [CrossRef] [PubMed]
  10. Haak, R.; Schmidt, P.; Park, K.J.; Häfer, M.; Krause, F.; Ziebolz, D.; Schneider, H. OCT for early quality evaluation of tooth-composite bond in clinical trials. J. Dent. 2018, 76, 46–51. [Google Scholar] [CrossRef] [PubMed]
  11. Haak, R.; Hähnel, M.; Schneider, H.; Rosolowski, M.; Park, K.J.; Ziebolz, D.; Häfer, M. Clinical and OCT outcomes of a universal adhesive in a randomized clinical trial after 12 months. J. Dent. 2019, 90, 103200. [Google Scholar] [CrossRef] [PubMed]
  12. Park, K.J.; Schneider, H.; Haak, R. Assessment of interfacial defects at composite restorations by swept source optical coherence tomography. J. Biomed. Opt. 2013, 18, 76018. [Google Scholar] [CrossRef] [PubMed] [Green Version]
  13. Haak, R.; Siegner, J.; Ziebolz, D.; Blunck, U.; Fischer, S.; Hajtó, J.; Frankenberger, R.; Krause, F.; Schneider, H. OCT evaluation of the internal adaptation of ceramic veneers depending on preparation design and ceramic thickness. Dent. Mater. 2021, 37, 423–431. [Google Scholar] [CrossRef] [PubMed]
  14. Öztürk, F.; Ersöz, M.; Öztürk, S.A.; Hatunoğlu, E.; Malkoç, S. Micro-CT evaluation of microleakage under orthodontic ceramic brackets bonded with different bonding techniques and adhesives. Eur. J. Orthod. 2016, 38, 163–169. [Google Scholar] [CrossRef] [PubMed] [Green Version]
  15. Hayashi, J.; Shimada, Y.; Tagami, J.; Sumi, Y.; Sadr, A. Real-Time Imaging of Gap Progress during and after Composite Polymerization. J. Dent. Res. 2017, 96, 992–998. [Google Scholar] [CrossRef] [PubMed]
  16. Häfer, M.; Jentsch, H.; Haak, R.; Schneider, H. A three-year clinical evaluation of a one-step self-etch and a two-step etch-and-rinse adhesive in non-carious cervical lesions. J. Dent. 2015, 43, 350–361. [Google Scholar] [CrossRef] [PubMed]
  17. Schneider, H.; Park, K.J.; Häfer, M.; Rüger, C.; Schmalz, G.; Krause, F.; Schmidt, J.; Ziebolz, D.; Haak, R. Dental Applications of Optical Coherence Tomography (OCT) in Cariology. Appl. Sci. 2017, 7, 472. [Google Scholar] [CrossRef] [Green Version]
  18. Thévenaz, P.; Ruttimann, U.E.; Unser, M. A pyramid approach to subpixel registration based on intensity. IEEE Trans. Image Process. 1998, 7, 27–41. [Google Scholar] [CrossRef] [PubMed] [Green Version]
Figure 1. Tooth 45. The Class V cavity was restored with SbM/Amaris. The OCT cross-sectional images of two slices of the restoration show composite (C), enamel (E), dentin (D), the enamel-dentin junction (EDJ), and the gingiva (G). Interfacial adhesive defects (bright lines, red arrow heads) appear on both dentin (a,b) and enamel (b), and their lengths can be determined. Partially, the adhesive layer also appeared (green arrowhead, dark interfacial zone). Scales refer to refractive index n = 1.0.
Applsci 11 10285 g001aApplsci 11 10285 g001b
Figure 2. Scatter plots for teeth 13 (a), 24 (b), 45 (c), and for all teeth (d). The plots show the absolute deviation of the weighted mean fraction of the interfacial gap length (enamel and dentin) from the value using 61 cross-sectional images as a function of the number of B-scans (N: 1, 3, 5, 7, 9, 15, 21, 45, and 61). The red dashed lines indicate the (statistical) range of ±2.5% of the deviation of means, compared to 61 B-scans. Depending on the restoration examined, their deviation was up to ±13%, with less than 15 B-scans.
Applsci 11 10285 g002aApplsci 11 10285 g002bApplsci 11 10285 g002c
Figure 3. Approximation for the weighted mean fraction of interfacial gap length on dentin, based on all 362 B-scans of the volume scan exemplarily for tooth 24. The approximation of the true mean with N ∞ becomes clear.
Applsci 11 10285 g003
Figure 4. (a) An OCT cross-sectional image of tooth 13 restored with FbM/Amaris. In the B-scan enamel (E), dentin (D), composite (C), and the enamel-dentin junction (EDJ) are displayed. Interfacial adhesive defects (bright lines, red arrow heads), the lengths of which can be determined, occur at the interface with both enamel and dentin. (b) To consider only the composite–dentin interface (orange line), the composite surface and the composite–enamel interface were segmented (blue line). (c) Interfacial adhesive defects at dentin were segmented as light blue areas. (d) The interface on enamel and associated gap signals were segmented as described before. (e) Result of the semi-automatic segmentation of the B-scan with the intact interfaces on dentin (dark green) and enamel (light green) or interfacial adhesive defects (red). (f) 3D display of the tooth–composite interfaces with attachment to dentin (dark green) and enamel (light green), as well as interfacial gap formations (red). Scales refer to refractive index n = 1.0.
Applsci 11 10285 g004
Table 1. Mean fractions (%) of interfacial adhesive defect length at enamel and dentin of the samples, determined as described in the Materials and Methods Section 2.2.
Adhesive_ToothEnamel, %Dentin, %
FbM_1319.84.9
SyC_247.418.8
SbM_4512.92.4
Publisher’s Note: MDPI stays neutral with regard to jurisdictional claims in published maps and institutional affiliations.

