Article

Scaled Model Simulation and Experimental Verification of Submarine Flexible Pipeline Laying System

College of Mechanical and Electrical Engineering, Harbin Engineering University, Harbin 150001, China
*
Author to whom correspondence should be addressed.
Appl. Sci. 2021, 11(21), 10292; https://doi.org/10.3390/app112110292
Submission received: 4 October 2021 / Revised: 24 October 2021 / Accepted: 27 October 2021 / Published: 2 November 2021

Abstract

:
In order to adapt to the complex and changeable marine environment such as wind, wave, and current, the physical simulation experiment is usually needed in the design of a deep-sea flexible pipeline-laying system. In reality, the flexible pipeline-laying system is very large, and the experimental cost is huge. Therefore, when analyzing this system, it is necessary to carry out scaled model experiments to verify the rationality of it. Taking the flexible pipeline-laying system working under four-level sea conditions as an example, this paper deduces the similarity criteria of the scaled model according to the similarity theory. According to the required experimental site, the sizes and materials of the model are selected, and then the physical quantities of the model and their similarity ratio corresponding to the prototype are determined. According to the physical quantities of the experimental model, the similarity of dynamic characteristics and structural strength between the model and the prototype are verified by Adams and ANSYS Workbench. The research shows that the scaled model and prototype based on similarity theory can meet the established similarity relationship, and the scaled model experiment is an effective way to verify the rationality of the design of a flexible pipeline-laying system.

1. Introduction

The submarine pipeline is one of the most widely used modes for offshore oil and gas transportation, which has obvious advantages in efficiency, economy, and reliability. Compared with rigid pipelines, the flexible pipeline will become the main form of submarine pipeline development due to its obvious advantages such as high-speed laying, seawater corrosion resistance, bending, and tension resistance. The efficiency of submarine pipeline laying will become a hot issue in marine energy transportation [1,2,3,4,5].
Compared with land pipelines, the laying process of submarine pipelines needs to consider complex adverse factors such as current and wave. Main laying methods include S-laying, J-laying, and recently developed flexible laying [6]. In the study of coupling dynamic characteristics between piping system and piping of ship, pipe-laying tower and other equipment, the solution of the theoretical mathematical model has certain limitations. Therefore, it is necessary to verify the dynamic characteristics of the pipe-laying system by model tests.
For the dynamic characteristics of pipe-laying vessels, many scholars have carried out model tests on the hydrodynamic responses of ship models with different proportions under the influence of wind, wave, and current coupling to study the operation of pipe-laying vessels. Traditional tank model tests can test and study ship displacement, acceleration, the amplitude response operator (RAO), additional mass, and other data. The tremendous increase in modern computer computing power has enabled researchers in the field of wave energy to simulate various sea conditions and study the operation of laying vessels [7,8,9]. However, a small error will cause considerable errors in model building, instrument measurement, and environmental load simulation.
The study of deep-sea pipeline-laying systems also requires dynamic analysis of pipelines in laying. M. Pulici [10] analyzed the bending moment distribution of the pipeline during the laying process by using the finite element model according to the pipe-laying project in the Black Sea. M. Szczotka [11] established a rigid finite element model for the pipeline mechanics in the process of pipeline laying and studied the influence of the horizontal distance between the pipeline bottom contact point and the ship and the movement with the pipeline on the tension of laying equipment. Shan [12] established a mathematical model through the concentrated mass method to analyze the dynamic tension and failure load of the cable. In order to analyze the influence of riser platform on pipe laying, Santillan [13] established the balance equation of flexible pipe from the perspective of vibration sensitivity of flexible pipe, obtained the relationship between riser buoyancy and riser axial force through analysis and solution, and verified the conclusion through experiments. Xing-sen Guo [14] has conducted an in-depth exploration of pipes with honeycomb holes. Hui Liang [15] established a fine finite element model considering the complex surface contact behavior of the curve section under the framework of ABAQUS. Zan [16] proposed a coupled time-domain numerical model to study the influence of coupled dynamic response. The coupling model considers the motion of the pipe-laying ship, surface wave, ocean current, wind force, pipeline dynamics, and the contact between the roller and the pipeline. Proportional, integral, and differential (PID) controllers are used to simulate the control of pipe-laying ships. Wang Liquan [17] simulated the 352.42 mm outer diameter flexible pipeline laid on the 3000 m deep-sea bed by using Orca flex software under specific sea conditions and studied the dynamic characteristics of axial tension, bending moment, stress, and strain during pipeline laying.
The scaled model test can provide data to guide the modification and implementation of the design plan of the lay-up system. During the test, we will understand the various phenomena and rules in the structure more intuitively. The mechanical properties of the pipeline-laying process are investigated using a scaled-down model of the submarine pipeline-laying system and experimental conditions that simulate the loads of the marine environment. From the overall scheme of the flexible pipe-laying system, the forces during the flexible pipe-laying process are studied, a scale model is established using the similarity principle, a scale model of the laying tower is established using the similarity principle, and indoor tests are conducted on the dangerous area of the tower during the laying of the pipeline through model tests to verify the safety of the laying tower.

2. Similarity Theory and Scaled Model of Flexible Pipeline-Laying System

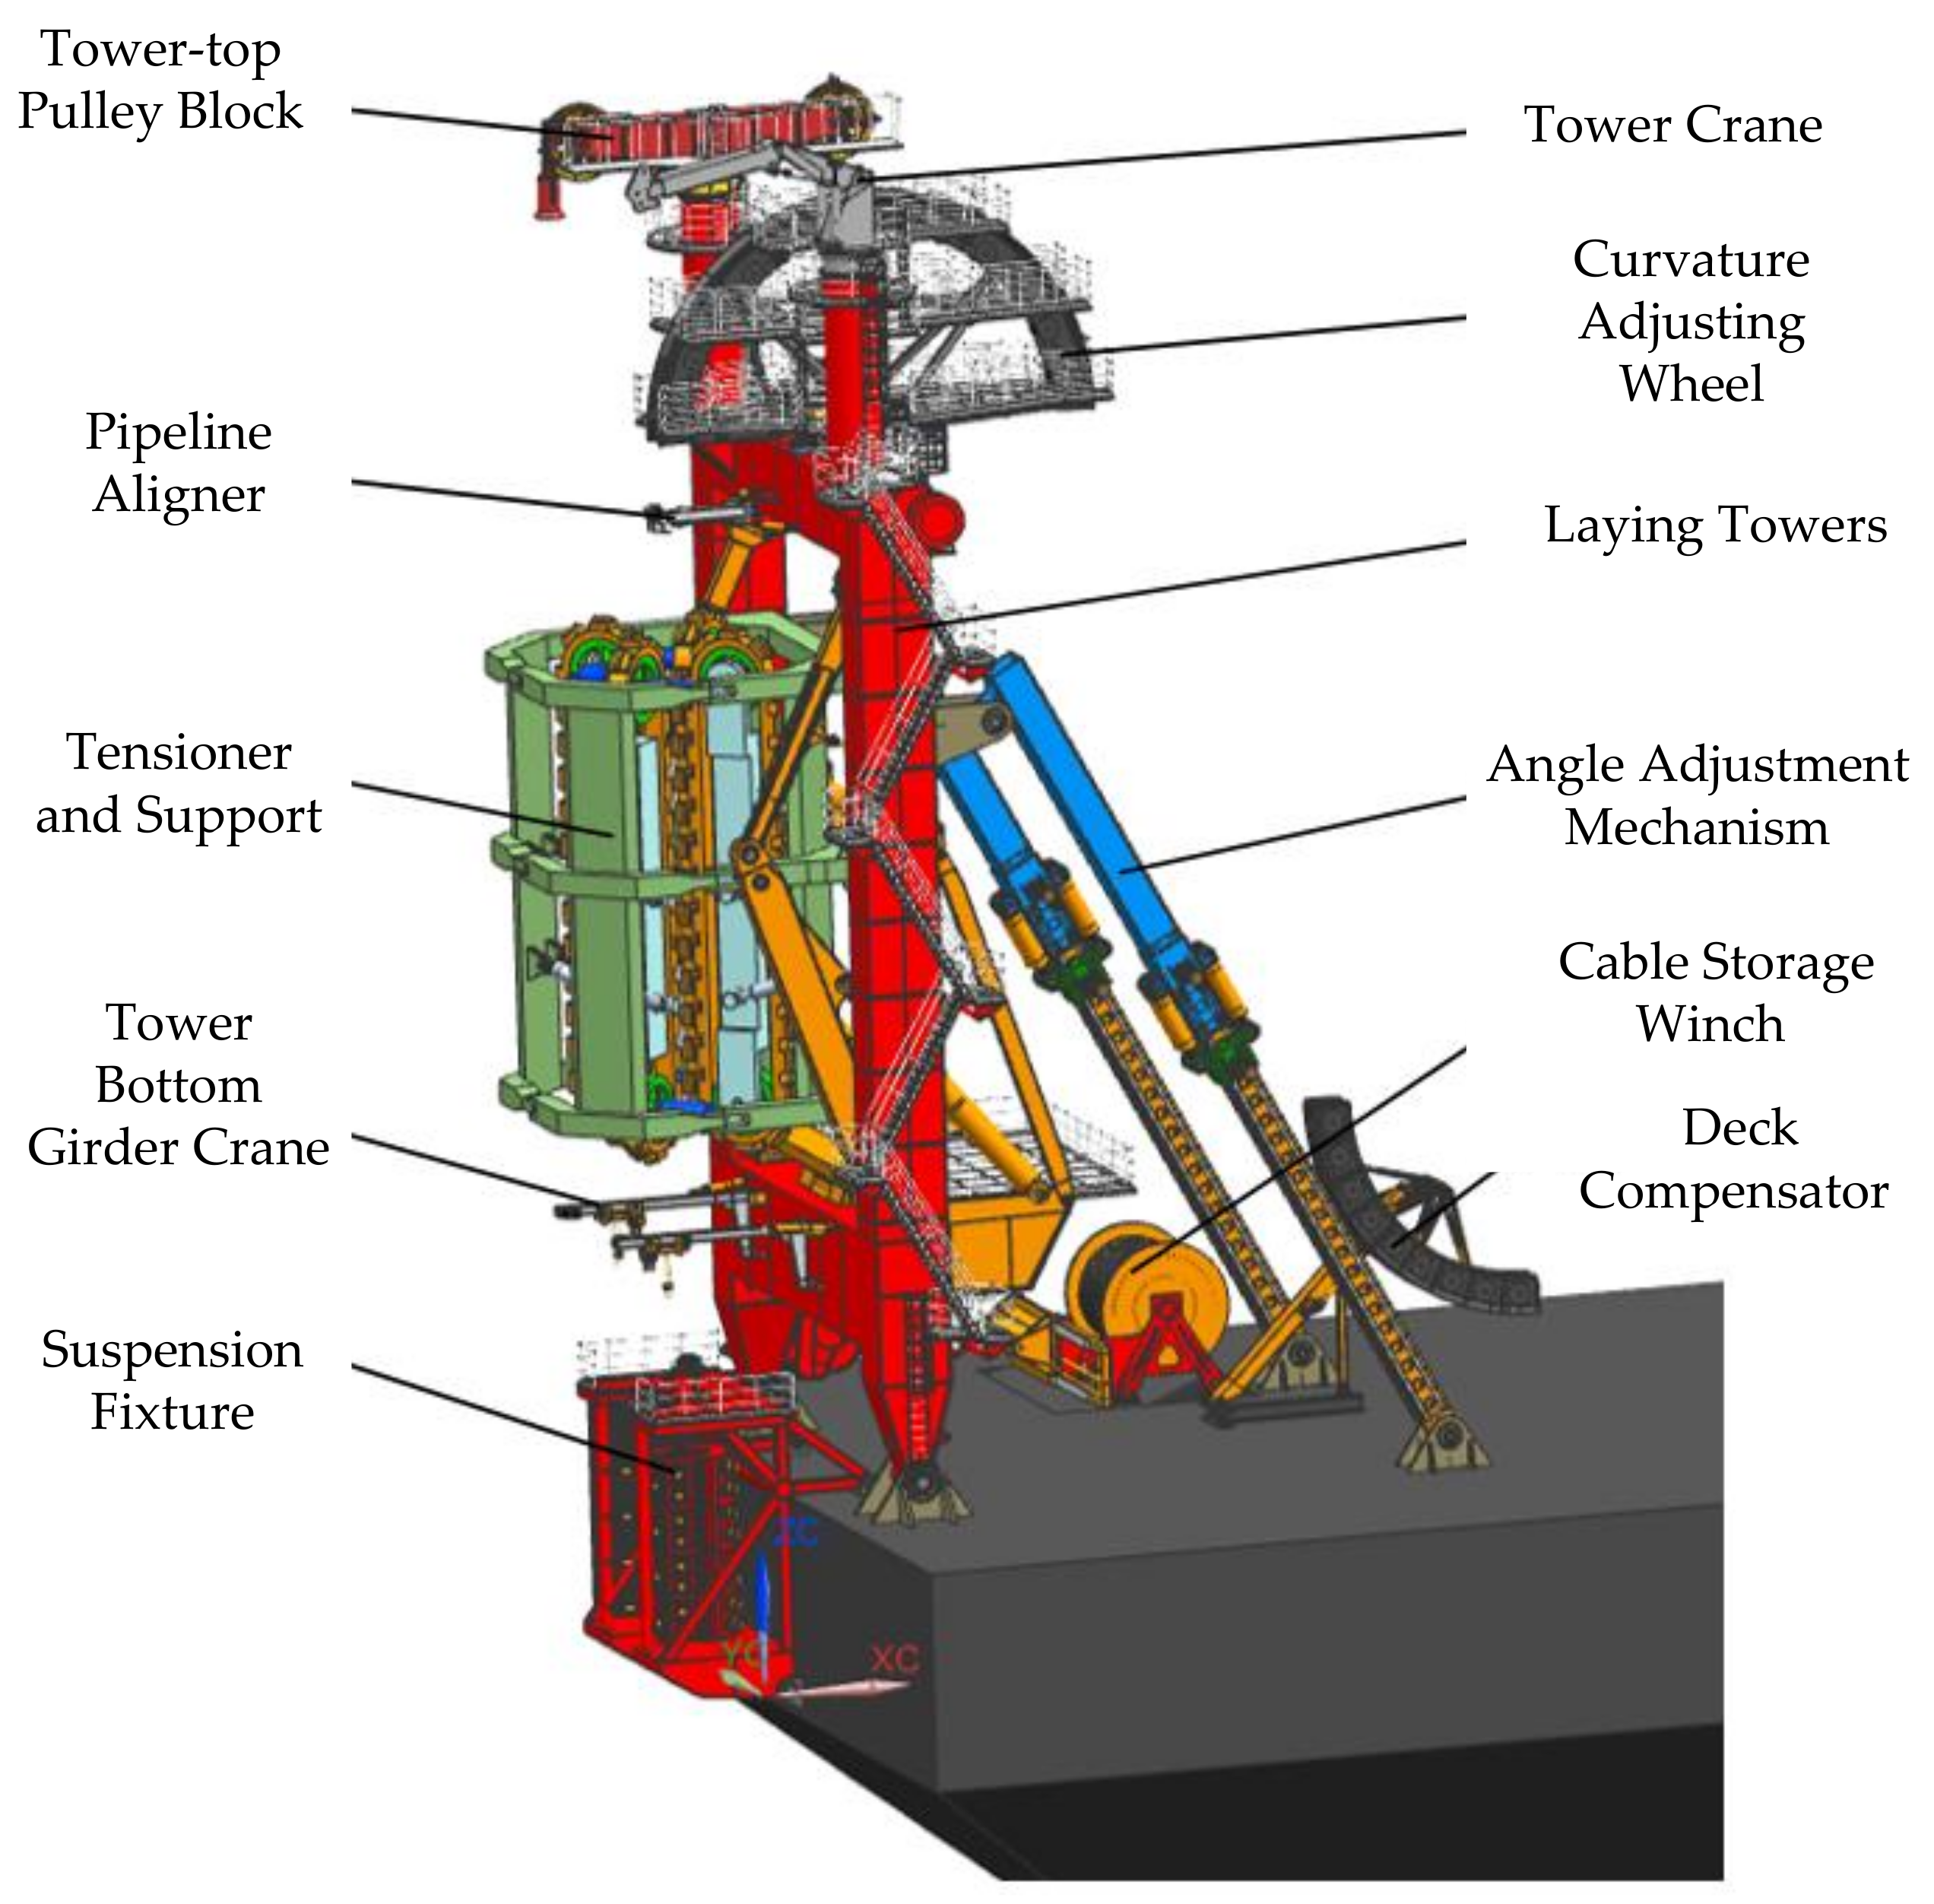
The submarine flexible pipe-laying system is a complex system that includes multiple pieces of equipment working in coordination. The pipes are laid together on the submarine through the cooperation of various subsystems. The paving system mainly consists of tensioners and their supports, curvature adjusting wheels, angle adjusting mechanism, paving tower, and other equipment. The tower mechanism is the main supporting part of the paving system. The tensioner and its bracket, curvature adjusting wheel, pulley set, and other components are fixed on the tower mechanism by welding or bolting. The laying system completes pipe laying by coordinating and working together of various equipment components [18]. The overall structure of the flexible pipeline-laying system is shown in Figure 1.

2.1. Ambient Load of Paving System and Ship Motion Response

The laying of subsea pipelines requires collaboration between laying tower system mechanisms. Since it is difficult to predict the marine loads that the laying vessel will be subjected to, analysis of the dynamic characteristics of the pipeline is a prerequisite to ensure that the strength of the designed laying system meets the requirements. In order to carry out this study, data on the marine environmental loads on the laying system and the motion response of the laying vessel under that load are required. When laying pipe, the laying vessel is combined with the flexible pipe for laying pipe, creating a coupling effect. Considering the interaction between the marine load and the motion of the laying vessel, coupling analysis is an effective method to analyze the deep-water flexible pipe-laying process, which allows dynamic analysis of both the vessel and the flexible pipe.

2.1.1. Environmental Load of Paving System

Wind loads on marine structures can generally be calculated by empirical formulas derived from wind tunnel tests on hull models. In this paper, the wind loads of pipe-laying vessels are calculated according to the empirical formulas of wind loads provided by the Oil Companies International Marine Forum (OCIMF) [19].
Current loads can generally be considered as steady-state planar flows, producing only drag forces on the hull. In order to analyze the force of ocean current on the hull, Equation (1) needs to be used to calculate the superposition of horizontal velocity and wave particle velocity.
F XC = 0.5 dC XC ( φ cR ) ρ c V cR 2 L BP F YC = 0.5 dC YC ( φ cR ) ρ c V cR 2 L BP M XYC = 0.5 dC XYC ( φ cR ) ρ c V cR 2 L BP 2
where φcR is the relative angle, ρc is the density of the seawater in units kg/m3. FXC, FYC, and MXYC are X-direction, Y-direction, and moment of flow around the vertical axis of the ship, respectively. d is the average draft depth of the ship, unit m. vc is the current velocity per m/s, which varies with the depth of the seawater. VCR is the relative velocity of the ship and the current; LBP is the vessel vertical length. CXC, CYC, and CXYC are the drag force coefficients. Their values depend on the relationship between the current and the ship, which can also be found from the map data.
Irregular waves are used for the calculation of wave loads. The wave elements are random variables and are usually expressed in terms of their statistical characteristics. According to the principle of linear waves, irregular waves are superimposed by waves with different heights, frequencies, and random phases, which can be defined by energy spectrum. The spectrum selected in this paper is the JONSWAP wave [20]. JONSWAP spectrum is obtained by Adelman through a large number of data taken in the North Sea. The expression is Equation (2):
S ς ω = α g 2 ω p 4 ω 5 exp 1.25 ω p ω 4 γ exp ( ω ω p ) 2 2 ( σ ω p ) 2
where α is the generalized Philips coefficient, α = 0.0076(gx/U2)−0.22. ωp is the peak frequency of the spectrum, ωp = 22(g/U)(gx/U2)−0.33; σ is the peak parameter, σ = 0.07 when ω < ωp; When ω > ωp, σ = 0.09. γ is the peak enhancement factor with an average value of 3.3. U is the average wind speed, and x is the length of the wind zone. Sζ(ω) is a function of the energy density of waves. The expression of wave surface height and time of irregular waves is Equation (3).
η t = n 1 N 2 S ( ω i ) Δ ω cos k n x ω n t ε n
where N represents the number of regular waves and Δω is the interval frequency.
The first-order wave force and the second-order wave force are solved by deriving the transformation and Fourier transformation. The first-order wave force and the second-order wave force can be solved by Equation (4) and Equation (5) respectively.
F w a v e ( 1 ) ( t ) = n 1 N 1 2 π t h ( τ ) ζ n cos [ ω n ( t τ + ε n ) ] d τ = n 1 N ζ n f w i ( ω ) cos ( ω n t + ε n + φ n )
F w a v e ( 2 ) ( t ) = n 1 N m 1 M ( 1 2 π ) 2 t t g ( τ m , τ n ) ζ m ( t τ 1 ) ζ n ( t τ 2 ) d τ 1 τ 2 = n 1 N m 1 M ζ m ζ n Q T F + ( ω m , ω n ) cos [ ω m + ω n ] + ζ m ζ n Q T F ( ω m , ω n ) cos [ ω m ω n ]

2.1.2. Research on Mechanical Model of Flexible Pipe

In the analysis of the laying process of flexible deep-sea pipelines, the following four assumptions are required: a. It is assumed that the working ship is stationary when laying the pipeline. b. Current is linear based on the distribution on the longitudinal section of the hull, with zero submarine velocity and maximum surface velocity. c. Integral flexible pipes are laid on the mid-longitudinal plane of the ship. d. Because of the large depth of water laid, the flexible piping can be considered, and the influence of bending rigidity of flexible piping can be ignored.
After laying the pipeline for a period of time, the flexible pipeline in the ocean taken on the form of a catenary, as shown in Figure 2. The point at which the pipeline passes through the sea level is regarded as origin O, the x axis as horizontal direction, the y axis as vertical downward direction, the pipeline from contact bottom to O point at sea level as suspension section, and the bottom contact section on the seabed. When analyzing the suspension section, first intercept the microelement of the dl length of the previous section and analyze its stress, as shown in Figure 2.
Fn and Fτ are used to calculate the ocean load per unit length. τ represents the drag force of the unit pipeline in the ocean by the current in the normal and tangential directions. It can be obtained by Morison’s semi-empirical Equation (6).
F n = 0.5 × ρ W × C n × D 1 × ( v × sin θ ) 2 F τ = 0.5 × ρ W × C τ × D 1 × ( v × cos θ ) 2
where Cn and Cτ are the normal and tangential drag force coefficients, respectively; v represents the current velocity in the horizontal plane where the pipeline unit is located; θ represents the included angle between the pipe unit and the horizontal direction.
The coordinate axis is established according to the shape of the pipeline. The intersection point between the pipeline and horizontal plane is the origin. The complete pipeline is considered to be composed of a large number of micro-elements. Each microelement is dy in the y-direction length. If the depth of seawater is h, the total microelement segment is m = h/dy. For any pipe element i in the suspension section, the parameters can be calculated by Equation (7), and the parameters at point i + 1 can be calculated by the parameters at point i of the pipeline.
w δ l i = 0.25 ( ρ p D 2 2 ρ W D 1 2 ) g δ l i n ! r ! n r ! F n i = 0.5 ρ W C n D 1 ( v sin θ i ) 2 F τ = 0.5 ρ W C τ D 1 ( v cos θ i ) 2
Based on the above analysis, the position parameters, tension at each point, line coordinate parameters, and total length of the pipeline can be calculated by computer programming, which can be used as basic parameters for dynamic simulation of pipeline laying. The linearity of pipe laying and the variation of internal force of pipe are calculated by setting the angle, maximum depth, and shape parameters of pipe laying. Several different pipelines are selected for the study, and the parameters are given in Appendix A.

2.1.3. Research on Dynamic Performance of Pipe-Laying Ship

The ship can be considered as a rigid body when studying its motion in waves. The wave forces acting on the ship are usually solved from two aspects: diffraction and radiation. The motion of the ship is neglected in the calculation of the diffraction method, while the radiation method is mainly used to calculate the influence of the hydrodynamic coefficient on the motion of the ship [21]. In this paper, the AQWA sub-module of ANSYS is used to analyze the hydrodynamic performance of pipeline-laying ships. Through the frequency domain, hydrodynamic analysis of the ship by AQWA, the hydrostatic stiffness matrix, hull additional mass, hull damping coefficient, first-order wave force, and second-order wave load of the ship can be obtained [22].
HYSY201 is a pipeline laying vessel of China National Offshore Oil Corporation (CNOOC). Based on the size parameters of HYSY201, the model of pipeline laying vessel is established. The size parameters and physical characteristics of the selected laying vessel are shown in Appendix B. The parameters provided by the ship’s profile drawing are imported into the DM module of ANSYS to complete the drawing of the ship’s geometric surface by the generated surface, and finally, the ship’s surface model is established. Then the hydrodynamic model can be obtained by meshing the underwater wet surface of the ship with plate units in ANSYS-AQWA, as shown in Figure 3.
When laying pipelines at sea, the inherent frequency of the hull should avoid the peak frequency of the spectrum under the working sea condition to avoid hull resonance. RAO is used to describe the motion response of a floating structure under incident waves of unit amplitude [23,24]. The definition of RAO is as Equation (8).
R A O ( ω ) = ζ ( ω ) / ζ
where ζ(ω) is the response of the hull to waves of a certain frequency and ζ is the amplitude of the corresponding frequency wave.

2.1.4. Time-Domain Coupled Motion Equation

During the laying of flexible pipes, the ship motion is the result of the dynamic coupling between the marine environment and flexible pipes. Based on Newton’s second law, the time-domain coupled motion equation of the ship can be obtained. The relationship between the ship motion and time in waves can be obtained by solving Equation (9).
[ M + μ ] X ¨ ( t ) + t [ K ( τ ) X ˙ ( t τ ) ] d τ + C X ( t ) = F W A ( t ) + F W I ( t ) + F C U ( t ) + F P ( t )
where M and μ represent the mass matrix and additional mass matrix of the system, respectively, X(t) represents the displacement matrix of ship motion, and t represents time. FWA represents the excitation load caused by waves, FWI represents the drag force of the wind, FCU represents the drag force of ocean current, and FP represents the load on the hull caused by the tension generated by laying pipelines. When solving Equation (9), the method of step-by-step integration can be adopted in the time domain. The displacement, velocity, and acceleration of a particle in space can be obtained by the step-by-step integration method over time; thus, the force variation with time can be calculated. The Newmark-β method can be used to carry out the integration solution.

2.2. Similarity Principle and Derivation of Similar Norms

When testing a designed structure, the prototype design is usually uneconomical and difficult to meet the requirements of the experiment. Therefore, we usually choose a sample similar to the original sample for the experiment. This is called a model experiment. When the scaled model is similar to the prototype, it must be geometrically similar to the prototype and similar in strength [25]. Since the model is designed in a four-level sea environment, the deformation errors caused by the environment on the prototype and the model can be neglected [26].
When the prototype and model of flexible pipe-laying system are subjected to corresponding loads, the geometrical and static effects of the variables that can be compared with each other are size l, external force F, external moment M, elastic modulus E, strain ε, density ρ, and stress σ. According to these variables, the corresponding relationship between prototype and model can be obtained. The relationship between the main physical parameters can be expressed as Equation (10).
f ( F , M , E , ρ , l , ε , σ )
For general elastic questions, the characteristics of introducing physical constants are analyzed, and three basic force scales are adopted, namely mass m, length L, and time T. Each variable can be expressed in units of the basic dimension, whose dimension matrix is as Equation (11).
F M E ρ l ε σ m L T 1 1 1 1 0 0 1 1 0 1 3 1 0 1 2 0 2 0 0 0 2
Represent physical parameters from F, M, E, ρ, l, ε, σ with a1, a2, a3, a4, a5, a6, a7, respectively. Equation (12) can be simplified by Equation (11).
m : a 1 + a 2 + a 3 + a 4 + a 7 = 0 L : a 1 a 3 3 a 4 + a 5 a 7 = 0 T : 2 a 1 2 a 3 2 a 7 = 0
Equation (13) can be obtained by using a3, a4, a5 as independent variables.
a 3 = a 1 a 7 a 4 = a 2 a 5 = 2 a 1 3 a 2
Equation (13) is a statically indeterminate equation with several parameters, including three basic dimensions. The number of independent π can be known by the π Theorem to be four (7 − 3 = 4). The Similarly π Theorem is the Similarly Second Theorem expressed as if a phenomenon can be described by Equation (14).
D l ( x 1 , x 2 , , x k , x k + 1 , x n ) = 0
The equation includes a total of n physical quantities. If K physical quantities have independent dimensions, the dimension of the last nk physical quantities can be derived from the previous independent dimensions. By means of transformation, the above formula can be transformed into a functional relation between similar criteria π1, π2,… πn−k, that is, Equation (15).
F l ( π 1 , π 2 , π n K ) = 0
Therefore, Equation (13) can be rewritten as Equation (16).
f ( π 1 , π 2 , π 3 , π 4 ) = 0
Then the similarity matrix containing each variable can be obtained as Equation (17).
a 1 a 2 a 3 a 4 a 5 a 6 a 7 F M E ρ l ε σ π 1 ( a 1 ) π 2 ( a 2 ) π 3 ( a 6 ) π 4 ( a 7 ) 1 0 1 0 2 0 0 0 1 0 1 3 0 0 0 0 0 0 0 1 0 0 0 1 0 0 0 1
Then the scale of model scale meets the requirements as Equation (18).
C F = C E C l 2 C M = C ρ C l 3 C ε = 1 C σ = C E
In the design and manufacture of actual models, the model size and material must be selected according to the site of the required experiments. Therefore, the similar constants of geometric size, elastic modulus, and material density (Cl, CE, Cρ) can be determined, and the remaining similar constants can be calculated from these constants. The scaled model uses a scale of 1:20 according to the laboratory conditions. The material used in the prototype is S690QL high-strength welded structural steel. The material of the model is Q235 steel. The calculated modulus of elasticity has a similar ratio of 0.996, and the similarity ratio of density is 0.999. The similarity relationship and similarity of the model are shown in Table 1.
To determine the similarity constants of wave loads, the gravity similarity of fluid flow phenomena needs to be considered, and the Froude number is selected as the similarity criterion [27]. If the fluid is subjected to a mass force of gravity only, the Froude number (Fr) of the model can be expressed as Equation (19).
F r m = F i F g = ρ l 2 v 2 ρ g l 2 = v m g m l m
where the parameters with angle label m represent the parameters of the model, and those with angle label p represent the parameters of the prototype. g represents the acceleration of gravity, l represents the length, ρ represents the density of the fluid, v represents the velocity of fluid flow, and Fi and Fg represent inertial force and gravity, respectively. From the similarity criteria of the model and the prototype, Frm = Frp, and the gravity is constant, gm = gp, we can get Equation (20).
v m v p = l m l p
It can be derived that, for time t, there is Equation (21).
t m t p = l m l p
Therefore, the period and amplitude of the motion response of the ship to wave load can be reduced in proportion to time and length to obtain the required motion environment for the model.

2.3. Scaled Model of Flexible Pipeline-Laying System

In the scaled model experiment, the following main considerations are taken into account: to realize the angle adjustment function when laying the hose, to withstand the maximum load, as well as the strength and stability. Considering the difficulty of processing and the requirement of cost, the scale structure is the main body of the tower, the tensioner support, the angle adjustment mechanism, and the curvature adjustment wheel. The remaining structures can be omitted. The final experimental model of the paving tower is shown in Figure 4. The model has the functions of adjusting the angle of the paving tower, adjusting the working and resting positions of the tensioner, and adjusting the working position of the curvature adjusting wheel.

3. Similarity Verification of Experimental Scaled Model

In the model experiment, whether the dynamic characteristics of the model tower and the structural strength have enough similarity with the prototype are very important to the reliability of the prototype-related properties of the experimental model. We could simulate and compare the scaled model with the prototype to verify the similarity of the experimental scaling model [28].

3.1. Operating Parameters

The flexible laying operation shall be able to be carried out under level IV sea conditions. Therefore, the marine environment analyzed by the submarine pipeline-laying system is set as level IV sea conditions. In addition, the flexible pipeline will be subject to the reaction from the seabed, which is linearly related to the depth of the pipeline sinking into the seabed [29]. Therefore, the setting of marine environment parameters is shown in Table 2. HYSY201 is mainly used for S-type pipe-laying operations. It can also be used for post-flex-lay task modification [30]. HYSY201 is taken as the mother ship for analysis, and the ship parameters are shown in Table 3. The speed of the ship is not considered in this analysis, and the default speed is 0.

3.2. Dynamic Similarity Simulation Verification of Scaled Model

For the relatively heavy pulley groups on the top of the tower and the crane on the top of the tower, the equivalent forces applied at the corresponding positions and their sizes are shown in Table 4 in the form of concentrated loads. The support of the tensioner bears the tensioner and the pipeline it holds. Therefore, in the contraction model, the load on the support of the tensioner is the combined force of the tensioner gravity and the pipeline tension.
When laying a flexible pipeline, the laying process can be divided into three main stages: pipeline-laying preparation stage, pipeline-laying stage, and pipeline stopping laying stage. In order to ensure the rigor and accuracy of the experimental model, when verifying the mechanical similarity of the pipeline-laying system, it is necessary to verify the dynamic similarity of the pipeline-laying process, the tensioner support lifting process, and the angle adjustment mechanism adjustment process, respectively.

3.2.1. Similarity Verification of Dynamic Characteristics During Piping Laying

Figure 5 is a scaled model of the constrained completion in Adams for pipeline laying. Among them, the curvature adjusting wheel, top pulley group, and top crane all use mass points to simulate the actual mass, which is fixed on top of the tower by ball joints. When the pipeline is laid, the tensioner is in working position, and the driving function of the sliding pair where the upper connecting rod is located is set to 0*time, then the length of the upper connecting rod is locked, which can calculate the force of each articulated point of the tower in the pipeline laying under the motion response of the reduced hull.
In order to simulate the motion response of a pipe-laying ship to wave loads on the sea surface, the multi-degree-of-freedom driving mode in Adams can be used to drive the ship motion in the center of the ship. The time history curves of each degree of freedom motion of the scaled ship can be imported into the model in the form of spline data, and a spline function is added to the drive so that the platform can simulate the motion response of the ship. Through simulation, the force comparison diagram between the tower and deck articulation when laying pipe can be obtained as shown in Figure 6; the force comparison diagram between the tower and the support component under the tensioner support, as shown in Figure 7; the force comparison diagram between the tower and the upper connecting rod articulation of the tensioner support, as shown in Figure 8; the force comparison diagram between the tower and the angle adjustment mechanism, as shown in Figure 9.
From Figure 5, it can be seen that the force changes of prototype and scale model at the articulation of tower and deck are basically the same, and the change range of the whole around the average value is −7.1~10.7%. In the scale model, the average force at the articulation is 12,098 N, while in the similar transformed prototype, it is 12,089 N, with a gap of 0.07%. The articulation at the bottom of the tower is mainly subjected to vertical force, while the force in other directions is very small. In Figure 6, the average force at the articulation of the support components under the tower and tensioner bracket in the scale model is 6293 N and 6292 N in the similar transformed prototype. The difference between the two averages is very small; however, the range of variation around the average value of the scale model is −7.1~10.7%, and that around the average value of the prototype is −6.7~8.4%. As shown in Figure 7, the average force at this articulation in the scaled model is 3041N and 3363N in the similar transformed prototype. The force at the connection of the tensioner support and tower is slightly different from that in the scale model, but the force variation is generally the same.
From Figure 9, it can be seen that the stress changes of the prototype after similar transformation at this articulation are highly consistent with those of the scale model.
Figure 10 is a comparison between the pipe tension conversion simulated by Adams and the results obtained by the Orca flex simulation method in Wang Liquan’s article. Both are simulated with the size of the prototype. The difference is that the pipe is not modeled in Adams, but the equivalent mass of the static tension of the pipe is added to the tensioner. The simulation result is obtained by removing the influence of the self-weight of the tensioner from the stress at the connection point between the tensioner and the tensioner support. As can be seen from the figure, the pipeline tension is 3.83 × 10⁶. The changes of the two are very similar. The simulation results in Adams are relatively greater, about 20%, which is caused by the lack of elastic force binding of the pipeline.
The scaled model has a high consistency with the model at the stress point of the tower. Comparing the results of Adams simulation with those of Orca flex simulation, it can be seen that the simulation results of Adams and Orca flex are basically the same, so the simulation results of Adams are credible. Therefore, it is feasible to derive the mechanical characteristics of the prototype from the mechanical characteristics of the scaled model.

3.2.2. Verification of Similarity of Dynamic Characteristics When Tensioner Support Is Raised

When the tensioner is not working, it is located inside the tower. When the tensioner is required to provide tension for the pipeline during pipeline laying, the tensioner support can be raised through the expansion and contraction of the hydraulic cylinder to move the tensioner to the outside of the tower so as to facilitate the tensioner to work. Through the simulation, the stress change of the tensioner support in the process of tensioner position adjustment under the influence of waves can be obtained.
From Figure 11, it can be seen that the force changes of the prototype after a similar transformation at this articulation are in suitable agreement with those of the scale model, which is subjected to less force than the transformed prototype by about 5%. The maximum force on the hydraulic cylinder occurs when it is just started. When the hydraulic cylinder is extended for a period of time, the tensioner reaches the critical position in the middle, at which time the hydraulic cylinder is subjected to a thrust of 0. Thereafter, the tensioner crosses the critical position and enters the working position, and the hydraulic cylinder will be subjected to tension, which will gradually increase from 0.
From Figure 12, it can be seen that the force at the articulation of the lower connecting rod of the tensioner support and the tower increases gradually in the tensioner position adjustment, and the force changes of the prototype and the scale model after the similar transformation are basically the same in this position.

3.2.3. Similarity Verification of Dynamic Characteristics in Angle Adjustment Mechanism Adjustment

When the flexible pipeline-laying tower system is ready to lay pipes, the angle adjusting mechanism will extend upwards, pushing the entire laying tower to be adjusted slowly from the 50° tilt state when it is not working to the 90° vertical state when it is working. During this process, the equipment loaded on the tower, such as tensioners, curvature adjusting pulleys, pulley groups on the top of the tower, will be adjusted from the tilt state to the vertical working state with the tower.
According to Figure 13 and Figure 14, it can be seen that the force at the articulation point of the tower and deck will fluctuate and increase as the tower goes from inclined state to vertical state. When the tower is vertical, the force at this point reaches a maximum value. The force at the articulated joint of the tower and the angle adjustment mechanism decreases gradually with the adjustment of the tower angle. At the initial position of the tower adjustment, the force of the angle adjustment mechanism is the largest. Therefore, the scale model is basically consistent with the original stress at these two places.
From Figure 15, it can be seen that the force at this point decreases first and then increases when the tower is vertical while the tower is adjusted from 50° tilt to 90° vertical. According to Figure 16, the upper connecting rod of the tensioner support has the greatest force at the beginning of the adjustment of the tower. It is also known from the 3D model that the upper connecting rod is under vertical tension and bears most of the load of the tensioner’s dead weight; then, with the position of the tensioner adjusted, the tension of the upper connecting rod decreases. However, the tension on the supporting parts under the tensioner support decreases first and then increases gradually to the maximum load.
By comparing the force condition of the relative joints of the tower scale model with that of the prototype after similar transformation, it can be seen that the force variation of the scale model and the prototype at the articulated joints of the tower is similar when the pipeline is laid, the tensioner support is raised, and the angle of the tower is adjusted, but the force fluctuation in the prototype is slightly larger, and these fluctuations are within a small range. In general, under the similar criteria deduced above, the scaled model and the prototype satisfy the dynamic similarity.

3.3. Structural Strength Similarity Verification of Scale Model

According to the stress state of each structure in each working state of the tower, the finite element analysis of each component of the tower can be carried out to check the stress and strain of each component. The maximum stress point of each component of the tower can predict the structural dangerous area during the laying of the tower. Therefore, the scale model and prototype of the tower can be finite elements analyzed separately in the stress analysis of the previous section. The comparative analysis is used to verify the similarity of the structural strength of the tower scale model. The force of each tower structure in each state is shown in Appendix C.
According to the load on the tower, the finite element analysis of the tower is carried out in ANSYS workbench. The material properties of the scale model are the same as those of Q235 steel. The prototype material is S690QL, and its yield strength, density, elastic modulus, and other parameters need to be set. In order to ensure the sufficient safety of the designed structure, the safety factor needs to be determined by the loading condition. Since the selected force is the maximum dynamic load and the impact condition is considered, the safety factor is 1.5.
It can be seen from Figure 17 that the maximum stress of the tower during pipe laying occurs at the connection position between the upper connecting rod and the tower. The maximum stress of the scale model σmax1 = 228.5 MPa is σmax2 = 218.1 MPa in the prototype, and the maximum stress of the scale model is about 5% larger than that of the prototype.
For the angle adjustment mechanism, the maximum force is the starting time of the angle adjustment mechanism when the tower adjusts the angle. It can be seen from the three-dimensional model that the tower is in a 50° inclined state at this time, while the support rod of the angle adjustment mechanism is close to the vertical state and bears most of the gravity of the paved tower. Through finite element analysis in workbench, the stress of the scaled model and prototype two support rods can be obtained, respectively, and the results are shown in Figure 18. The max. stress of the angle adjustment mechanism is located at the articulation between the large support rod and the tower. The max. stress of the scale model is σmax1 = 141.1 MPa, and that of the prototype is σmax2 = 127.3 MPa. The max. stress of the scale model is about 11% larger than that of the prototype.
Similarly, the components of the tensioner support can be analyzed by the finite element method, as shown in Figure 19 and Figure 20, respectively. It can be seen that the maximum stress of the upper connecting rod of the tensioner support in the scale model and in the model occurs at the pinhole of the upper connecting rod. The maximum stress of the scale model σmax1 = 129.3 MPa, and the maximum stress of the prototype σmax2 = 112.3 MPa, respectively. The maximum stress of the lower connecting rod of the tensioner support is about 15% larger than that of the prototype. The maximum stress of the lower connecting rod of the tensioner support is located at the articulation between the tensioner and the lower connecting rod. The maximum stress of the contraction model σmax1 = 124.1 MPa, the maximum stress of the prototype σmax2 = 116.96 MPa, and the maximum stress of the contraction model is about 7% larger than that of the prototype.
By comparing the stress distribution of each component of the tower scale model under the maximum stress condition with that of the original one, it can be seen that the maximum stress of each component of the scale model is basically the same as that of the original one when the pipeline is laid, the tensioner support is raised, and the angle of the tower is adjusted, with an average difference of about 9.5%. According to the deduction of model similarity criteria, σmp = 1, the simulation results are slightly deviated, which is mainly caused by the modification in accordance with the actual processing in order to make the small structure of the scaled model possible to be manufactured. In general, according to the derived similarity criteria, the scale model and the prototype satisfy the similarity between physical quantities, which means that the mechanical characteristics and structural strength of the tower prototype can be estimated by the experimental data and dynamic similarity relationship of the scale model.
In this section, the similarity between the scale model and prototype is verified. The similarity between scale model and prototype is verified mainly when the tower tension machine support is raised during pipe laying and when the angle adjustment mechanism is adjusted. The stress similarity between the scale model and prototype is also verified. The result shows that the scale model and prototype satisfy the given similar relationship.

4. Experiments and Analysis of Scale Model of Paved Tower

The tower of flexible pipeline-laying system is the platform for the working of each mechanism of the bearing laying system. Besides theoretical deduction, it is necessary to carry out relevant experimental research on the bearing capacity of the tower in harsh sea conditions. The purpose of the experiment is to verify the safety of the tower when laying pipes by comparing the experimental results of the scale model with the theoretical values of the simulation.

4.1. Experimental Principles

When carrying out relevant experiments, traditional pool tests can not satisfy the test conditions for flexible piping laying in deep water due to the limitation of the test site. In order to carry out the experiments under the laying conditions of 2000 m water depth, when the scale experiments are carried out at the ratio of 1:20, the models need to be used. The depth of the model pond is 100 m. The current experimental pond of marine engineering cannot meet this requirement [31]. According to actual needs, this paper carries out the method of structural mixing model experiment, combining the results of computer simulation with the experiments of scaling mechanics. The pipeline-laying system is divided into the main hull structure and paving tower. The maximum tensile force of flexible pipe under different sea conditions is calculated and simulated as the load of tensioner support in the experiment. Due to the limitation of the laboratory site, the length of the pipe cannot be simulated completely so that the equivalent truncation treatment can be applied to the pipe. The treatment is to replace the tension generated by the pipe with the same size and direction at the clamping point of the tensioner to the pipe. During the process of simulating vertical laying, the simulated tension is maintained in a vertical downward state. Thus, a flexible pipe laying system is established.

4.2. Experimental Device

The main object of the experiment is the scaled paving tower, whose structure has been simplified. The whole experimental system includes according to the scale of 1:20, the overall size is about 0.78 × 0.8 × 1.86 (m), which is installed on the working platform. The model is shown in Figure 21a and the object is shown in Figure 21b. In the experiments of the scale model, the maximum load on the tower is simulated by the tension force applied by the hand hoist. The hand-pull hoist is connected in series with an S-type tension sensor at the connection to the worktable, which can be used to measure the applied tension. The test mainly detects the stress of each key point when the tower bears the maximum dynamic load under various working conditions.

4.3. Experimental Contents

The experiment is mainly carried out for the state of the tower in pipeline laying. The experimental pipeline-laying angle is 90°, and the axial tension generated by the pipeline is the tension generated by laying 10-inch pipeline in 3000 m water depth. For the sea conditions encountered during the laying process, the parameters, shown in Table 5, are selected, and the motion response parameters of the laying barges under the sea conditions parameters can be obtained by simulation in Section 2. The motion parameters of the hull are scaled and used for dynamic simulation of the scaled model to determine the maximum tension required for the scaled model tensioner support. By simulation, the max tensile load required for the tensioner support under each sea condition is shown in Table 6. The maximum load change with the sea condition is shown in Figure 22. Since the tensioner support is subjected to dynamic loads, which have a certain impact on the tower, 1.5 times the max dynamic loads under various sea conditions are used as the experimental loads.
According to the analysis of the stress of various components during the operation of the scaled tower in Section 3, the dangerous area with maximum stress can be selected for measurement in the model experiment. There are four measurement points for selection. Because the tower is symmetrical, the points at its symmetrical position will not be measured repeatedly. The positions of these four measuring points have been marked in Figure 23. Point 1 and point 2 are located on the mounting side of the tower and mainly used to detect the stress of laying system when the tower is raised. Point 3 and point 4 are located on the Laying side of the tower, which are mainly used to analyze the stress of the laying system during pipeline laying. According to the above analysis and statistics, the actual measurement point position and tower operation status are shown in Table 7. Because the position of each measuring point is at the maximum stress, the posture of the tower and its mechanisms is different. Therefore, during the actual measurement, it is also necessary to adjust the tower to the corresponding working state and then measure the stress at the relevant points.

4.4. Comparison of Test Results and Simulation Results

During the experiment, the tension of the hand-pulled hoist is adjusted to the maximum tension required by the model tensioner support under various sea conditions, and the stress of the paving tower during pipeline laying under different sea conditions can be simulated. The strength and safety of the tower can be verified by measuring the stress in the designated dangerous area of the tower. The results of sorting out the stress test data in the experiment are shown in Table 8, Table 9, Table 10 and Table 11.
It can be seen from the table that the stress at measuring point 1 is the maximum at 90° of wave direction angle. When the wave direction angle is between 0° and 90°, the stress increases with the increase in wave direction angle and decreases with the increase in wave direction angle from 90° to 180°. The stress changes take the form of symmetrical distribution, which is caused by the ship’s symmetry, which makes the waves at symmetrical angles have similar effects on the motion of the ship, while the pitching motion of the ship at 90° wave direction is the largest.
The measured results show that the trend of stress changes is similar to the simulated results. When the wave angle is 0°, the maximum measured stress is slightly larger than 180°, and the actual data is not completely symmetrical. The measured results are generally smaller than the theoretical values. When the wave angle is 90°, the maximum experimental stress deviates from the simulation by the largest margin of about 15%. The law of maximum stress variation with wave direction angle in the measuring area (measuring points 2, 3, and 4) of the remaining components of the tower is basically the same as that of measuring point 1. Overall, the peak stress values measured at different positions of the tower under several operating conditions are mostly smaller than the simulated values. However, the measured results have little deviation, and the maximum deviation does not exceed 18% of the calculated values. The safety strength of the tower can be adapted to the working load. When the wave angle changes from 0° to 180°, the maximum stress at the measuring point of the tower basically agrees with the simulation results. At the same time, the experimental platform of the flexible piping-laying system established in this experiment is an effective way to carry out piping-laying experiments.

5. Conclusions

In this paper, based on the similarity theory, the scaled model of the deep-sea flexible pipe-laying system is established under the coupling effect of sea state, laying vessel motion, and pipeline dynamics, the similarity of the scaling model of the tower is verified, and the scaling model test is carried out to verify the safety performance of the tower. The main work of this paper is as follows:
  • According to the working requirements of the deep-sea flexible pipe-laying system, the general situation of the laying system and the wind, wave, and current loads it is subjected to are introduced, and the hydrodynamic performance analysis method of the mother ship based on the AQWA module in ANSYS is presented. The similarity criterion is derived according to the similarity principle, and the scaled-down model is designed.
  • The scaled model of the paving system tower is designed, and the similarity verification of the scaled model of the tower is carried out. The dynamic characteristics of the experimental model and the structural strength similarity based on the finite element numerical simulation are verified from two aspects. The analysis results show that according to the derived scaled law, the scaled model is similar to the original one, and the scaled model is tested by the scaled model. Data and dynamic similarity relationships are valid to predict the mechanical properties and structural strength of the tower prototype.
  • Indoor model experiments were carried out on the dangerous area of the tower when laying pipes through model tests of structural mixing. This experimental method is an effective experimental mean to solve the difficulty in simulating boundary constraints of the laying system in deep-water laying. The change rule of stress in dangerous areas of the tower with sea conditions was analyzed through experiments, and the safety of laying the tower was verified.

Author Contributions

Author Contributions: Conceptualization, H.G. and T.Z.; Data curation, T.Z. and X.Y.; Formal analysis, T.Z. and X.Y.; Methodology, T.Z. and X.Y.; Project administration, H.G. and L.W.; Supervision, H.G. and L.W.; Validation, H.G., F.Y. and L.W.; Visualization, H.G. and F.Y.; Writing—original draft, T.Z.; Writing—review and editing, T.Z. and X.Y. All authors have read and agreed to the published version of the manuscript.

Funding

This research was supported by Heilongjiang Provincial Natural Science Foundation of China (E2018021); the Central University Foundation of China (3072020CFT0704); the National Natural Science Foundation of China (52001089); and Heilongjiang Provincial Natural Science Foundation of China (LH2021E046).

Institutional Review Board Statement

Not applicable.

Informed Consent Statement

Not applicable.

Data Availability Statement

The study did not report any data.

Acknowledgments

The authors gratefully acknowledge the financial support from Heilongjiang Provincial Natural Science Foundation of China (E2018021); the Central University Foundation of China, (3072020CFT0704); the National Natural Science Foundation of China (52001089); and Heilongjiang Provincial Natural Science Foundation of China (LH2021E046).

Conflicts of Interest

The authors declare no conflict of interest.

Appendix A

Table A1. Physical parameters of the flexible pipeline.
Pipe NumberInner DiameterExternal DiameterDensityMaximum Working Pressure
InchmmInchmmkg/m3MPa
G14101.67177.8461669.0
G26152.47.8195.5317813.8
G38203.210.2257306213.8
G41025413.88352.4447931.4
Table A2. Line type of pipeline laying for all sizes under 3000 m laying depth.
Pipe Number Laying Angle (°)Horizontal Distance (m)Total Length of Pipe (m)
G1702711.74286.6
G2702709.84284.7
G3702711.64287.0
G4702713.24287.9
G1752128.23909.6
G2752127.93908.4
G3752130.83910.9
G4752131.53911.3
G1801533.43573.8
G2801534.53574.1
G3801532.63573.9
G4801541.73574.6
G185902.53272.9
G285900.93271.8
G385903.73274.1
G485904.13275.4
G19031.03004.1
G29031.13003.2
G39031.43002.4
G49031.23003.2

Appendix B

Table A3. Basic dimension parameters of pipe-laying vessel.
Name of ParameterSymbolUnitNumerical Value
Shape widthBm41.62
Profile depthDm14.00
Structural drainageTMm11.00
Working drainageTAm 8.50
Weight of the whole shipMt34,850
Initial stability center highGMm8.20
Height of center of gravityVCGm13.60
Ship rolling inertia radiusKxxm14.15
Ship pitching inertia radiusKyym46.25
Ship yaw inertia radiusKzzm48.10

Appendix C

Table A4. Maximum force during piping laying.
Stress PositionForce DirectionPrototype (kN)Prototype Converted by Similarity (N)Scaled Model (N)
Hinge point between tower and deckX−532.8 −1332.0 −1345.5
Y−15.2 −38.1 −38.5
Z5272.4 13,180.9 13,314.0
Hinge point of tower and lower support part of tensioner supportX913.2 2283.1 2075.5
Y13.4 33.6 30.5
Z−2955.5 −7388.7 −6717.0
Articulation points of upper connecting rod between tower and tensioner supportX−891.6 −2229.0 −1857.5
Y1.0 2.4 2.0
Z−1560.2 −3900.6 −3250.5
Articulation points of tower and angle adjustment mechanismX−609.7 −1524.3 1301.5
Y−0.7 −1.8 1.5
Z1035.3 2588.2 −2210.0
Table A5. Tensioner maximum force during position adjustment.
Stress PositionForce DirectionPrototype (kN)Prototype Converted by Similarity (N)Scaled Model (N)
Hinge point between support component under tensioner support and hydraulic cylinderX1247.6 3119.0 2970.5
Y−2.1 −5.3 −5.0
Z−1692.8 −4232.0 −4030.5
Articulation of support components under tower and tensioner supportX1206.2 3015.4 2985.5
Y6.1 15.2 15.0
Z−5200.3 −13,000.7 −12,872.0
Table A6. Maximum force during angle adjustment.
Stress PositionForce DirectionPrototype (kN)Prototype Converted by Similarity (N)Scaled Model (N)
Hinge point between tower and deckX−399.4 −998.4 −988.5
Y129.1 322.7 319.5
Z−3692.4 −9230.9 −9139.5
Hinge point of tower and lower support part of tensioner supportX−676.3 −1690.7 −1674.0
Y109.3 273.2 270.5
Z−2427.2 −6068.1 −6008.0
Articulation points of upper connecting rod between tower and tensioner supportX−1023.1 −2557.8 −2532.5
Y2.0 5.1 5.0
Z−3796.4 −9491.0 −9397.0
Articulation points of tower and angle adjustment mechanismX−0.6 −1.5 −1.9
Y−1.6 −4.0 −5.0
Z3290.4 8225.9 10,250.6

References

  1. Zhang, Y.; Wang, Z.T.; Yang, Q.; Wang, H.Y. Numerical analysis of the impact forces exerted by submarine landslides on pipelines. Appl. Ocean Res. 2019, 92, 101936. [Google Scholar] [CrossRef]
  2. Punjarat, O.A.; Chucheepsakul, S. Post-Buckling Analysis of a Uniform Self-Weight Beam with Application to Catenary Riser. Int. J. Struct. Stab. Dyn. 2019, 19, 1950047. [Google Scholar] [CrossRef]
  3. Wang, F.C.; Lang, Y.M.; Li, J.N.; Luo, Y. Innovations in a submarine piggyback pipeline project in the East China Sea. Proc. Inst. Civ. Eng.-Civ. Eng. 2019, 172, 69–75. [Google Scholar] [CrossRef]
  4. Fan, N.; Nian, T.K.; Jiao, H.B.; Jia, Y.G. Interaction between submarine landslides and suspended pipelines with a streamlined contour. Mar. Georesour. Geotechnol. 2018, 36, 652–662. [Google Scholar] [CrossRef]
  5. Zhang, B.; Gong, R.; Wang, T.; Wang, Z. Causes and Treatment Measures of Submarine Pipeline Free-Spanning. J. Mar. Sci. Eng. 2020, 8, 329. [Google Scholar] [CrossRef]
  6. Simpson, P.; Hatton, S. A Novel Method For Coiled Tubing Installation. In Proceedings of the Offshore Technology Conference, Houston, TX, USA, 5–8 May 2008. [Google Scholar]
  7. Prasad, D.D.; Ahmed, M.R.; Lee, Y.H. Studies on the performance of Savonius rotors in a numerical wave tank. Ocean Eng. 2018, 158, 29–37. [Google Scholar] [CrossRef]
  8. Deng, R.; Luo, F.Q.; Wu, T.C.; Chen, S.Y.; Li, Y.L. Time-domain numerical research of the hydrodynamic characteristics of a trimaran in calm water and regular waves. Ocean Eng. 2019, 194, 106669. [Google Scholar] [CrossRef]
  9. Khazaee, R.; Rahmansetayesh, M.A.; Hajizadeh, S. Hydrodynamic evaluation of a planing hull in calm water using RANS and Savitsky’s method. Ocean Eng. 2019, 187, 106221. [Google Scholar] [CrossRef]
  10. Pulici, M.; Trifon, M. A deep water sealines installation by using the J-lay method–the blue stream experience. In Proceedings of the Thirteenth International Offshore and Polar Engineering Conference, Honolulu, HI, USA, 25–30 May 2003. [Google Scholar]
  11. Szczotka, M. A modification of the rigid finite element method and its application to the J-lay problem. Acta Mech. 2011, 220, 183–198. [Google Scholar] [CrossRef]
  12. Huang, S.; Vassalos, D. A numerical method for predicting snap loading of marine cables. Appl. Ocean Res. 1993, 15, 235–242. [Google Scholar] [CrossRef]
  13. Santillan, S.T.; Virgin, L.N. Numerical and experimental analysis of the static behavior of highly deformed risers. Ocean Eng. 2011, 38, 1397–1402. [Google Scholar] [CrossRef]
  14. Guo, X.S.; Nian, T.K.; Fan, N.; Jia, Y.G. Optimization design of a honeycomb-hole submarine pipeline under a hydrodynamic landslide impact. Mar. Georesour. Geotechnol. 2021, 39, 1055–1070. [Google Scholar] [CrossRef]
  15. Liang, H.; Yue, Q.; Lim, G.; Palmer, A.C. Study on the contact behavior of pipe and rollers in deep S-lay. Appl. Ocean Res. 2018, 72, 1–11. [Google Scholar] [CrossRef]
  16. Zan, Y.; Yuan, L.; Huang, K.; Ding, S.; Wu, Z. Numerical Simulations of Dynamic Pipeline-Vessel Response on a Deepwater S-Laying Vessel. Processes 2018, 6, 261. [Google Scholar] [CrossRef] [Green Version]
  17. Wang, L.Q.; Ju, M.; Xing, X.D.; Yun, F.H.; Wang, X.Y. Dynamic Behavior of the Deepwater Flexible Pipeline during Pipe Laying Process. J. Mar. Sci. Eng. 2020, 8, 286. [Google Scholar] [CrossRef]
  18. Wang, X. Design of Flexible Submarine Pipeline Laying System and Analysis of Pipeline Dynamic Characteristics during Laying Process; Harbin Engineering University: Harbin, China, 2019. [Google Scholar]
  19. Sakakibara, S.; Yamada, S. Fender selection for reverse lightering of ship-to-ship transfer operations. In Proceedings of the 27th International Conference on Offshore Mechanics and Arctic Engineering, Estoril, Portugal, 15–20 June 2008; pp. 645–654. [Google Scholar]
  20. Rueda-Bayona, J.G.; Guzman, A.; Eras, J.J.C. Selection of Jonswap Spectra Parameters during Water-Depth and Sea-State Transitions. J. Waterw. Port. Coast. Ocean Eng. 2020, 146, 04020038. [Google Scholar] [CrossRef]
  21. Sun, H.W.; Wang, C.C.; Pang, W. Modeling and Simulation of Ship Swaying Attitude Based on Linear System Theory. In Proceedings of the 12th International Conference on Complex, Intelligent, and Software Intensive Systems (CISIS), Matsue, Japan, 4–6 July 2018; pp. 695–703. [Google Scholar]
  22. Yue, M.A.; Liu, Q.S.; Li, C.; Ding, Q.W.; Cheng, S.S.; Zhu, H.T. Effects of heave plate on dynamic response of floating wind turbine Spar platform under the coupling effect of wind and wave. Ocean Eng. 2020, 201, 107103. [Google Scholar] [CrossRef]
  23. Sun, Q.; Zhou, H.; Gu, Q.P.; Yuan, H.L. Study on the Wave Loads and Structural Stresses of Container Ship. In Proceedings of the 2nd International Conference on Fluid Mechanics and Industrial Applications (FMIA), Guilin, China, 12–14 July 2018. [Google Scholar]
  24. Zhang, S.N.; Ishihara, T. Numerical study of hydrodynamic coefficients of multiple heave plates by large eddy simulations with volume of fluid method. Ocean Eng. 2018, 163, 583–598. [Google Scholar] [CrossRef]
  25. Wang, C.L.; Wu, J.M.; Wang, D.Y. Design similar scale model of a 10,000 TEU container ship through combined ultimate longitudinal bending and torsion analysis. Appl. Ocean Res. 2019, 88, 1–14. [Google Scholar] [CrossRef]
  26. Li, Z.; Ye, F.P.; Wu, S.Y. Design and Experimental Verification of a 1/20 Scale Model of Quayside Container Crane Using Distortion Theory. Shock Vib. 2019, 2019, 5893948. [Google Scholar] [CrossRef]
  27. Li, M.J.; Duan, M.L.; Yu, F.F.; Zhang, H.H.; Ren, X.Y.; Li, C.X. Model Test Investigation on a J-Lay System Designed for Deepwater Pipeline Installation in South China Sea. Appl. Mech. Mater. 2012, 138–139, 484–491. [Google Scholar] [CrossRef]
  28. Guo, L.; Duan, M.L.; Wang, Y.; Yu, F.F. Experimental investigation on dynamic model testing of a deep-water Riser Support by truncated hybrid method. Ships Offshore Struct. 2014, 9, 344–353. [Google Scholar] [CrossRef]
  29. Zan, Y.F.; Yang, C.; Han, D.F.; Yuan, L.H.; Li, Z.G. A numerical model for pipelaying on nonlinear soil stiffness seabed. J. Hydrodyn. 2016, 28, 10–22. [Google Scholar] [CrossRef]
  30. Duan, M.L.; Wang, Y.; Estefen, S.; He, N.; Li, L.N.; Chen, B.M. An Installation System of Deepwater Risers by An S-Lay Vessel. China Ocean Eng. 2011, 25, 139–148. [Google Scholar] [CrossRef]
  31. Zhang, X.F.; Yue, Q.J.; Zhang, W.S. The Model Test of Deep Water S-Lay Stinger Using Dynamical Substructure Method. J. Offshore Mech. Arct. Eng.-Trans. Asme 2015, 137, 011701. [Google Scholar] [CrossRef]
Figure 1. Overall structural diagram of the flexible pipeline-laying system.
Applsci 11 10292 g001
Figure 2. Attitude of underwater pipeline (a) and Force of pipeline unit (b).
Applsci 11 10292 g002
Figure 3. Finite element meshing of the hull.
Applsci 11 10292 g003
Figure 4. Experimental scaled model diagram of flexible pipeline-laying system.
Applsci 11 10292 g004
Figure 5. Simulation model (scaled model) in Adams.
Applsci 11 10292 g005
Figure 6. Force comparison between tower and deck articulation during pipe laying.
Applsci 11 10292 g006
Figure 7. Force comparison at the articulation of support components under tower and tensioner support.
Applsci 11 10292 g007
Figure 8. Force contrast diagram at the articulation of upper connecting rod of tower and tensioner support.
Applsci 11 10292 g008
Figure 9. Force comparison diagram at the contact between tower and angle adjustment mechanism.
Applsci 11 10292 g009
Figure 10. Comparison of pipe tension changes simulated by Adams and Orcaflex.
Applsci 11 10292 g010
Figure 11. Stress comparison between the lower support part of tensioner support and the hinge of the hydraulic cylinder.
Applsci 11 10292 g011
Figure 12. Stress at the hinge of the tower and lower support part of tensioner support.
Applsci 11 10292 g012
Figure 13. Comparison of forces at articulated points of tower and deck.
Applsci 11 10292 g013
Figure 14. Comparisons of forces at articulated joints of tower and angle adjustment mechanism.
Applsci 11 10292 g014
Figure 15. Comparisons of stresses at the joint of the tower and support under tensioner support.
Applsci 11 10292 g015
Figure 16. Force comparison diagram at the articulation of upper connecting rod of tower and tensioner support.
Applsci 11 10292 g016
Figure 17. Stress distribution during the vertical laying of the tower. (a) Scaled model; (b) prototype.
Applsci 11 10292 g017
Figure 18. Stress distribution at start-up of the angle adjustment mechanism. (a) Scaled model; (b) prototype.
Applsci 11 10292 g018
Figure 19. Stress distribution of upper connecting rod of tensioner support. (a) Scaled model; (b) prototype.
Applsci 11 10292 g019
Figure 20. Stress distribution of support components under tensioner support. (a) Scaled model; (b) prototype.
Applsci 11 10292 g020
Figure 21. Schematic diagram of scale model experimental system (a) and physical device (b).
Applsci 11 10292 g021
Figure 22. Maximum tension required for tensioner support under various sea conditions.
Applsci 11 10292 g022
Figure 23. Location of measuring points on the mounting side of the tower (a) and the laying side of the tower (b).
Applsci 11 10292 g023
Table 1. Summary of similarity ratios of experimental models.
Physical QuantitySimilarity RelationRatio
Stress σCσ = CE0.996
Strain εCε = 1 1
Elastic modulus ECE0.996
Density ρCρ0.999
Length lCl1/20
Concentrated Load FCECl20.0025
Table 2. Marine environmental parameters.
ParameterValueParameterValue
Depth3000 mSeabed stiffness100 kN/m/m2
Sea density1025 kg/m3Seabed damping1.0250
Sea temperature15 °CSurface current velocity1.028 m/s
Seabed current velocity0 m/sKinematic viscosity1.35 × 10−6 m2/s
Air kinematic viscosity15 × 10−6 m2/sSpectral peak period6.1~16.2 s
Wave height1.25–2.5 mAir density1.29 kg/m3
Wave typeJONSWAPWind speed8.0–10.8 m/s
Table 3. Vessel parameters.
ParameterValueParameterValue
overall length204.65 mVertical spacing185.00 m
molded breadth39.20 mDolded depth14.00 m
structure draft11.00 mOperation draft7~9.5 m
Ship displacement59,101TDeadweight34,850 T
metacenter height8.20 mHeight center13.60 m
Table 4. Equivalent force to be applied by the scaled model.
Device NameMass of Prototype (t)Scaled Model Equivalent Mass (kg)
Tensioner400.0952.0
Tower-top pulley block20.047.7
Tower crane36.887.7
Pipeline325.0773.0
Table 5. Experimental sea conditions.
Sea Condition Serial NumberSignificant Wave Height (m)Wave-to-Course Angle (°)Wave Period (s)
12.5010
22.54510
32.59010
42.513510
52.518010
Table 6. Maximum tension required for tensioner support under various sea conditions.
Sea Condition Serial NumberWave-to-Course Angle (°)Maximum Tension (N)
1026,700
24527,051
39027,608
413526,876
518026,361
Table 7. Stress detection points of the scaled model.
Measuring PointPositionWorking Condition
1Hinge between tower and upper connecting rod of tensioner supportTower vertical pipe-laying status
2Hinge between angle adjustment mechanism and towerInitial adjustment angle state of tower
3At the bolt hole of the upper connecting rod of the tensioner supportInitial adjustment angle state of tower
4The hinge between the lower support part of the tensioner support and the upper connecting rod of the tensioner supportTower vertical pipe-laying status
Table 8. Maximum tower stress during piping-laying (measuring point 1).
Sea Condition Serial NumberWave-to-Course Angle (°)Theoretical Stress (MPa)Actual Stress (MPa)
10201.27192.57
245202.77189.95
390218.12202.22
4135200.63189.05
5180197.93187.88
Table 9. Maximum stress of angle adjustment mechanism at initial adjustment angle of the tower (measuring point 2).
Sea Condition Serial NumberWave-to-Course Angle (°)Theoretical Stress (MPa)Actual Stress (MPa)
10115.68192.57
245202.77189.95
390218.12202.22
4135200.63189.05
5180197.93187.88
Table 10. Maximum stress of upper connecting rod of tensioner at initial adjustment.
Sea Condition Serial NumberWave-to-Course Angle (°)Theoretical Stress (MPa)Actual Stress (MPa)
10103.5698.34
245105.2797.95
390112.31104.42
4135102.3598.04
5180101.7694.58
Table 11. Maximum stress of lower support component under tensioner during piping-laying (measuring point 4).
Sea Condition Serial NumberWave-to-Course Angle (°)Theoretical Stress (MPa)Actual Stress (MPa)
10108.6596.81
245111.21101.12
390117.42106.86
4135111.65100.70
5180108.4298.81
Publisher’s Note: MDPI stays neutral with regard to jurisdictional claims in published maps and institutional affiliations.

