Article

Study on Nanosecond Laser Ablation of 40Cr13 Die Steel Based on ANOVA and BP Neural Network

1
School of Mechanical Engineering and Automation, Beihang University, Beijing 100191, China
2
Jiangxi Research Institute, Beihang University, Nanchang 330096, China
3
Research and Application Center of Advanced CNC Machining Technology, State Administration of Science, Technology and Industry for National Defense, Beijing 100191, China
*
Author to whom correspondence should be addressed.
Appl. Sci. 2021, 11(21), 10331; https://doi.org/10.3390/app112110331
Submission received: 6 October 2021 / Revised: 30 October 2021 / Accepted: 31 October 2021 / Published: 3 November 2021
(This article belongs to the Special Issue Laser Micro/Nano Machining Technology)

Abstract

:
Microstructured steel 40Cr13, which is considered a hard-to-machine steel due to its high mechanical strength and hardness, has wide applications in the dies industry. This study investigates the influence of three process parameters of a 355 nm nanosecond pulse laser on the ablation results of 40Cr13, based on analysis of variance (ANOVA) and back propagation (BP) neural network. The ANOVA results show that laser power has the greatest influence on the ablation depth, width, and material removal rate (MRR), with influence levels of 52.5%, 60.9%, and 70.4%, respectively. The scan speed affects the ablation depth and width to a certain extent, and the influence of the pulse frequency on the ablation depth and MRR is non-negligible. BP neural network models with 3-8-3, 3-10-3, and 3-12-3 structures were applied to predict the ablation results. The results show that the prediction accuracy is relatively high for the ablation width and MRR, with average prediction accuracies of 96.0% and 93.5%. The 3-8-3 network model has the highest prediction accuracy for the ablation width, and the 3-10-3 network model has the highest prediction accuracy for the ablation depth and MRR.

1. Introduction

In recent years, nanosecond lasers have been widely used in the manufacturing of surface microstructures [1,2]. Laser ablation processing has the advantages of being applicable to a wide range of materials, has low processing stress, and has high processing efficiency. Therefore, it has become a feasible alternative to conventional methods for fabricating complex microstructures on hard-to-machine materials, such as die steels, cemented carbides, and ceramics [3,4].
Laser ablation is a complex material removal process, in addition to material properties and laser characteristics, process parameters including laser power, pulse frequency, and scan speed are the key factors that determine the ablation quality [5,6]. Many previous theoretical analyses and experiments have shown that selecting a suitable combination of process parameters can significantly improve the laser processing quality [7,8]. However, it is difficult to optimise the process parameters through simple repeated experiments, owing to the large number of process parameter combinations [9].
The artificial neural network (ANN) is an algorithm model with adaptive and organisational capabilities that can imitate the behavioural characteristics of animal neural networks for distributed and parallel information processing [10]. ANN has been successfully applied in the industrial field to realize the prediction and improvement of device accuracy [11,12]. Another important application of it is to assist the selection of process parameters in laser processing, which cannot be achieved by traditional technical methods [13]. Chen et al. used an ANN to optimise the parameters of non-vertical laser processing, and they showed that the “quality point” calculated using an ANN is close to the actual cutting result [14]. Teixidor et al. studied the effects of scan speed, pulse intensity, and pulse frequency on the depth, width, surface roughness, and material removal rate(MRR) for the processing of microgrooves in the laser milling process; they used k-nearest neighbours, an ANN, and a decision tree to build predictive models [15]. Dixit et al. used the response surface method, an ANN, and a genetic algorithm to optimise the dimensional accuracy of laser processing based on 32 sets of experimental measurement data. The results showed that the ANN prediction model based on the 5-8-8-3 architecture had the highest prediction accuracy [16]. Yousef et al. proposed a neural network model to predict the pulse energy level required to produce pits with a predetermined depth and diameter during laser micromachining [17]. From the above studies, it is apparent that ANNs can been successfully applied to the prediction of laser processing results. There are many applicable ANN algorithms, among which the BP neural network is currently the most successful [18,19,20]. Therefore, in this study, we used BP neural networks to predict laser ablation results of 40Cr13 die steel.
Because of its high mechanical strength and hardness, 40Cr13 is considered a hard-to-machine steel. Nevertheless, microstructured 40Cr13 has numerous applications in the dies industry. To the best of our knowledge, there are few scientific studies on laser ablation of this kind of die steel to obtain microstructures. Due to the variety of elements inside the material and its uneven texture, it is difficult to ensure the uniformity of the microstructure processing quality during the laser ablation process. The goal of our work is to bridge this knowledge gap and improve the processing of inhomogeneous materials.
This study presents the first application of BP neural networks for the laser ablation results prediction of hard-to-process 40Cr13 steel. Our primary aim was to present a systematic investigation of the effects of nanosecond laser ablation of 40Cr13 die steel. This paper is organised as follows. Section 2 introduces the experimental materials and methods. Section 3 presents an analysis of the influence of three laser process parameters on the ablation results based on ANOVA. In Section 4, the ablation results are predicted based on three types of BP neural networks, and the prediction accuracy is analysed. Finally, Section 5 presents the concluding remarks of this study.

2. Materials and Methods

2.1. Material

The material used in this study was 40Cr13, which has high hardness, good wear resistance, and good corrosion resistance. This material is also widely used in the manufacturing of high-precision dies. The main components of 40Cr13 are listed in Table 1. The surfaces of the tested samples were milled, ground, and finally mirror-polished to R a ≤ 0.035 μ m to ensure low and consistent surface roughness.

2.2. Experimental Equipment

This experiment used a nanosecond pulse laser (FORMULA-355, Advanced Optowave Co., Ronkonkoma, NY, USA) with a wavelength of 355 nm. Its main parameters are listed in Table 2. The output spot diameter of the laser was 0.55 mm. The beam passed through a beam expander and a three-dimensional (3D) scanning galvanometer with a focal length of 290 mm before finally being focused by an F- θ field lens on the surface of the ablation sample. The positioning of the sample was ensured using a camera (CV-X100, Keyence, Japan), and the laser power was measured using a power meter (Ophir 30A-SV-17, Thorlabs, Newton, NJ, USA). A schematic of the experimental platform is shown in Figure 1.

2.3. Measurements and Characterisation

The nanosecond pulse laserspot moves on the surface of the sample part at a specified speed, and it produces a micro-groove structure via ablation. A laser confocal microscope (LEXT OLS5100, Olympus, Japan) was used to measure the size of the micro-groove structure. The measurement conditions are listed in Table 3.
The energy distribution of the laser beam is Gaussian; therefore, the cross-section of the micro-groove structure produced by laser ablation is approximately “V”-shaped. A typical micro-groove structure is shown in Figure 2, where three indexes are defined on the cross-section to characterise ablation results [15]:
  • Ablation depth (D): the distance from the lowest point of the cross-section to the upper surface.
  • Ablation width (W): the maximum distance between the two sides of the cross-section.
  • MRR: the product of the cross-sectional area and the distance that the laser moves per unit time.
During the measurement, several sections of 200 μ m micro-groove structures were cut along the length direction, and the average value was used as the measurement result of each index.

2.4. Experimental Parameters

The laser ablation process parameters include laser power, pulse frequency, and scan speed [5]:
  • Laser Power (LP): the real power value reaching the surfaces of tested samples considering the lost through a series of optical devices.
  • Pulse Frequency (PF): the number of laser pulses repeated in one second.
  • Scan Speed (SS): the moving speed of the laser focus on the surfaces of tested samples.
The ranges of the process parameters used in this study are shown in Table 4. The value of a single process parameter was changed during each processing, and the other parameters remained unchanged.

2.5. Fundamental Theory

In the laser ablation process, the fundamental factors that affect the ablation results are the single-pulse energy and pulse coincidence rate [21]. The ablation depth and width increase with the increase in the single-pulse energy and pulse coincidence rate, and the MRR under the same scan speed is higher. The single-pulse energy can be calculated as follows:
E s = L P P F .
Figure 3 shows a schematic of several pulses during the laser ablation process. Assuming d is the diameter of the focused spot, the pulse coincidence rate can be calculated as follows:
α = ( 1 S S d × P F ) × 100 % .

3. Effects of Process Parameters on Ablation Results

In this study, a total of 48 micro-groove structures were processed, and the results of the three indexes of the micro-groove structure are shown in Appendix A. Based on these data, the effects of laser process parameter changes on D, W, and MRR were analysed using ANOVA.

3.1. Effects of Process Parameters on Ablation Depth

Figure 4 shows the effect of laser power and scan speed on D for a pulse frequency of 50 kHz. It can be observed that D decreases with an increase in scan speed at the same laser power. With an increase in scan speed, the coincidence rate of the laser pulses decreases according to Equation (2); therefore, the energy absorbed by the material per unit length decreases.
Figure 5 shows the effect of laser power and pulse frequency on D for a scan speed of 150 mm/s. It can be observed that D increases with an increase in pulse frequency. With an increase in pulse frequency, the coincidence rate of the laser pulses increases according to Equation (2); therefore, the energy absorbed by the material per unit length increases.
Figure 4 and Figure 5 show that D increases significantly with laser power. Under the same repetition frequency, the single-pulse energy increases with an increase in laser power, according to Equation (1). This study conducted ANOVA to investigate the influence of laser power, scan speed, and pulse frequency on D. The results are presented in Table 5. The p-values of the three process parameters are all 0, which indicates that all three parameters affect D. Laser power has the highest degree of influence, at 52.5%, followed by the pulse frequency and scan speed, at 28.9% and 18.6%, respectively.

3.2. Effects of Process Parameters on Ablation Width

Figure 6 shows the effect of laser power and scan speed on W for a pulse frequency of 50 kHz. It can be observed that W decreases with an increase in scan speed at a constant laser power. However, W does not decrease indefinitely; the lower limit of W is approximately the diameter of the laser focus spot.
Figure 7 shows the effect of laser power and pulse frequency on W for a scan speed of 150 mm/s. It can be observed that W increases with an increase in pulse frequency, and this relationship is approximately linear.
Figure 6 and Figure 7 show that W increases significantly with laser power. Table 6 shows the ANOVA results for W. Laser power has the highest degree of influence, at 60.9%, followed by pulse frequency and scan speed, at 30.6% and 8.5%, respectively.

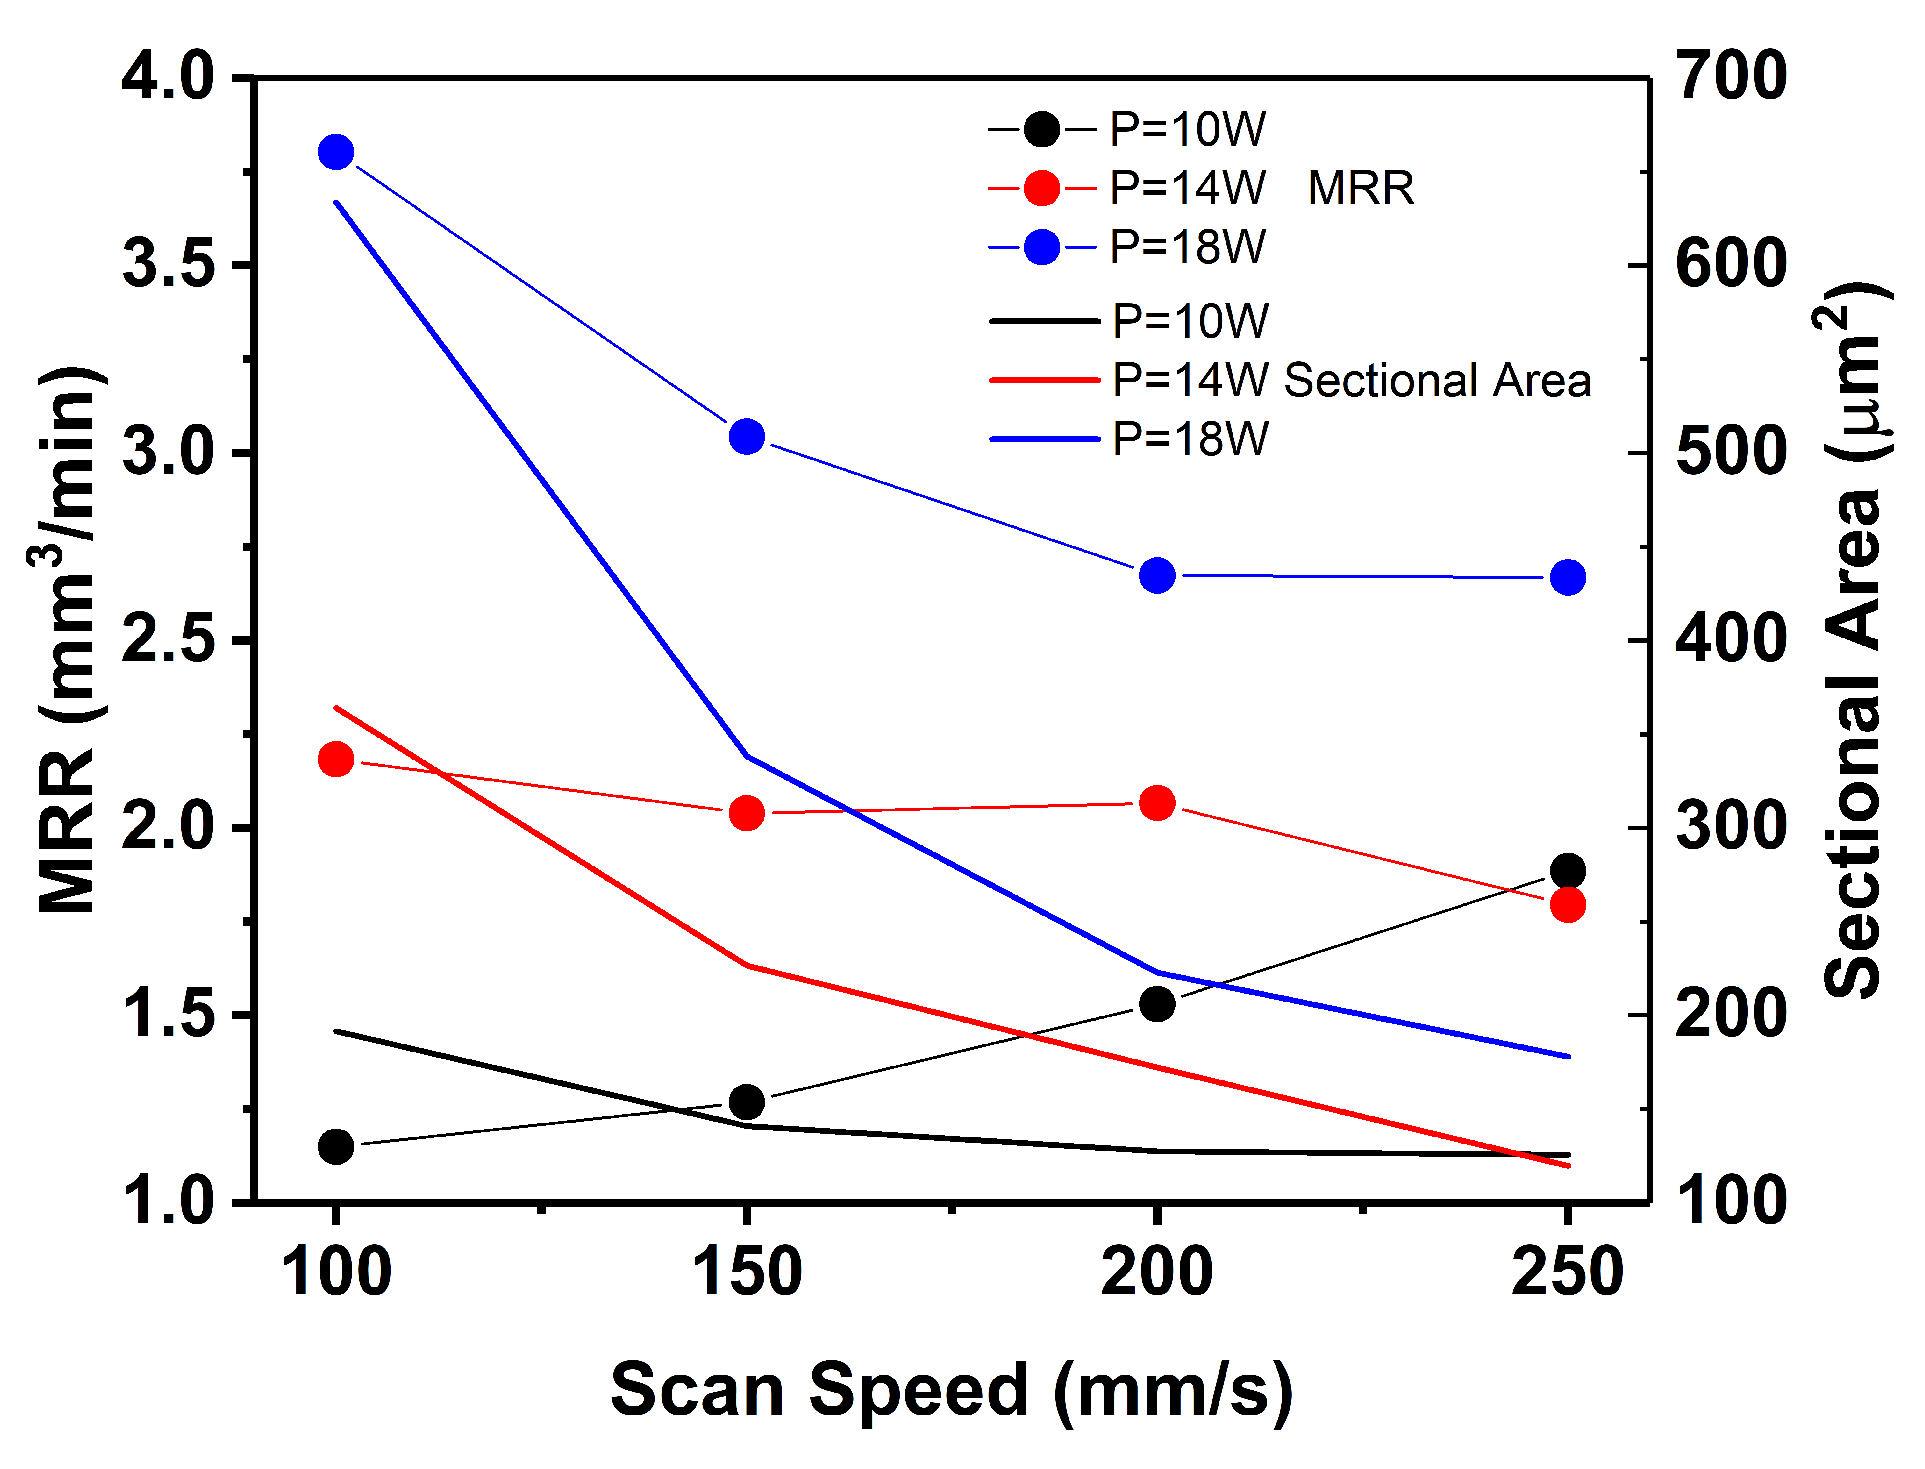
3.3. Effects of Process Parameters on Material Removal Rate

Figure 8 shows the effect of laser power and scan speed on the MRR and cross-sectional area for a pulse frequency of 50 kHz. The cross-sectional area clearly changes with the laser power and scan speed; the cross-sectional area increases with an increase in laser power, and it decreases with an increase in scan speed. However, the change rule of the MRR based on laser power and scan speed is unclear because the MRR is the result of the combined effect of the cross-sectional area and scan speed.
Figure 9 shows the effect of laser power and pulse frequency on the MRR and cross-sectional area for a scan speed of 150 mm/s. The cross-sectional area increases with an increase in laser power or pulse frequency. The change rule of the MRR with the pulse frequency is unclear. Table 7 shows the ANOVA results of the MRR. Laser power has the highest degree of influence, at 70.4%, followed by pulse frequency and scan speed, at 27.4% and 2.1%, respectively.

4. Prediction of Ablation Results Based on BP Neural Network

Laser processing is complex, and different process parameters have significantly different effects on ablation results. In this study, the BP neural network was used to establish a machine learning model and predict the ablation results of the laser processing of 40Cr13 die steel. The supporting software is MATLAB R2018a, and the establishment and training of neural networks are realized through this software.

4.1. Establishment of BP Neural Network Model

The neural network structure designed in this study is shown in Figure 10. It includes a three-layer structure: an input layer, hidden layer, and output layer. The input layer contains three neuron nodes, which correspond to LP, SS, and PF. The output layer also contains three neuron nodes, which correspond to D, W, and MRR. The number of hidden layer nodes can be calculated according to [22]:
m = n + l + a ,
where m is the number of hidden layer nodes, n is the number of input layer nodes, l is the number of output layer nodes, and a is the adjustment coefficient that varies between 1 and 10. In this study, the number of hidden layer nodes was sequentially set to 8, 10, and 12, thereby forming three types of network models: 3-8-3, 3-10-3, and 3-12-3, respectively.
From the data in Appendix A, we selected the first 45 groups to be the training set of the BP neural network, and the last three groups to be the testing set. The values of LP, SS, and PF in the training set data were used as the inputs for the three network models, and D, W, and MRR were used as the outputs. The logsig function was selected as the transfer function between neurons, and the learning rate was set to 0.001, which was used to control the convergence speed and stability of the network model. The minimum error was set to 0.0001, and the maximum number of learning times was set to 1000 [23].

4.2. Analysis of Prediction Results

The values of D, W, and MRR in the training set were defined as the measurement values, and the values obtained after the simulation calculation were defined as the prediction values. Figure 11, Figure 12 and Figure 13 show a comparison between the measurement and prediction values for D, W, and MRR that were obtained by the three types of network models.
The data of the testing set were simulated to verify the accuracy of the network models, and the measurement and prediction values of the three types of network models are shown in Table 8. The prediction accuracy is defined as follows:
a c c = ( | P V M V | M V ) × 100 % .
where PV and MV are the prediction value and measurement value, respectively. It can be observed from Table 8 that the BP neural network has a high prediction accuracy for the three indexes of laser ablation. Among them, the prediction accuracy for the W was the highest, followed by MRR, with the average prediction accuracy for these values being 96.0% and 93.5%, respectively. The prediction accuracy of D was relatively low, with a average accuracy of 84.3%.
The root mean square errors (RMSEs) between the measurement and prediction values of the three types of network models were used to characterise the prediction accuracy. The calculation results are presented in Table 9. It can be observed that neural networks of different structures had different prediction accuracies for the three indexes of laser ablation. The neural network with the 3-10-3 structure had the highest prediction accuracy for D and MRR, whereas the neural network with the 3-8-3 structure had the highest prediction accuracy for W.

5. Conclusions and Future Work

This study used ANOVA to analyse the influence of three process parameters on the nanosecond pulse laser ablation of 40Cr13 and used BP neural networks to predict the ablation results. The main conclusions are summarised as follows:
  • Laser power had the strongest influence on D, W, and the MRR; the influence levels were 52.5%, 60.9%, and 70.4%, respectively. The main reason is that laser power mainly determines the single-pulse energy, which is the decisive factor for the ablation results.
  • The scan speed had an effect on D and W to a certain extent; the influence levels were 28.9% and 30.6%, respectively. However, the effect of the scan speed on the MRR was only minor, with an influence level of 2.1%. The main reason is that scan speed and pulse frequency jointly determine the pulse coincidence rate, which is another factor that affects the ablation results.
  • The influence of pulse frequency on D and the MRR was non-negligible; the influence levels were 18.6% and 27.4%, respectively. The pulse frequency had little effect on W; the influence level was 8.5%.
  • Three types of BP neural network models were used to predict the ablation results. The results show that the prediction accuracy for the W was the highest, followed by MRR and D. The average prediction accuracies reached 96.0%, 93.5% and 84.4%, respectively.
  • The network model with the 3-10-3 structure had the highest prediction accuracy for D and the MRR, the minimum RMSEs reached 0.096 and 1.660, the network model with the 3-8-3 structure had the highest prediction accuracy for W with the minimum RMSE of 0.940.
Although only 40Cr13 was tested in this study, the abovementioned methods should be applicable to the laser ablation processing of other die steel materials as well. These techniques can be used to guide the setting of process parameters during laser ablation processing, which will help improve processing accuracy and efficiency. However, the experimental data in this study is based only on the results of single-pass processing. In the future, our group will conduct research on the quality control and prediction of multi-pass processing or even the processing of entire surfaces, which is a more complex task.

Author Contributions

Conceptualization, Z.Y.; methodology, Z.Y., P.S. and J.W.; software, Z.Y. and P.S.; validation, Z.Y., P.S. and J.W.; formal analysis, Z.Y.; investigation, Z.Y. and Q.L.; resources, Q.L.; data curation, Z.Y.; writing—original draft preparation, Z.Y.; writing—review and editing, Z.Y. and Q.L.; supervision, Q.L.; project administration, Q.L.; funding acquisition, Q.L. All authors have read and agreed to the published version of the manuscript.

Funding

This research was funded by the National Key Research and Development Program of China (Grant No. 2016YFB1102503).

Institutional Review Board Statement

Not applicable.

Informed Consent Statement

Not applicable.

Data Availability Statement

Not applicable.

Acknowledgments

The first author would like to express his thanks to Hang Z. and Libin L. for offering valuable guidance and support during the writing of this manuscript.

Conflicts of Interest

The authors declare no conflict of interest.

Abbreviations

The following abbreviations are used in this manuscript:
ANOVAAnalysis of variance
BPBack propagation
MRRMaterial removal rate
WAblation width
DAblation depth
LPLaser power
PFPulse frequency
SSScan speed

Appendix A

Table A1. The measurement results of the micro-groove structures.
Group
No.
LP
(W)
PF
(kHz)
SS
(mm/s)
D
(mm)
W
(mm)
MRR
(mm 3 /min)
Group
No.
LP
(W)
PF
(kHz)
SS
(mm/s)
D
(mm)
W
(mm)
MRR
(mm 3 /min)
110401004.71036.3201.1052514601509.10240.8712.474
210401503.50435.4701.1662614602008.81237.0072.500
310402002.71032.5441.3912714602507.02434.1572.341
410402502.04031.1571.45728147010017.31243.9193.184
510501005.92837.7691.14929147020010.87839.7833.062
610501504.84136.3101.2683014702507.96535.1572.669
710502003.70033.1661.52931184010014.57546.1282.603
810502503.17032.0321.8853218401509.37443.1662.333
910601008.36538.7691.2913318402007.04141.9722.258
1010602005.04433.6601.8293418402505.23137.0512.333
1110602504.04432.3201.99735185010020.38549.2083.802
1210701009.45340.2041.77636185015012.27045.3403.043
1310701507.58039.8102.1913718502008.81140.1912.674
1410702005.62438.3952.5823818502506.70338.3692.668
1510702504.24333.8372.60839186010025.60951.7134.905
1614401007.47640.4081.97540186015014.68547.2703.649
1714401506.13038.7081.9164118602508.32139.9693.108
1814402004.28835.2451.91442187010033.55758.5325.783
1914402503.05232.0961.57343187015017.00052.5754.280
2014501008.14641.2722.18444187020012.08642.9543.708
2114501506.34839.0482.0394518702509.28240.8403.301
2214502005.54936.5112.0664610601506.59036.3411.730
2314502504.74633.1231.79447147015015.41541.6333.591
24146010010.26842.5992.62948186020010.54541.7983.144

References

  1. Aggarwal, S.; Pandey, R.K. Frictional and load-carrying behaviours of micro-textured sector shape pad thrust bearing incorporating the cavitation and thermal effects. Lubr. Sci. 2017, 29, 255–277. [Google Scholar] [CrossRef]
  2. Mao, B.; Siddaiah, A.; Liao, Y.; Menezes, P.L. Laser surface texturing and related techniques for enhancing tribological performance of engineering materials: A review. J. Manuf. Process. 2020, 53, 153–173. [Google Scholar] [CrossRef]
  3. Wu, B.; Liu, P.; Duan, J.; Deng, L.; Zeng, X.; Wang, X. Study on picosecond pulse laser ablation of Cr12MoV cold work mold steel. Mater. Des. 2016, 110, 549–557. [Google Scholar] [CrossRef]
  4. Schreck, S.; Zum Gahr, K.H. Laser-assisted structuring of ceramic and steel surfaces for improving tribological properties. Appl. Surf. Sci. 2005, 247, 616–622. [Google Scholar] [CrossRef]
  5. Goeke, A.; Emmelmann, C. Influence of laser cutting parameters on CFRP part quality. Phys. Procedia 2010, 5, 253–258. [Google Scholar] [CrossRef] [Green Version]
  6. Kasman, S. Impact of parameters on the process response: A Taguchi orthogonal analysis for laser engraving. Measurement 2013, 46, 2577–2584. [Google Scholar] [CrossRef]
  7. Dubey, A.K.; Yadava, V. Laser beam machining-A review. Int. J. Mach. Tools Manuf. 2008, 48, 609–628. [Google Scholar] [CrossRef]
  8. Madić, M.; Antucheviciene, J.; Radovanović, M.; Petković, D. Determination of laser cutting process conditions using the preference selection index method. Opt. Laser Technol. 2017, 89, 214–220. [Google Scholar] [CrossRef]
  9. Xiuming, L.; Zhaoyao, S. Development and application of convex hull in the assessment of roundness error. Int. J. Mach. Tools Manuf. 2008, 48, 135–139. [Google Scholar] [CrossRef]
  10. Mills, B.; Grant-Jacob, J.A. Lasers that learn: The interface of laser machining and machine learning. IET Optoelectron. 2021, 15, 207–224. [Google Scholar] [CrossRef]
  11. Chen, L.; Yin, Y.; Li, Y.; Hong, M. Multifunctional inverse sensing by spatial distribution characterization of scattering photons. Opto-Electron. Adv. 2019, 2, 19001901–19001908. [Google Scholar] [CrossRef] [Green Version]
  12. Saetchnikov, A.V.; Tcherniavskaia, E.A.; Saetchnikov, V.A.; Ostendorf, A. Deep-learning powered whispering gallery mode sensor based on multiplexed imaging at fixed frequency. Opto-Electron. Adv. 2020, 3, 200048. [Google Scholar] [CrossRef]
  13. Parandoush, P.; Hossain, A. A review of modeling and simulation of laser beam machining. Int. J. Mach. Tools Manuf. 2014, 85, 135–145. [Google Scholar] [CrossRef]
  14. Jimin, C.; Jianhua, Y.; Shuai, Z.; Tiechuan, Z.; Dixin, G. Parameter optimization of non-vertical laser cutting. Int. J. Adv. Manuf. Technol. 2007, 33, 469–473. [Google Scholar] [CrossRef]
  15. Teixidor, D.; Grzenda, M.; Bustillo, A.; Ciurana, J. Modeling pulsed laser micromachining of micro geometries using machine-learning techniques. J. Intell. Manuf. 2015, 26, 801–814. [Google Scholar] [CrossRef] [Green Version]
  16. Dixit, S.R.; Das, S.R.; Dhupal, D. Parametric optimization of Nd:YAG laser microgrooving on aluminum oxide using integrated RSM-ANN-GA approach. J. Ind. Eng. Int. 2019, 15, 333–349. [Google Scholar] [CrossRef] [Green Version]
  17. Yousef, B.F.; Knopf, G.K.; Bordatchev, E.V.; Nikumb, S.K. Neural network modeling and analysis of the material removal process during laser machining. Int. J. Adv. Manuf. Technol. 2003, 22, 41–53. [Google Scholar] [CrossRef]
  18. Qian, K.; Hou, Z.; Sun, D. Sound Quality Estimation of Electric Vehicles Based on GA-BP Artificial Neural Networks. Appl. Sci. 2020, 10, 5567. [Google Scholar] [CrossRef]
  19. Pei, G.; Yu, M.; Xu, Y.; Ma, C.; Lai, H.; Chen, F.; Lin, H. An Improved PID Controller for the Compliant Constant-Force Actuator Based on BP Neural Network and Smith Predictor. Appl. Sci. 2021, 11, 2685. [Google Scholar] [CrossRef]
  20. Bai, Y.; Luo, M.; Pang, F. An Algorithm for Solving Robot Inverse Kinematics Based on FOA Optimized BP Neural Network. Appl. Sci. 2021, 11, 7129. [Google Scholar] [CrossRef]
  21. Lehr, J.; Kietzig, A.M. Production of homogenous micro-structures by femtosecond laser micro-machining. Opt. Lasers Eng. 2014, 57, 121–129. [Google Scholar] [CrossRef]
  22. Dhupal, D.; Doloi, B.; Bhattacharyya, B. Optimization of process parameters of Nd:YAG laser microgrooving of Al2TiO5 ceramic material by response surface methodology and artificial neural network algorithm. Proc. Inst. Mech. Eng. Part B J. Eng. Manuf. 2007, 221, 1341–1350. [Google Scholar] [CrossRef]
  23. Dhupal, D.; Doloi, B.; Bhattacharyya, B. Modeling and optimization on Nd:YAG laser turned micro-grooving of cylindrical ceramic material. Opt. Lasers Eng. 2009, 47, 917–925. [Google Scholar] [CrossRef]
Figure 1. Schematic of the experimental platform.
Applsci 11 10331 g001
Figure 2. Typical micro-groove structure. (a) Axonometric view of micro-groove. (b) Top view of micro-groove. (c) Sectional view of micro-groove.
Applsci 11 10331 g002
Figure 3. Schematic of laser pulses.
Applsci 11 10331 g003
Figure 4. Effect of laser power and scan speed on D.
Applsci 11 10331 g004
Figure 5. Effect of laser power and pulse frequency on D.
Applsci 11 10331 g005
Figure 6. Effect of laser power and scan speed on W.
Applsci 11 10331 g006
Figure 7. Effect of laser power and pulse frequency on W.
Applsci 11 10331 g007
Figure 8. Effect of laser power and scan speed on the MRR.
Applsci 11 10331 g008
Figure 9. Effect of laser power and pulse frequency on MRR.
Applsci 11 10331 g009
Figure 10. Effect of laser power and pulse frequency on the MRR.
Applsci 11 10331 g010
Figure 11. Comparison between the measurement and prediction values of D obtained by three types of network models.
Applsci 11 10331 g011
Figure 12. Comparison between the measurement and prediction values of W obtained by three types of network models.
Applsci 11 10331 g012
Figure 13. Comparison between the measurement and prediction values of the MRR obtained by three types of network models.
Applsci 11 10331 g013
Table 1. Main components of 40Cr13 (wt%).
CSiMnSPCrNi
0.36–0.45≤0.60≤0.80≤0.03≤0.03512.00-14.00≤0.60
Table 2. Main parameters of nanosecond pulse laser.
ParameterValueUnit
Wavelength355nm
Maximum Power>25W
M 2 Factor<1.2-
Beam Diameter≈0.55mm
Pulse Width<20ns
Repetition Rate40–300kHz
Table 3. Measurement conditions.
Measurement ConditionDescription
Objective LensMPLAPON20xLEXT
Zoom
Image Size1024 × 1024
Laser Brightness35.2
Automatic GainOpen
Table 4. Variation ranges of process parameters.
Process ParameterValue
Laser Power (W)101418
Pulse Frequency (kHz)40506070
Scan Speed (mm/s)100150200250
Table 5. ANOVA results of D.
Process ParameterDegree of
Freedom
Sum of
Square
Mean
Square
F-Valuep-ValueInfluence
Level
Laser Power2571.197285.59830.0920.00052.5%
Pulse Frequency3303.424101.14110.6570.00018.6%
Scan Speed3472.076157.35916.5800.00028.9%
Table 6. ANOVA results of W.
Process ParameterDegree of
Freedom
Sum of
Square
Mean
Square
F-Valuep-ValueInfluence
Level
Laser Power2733.699366.850117.4930.00060.9%
Pulse Frequency3153.07551.02516.3420.0008.5%
Scan Speed3553.007184.33659.0380.00030.6%
Table 7. ANOVA results of MRR.
Process ParameterDegree of
Freedom
Sum of
Square
Mean
Square
F-Valuep-ValueInfluence
Level
Laser Power222.40711.20451.2820.00070.4%
Pulse Frequency313.0884.36319.9700.00027.4%
Scan Speed31.0120.3371.5440.2182.1%
Table 8. Prediction results of testing set data.
Group
No.
AblationDepth ( μ m)
Prediction ValuesMeasurement Value
3-8-33-10-33-12-3
466.1105.3905.1726.590
4710.36112.8439.91215.415
4810.22310.08510.71010.545
Group
No.
Ablation Width ( μ m)
Prediction ValuesMeasurement Value
3-8-33-10-33-12-3
4636.43736.53037.54836.341
4743.05249.42344.38941.633
4842.59241.99541.58141.798
Group
No.
MRR (mm 3 /min)
Prediction ValuesMeasurement Value
3-8-33-10-33-12-3
461.6181.6341.3241.730
473.1063.4703.6933.591
483.1013.2083.1493.144
Table 9. RMSEs of testing set data.
IndexesNetworkModels
3-8-33-10-33-12-3
D ( μ m)2.9371.6603.283
W ( μ m)0.9404.5001.742
M R R (mm 3 /min)0.2890.0960.237
Publisher’s Note: MDPI stays neutral with regard to jurisdictional claims in published maps and institutional affiliations.

