1. Introduction
Aircraft tires are used in different stages; these can be divided into taxiing, takeoff, and landing. During taxiing, the speed is relatively low, and therefore the tire temperature increases only slightly. During takeoff and landing, the temperature in the tread increases considerably due to high-speed friction between tire and runway [
1]. However, the landing phase is the most burdensome and therefore defines the design specifications of the tire [
2]. At the first touch between the tire and the runway, the tire has no rotational speed. Therefore, the tire heats up instantaneously, generates smoke from degraded rubber, and blackens the runway [
3].
For aircraft tire/retreaded tire manufacturing, the demand is to increase service life without many changes in the existing formulation and processing. From a compounding point of view, the selection of polymers, fillers, and other additives is crucial to address the Heat Build-Up (HBU) problem in aircraft tire treads and minimize trade-offs. Additives are generally used at relatively low levels to fine-tune the tread performance.
Oligomeric hydrocarbon resins are used in the rubber technology as processing aids, tackifiers, curing agents, and reinforcing agents [
4]. In the past, resins were used to lower viscosity, enhance tackiness and green strength of uncured compounds as well as to improve mechanical properties of the vulcanizates. Tack is the ability of two materials to resist separation after bringing the surfaces into contact for a short time under light pressure [
5]. In order for a rubber compound to exhibit high tack, three conditions must be fulfilled:
In order to increase the contact area, the material must perform viscous flow. However, increasing contact area and interdiffusion are not enough to achieve high tack. The third condition must also be met, which requires sufficient green strength. Green strength is the ability of rubber compounds to resist deformation and fracture before vulcanization. The contact and interdiffusion might be achieved using a process oil, but it reduces cohesive strength and produces little tack. In contrast, hard brittle solids such as resins, have high cohesive strengths. Only polymeric materials above their glass transition temperature (Tg) can exhibit good tack because they provide a proper balance between molecular mobility needed to achieve bond formation and cohesive strength to resist rupture. Resins fulfill these requirements and are therefore known as tackifiers.
Fiber-reinforced composites are widely used in industry, especially in aircraft construction, due to their lightweight. The usage is not limited to aerospace, they are also used in the automotive, shipbuilding, railway and sports equipment sector. One example is the incorporation of modified silica nanoparticles into a matrix of epoxy resin in fiber-reinforced composites, which shows improvements for various properties such as tensile strength and modulus, flexural stiffness, toughness and scratch resistance. With the addition of nanosilica, the interfacial shear strength between the epoxy resin matrix and the fiber is increased and the stress transfer from matrix to the fiber becomes more efficient. The fracture failure mode changes from adhesive failure between glass or carbon fiber and the epoxy matrix to a combination of adhesive and cohesive failure in the resin matrix for the laminates with nanosilica [
7]. This indicates an interaction between nanosilica and the resin resulting in an improvement of certain properties.
Today, resins are used in tire manufacturing, especially Passenger Car Tires (PCT), to enhance the viscoelastic properties. The use of resins in Silica (SI)-filled PCT results in an improvement in traction, handling, treadwear, and rolling resistance. It is crucial to understand how the different types of resins affect the viscoelastic properties of the rubbers in order to tailor the tire properties.
Table 1 shows the types of resin used in the rubber industry. Reactive resins, for example resole-phenol-formaldehyde resins, react with unsaturated bonds in the polymer chains, improving heat and moisture resistance, but reducing flexibility. When a non-reactive resin is compatible with rubber, the polymer entanglement density decreases, which results in improved processability and decrease of the modulus of vulcanizates [
8]. A softer rubber compound provides better surface contact with the substrate and increases tackiness.
A compatible and non-reactive hydrocarbon resin increases the Tg of a compound compared to the neat rubber [
9]. The higher Tg of the compound raises the tan δ value at 0 °C by more viscoelastic damping and thus improves the wet traction characteristics of tire treads built on basis of these compounds. Tan δ measured between 35–75 °C is indicative of rolling resistance of tire treads: the higher, the more rolling loss, and this may slightly increase. At a temperature exceeding 100 °C, the tan δ of a resin-containing rubber is lower than the one of the control rubbers without resin, which indicates low HBU:
Figure 1. If the resin is partially compatible or if the loading of resin exceeds its miscibility level in the rubber compound, then a second peak from the resin is seen in the tan δ curve [
8].
When designing rubber compounds with the use of resins, the properties of resins give valuable information about their suitability. The properties include:
Softening point which is indicative of viscosity and controlled by the average molecular weight of the oligomeric material;
Glass transition temperature (Tg);
Thermal stability;
Viscosity;
Solubility which depends on the resin type;
Average molecular weight;
Molecular weight distribution;
Compatibility which can be defined as showing only one glass transition temperature within the rubber compound [
10]. Compatibility depends on the resin type, molecular weight and its distribution, resin structure, and configuration.
It is challenging to manipulate the performance balance of traction, treadwear, and rolling resistance of tires. These three properties are commonly referred to as the magic triangle for improving passenger car/truck tire performance. In aircraft tires, the properties of interest are low heat generation in the tread since this tire part is prone to temperature increase due to the extreme conditions. High temperatures are detrimental to tire properties: it can decrease the strength and accelerate treadwear. Therefore, it is crucial to develop a compound formulation with low hysteresis while maintaining other required properties. This manuscript explores how the use of resins helps to enhance processing, tackiness and final properties of aircraft tire retreads.
2. Materials and Methods
2.1. Materials
The elastomers used in this study were Ribbed Smoked Sheet (RSS-1) from Weber & Schaer GmbH & Co. KG, Hamburg, Germany, and High-Cis Long-Chain Branched Butadiene Rubber (HC LCB BR) Nd 22 EZ from ARLANXEO, Köln, Germany. Other compounding ingredients are high structure CB N234 from CABOT, Boston, MA, USA, and Treated Distillate Aromatic Extract (TDAE) oil from Hansen & Rosenthal, Hamburg, Germany. N-Cyclohexyl-2-Benzothiazole Sulfenamide (CBS), 2,2,4-TriMethyl-1,2-dihydroQuinoline (TMQ), N-Phenyl-para-PhenyleneDiamine (6PPD), Zinc Oxide (ZnO), stearic acid and sulfur are of technical quality. The resins employed were SYLVATRAXX
TM products from Kraton Polymers Corp.: SYLVATRAXX 6720 is a Terpene Phenol (TP) resin, SYLVATRAXX 4401 is an aromatic hydrocarbon C9 resin (C9). The characteristic properties are given in
Table 2. The structure of the resins is depicted in
Figure 2. The properties of the Treated Distillate Aromatic Extract (TDAE) oil are given in
Table 3.
Table 4 shows the solubility parameters of polymers and resins used in this study. Details of the calculations of the solubility parameters are given in
Supplementary Materials,
Tables S1–S4.
Table 2.
Resins used in this research [
11,
12].
Table 2.
Resins used in this research [
11,
12].
| Properties | TP | C9 |
|---|
| Main designation | Terpene phenol | Aromatic hydrocarbon |
| Glass transition temperature, Tg (°C) | 68 | 39 |
| Softening point (°C) | 113–123 | 82–88 |
| Density (g/cm3) | 1.03 | 1.06 |
| Viscosity at 150 °C (mPa.s) | 3400 | 650 |
Figure 2.
Structure of: (
a) terpene phenol [
13]; (
b) aromatic C9 resin [
8].
Figure 2.
Structure of: (
a) terpene phenol [
13]; (
b) aromatic C9 resin [
8].
Table 3.
Properties of TDAE [
14].
Table 3.
Properties of TDAE [
14].
| Properties | Standard Test Method | TDAE |
|---|
| Color | ASTM D156 | 8.0D |
| Density at 15 °C (g/cm3) | ASTM D1298 | 0.95 |
| Density at 20 °C (g/cm3) | ASTM D1298 | 0.947 |
| Kinematic viscosity at 40 °C (m2/s) | ASTM D445 | 410 |
| Kinematic viscosity at 100 °C (m2/s) | ASTM D445 | 18.8 |
| Sulfur (wt%) | ISO 14596 | 0.8 |
| Aniline point (°C) | ASTM D611 | 68 |
| Glass transition temp, Tg (°C) | IP346 | -48 |
Table 4.
Solubility parameters (δ) of polymers and resins.
Table 4.
Solubility parameters (δ) of polymers and resins.
| | δ (MPa)1/2 | δ (1) (MPa)1/2 | | δ (1)NR/BR–δ (1)resin or oil| (MPa)1/2 |
|---|
| Natural Rubber (NR) | 16.3–17 [15] | 17.8 [16] | – |
| Butadiene Rubber (BR) | 16–17 [15] | 17.7 [16] | – |
| NR/BR blends 70/30 | – | 17.7 [16] | – |
| Terpene Phenol (TP) | 16–23 [16] | 20.2 (2) [16] | 2.4 |
| Aromatic hydrocarbon C9 (C9) | 18 [17] | 19.4 [16] | 1.6 |
| TDAE | – | 17.2 [14] | 0.5 |
The compound formulations are shown in
Table 5. The filler systems used in this research are Carbon Black (CB), a hybrid system of Carbon Black and Silica (CB/SI) and pure Silica (SI). All control compounds were formulated to obtain comparable hardness. The control (C) compounds contain TDAE oil in the CB-, but no TDAE oil in the CB/SI- and SI-filled systems. TP are compounds with Terpene Phenol resin, and C9 indicates addition of the aromatic hydrocarbon C9 resin. A standard carcass formulation [
18] was used as countersurface for green tack measurement.
2.2. Mixing Procedure
Mixing of the CB-filled compounds was performed using an internal mixer (Brabender Plasticorder 350s) with a mixer temperature initially set at 50 °C, and a rotor speed of 130 revolutions per minute (rpm). NR was initially masticated prior to the addition of BR. The masticated NR and BR were blended for 1 min (min). Then half of the CB and TDAE oil were added and mixed for 1 min. After 1 min, the other half of CB and TDAE oil were added and mixed for another 6 min. Finally, all other ingredients: ZnO, stearic acid, 6PPD, and TMQ, were added and mixed for 2 min. The compounds were dumped, sheeted out on a two-roll mill, and kept overnight before incorporation of sulfur and CBS in the same internal mixer at a set temperature of 70 °C and initial rotor speed of 50 rpm. For this, the masterbatch was mixed for 1 min, the rotor speed was decreased to 30 rpm before curatives were added, and the compound was mixed for another 2 min.
For CB/SI- and SI-filled compounds, the mixer temperature and rotor speed were set at 100 °C and 60 rpm. The masticated NR and BR were blended. In CB/SI, silica and silane were added first and mixed for 1 min. At the second addition, CB was added with other rubber ingredients except for curatives. In the SI-filled compounds, half silica and silane were added after mixing rubbers, and the other half of the silica-silane filler and remaining ingredients except curatives at the second addition. The rotor speed was then adjusted/decreased to reach the temperature for silanization of 150 °C. The temperature of silanization was maintained for 7 min and 9 min for the CB/SI- and the Si-filled compounds, respectively. After 3 min of silanization, the ram was opened for about 1 min to release ethanol generated in the silanization reaction. Then the compounds were discarded. The second stage of admixing the curatives was performed according to the same procedure as the CB-filled compounds.
2.3. Testing of Compounds and Vulcanizates Properties
Mooney Viscosity (MV)–The compounds were tested for their MV by using a Mooney Viscometer 2000 VS (Alpha Technologies, Wilmington, DE, USA) at 100 °C with a large rotor for 4 min with 1 min of pre-heating according to ASTM D1646. The value is represented as ML(1 + 4)100 °C.
Tackiness—the tackiness of compounds with/without resin in different filler systems was tested using a universal tensile testing machine Zwick Z10. Tack measurements were performed using a custom-made device, and the procedure was adopted based on the work of Mikrut [
19]. Pieces of rubber with dimensions of 20 × 20 × 2 mm were used as test samples. The sample and the counter sample (carcass compound) were pressed against orifice disks to generate a convex contact surface:
Figure 3a. The sample was brought into contact with the counter surface with a pre-load of 10 N for 10 s prior to the test:
Figure 3b, and then separated with a speed of 500 mm/s:
Figure 3c. The separation force versus separation distance were recorded. For each sample, five tack measurements were done, and the average was taken as the final result. The contact area was calculated from the radius of curvature. The measurements were performed at room temperature.
Apparent crosslink density—various organic additives and impurities in vulcanizates were removed by extraction in toluene for 2 days and in acetone for another 2 days. After the extraction process, the samples were dried for 1 day at 60 °C in a vacuum oven. After drying, the vulcanizates were cut into specific shapes and a weight of 60 mg. The samples were swollen in toluene at room temperature to equilibrium swelling state and then removed from the solvent. The toluene on the surface of the sample was quickly blotted off with tissue. They were immediately weighed on an analytical balance and then dried in a vacuum oven. The volume fraction (
) of rubber in the swollen gel was calculated by Equation (1), and the apparent crosslink density (
) was calculated by using the Flory-Rehner [
20] theory according to Equation (2):
where
and
are the weight of polymer and weight of solvent in the swollen sample at equilibrium swelling.
is the density of un-swollen rubber vulcanizates, and
is the density of the solvent.
where
X is the polymer-solvent interaction parameter (0.36) [
21], and
is the molar volume of the solvent (106.3 cm
3 /mol). No correction of the crosslink density was applied for the fillers contained in the compounds, as the influence of the different filler combinations on the polymer-solvent interaction parameter is not known. However, as in the different types of compound formulations the amount of filler is constant, the swelling data can be mutually compared to provide what will be called apparent crosslink density.
Payne Effect (PE)—the storage modulus (G’) of the compounds was measured using a Rubber Processing Analyzer (RPA 2000 Alpha Technologies, Hudson, OH, USA). A strain sweep test was performed in the range of 0.56 to 100% strain at 0.5 Hz and 100 °C. The difference of G’ at 0.56% and at 100% strain (∆G’) was taken as measure of filler–filler interaction.
Vulcanization/cure behavior—scorch time (ts2), optimum cure time (t90) and Cure Rate Index (100/(t90–ts2)) were tested using a Rubber Process Analyzer (RPA 2000) at 150 °C, with a frequency of 1.67 Hz and 6.98% strain.
Stress–strain properties—all compounds were vulcanized at a cure time (t90 + 2) minutes at 150 °C in a Wickert Laboratory Press (WLP1600, Wickert Maschinenbau GmbH, Landau in der Pfalz, Germany). The sheets having a thickness of 2 mm (mm) were die-cut into dumbbells type 2 for the Modulus at 300% elongation (M300%) and Tensile Strength (TS) measurements. The tests were performed with a Zwick Roell Z1.0 tensile testing machine using a crosshead speed of 500 mm/min according to ISO 37.
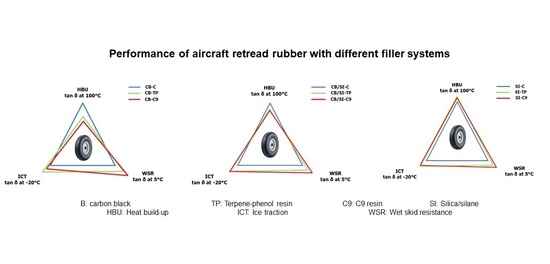
Tan δ in temperature sweep—samples were cut from vulcanized rubber sheets of 2 mm thickness. Measurements were performed using a Dynamic Mechanical Analyzer (DMA) GABO in two segmented conditions. The first condition employed was a temperature sweep in tension mode between −120 °C and 40 °C with 1 °C/min rate at a dynamic strain of 0.1%, static strain of 1%, and a frequency of 10 Hz. The second condition was a temperature sweep from −40 to 120 °C where the dynamic and static strain were set at 3%. The temperature increase rate, frequency and deformation mode were the same as described above. The glass transition temperature (Tg) of the compounds was taken as the temperature of the peak of the tan δ curve. Tan δ at −30 °C and tan δ at 5 °C were chosen as indicators of Ice Traction (ICT) and Wet Skid Resistance (WSR) of tire treads, respectively, while tan δ at 100 °C was used as indicator for hysteresis/Heat Build-Up (HBU).
4. Discussion
The replacement of an equivalent amount of oil by resin in the CB-filled compounds, combined with the high temperature above the softening point of the resin generated during mixing, results in similar end torques. In the CB/SI- and SI-systems, the addition of resins imparts lower mixing torque than in the control (
Figure 4). The temperature of silanization for both, the CB/SI- and SI-filled compound, was maintained at 150 °C, well above the softening points of the resins. Thus, the resins easily penetrate into the rubber matrix, decrease the intermolecular forces and facilitate filler incorporation and distribution into the rubber matrix.
The amount of resin is equal to the amount of oil in the CB-filled compound, hence no significant difference in MV is observed depending on the addition of oil or resin. In CB/SI- and SI-filled compounds, the controls contain no oil, therefore they impart high MV (
Figure 5). The silanization temperature of CB/SI- and SI materials was maintained at 150 °C, and at this temperature the resins were in liquid, viscous form. Therefore, they could easily penetrate between the polymer chains. The presence of low molecular weight molecules such as resins pushes the polymer chains apart and reduces the intermolecular force between rubber molecules, which increases the free volume and facilitates better filler dispersion, decreasing the MV. The results of MV (
Figure 5) are in line with the results of the mixing curves: lower end torques for lower MV (
Figure 4).
The incorporation of the higher molecular weight resins instead of oil increases the cohesive strength, thus increases the force needed for separation (
Figure 7a). CB-C shows a higher separation distance than CB-TP and CB-C9 (
Figure 7b). This may be because both CB-C and the carcass compound contain CB and oil. The surface energies of these two materials will not differ much, thus readily promoting contact and inter-diffusion when brought into contact. The separation distance increases because these compounds are more sticky; however, the force needed for separation is low due to poor cohesive strength of the compound due to the oil. The separation distance of compounds containing resins in both, the CB/SI- and SI-filled systems, is the same as their respective controls. This is most probably due to the fact that all compounds containing silica with or without resins have to overcome the surface energy difference with the carcass material containing CB and oil. In order for the contact area to increase, for interdiffusion and for bonding between the two surfaces to take place, the material must overcome this surface energy barrier. Compounds which have different compositions might need more time, higher pressure or temperature to overcome the surface energy difference.
The rheometer minimum torque S
min bears a relation to the mixing torque at the end of the mixing process and the MV, as can be seen by comparison with the data presented in
Figure 5. The maximum rheometer torque S
max or better the torque difference S
max-S
min is often quoted as a measure for crosslink density. However, this is not quite right as the intrinsic viscoelastic rigidity of the compounds, determined by filler–filler and preferred filler–polymer interactions also contribute to the S
max. Thus, the lower the S
min to start with, the lower the S
max at equal crosslink density (
Figure 8). The contributions of crosslink density and intrinsic viscoelastic rigidity cannot be separated in these curves. The S
max-S
min generally increases in the series of CB < CB/SI < SI, irrespective of whether the controls are compared or the TP or C9 variants. Furthermore, the TP and C9 compounds generally show a reduced S
max-S
min versus their controls (
Table 7). These rankings do qualitatively agree with those of the MV as presented in
Figure 5. It is a clear indication that the differences are not necessarily a sign of reduced crosslink density but, similar to MV, the result of stronger filler–polymer bonding and a larger free volume due to the addition of resins.
The replacement of CB by silica and the addition of resins does not result in large crosslink density differences for all systems (
Figure 9). The use of resins does neither negatively interfere with the network formation during vulcanization nor with the silanization reaction for systems containing CB/SI and SI; it has a small positive effect.
The viscosities of TP and C9 at 150 °C are 3400 and 650 mPa.s respectively [
11,
12]; the viscosity of TDAE oil at 100 °C is 17.86 mPa.s [
14]. Despite a higher viscosity of the resins compared to oil, they impart a similar PE in the CB system. The dispersion of CB in the polymer matrix is relatively easy due to the less developed filler–filler network of CB and the high compatibility of CB with the non-polar polymers. Therefore, replacing an equivalent amount of TDAE oil with resins in CB-filled compounds results in nearly the same PE as the CB-control. The addition of TP and C9 does not negatively interfere with the silanization and shows a slight improvement of silanization. A slight decrease in PE is observed in CB/SI- and SI-filled systems by the addition of resins from their respective controls (
Figure 10).
Compatible resins and rubbers will shift or broaden the tan δ peak region. In the case that resin and rubber are incompatible, two separate Tg-peaks are commonly visible in the tan δ curve as a function of temperature [
23] located at their original positions, at least if both are present in sufficient quantities. The use of resins shifts the tan δ peak of the vulcanizates slightly to a higher temperature compared to the controls (
Figure 11). This is clearly due to the addition of resins with high Tg and softening point, more for TP than for C9. As the Tg of the NR-phase as well as of the BR-phase shift with the addition of the resins (
Table 7), it may be taken as an indication that the resins have no particular preference for either of the two phases. However, due to the lower amount of BR versus NR in the formulation, the shift in Tg of BR is difficult to discern; thus, the BR-data in
Table 7 need to be taken with some reserve.
At −30 °C, the use of TP resin results in only a slightly higher ICT than for C9 in all filler systems. This is related to the shift of the tan δ peak as a consequence of using resins with a high Tg and molecular weight. At 5 °C, the C9 resin provides a higher WSR than TP and the respective controls in all filler systems. This seemingly contradictory observation is visible in the cross-over of the tan δ curves for TP and C9 around −20 °C, as seen for all three filler systems in
Figure 12. It relates to the structure of C9, which contains methyl groups on the aromatic rings from vinyltoluene and along the polymer chain from α-methylstyrene groups, providing more flexibility for rotation and movement than the bulky configuration of TP (
Figure 2). Thus, the mobility of the chains increases more for C9 than for TP at raised temperature, leading to relatively higher viscoelastic losses.
The use of resins for the CB-compounds raises the tan δ values at 100 °C, while for the pure SI-compound, it leads to a small but significant further reduction (
Figure 14). The effect in the SI-filled compounds is clearly the result of the chemical bonding of the rubber molecules to the silica surface by the coupling agent TESPT versus far less strong physical adhesion for the CB-reinforced compounds. It restricts release/adhesion or segmental motions of polymer segments on the filler surface and thus reduces mechanical loss phenomena on a molecular scale [
24]. The filler–rubber interaction present in the SI-filled compounds acts in a similar manner as multifunctional chemical crosslinkers, next to the crosslinks created by sulfur vulcanization.
An important point of consideration for this overall promising observation for the application in aircraft tire treads is, that the tan δ is a relative quantity between the lost and stored energy during deformation. It says nothing about the absolute values of the losses versus stored energy, as reflected by HBU. Although tan δ can be used as the first approximation of HBU, it is therefore necessary and highly valuable to verify these results with real tire tests, which were out of the scope of the present study. Hybrid filler systems can lead to nanocomposites having initial moduli which are much higher than based on an additional effect of the single fillers: the hybrid fillers show a synergistic effect concerning mechanical properties [
25]. This synergistic effect is explained by enhancement of the polymer-filler interfacial interactions. The interactive effect can be correlated to the enhancement of polymer-filler interfacial interactions. For example, hybrid organoclay (OCT) and CB result in a higher initial modulus than the neat CB due to the high aspect ratio, the ratio of length to the diameter of OCT. The same enhancement of mechanical properties was observed when carbon nanotubes (CNTs) were blended with CB. The improved properties of hybrid CNTs/CB specimens are due to increased polymer-filler interfacial interactions [
26].
For the compounds used in this study, the M300% reduces somewhat in going from CB- to SI-reinforcement, the tensile strength and elongation at break are significantly increasing. The hybrid CB/SI filler system does not lead to a higher modulus than the neat CB. This is caused by the use of silica, which does not lead to interfacial physical interaction between the polymer chains and the filler. Due to the difference in polarity, the affinity between rubber and silica is weak. The only possible interaction between silica and rubber is through chemical bonds formed by the coupling agent.
Slight increases in M300% and tensile strength with no significant difference in elongation at break were observed by the addition of resins in the CB/SI- and SI-filled rubber. All vulcanizates show comparable hardness, as was aimed for in this study.


