Comparison of Traffic Flow Models with Real Traffic Data Based on a Quantitative Assessment
Abstract
:1. Introduction
2. Theoretical Background
2.1. Modeling Equilibrium Traffic Flow Relationships
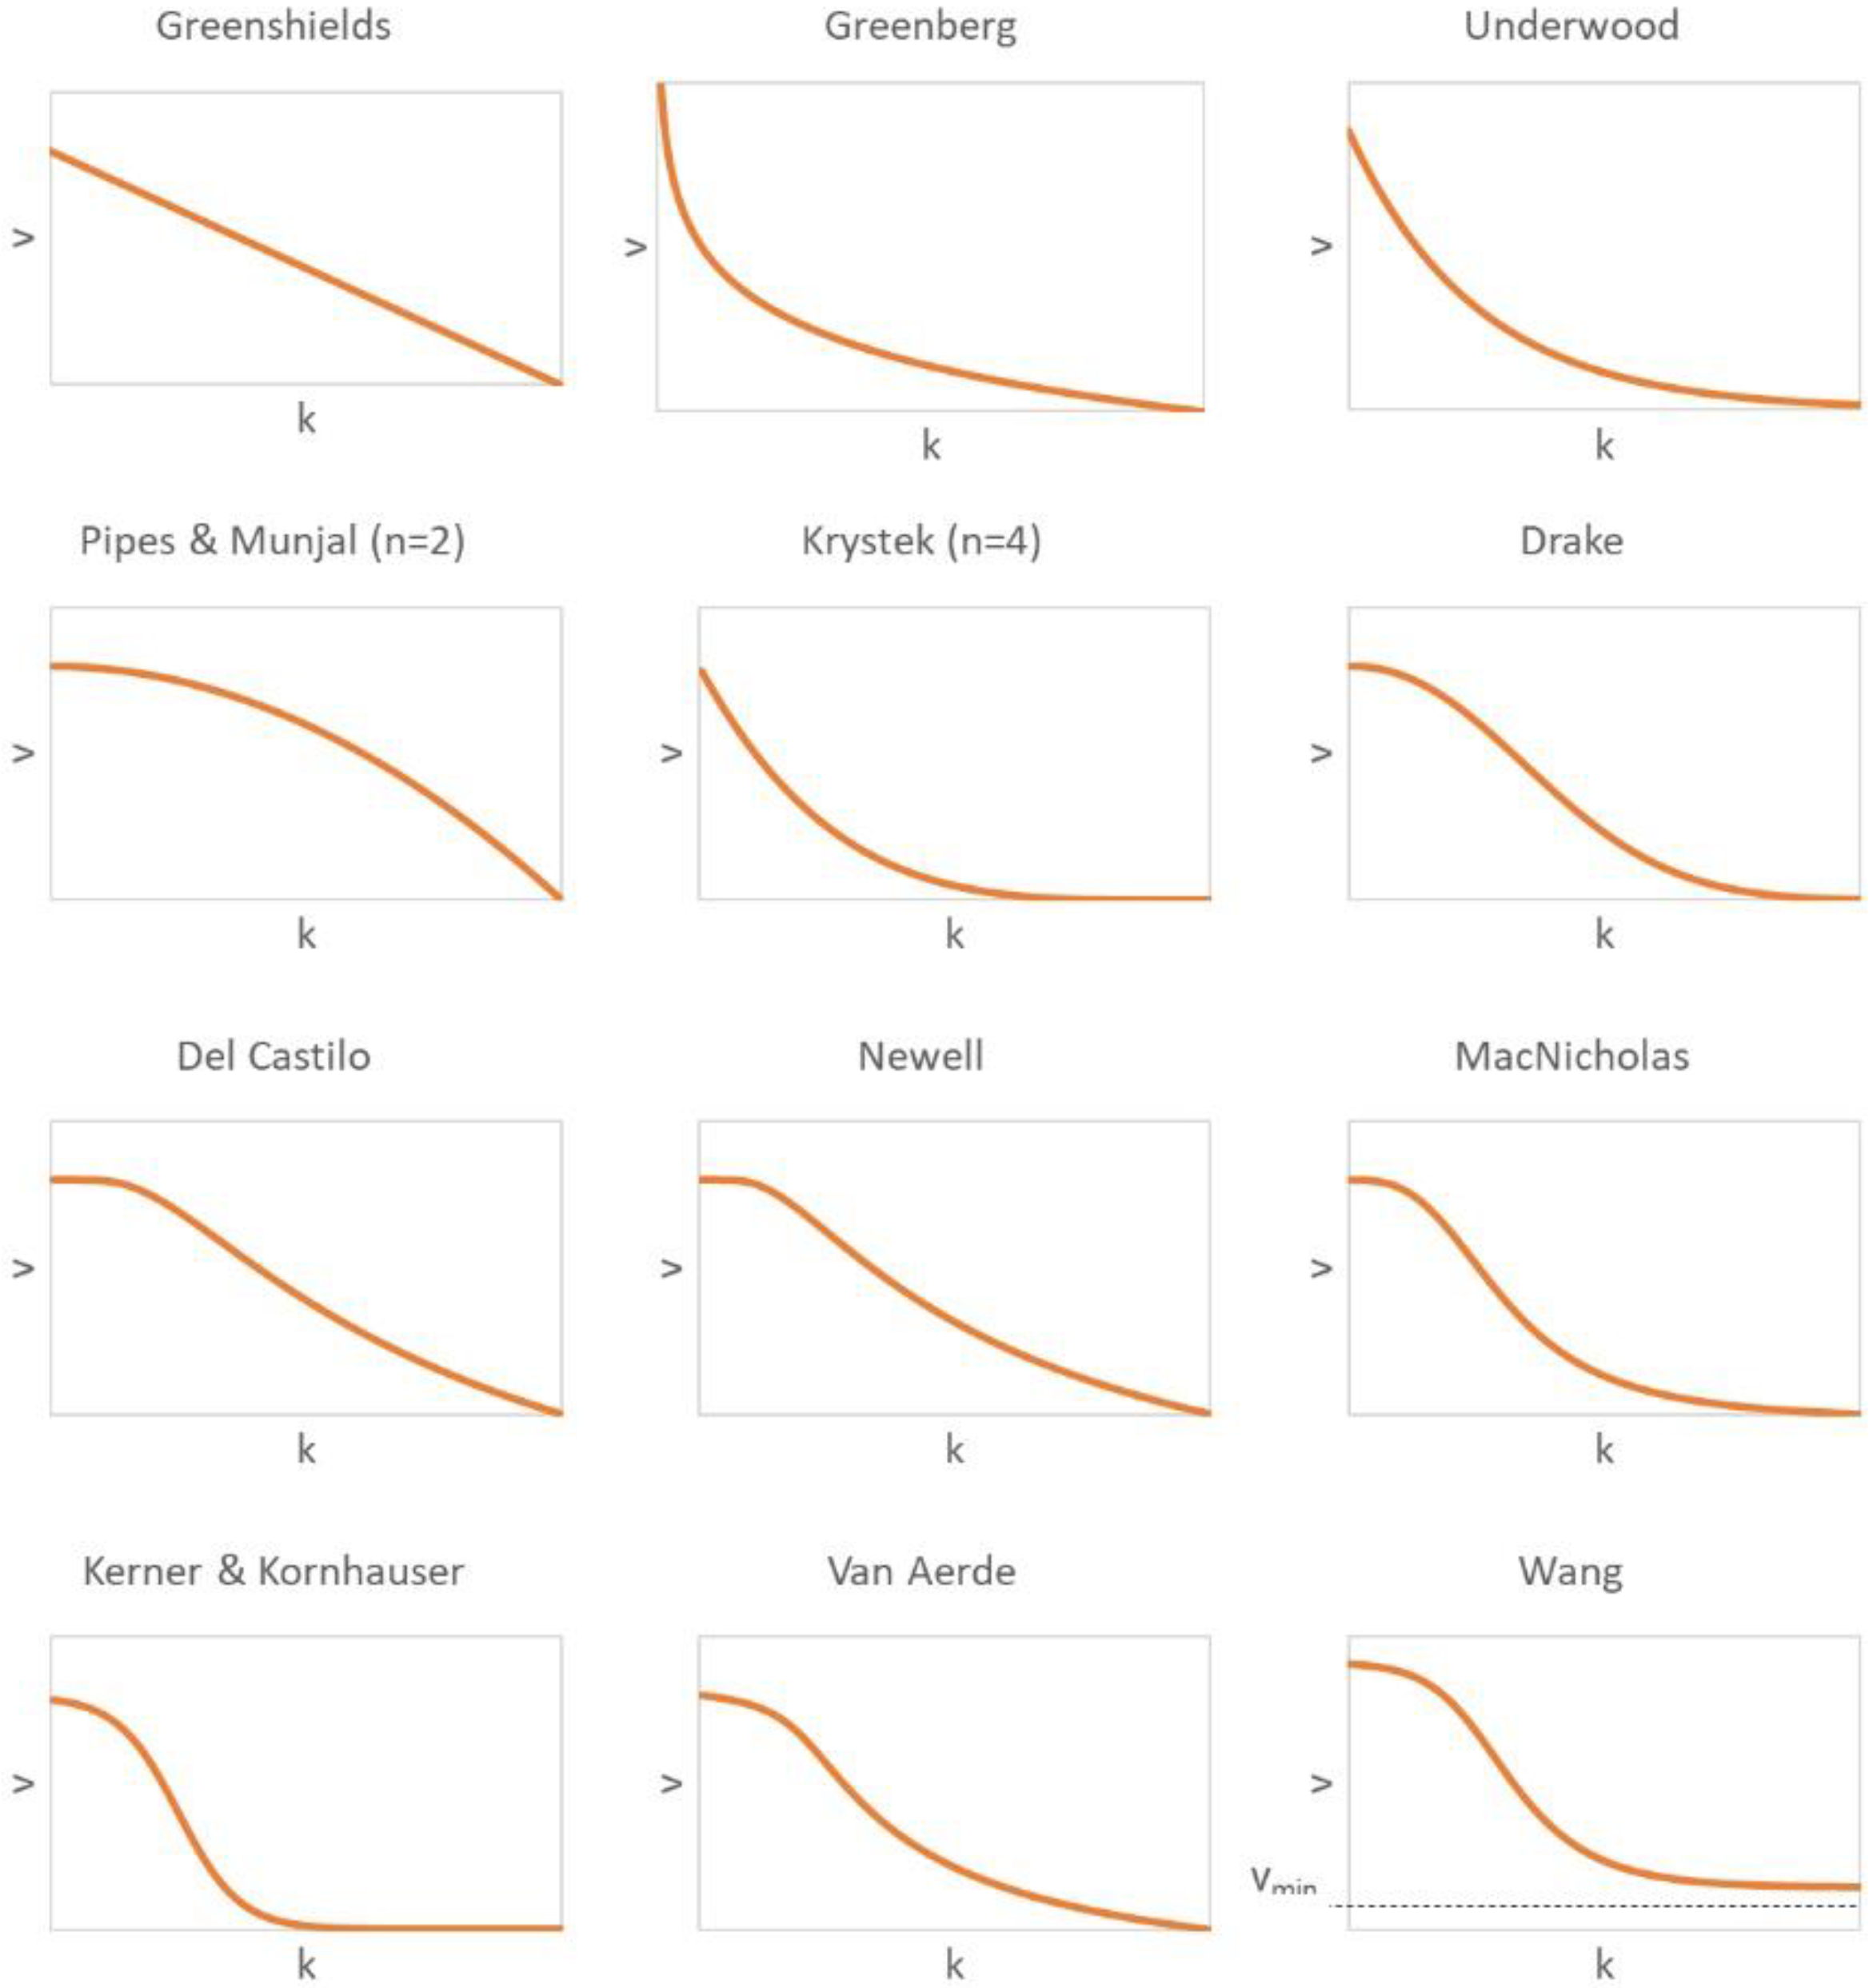
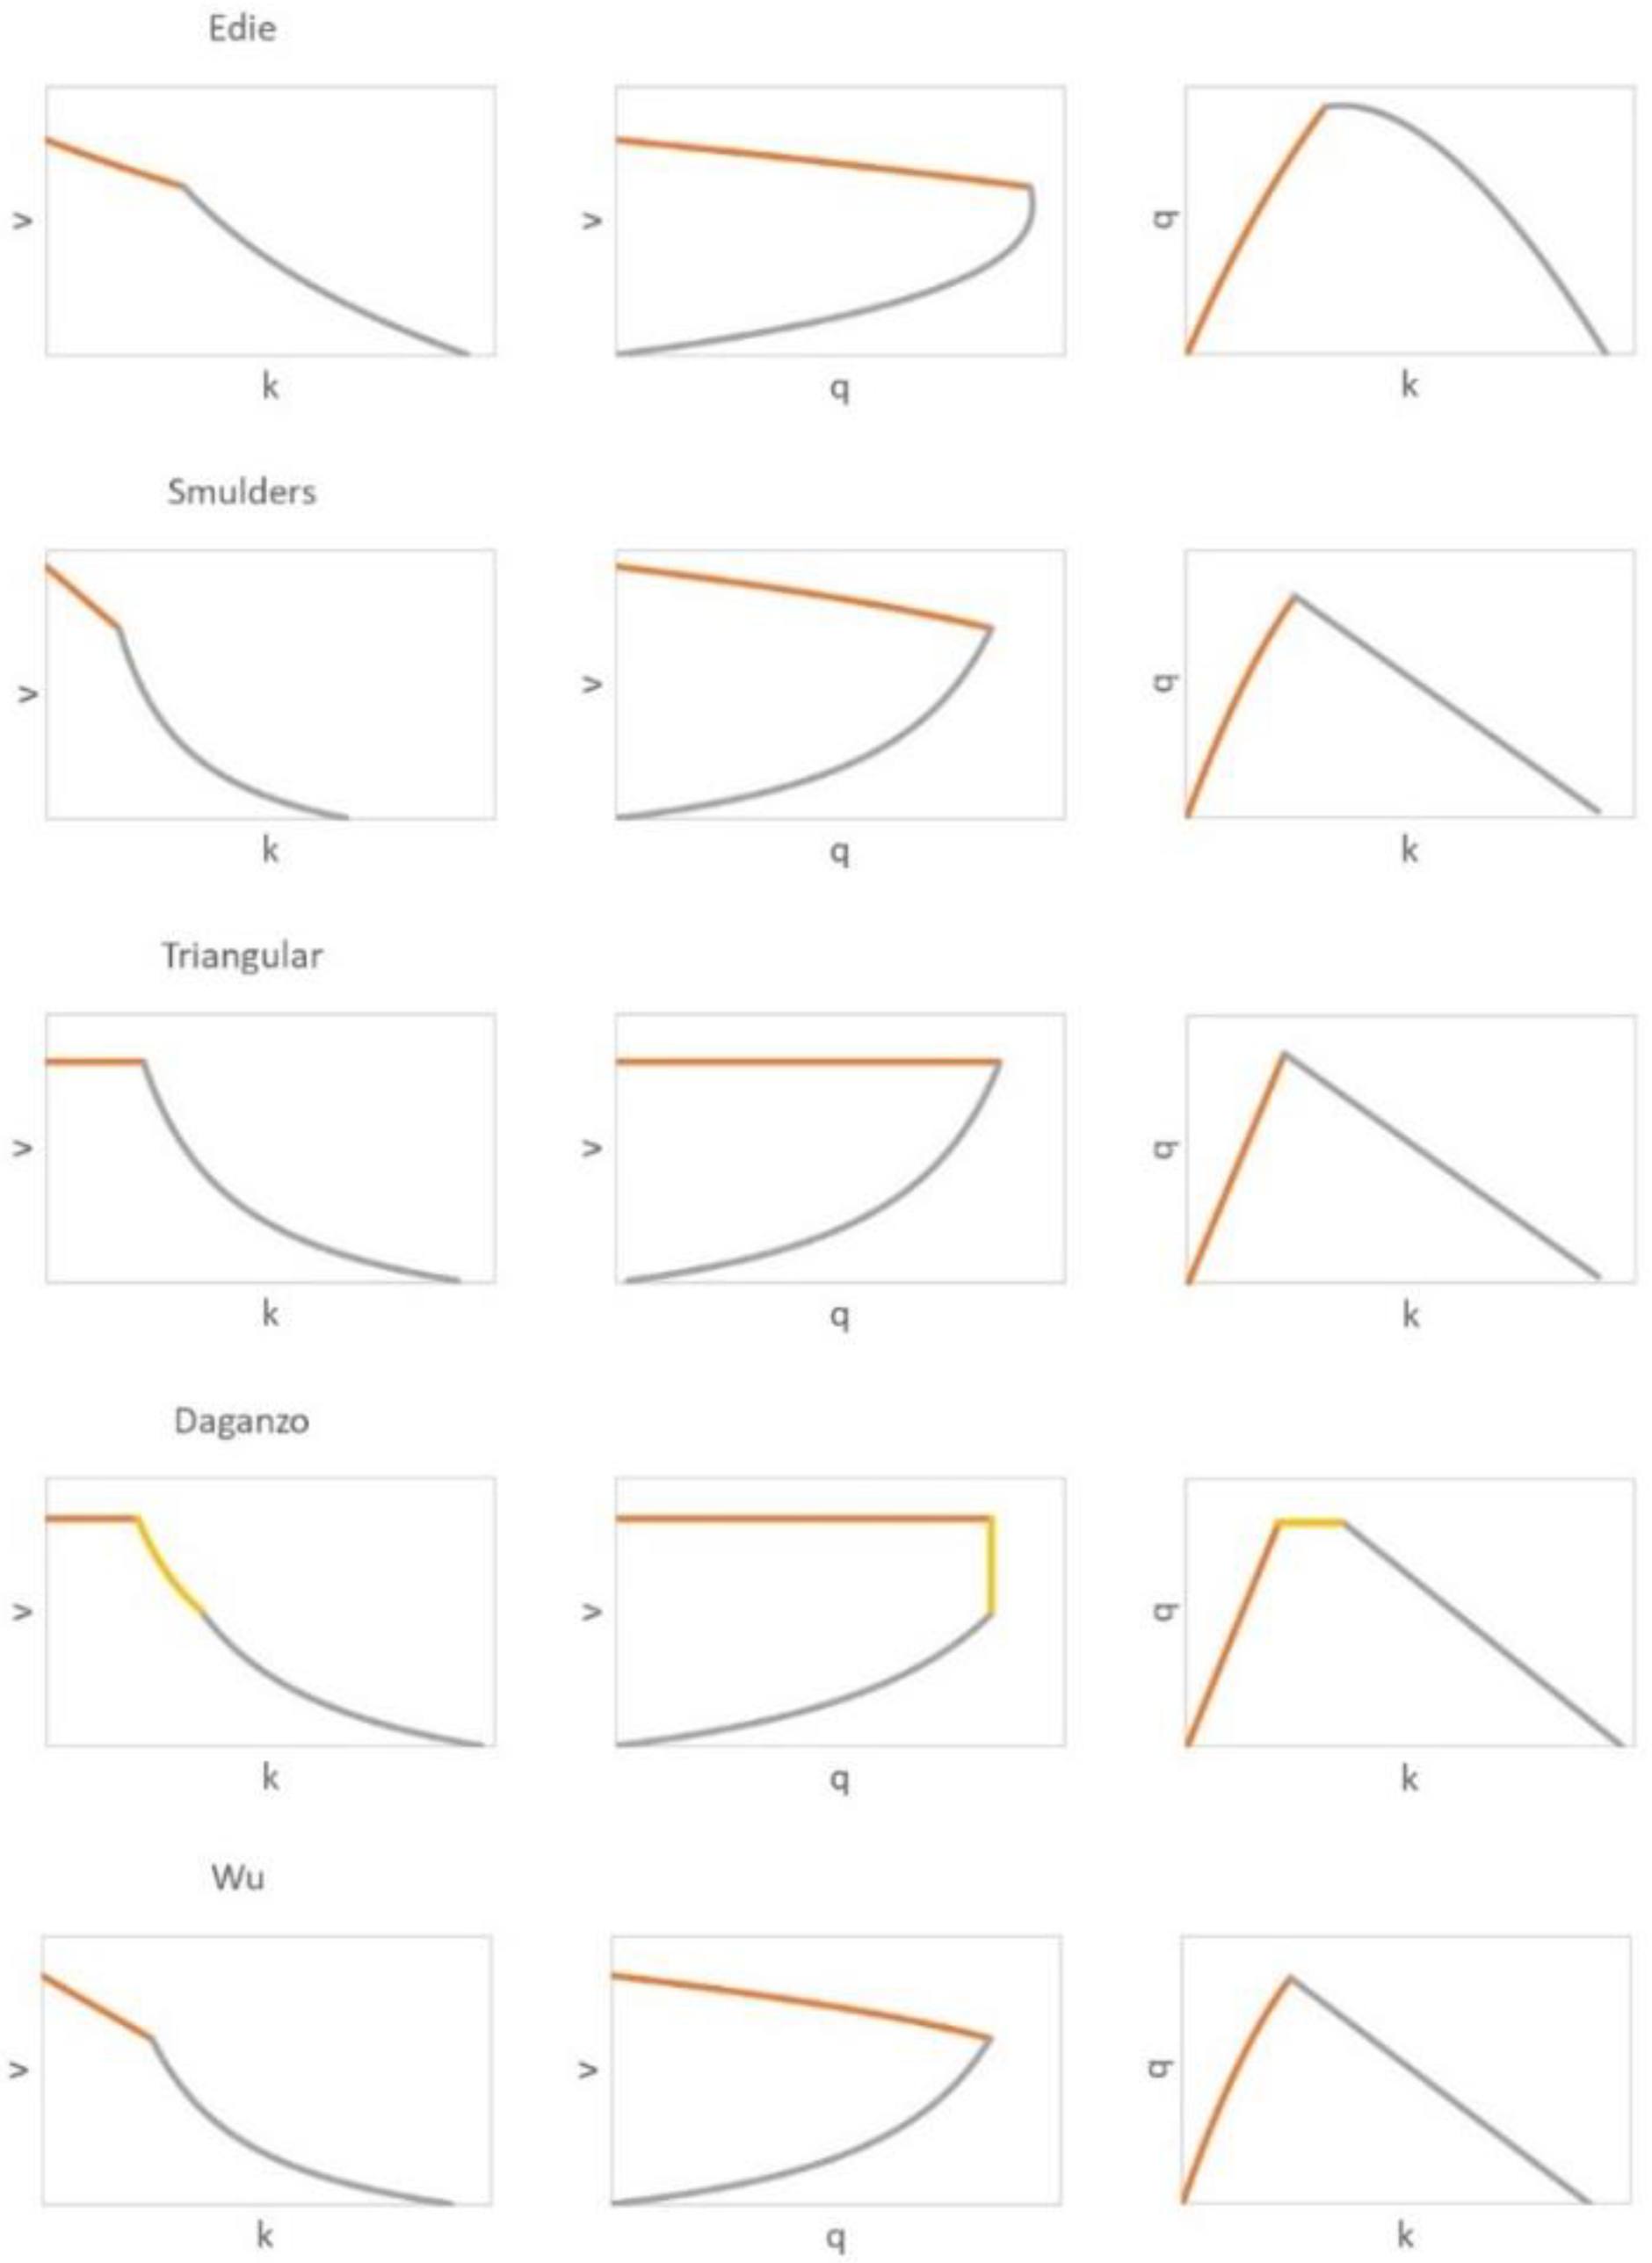
- Boundary points: free flow speed () occurs theoretically when volume and density approach zero (, ); maximal density () occurs when flow and speed approach zero (, );
- Extremes and points of inflection of the function: maximal flow () and the corresponding optimal speed () and optimal density ().
2.1.1. Single-Regime Traffic Flow Models
2.1.2. Multi-Regime Traffic Flow Models
2.2. Criteria and Methods for the Comparison of Traffic Flow Models
3. Materials and Methods
3.1. Data
- Raw traffic data that were provided by the national road authority (General Director for National Roads and Motorways, GDDKiA) in the text file format were imported to the database on the installed SQL server.
- The data were verified in terms of empty rows, zero values, vehicle speeds beyond the expected range, and unusual vehicle lengths. The problem of zeros or unusual values concerned approximately 2% of registered vehicles and had marginal impact on the number of registered vehicles—the records were excluded from further processing.
- Individual vehicle headways were calculated for each record.
- The data were aggregated into 5 min intervals generating information about traffic volume, space-mean speed, share of heavy goods vehicles, or average headways. The traffic volume was calculated into flow rate using passenger car equivalents [5]. Traffic density was determined from the relation (1).
3.2. Method
3.2.1. Preparation of the Data and Determination of Expected Parameter Values
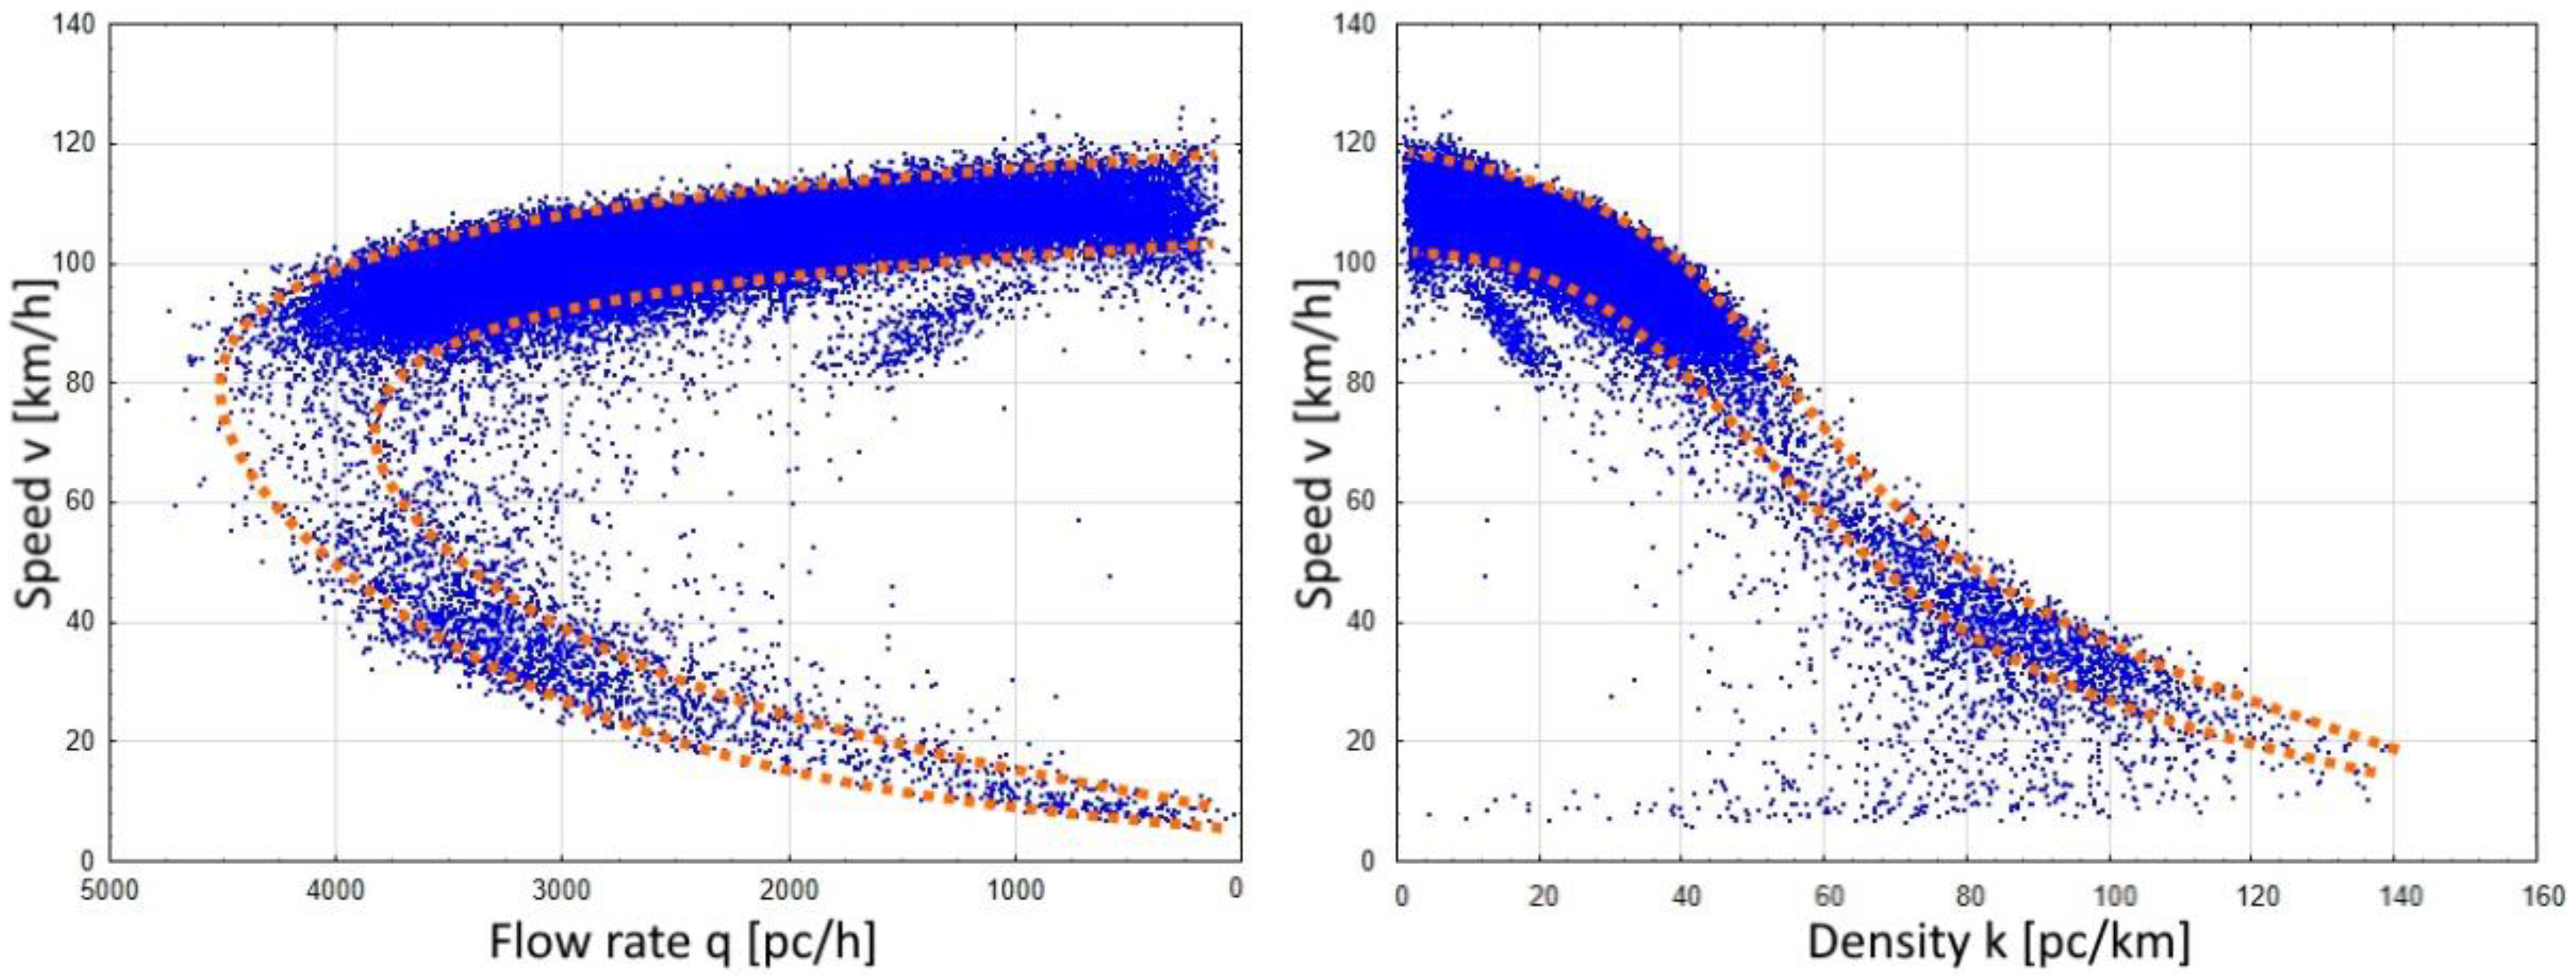
- , by determining the 5th and 95th percentiles of speed () under conditions of low traffic volume, i.e., for corresponding volumes of pc/h/lane;
- , by determining the 95th and 99th percentiles of traffic volume ();
- , by determining the 5th and 95th percentiles of speed () under conditions of high traffic volume, where and in free-flow traffic, i.e., assuming that km/h (to exclude the effect of vehicle stream speed in congested traffic);
- , by determining the 5th and 95th percentiles of density () occurring in the expected range of optimal speeds ().
3.2.2. Selection of Criteria and Adoption of Rules for Model Assessment
- Boundary conditions are met. A model representing the full range of traffic conditions should meet the following conditions:BC1: when andBC2: whenand exclusively in the case of two-regime models:BC3: , ,,The third boundary condition applies to identical values of boundary parameters in free-flow and congested traffic (input boundary parameters from the free-flow model can be input into the congested traffic model as constant values). Please note that BC3 excludes non-continuous models (with BC3, it is possible to compare single and two-regime models).
- Simplicity, which is measured with the number of parameters and equations in the model. It was assumed that the fewer the equations and parameters, the simpler, more practical, and more adaptable the model will be for the given road and traffic conditions.
- Empirical accuracy, which is measured with absolute and relative measures of goodness of fit, the RMSE, and MAPE, which are classical accuracy measures. The RMSE is expressed with units of a dependent variable, which means that it will be possible to establish the average difference in km/h between real and estimated values of speed. The MAPE expresses the average percentage difference between a real and estimated value.
- Values of boundary parameters are assessed mainly by comparing estimated boundary parameters with expected ranges as determined. If the value of an estimated parameter fits in within the expected range, we can say that the model is a good estimator of the particular parameter.
3.2.3. Model Calibration
3.2.4. Model Assessment and Comparison
4. Results
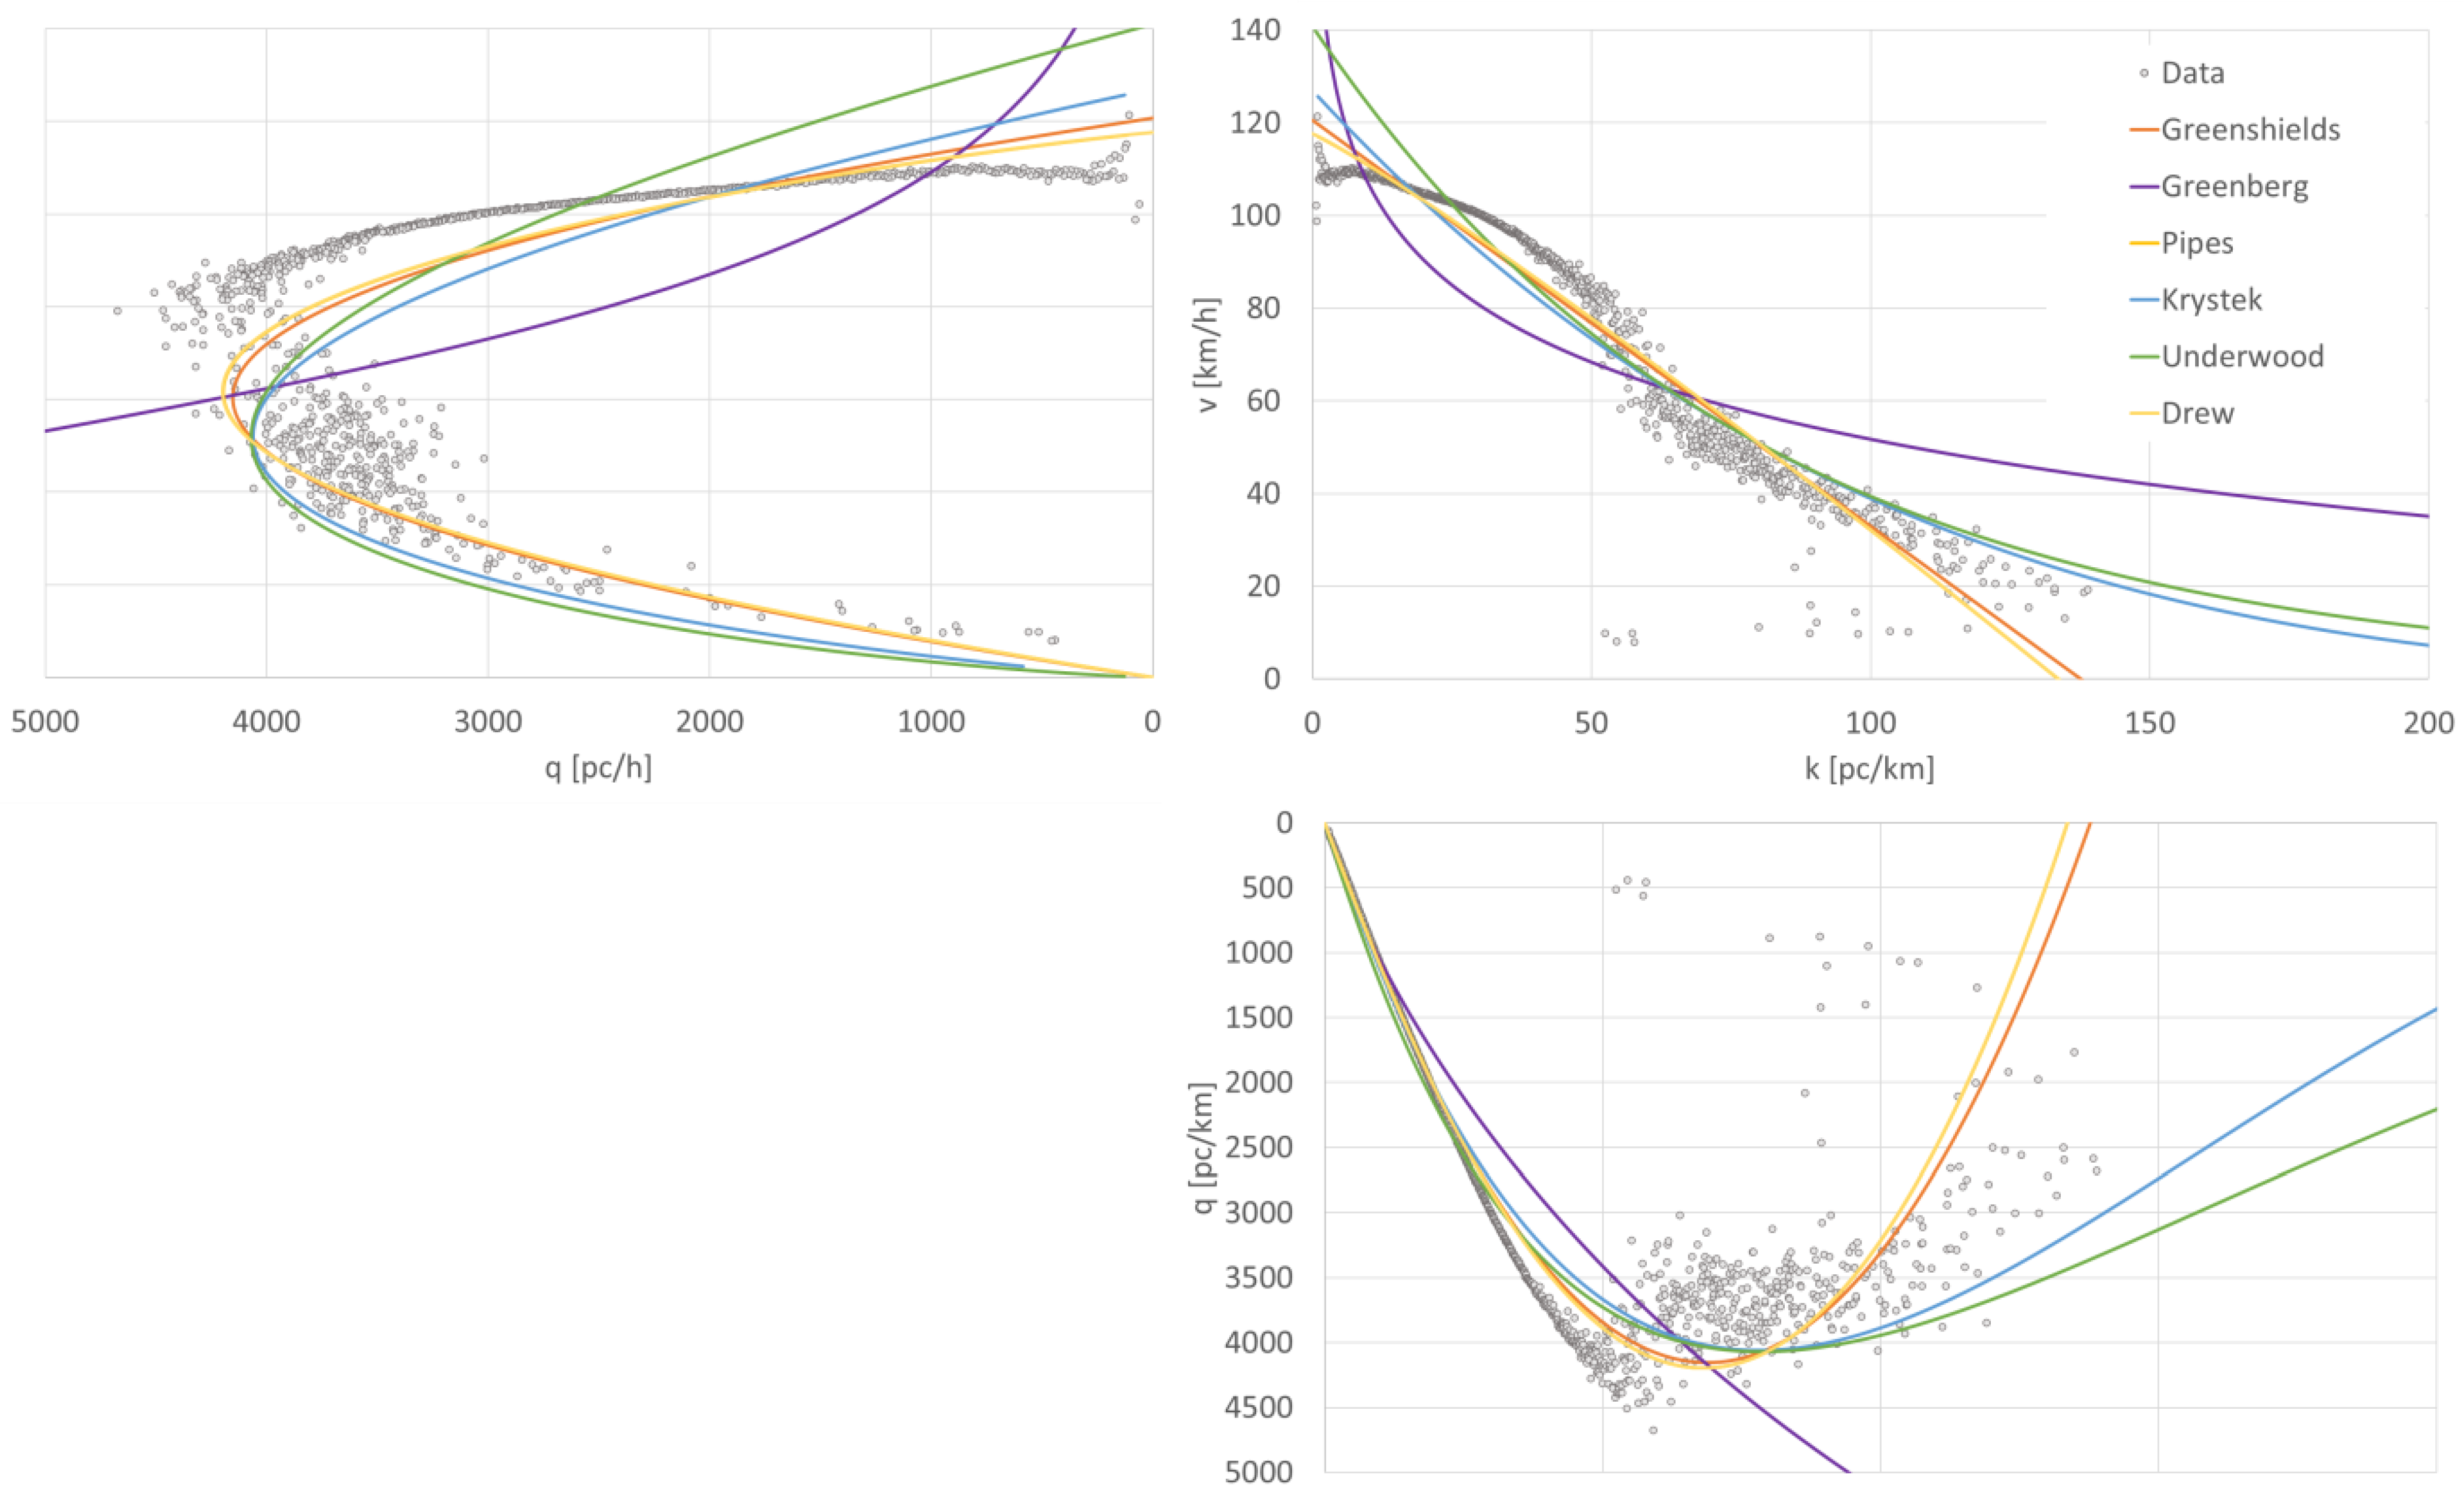
5. Discussion
Author Contributions
Funding
Institutional Review Board Statement
Informed Consent Statement
Data Availability Statement
Acknowledgments
Conflicts of Interest
References
- Greenshields, B.D. A study of traffic capacity. In Proceedings of the Fourteenth Annual Meeting of the Highway Research Board, Washington, DC, USA, 6–7 December 1934; Highway Research Board: Washington, DC, USA, 1935; pp. 448–477. Available online: http://pubsindex.trb.org/view.aspx?id=120649 (accessed on 6 September 2021).
- Castillo, J.M.D.; Benítez, F.G. On the functional form of the speed-density relationship—I: General theory. Transp. Res. Part B Methodol. 1995, 29, 373–389. [Google Scholar] [CrossRef]
- Wang, H.; Li, J.; Chen, Q.-Y.; Ni, D. Speed-Density Relationship: From Deterministic to Stochastic. In Proceedings of the 88th Transportation Research Board Annual Meeting, Washington, DC, USA, 11–15 January 2009. [Google Scholar]
- Wang, H.; Li, J.; Chen, Q.-Y.; Ni, D. Logistic modeling of the equilibrium speed-density relationship. Transp. Res. Part A 2011, 45, 554–566. [Google Scholar] [CrossRef]
- Transportation Research Board. Highway Capacity Manual 6th Edition: A Guide for Multimodal Mobility Analysis; Transportation Research Board of the National Academies: Washington, DC, USA, 2016. [Google Scholar]
- Baier, M.M.; Brilon, W.; Hartkopf, G.; Lemke, K.; Maier, R.; Schmotz, M. HBS2015 Handbuch für die Bemessung von Straßenverkehrsanlagen. Teil A - Autobahnen; Forschungsgesellschaft für Straßen- und Verkehrswesen (FGSV), Kommission Bemessung von Straßenverkehrsanlagen: Köln, Germany, 2015. [Google Scholar]
- Greenberg, H. An analysis of traffic flow. Oper. Res. 1958, 7, 79–85. Available online: http://links.jstor.org/sici?sici=0030-364X%28195901%2F02%297%3A1%3C79%3AAAOTF%3E2.0.CO%3B2-7 (accessed on 6 September 2021). [CrossRef]
- Lighthill, M.J.; Whitham, G.B. On kinematic waves. II. A theory of traffic flow on long crowded roads. Proc. R. Soc. A Math. Phys. Eng. Sci. 1955, 229, 317–345. [Google Scholar] [CrossRef]
- Underwood, R.T. Speed, volume and density relationships. In Quality and Theory of traffic Flow; Bureau of Highway Traffic, Yale University: New Haven, CT, USA, 1960; pp. 141–188. Available online: http://tft.eng.usf.edu/greenshields/docs/Greenshields_Quality_and_Theory_of_Traffic_Flow_1961.pdf (accessed on 14 August 2018).
- Ardekani, S.A.; Ghandehari, M.; Nepal, S.M. Macroscopic speed-flow models for characterization of freeway and managed lanes. Bul. Institutului Politeh. Din Iaşi 2011, 57, 149. Available online: http://www.bipcons.ce.tuiasi.ro/Archive/222.pdf (accessed on 13 August 2018).
- Pipes, L.A. Car following models and the fundamental diagram of road traffic. Transp. Res. 1967, 1, 21–29. [Google Scholar] [CrossRef]
- Krystek, R. Syntetyczny Wskaźnik Jakości Ruchu Ulicznego; Politechnika Gdańska: Gdańsk, Poland, 1980. [Google Scholar]
- Drew, D.R. Deterministic Aspects of Freeway Operations and Control; Research Report Number 24-4; Texas Transportation Institute: College Station, TX, USA, 1965; Available online: https://static.tti.tamu.edu/tti.tamu.edu/documents/24-4.pdf (accessed on 9 August 2017).
- Drake, J.S.; Schofer, J.L.; May, A.D. A statistical analysis of speed density hypotheses. Highw. Res. Rec. 1966, 154, pp. 53–87. Available online: http://onlinepubs.trb.org/Onlinepubs/hrr/1967/154/154-004.pdf (accessed on 27 December 2017).
- Kerner, B.S.; Konhäuser, P.; Schilke, M. Deterministic spontaneous appearance of traffic jams in slightly inhomogeneous traffic flow. Phys. Rev. E 1995, 51, 6243–6246. [Google Scholar] [CrossRef] [PubMed]
- Van Aerde, M. A single regime speed-flow-density relationship for freeways and arterials. In Proceedings of the 74th Transportation Research Board Annual Meeting, Washington, DC, USA, 22–28 January 1995. [Google Scholar]
- Rakha, H.; Crowther, B. Comparison of Greenshields, Pipes and Van Aerde car-following and traffic stream models. Transp. Res. Rec. J. Transp. Res. Board 2002, 1802, 248–262. [Google Scholar] [CrossRef]
- MacNicholas, M.J. A simple and pragmatic representation of traffic flow. In 75 Years of the Fundamental Diagram for Traffic Flow Theory; Greenshields Symposium; Transport Research Board: Woods Hole, MA, USA, 2011. [Google Scholar]
- Kucharski, R.; Drabicki, A. Estimating macroscopic volume delay functions with the traffic density derived from measured speeds and flows. J. Adv. Transp. 2017, 2017, 4629792. [Google Scholar] [CrossRef]
- Bureau of Public Roads. Traffic Assignment Manual for Application with a Large, High Speed Computer; Bureau of Public Roads: Washington, DC, USA, 1964.
- Smulders, S.A. Control of Freeway Traffic Flow; Stichting Mathematisch Centrum: Amsterdam, The Netherlands, 1989. [Google Scholar]
- Daganzo, C.F. Fundamentals of Transportation and Traffic Operations; Emerald: Bingley, UK, 1997. [Google Scholar]
- Knoop, V.L. Introduction to Traffic Flow Theory: An Introduction with Exercises; Delft University of Technology: Delft, The Netherlands, 2017; Available online: http://www.victorknoop.eu/research/book/Knoop_Intro_traffic_flow_theory_edition1.pdf (accessed on 27 December 2017).
- Myung, J.I.; Pitt, M.A. Model Comparison Methods. Methods Enzymol. 2004, 383, 351–366. [Google Scholar] [CrossRef] [PubMed]
- Gaddam, H.K.; Rao, K.R. Speed–density functional relationship for heterogeneous traffic data: A statistical and theoretical investigation. J. Mod. Transp. 2019, 27, 61–74. [Google Scholar] [CrossRef] [Green Version]
- May, A.D. Traffic Flow Fundamentals; Prentice-Hall, Inc.: Englewood Cliffs, NJ, USA, 1990; p. 464. Available online: http://books.google.com/books?id=JYJPAAAAMAAJ&pgis=1 (accessed on 11 September 2021).
- Rakha, H. Validation of Van Aerde’s simplified steadystate car-following and traffic stream model. Transp. Lett. 2009, 1, 227–244. [Google Scholar] [CrossRef]
- Cheng, X.U. Analysis of Traffic Flow Speed-density Relation Model Characteristics. J. Highw. Transp. Res. Dev. 2014, 8, 104–110. [Google Scholar]
- Ni, D.; Zheng, C.; Wang, H. A Unified Perspective on Traffic Flow Theory, Part III: Validation and Benchmarking. In Proceedings of the 11th International Conference of Chinese Transportation Professionals (ICCTP), Nanjing, China, 14–17 August 2011. [Google Scholar] [CrossRef]
- Romanowska, A.; Kustra, W. Permanent Traffic Counting Stations—Expressway S6 in Gdansk (Dataset Containing 5-min Aggregated Traffic Data and Weather Information). 2021. Available online: https://mostwiedzy.pl/en/open-research-data/permanent-traffic-counting-stations-expressway-s6-in-gdansk-dataset-containing-5-min-aggregated-traf,923120743943369-0 (accessed on 27 December 2017).
- Romanowska, A. Macroscopic traffic Flow Models for basic Motorways and Express Roads Sections. Ph.D. Thesis, Gdansk University of Technology, Gdansk, Poland, 2019. [Google Scholar]
- Coifman, B. Advancing Traffic Flow Theory Using Empirical Microscopic Data; NEXTRANS Project, No. 174OSUY2.2; The Ohio State University: Columbus, OH, USA, 2015. [Google Scholar]
- Wang, H.; Ni, D.; Chen, Q.-Y.; Li, J. Stochastic modeling of the equilibrium speed-density relationship. J. Adv. Transp. 2013, 47, 126–150. [Google Scholar] [CrossRef] [Green Version]
- van Wageningen-Kessels, F.; van Lint, H.; Vuik, K.; Hoogendoorn, S. Genealogy of traffic flow models. EURO J. Transp. Logist. 2014, 4, 445–473. [Google Scholar] [CrossRef] [Green Version]
- Jabari, S.E.; Zheng, J.; Liu, H.X. A probabilistic stationary speed-density relation based on Newell’s simplified car-following model. Transp. Res. Part B Methodol. 2014, 68, 205–223. [Google Scholar] [CrossRef]
- Zheng, L.; He, Z.; He, T. A flexible traffic stream model and its three representations of traffic flow. Transp. Res. Part C Emerg. Technol. 2017, 75, 136–167. [Google Scholar] [CrossRef]
- Rakha, H.; Arafeh, M. Calibrating steady-state traffic stream and car-following models using loop detector data. Transp. Sci. 2010, 44, 151–168. [Google Scholar] [CrossRef]
- Olszewski, P.; Dybicz, T.; Kustra, W.; Romanowska, A.; Jamroz, K.; Ostrowski, K. Development of the New Polish Method for Capacity Analysis of Motorways and Expressways. Arch. Civ. Eng. 2020, 66, 453–470. [Google Scholar] [CrossRef]
- Gavin, H.P. The Levenberg-Marquardt Algorithm for nonlinear Least Squares Curve-Fitting Problems. 2019. Available online: http://people.duke.edu/~hpgavin/ce281/lm.pdf (accessed on 24 May 2019).
- Van Aerde, M.; Rakha, H. Multivariate calibration of single regime speed-flow-density relationships. In Proceedings of the 6th International VNIS Conference, Seattle, WA, USA, 30 July–2 August 1995; IEEE: New York, NY, USA, 1995; pp. 334–341. [Google Scholar]


| Author (Year of Publication) | Basic Function | Parameters |
|---|---|---|
| Greenshields (1935) | ||
| Greenberg (1959) | ||
| Underwood (1960) | ||
| Newell (1961) | ||
| Pipes-Munjal (1967) | ||
| Northwestern(1967) | ||
| Drew (1965) | ||
| Krystek (1980) | ||
| Kerner and Konhäuser (1995) | ||
| Del Castillo and Benitez (1995) | ||
| Van Aerde (1995) | ||
| MacNicholas (2008) | ||
| Wang (2011) | ||
| Kucharski and Drabicki (2017) |
| Author (Year of Publication) | Basic Function | Parameters |
|---|---|---|
| Edie (1961) | ||
| , | ||
| Smulders (1989) | , where | |
| , | ||
| Triangular | , | |
| ,, | ||
| Daganzo (1997) | ||
| Wu (2002) | ||
| Par. | The Lower Range Limit | The Upper Range Limit | Condition | The Expected Range (Field Data) |
|---|---|---|---|---|
| pc/h/lane | km/h | |||
| pc/h | ||||
| km/h | ||||
| km/h | ||||
| pc/km | ||||
| based on aerial measurements | calculated assuming minimal headways of 5.5 m | n.a. | pc/km |
| Criterion | Equation | Explanation |
|---|---|---|
| 2 Simplicity | —number of parameters —number of equations the analyzed model weights (sum up to 1) | |
| 3 Empirical accuracy | or | the analyzed model |
| 4 Traffic flow parameters | number of the parameters of model , which are estimated correctly | |
| Final assessment | weights (sum up to 1) |
| Assessment Criteria | Single-Regime Models—Group 1 | Single-Regime Models—Group 2 | Two-Regime Models | |||||||
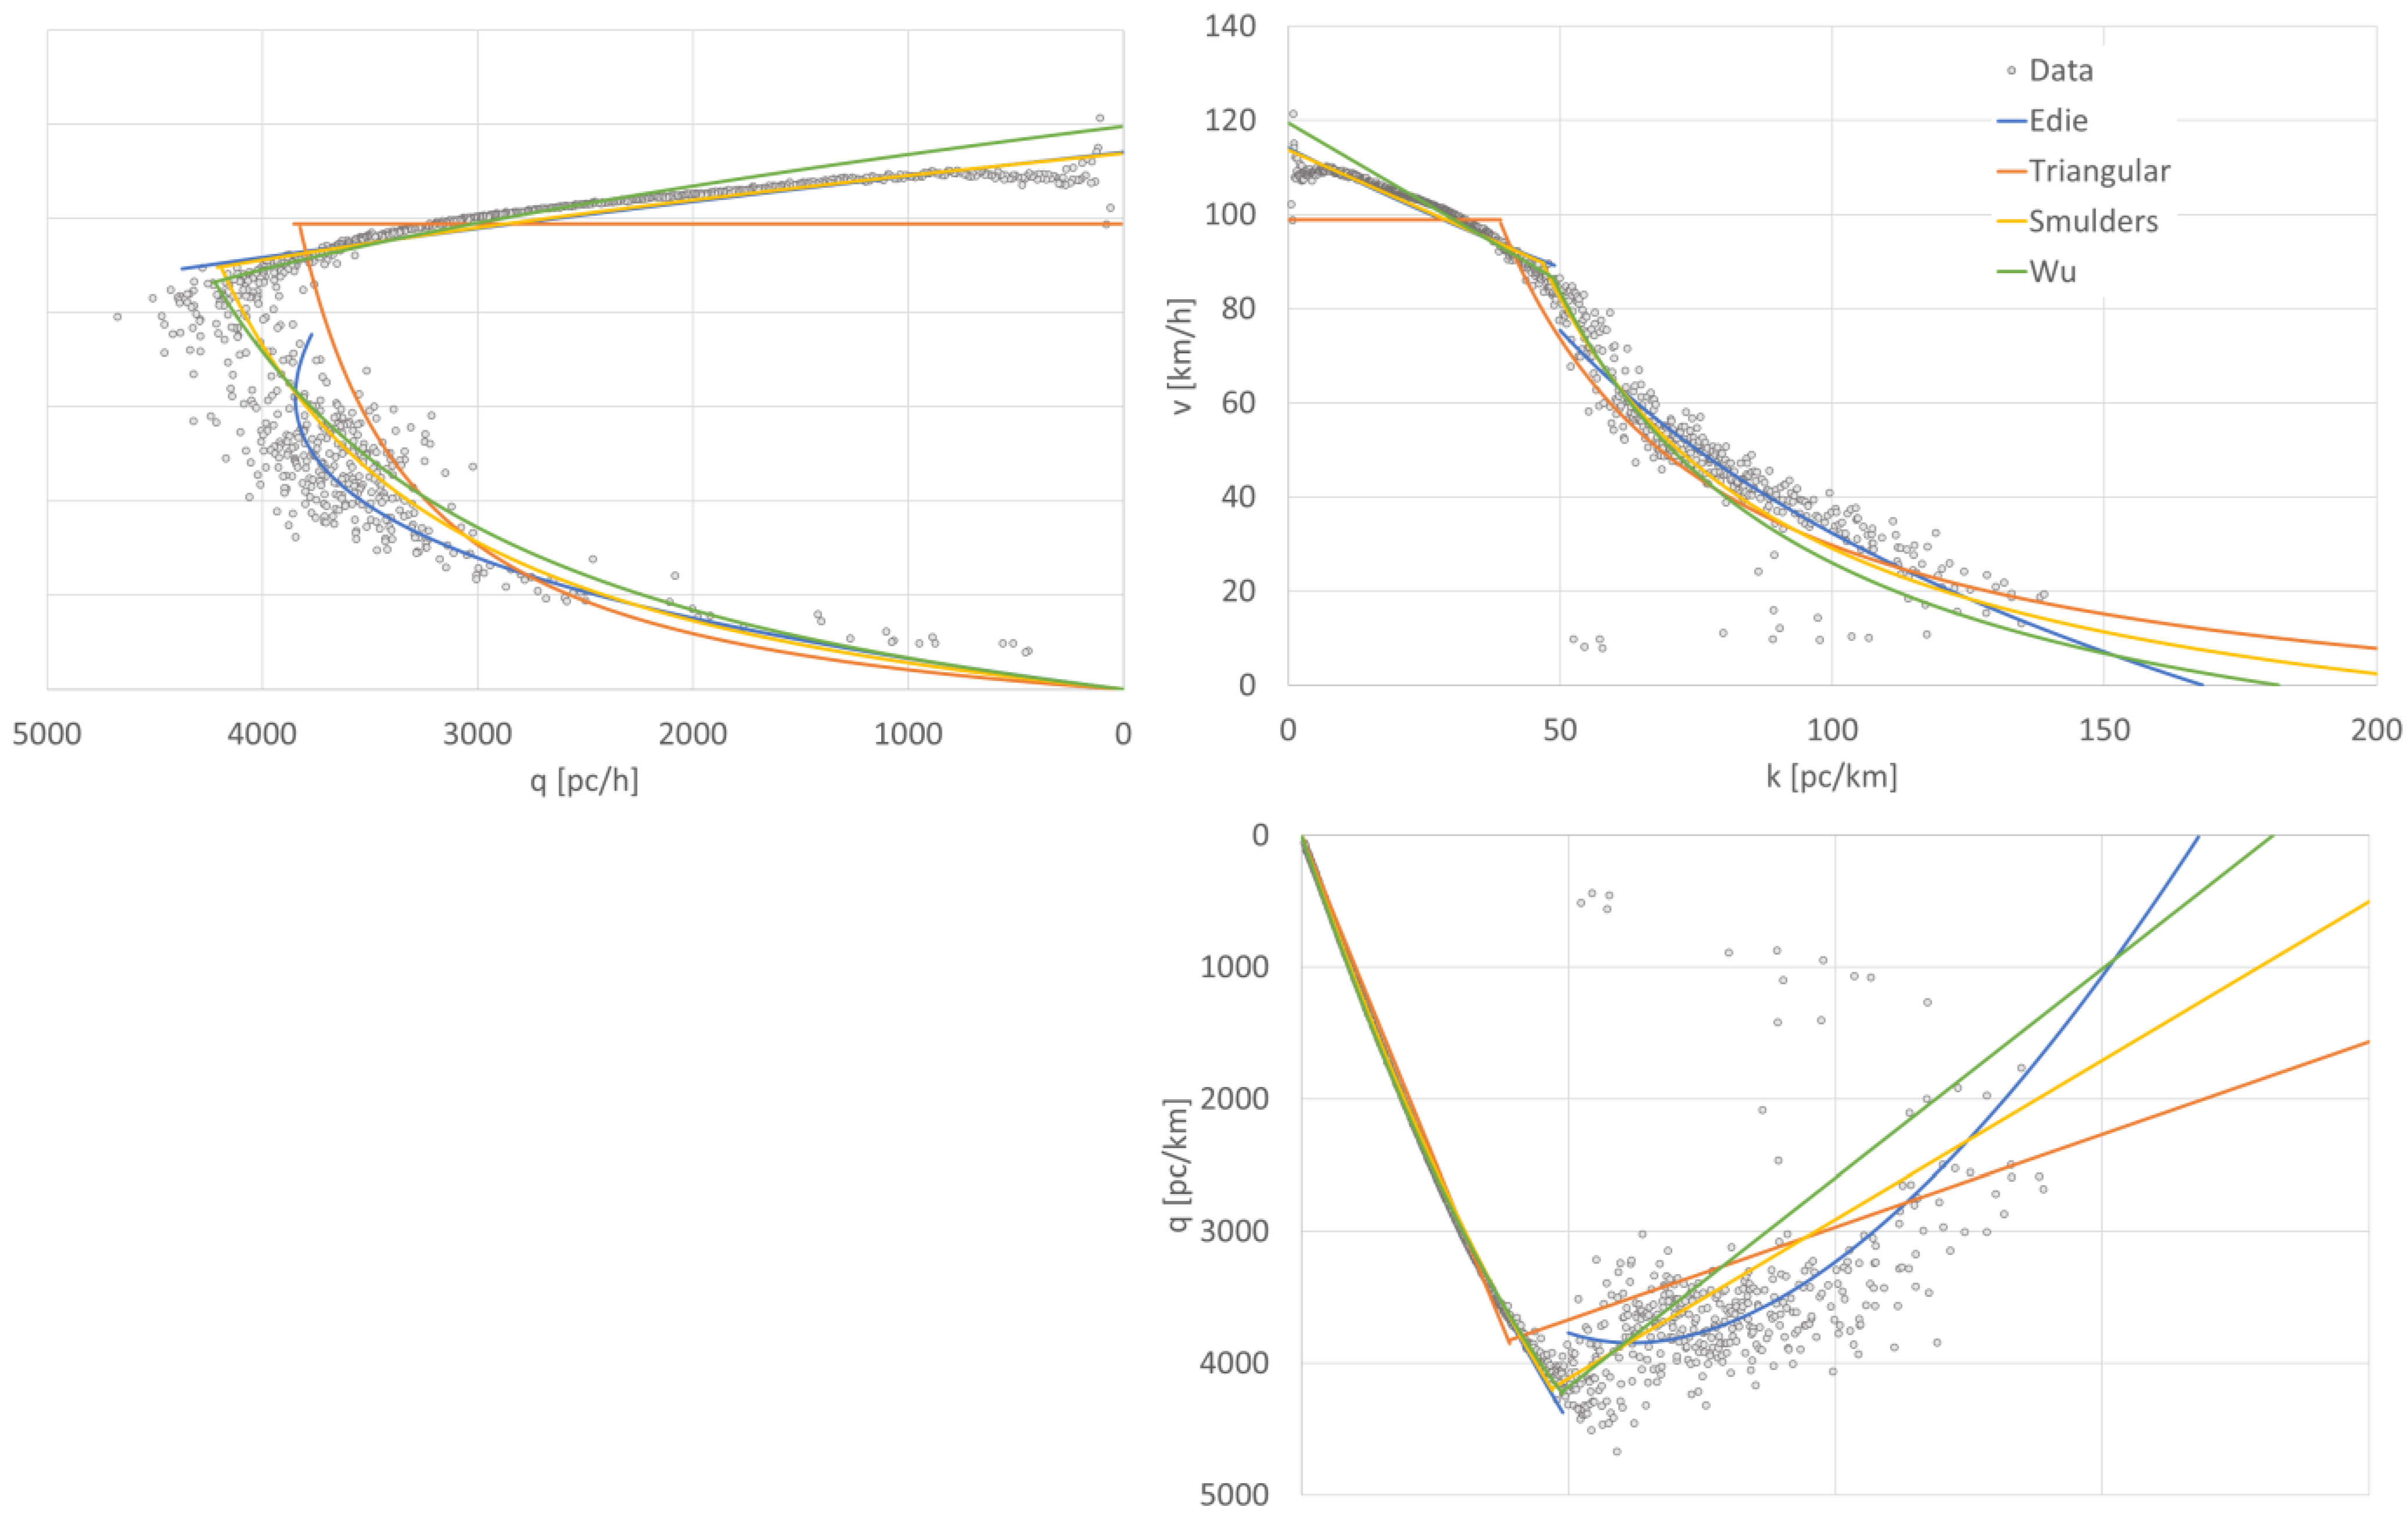
| Greenshields | Drew | Pipes-Munjal | Newell | Del Castillo | MacNicholas | Smulders | Triangular | Wu | ||
| 1 | Satisfied boundary conditions | |||||||||
| BC1 | + | + | + | + | + | + | + | + | + | |
| BC2 | + | + | + | + | + | + | + | + | + | |
| BC3 | n.a. | n.a. | n.a. | n.a. | n.a. | n.a. | + | + | + | |
| 2 | Simplicity | |||||||||
| No. of parameters | 2 | 3 | 3 | 3 | 3 | 4 | 3 | 3 | 7 | |
| No. of equations | 1 | 1 | 1 | 1 | 1 | 1 | 2 | 2 | 2 | |
| ca2 | 1.00 | 0.90 | 0.90 | 0.90 | 0.90 | 0.80 | 0.65 | 0.65 | 0.25 | |
| 3 | Empirical accuracy | |||||||||
| RMSE (km/h) | 7.95 | 7.86 | 5.64 | 6.29 | 6.29 | 6.04 | 6.00 | 22.58 | 6.85 | |
| MAPE (%) | 13.91 | 14.12 | 14.12 | 10.56 | 10.56 | 9.93 | 10.06 | 35.27 | 11.72 | |
| ca3 | 0.84 | 0.83 | 0.83 | 0.98 | 0.98 | 1.00 | 0.99 | 0.00 | 0.93 | |
| 4 | Parameter value (expected value) | |||||||||
| vsw (km/h) | 121 | 109 | 118 | 109 | 109 | 110 | 114 | 100 | 120 | |
| vopt (km/h) | 60 | 69 | 66 | 67 | 65 | 69 | 90 | 99 | 86 | |
| kmax (pc/km) | 138 | - | 134 | 160 | 160 | 370 | 221 | 383 | 182 | |
| kopt (pc/km) | 69 | 49 | 67 | 56 | 62 | 58 | 45 | 47 | 49 | |
| qmax (pc/h) | 4153 | 4010 | 4198 | 4001 | 4005 | 4010 | 4080 | 3936 | 4214 | |
| ca4 | 0.00 | 0.20 | 0.20 | 0.40 | 0.20 | 0.40 | 0.20 | 0.20 | 0.40 | |
| Final assessment | 0.61 | 0.64 | 0.64 | 0.76 | 0.69 | 0.73 | 0.61 | 0.28 | 0.53 | |
| Single-Regime Models—Group 1 | Single-Regime Models—Group 2 | ||||||
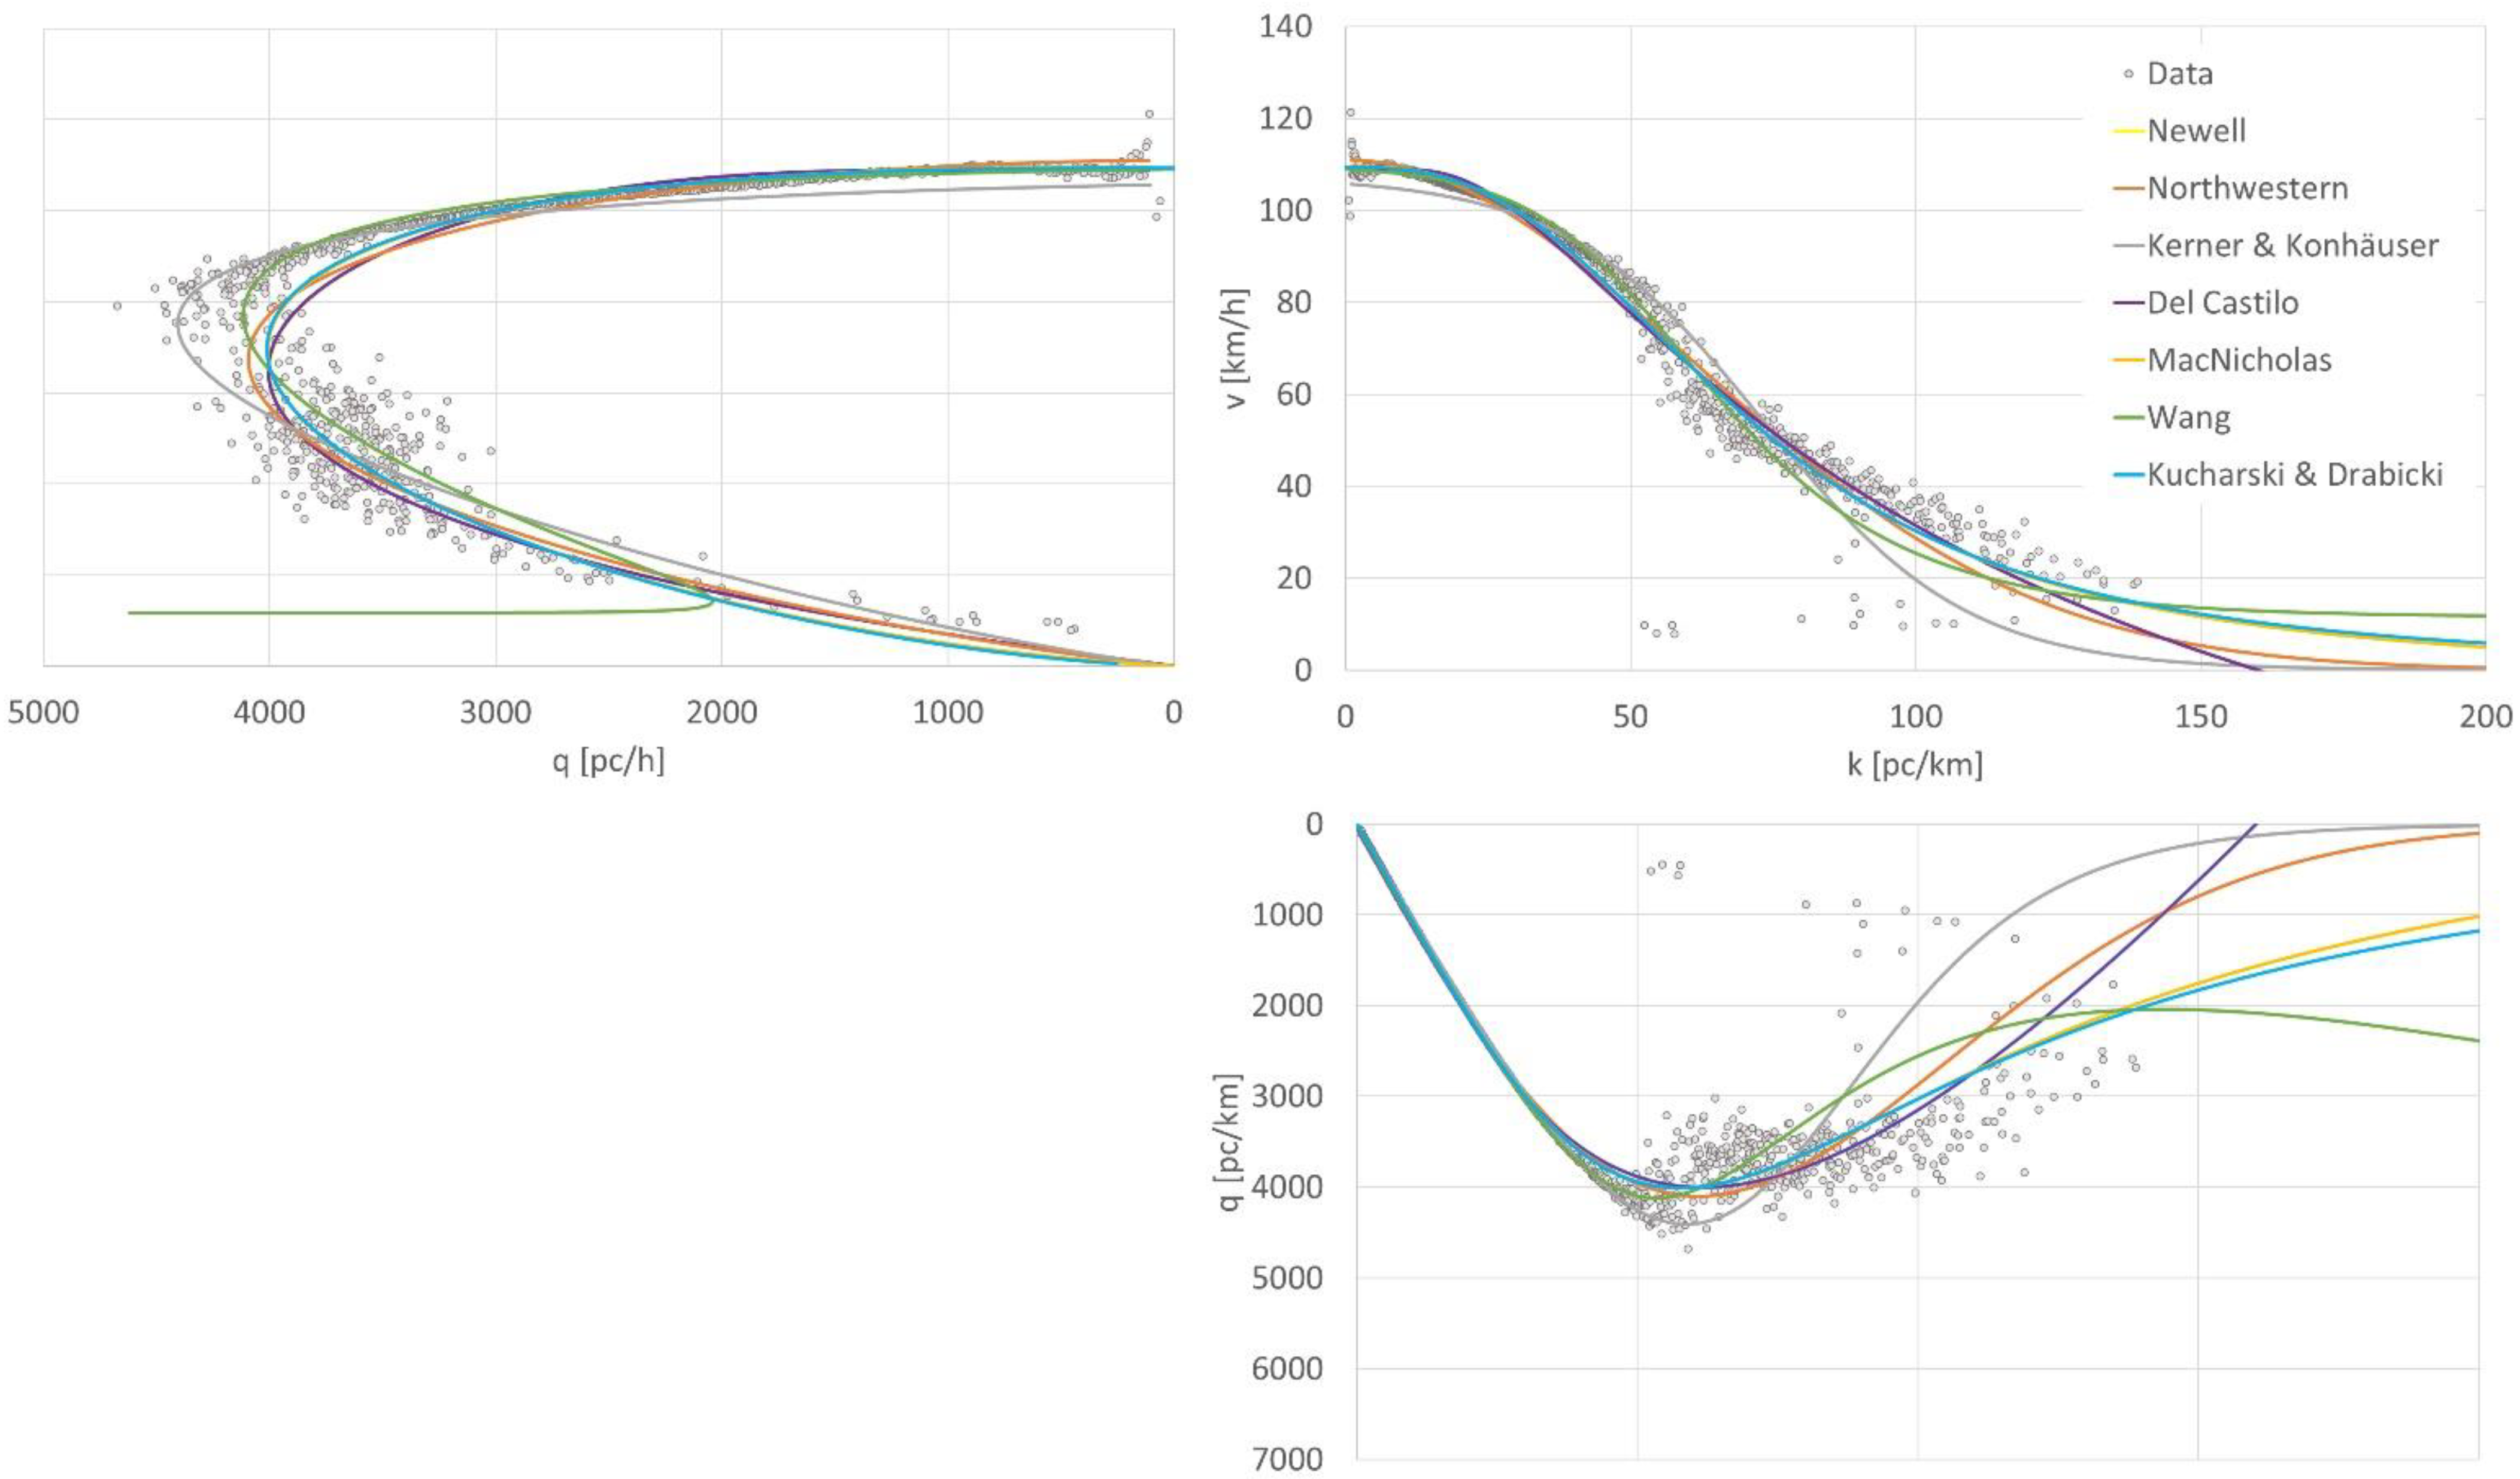
| Assessment Criteria | Krystek | Underwood | Northwestern | Kerner & Konhäuser | Wang | Kucharski & Drabicki | |
| 1 | Satisfied boundary conditions | ||||||
| BC1 | + | + | + | + | + | + | |
| BC2 | - | - | - | - | - | - | |
| BC3 | n.a. | n.a. | n.a. | n.a. | n.a. | n.a. | |
| 2 | Simplicity | ||||||
| No. of parameters | 2 | 2 | 2 | 2 | 4 | 4 | |
| No. of equations | 1 | 1 | 1 | 1 | 1 | 1 | |
| ca2 | 1.00 | 1.00 | 1.00 | 1.00 | 0.80 | 0.80 | |
| 3 | Empirical accuracy | ||||||
| RMSE (km/h) | 9.16 | 7.74 | 6.53 | 8.58 | 6.47 | 6.02 | |
| MAPE (%) | 15.25 | 11.30 | 11.28 | 15.14 | 10.99 | 9.88 | |
| ca3 | 0.79 | 0.95 | 0.95 | 0.79 | 0.96 | 1.00 | |
| 4 | Parameter value (expected value) | ||||||
| vsw (km/h) | 127 | 141 | 111 | 107 | 110 | 109 | |
| vopt (km/h) | 52 | 52 | 67 | 75 | 78 | 69 | |
| kmax (pc/km) | - | - | - | - | - | - | |
| kopt (pc/km) | 78 | 79 | 61 | 59 | 50 | 49 | |
| qmax (pc/h) | 4060 | 4071 | 4095 | 4407 | 4116 | 4010 | |
| ca4 | 0.00 | 0.00 | 0.20 | 0.40 | 0.60 | 0.40 | |
| Final assessment | 0.60 | 0.65 | 0.72 | 0.73 | 0.79 | 0.73 | |
Publisher’s Note: MDPI stays neutral with regard to jurisdictional claims in published maps and institutional affiliations. |
© 2021 by the authors. Licensee MDPI, Basel, Switzerland. This article is an open access article distributed under the terms and conditions of the Creative Commons Attribution (CC BY) license (https://creativecommons.org/licenses/by/4.0/).
Share and Cite
Romanowska, A.; Jamroz, K. Comparison of Traffic Flow Models with Real Traffic Data Based on a Quantitative Assessment. Appl. Sci. 2021, 11, 9914. https://doi.org/10.3390/app11219914
Romanowska A, Jamroz K. Comparison of Traffic Flow Models with Real Traffic Data Based on a Quantitative Assessment. Applied Sciences. 2021; 11(21):9914. https://doi.org/10.3390/app11219914
Chicago/Turabian StyleRomanowska, Aleksandra, and Kazimierz Jamroz. 2021. "Comparison of Traffic Flow Models with Real Traffic Data Based on a Quantitative Assessment" Applied Sciences 11, no. 21: 9914. https://doi.org/10.3390/app11219914
APA StyleRomanowska, A., & Jamroz, K. (2021). Comparison of Traffic Flow Models with Real Traffic Data Based on a Quantitative Assessment. Applied Sciences, 11(21), 9914. https://doi.org/10.3390/app11219914


