Article

Optical In-Process Measurement: Concepts for Precise, Fast and Robust Optical Metrology for Complex Measurement Situations

1
Bremer Institut für Angewandte Strahltechnik GmbH (BIAS), Klagenfurter Str. 5, 28359 Bremen, Germany
2
Angewandte Optik, Fachbereich Physik/Elektrotechnik, Universität Bremen, Otto Hahn Allee NW1, 28359 Bremen, Germany
3
MAPEX, Universität Bremen, Bibliothekstr. 1, 28359 Bremen, Germany
*
Author to whom correspondence should be addressed.
Appl. Sci. 2021, 11(22), 10533; https://doi.org/10.3390/app112210533
Submission received: 20 September 2021 / Revised: 19 October 2021 / Accepted: 31 October 2021 / Published: 9 November 2021
(This article belongs to the Special Issue Optical In-Process Measurement Systems)

Abstract

:
Optical metrology is a key element for many areas of modern production. Preferably, measurements should take place within the production line (in-process) and keep pace with production speed, even if the parts have a complex geometry or are difficult to access. The challenge for modern optical in-process measurements is, therefore, how to simultaneously make optical metrology precise, fast, robust and capable of handling geometrical complexity. The potential of individual techniques to achieve these demands can be visualized by the tetrahedron of optical metrology. Depending on the application, techniques based on interferometry or geometrical optics may have to be preferred. The paper emphasizes complexity and robustness as prime areas of improvement. Concerning interferometric techniques, we report on fast acquisition as used in holography, tailoring of coherence properties and use of Multiple simultaneous Viewing direction holography (MultiView), self reference used in Computational Shear Interferometry (CoSI) and the simultaneous use of several light sources in Multiple Aperture Shear Interferometry (MArS) based on CoSI as these techniques have proven to be particularly effective. The use of advanced approaches based on CoSI requires a transition of the description of light from the use of the well-known wave field to the coherence function of light. Techniques based on geometric optics are generally comparatively robust against environmental disturbances, and Fringe Projection (FP) is shown to be especially useful in very demanding measurement conditions.

1. Introduction

Optical metrology is an important part of modern production [1,2], since light can be most easily and quickly tailored according to measurement requirements, is contact-free and can usually be employed as non-damaging. Concerning the setting of the measurement with respect to the production environment, there seems to be no generally accepted terminology on the definition of terms such as in-process or in situ metrology [3] and the like [4]. Recently, Gao et al. gave an extensive overview on surface metrology for precision manufacturing [1]. In their paper, the authors classify the related terms “so that they can be used distinguishably and properly [...] in the manufacturing community”. The following items show their classification:
  • In situ surface metrology: Measurement of the workpiece surface is carried out on the same work floor and in the same manufacturing environment, without isolating the workpiece from the manufacturing environment.
  • In-line/On-line surface metrology: Measurement of the workpiece surface is carried out on a production line without moving the workpiece outside the production line.
  • On-machine surface metrology: Measurement of the workpiece surface is carried out on a manufacturing machine where the workpiece is manufactured.
  • In-process surface metrology: The on-machine measurement of the workpiece surface is carried out while the manufacturing process is taking place.
The classification given above will be used in the present paper as well. The authors of [1] further distinguish >> “pre-process” on-machine surface metrology << conducted before the manufacturing process and >> “post-process” on-machine surface metrology << conducted after the manufacturing process. These terms, especially the last one, will not be used here, since it is easily confused with the common understanding of [3].
  • Post-process measurement: The measurement occurs after the finished workpiece is removed from the machine. A typical scenario is a measurement using a coordinate measuring machine to inspect the finished workpiece. Post-process measurements usually can afford time-consuming procedures and dedicated inspection areas, e.g., with vibration isolation, constant temperature or the like and is thus often used for high precision metrology that is not applicable in a production environment.
The challenge for modern optical metrology is how to create techniques that are simultaneously precise, fast, robust and capable of handling geometrical complexity in order to be useful as in-process or in situ measurement. Figure 1 shows the “Tetrahedron of Optical Metrology” for the characterization of measurement tasks and measurement systems [5]. It describes the measurement speed (S), the measurement uncertainty, named precision (P) here for short, the tolerance with respect to disturbances, such as mechanical vibrations, described as robustness (R), and the influence of the geometrical properties of the measurement object or the measurement situation, described as geometrical complexity (C). For every combination of S, P, R and C, there is a characteristic filling of the tetrahedron. Most measurement systems have their strengths in one or two of these properties, but the challenge lies in the combination of these properties.
Requirements for measuring systems result from the respective measuring task. For example, the measurement of a component with a component tolerance of 0.5 μ m requires a measurement uncertainty of ≤50 nm, the scanning of an area of 1 cm 2 in steps of 1 μ m in 1 s requires a data rate of 100 million points/s, and with a vibration amplitude of approximately 2 mm at 10 Hz, there is an acceleration of approximately 1 g. The geometric complexity of the object increases from spheres to aspheres to freeform surfaces deviating strongly from aspheres up to complex free forms, which may contain poorly accessible areas, holes or cavities.
Within Figure 1a, the small darker volume shows a typical situation for conventional interferometry in relation to the parameters of the tetrahedron. Optical metrology based on interferometrical methods [6] is usually very precise, but (intrinsically) also sensitive to mechanical disturbances. Vibrations of the object or optical components of the measurement setup can change the phase relationship of the reference and object beam to one another and may thus corrupt the measurement [7]. An overview of harsh measurement conditions that require robust metrology approaches is given in Reference [8]. In addition, conventional interferometry tends to have difficulties measuring geometrically complex objects as will be dealt with in this paper.
There is a great variety of techniques for optical metrology. Fundamentals and principles are, for example, described in References [6,9,10,11,12], practical applications are outlined, for example, in References [13,14,15,16]. The size of measurement objects in most cases ranges from sub- μ m to several m [2,13,17], in some cases even to the km-range [18]. It is, however, not the purpose of this paper to give a general overview on optical metrology but to demonstrate approaches that show a high potential to boost the performance of optical metrology for in-process measurements.

2. Methods and Scope of Approaches for In-Process Optical Metrology

In this paper, we emphasize two principal approaches for measuring shape, position or surface properties of objects: Geometric metrology using incoherent light is described by the laws of ray optics and uses structured light, mainly in the form of dynamic stripe patterns. Measurement techniques based on interferometry [19] are described by wave optics and use interference of light and the resulting fringe patterns. In general, the light is divided into two partial beams, one of which serves as a reference beam and the other as a measurement beam that interacts with the measurement object and thereby changes its phase distribution. If both partial beams are allowed to interfere with each other, the shape of the measurement object can be determined with very high accuracy, i.e., with a very low measurement uncertainty down to the nm range. More rugged approaches use differential techniques, which will be described later. It should be noted that interferometry is not necessarily associated with the use of laser sources. For a comparison of the methods, see, e.g., Reference [20].
One of the crucial requirements of in-line or even in-process inspection is the immunity towards mechanical distortions, which are unavoidable in a production environment. For metrology based on interferometry, this means a significant challenge. Interferometry is usually employed if high precision is required. However, vibrations with amplitudes 10 or 100 times larger than the measurement uncertainty shall not disturb the measurement. One solution is one-shot approaches with short exposure times, as can be employed in the case of digital holography. Another elegant solution to this problem is differential methods, which are intrinsically immune to vibrations.
At BIAS, we are concentrating on the interferometry-based techniques of Digital Holography (DH) and Computational Shear Interferometry (CoSI) and the geometrically based techniques of Deflectometry and Fringe Projection (FP). The following sections provide examples of measurements on small, medium and large scale objects and demonstrate, with respect to the scope of this paper, the development of robust, precise and fast measurement systems for complex measurement situations.

3. Selected Results of Optical Metrology Techniques

3.1. Techniques Based on Interferometry

3.1.1. Rapid Holographic Shape Measurement of Micro Parts

A 100% quality inspection of metallic micro components often fails due to the compromise between precision and speed. We therefore developed a fast measurement detection and quality inspection of micro components [21]. The system is based on digital holography (DH), an interferometric technique that allows to extract shape data from one or more recorded holograms [22].
The great advantage of DH is that the required holograms can be recorded within a fraction of a second, while it allows measuring with interferometric precision [11]. Additionally, the focus can be adjusted subsequent to the measurement, which allows for an extended depth of focus without the requirement of an optical scanning process. Finally, because digital holographic shape measurement is based on the evaluation of the phase of light, it does not require a triangulation base and can therefore be used to inspect, e.g., the bottom of a drill hole or functional surfaces that are surrounded by steep walls [23].
Figure 2 shows the basic setup of a digital holographic microscope for shape measurement of technical objects [24]. It consists of an illumination, a microscope objective, and optics to guide the reference wave. In our systems, we use optical fibers to transport illumination and reference waves in order to achieve maximum flexibility. If refocusing is necessary, it is useful to employ a telecentric microscope objective in order to avoid depth-dependent magnification [25].
For microscopic investigations, it is common that the setup is arranged to image the object onto the camera target. Hence, the interference pattern across the camera plane allows determining the complex amplitude [11]
u ( x ) = a ( x ) exp [ i ϕ ( x ) ]
of the wave field across the object plane with its amplitude a ( x ) and phase ϕ ( x ) . The shape of the object h ( x ) can be determined from the corresponding phase distribution ϕ ( x ) , which depends on the optical path difference between the object and the reference wave. With a plane reference wave and normal illumination, we find
ϕ ( x ) = 2 π λ · 2 h ( x ) ,
with the wavelength λ . Because of the ambiguity of the phase, heights can only be uniquely determined within the interval [ π , π ] . For configurations corresponding to Equation (2), this means a height range of [ λ / 4 , λ / 4 ] . If this is too limited, multiple measurements ϕ i associated with different wavelengths λ i can be evaluated in combination [24]. The most prominent approach for this task is the so-called synthetic wavelength method [26], which is based on the phase difference of two phase distributions ϕ 1 and ϕ 2 corresponding to measurements with wavelengths λ 1 and λ 2
ϕ 2 ( x ) ϕ 1 ( x ) = 2 π Λ · 2 h ( x ) ,
with the synthetic wavelength Λ = ( λ 1 · λ 2 ) / ( λ 1 λ 2 ) . This extends the interval of unique height values to [ Λ / 4 , Λ / 4 ] , which can be significantly larger if the wavelengths are selected to be close together.
Finally, in microscopy, because of the large numerical aperture N A of the imaging system, the depth of focus d f = λ / ( N A ) 2 is often smaller than the size of the object, leaving parts of it out of focus. In digital holography, we have access to the full complex amplitude shown in Equation (1) of the object wave and, therefore, can numerically scan through various object planes. For example, we can employ the plane wave decomposition to numerically propagate from plane z 0 to z 1 [27]
u ( x ; z 1 ) = F 1 { u ^ ( x ; z 0 ) exp ( i k z Δ z ) } ,
with Δ z = z 1 z 0 , u ^ being the Fourier transform of u, F 1 denoting the inverse Fourier transformation and k z being the z-component of the k-vector in frequency space. In what follows, we will show two examples, where we used the above methods to arrive at a fast and robust in-line inspection using digital holographic microscopy.

Multiple Simultaneous Viewing Directions Using Four Digital Holographic Microscopes (MuVie) 

The first example significantly extends the range of applicability of a measurement system based on the principle setup shown in Figure 2 with respect to the shape of the object under investigation. In order to achieve the goals of a fast measurement (<1 s/part), a measurement uncertainty < 5 μ m, robustness against mechanical disturbances an and a 360 view of a complex geometry with a non-destructive, non-contact system, four key elements have been combined: (i) the method of digital holography, (ii) four directions of observation, (iii) two-wavelength contouring and (iv) the use of coherence gating.
The resulting setup of the Multiple-View holographic system (MuVie) is shown in Figure 3. It has been developed within the frame of project B 5 of the DFG funded collaborative research center SFB 747 Micro Cold Forming [22]. The system consists of four digital holographic units to provide sufficient observation directions to the same object to cover a 360 view. Each of the microscopes operates with two wavelengths λ 1 = 636.55 nm and λ 2 = 642.10 nm to yield a synthetic wavelength of Λ = 73.64   μ m. The telecentric long distance microscope objectives have 10 times magnification and a numerical aperture of N A = 0.21 . The setup allows recording of multiple holograms at the same time through coherence gating. For this purpose, the system utilizes four laser diodes with a coherence length of approximately 1 mm. Using a system of optical fibers with appropriate lengths, interference is obtained between object and reference wave of the same holographic unit but impeded for light from different holographic units. The technique allows the holograms to be separated in Fourier space. For more details on this approach, see Reference [22].
The object is a micro cold formed micro cup made from aluminum with diameter and height of approximately 1 mm. The region of interest is the curved area around the top of the cup. As seen from the shape measurement in Figure 3b, the system can be used to quantify imperfections, such as dents, scratches and deformations. In the current configuration, it provides a lateral resolution of 2 μ m and a measurement uncertainty of 5 μ m. In the example shown here, the overall recording time is 50 ms. However, processing of the holograms requires approximately 15 s, due to refocusing and stitching requirements. To extend the depth of focus, we calculated the wave field across 10 object planes using Equation (4), with Δ z = 65 μ m.

Investigation of Functional Surfaces within the Cavity of a Micro Component 

The second example is a digital holographic measurement system, which has been developed in collaboration with the company VEW GmbH to investigate functional surfaces within cavities. The system is shown in Figure 4a. It consists of a single microscope, which inspects the object in a normal observation direction at a rate of one part per second. Again two wavelengths λ 1 = 632 nm and λ 2 = 637 nm are used to arrive at a synthetic wavelengths of Λ = 80.5   μ m. In contrast to the first system, the two holograms are recorded in quick succession using a fiber optical switch between the wavelengths. The recording time of a single hologram is approximately 1 ms to enable the system to also operate in a production environment. The object is a micro deep drawing part with a functional surface inside of a cylindrical tube, as shown in the inset of Figure 4a. The highlighted surface inside the cylinder is the region of interest. In the center of the object, we find a hole with a diameter of 0.9 mm. Figure 4b shows a measurement result with a clearly visible scratch in the upper left part of the surface. Similarly to the first system, the shape of the object can be determined with a measurement uncertainty of approximately 5 μ m and a lateral resolution of 2 μ m.

3.1.2. Robust Interferometric Inspection Using Computational Shear Interferometry (COSI)

Shear interferometry has proven to be very robust against mechanical vibrations. Shear interferometers are imaging systems, which produce two identical images across the camera plane. The images are mutually shifted and the shift is referred to as the shear. In this configuration, no reference wave is required. However, the interference pattern formed by the two images provides information about finite differences (differential approach) across the surface of the specimen with interferometrical precision. Since the two interfering wave fields associated with the images travel almost identical optical paths, the system is intrinsically immune towards vibrations. An additional benefit of shear interferometry arises from its low demands with respect to both the temporal and the spatial coherence of light. This enables the use of eye-safe and cheap light sources, such as light emitting diodes or even arc lamps. In an industrial environment, where safety issues are critical, this is a decisive argument for shear interferometers. Finally, shear interferometers can also investigate objects with steep slopes, which would cause high fringe densities in common interferometric setups, and—as will be shown in the next section—they can operate with multiple light sources at the same time, which solves the major problem of a limited acceptance angle in interferometry.
One of the methods we use is Computational Shear Interferometry (CoSI) [28], which seeks to determine the underlying wave field associated with the two images. The benefit of CoSI is that it provides a wave field as a result. This enables almost any interferometric investigation, such as phase shifting interferometry, digital holography and quantitative phase contrast imaging, but with the advantage of using a robust shear interferometer [29].
Figure 5a shows the setup based on a liquid crystal spatial light modulator (SLM) [30]. The imaging system consists of a 4 f -arrangement with the SLM in the Fourier domain. It images any wave field incident in the input plane to the sensor plane where the camera is located. The SLM is birefringent, so that only light oriented along the slow axis will be modulated, whereas any other light will be reflected from the silicon back panel of the device [31]. We select the incoming light to be polarized exactly between the slow and the fast axis and program the SLM to display a blazed grating, which exhibits a single diffraction order. In this situation, two laterally separated images will appear across the sensor plane, where the separation, i.e., the shear, can be selected by the orientation and the magnitude of the blazed grating. The polarizers ensure that the two wave fields are able to form an interference pattern. The setup enables fast, precise and highly reproducible adjustment of the shear and ensures almost identical optical paths for both images.
If we denote the wave field in the input plane as above by u and the shear by s , we find that the intensity of the interference pattern in the camera domain is given by
I ( x ) = | u ( x ) | 2 + | u ( x + s ) | 2 + R { u * ( x ) u ( x + s ) } ,
where R means the real part. Using phase shifting techniques [32], we can isolate the argument of the real part and arrive at the cross amplitude M ( x ) = u * ( x ) u ( x + s ) . We use typically n = 5 to 10 cross amplitudes M n associated with different shears s n , to minimize the functional [29]
L ( f ) = n | | M n ( x ) f * ( x ) f ( x + s n ) | | 2
using an iterative steepest descent algorithm. The complex amplitude found is the minimum least squares solution for the wave field
u ( x ) = arg min f L ( f ) .
in the sense of Equation (6). With the complex amplitude u ( x ) , we can employ, for example, Equation (2), to determine the profile of the specimen. Using multiple measurements with varying wavelengths, we can also define a synthetic wavelength Λ and use Equation (3) to overcome limitations rooted in the ambiguity of the phase.
As an example, Figure 5b shows the measured shape of a micro lens array. The lenses have a diameter of 537 μ m and relatively steep slopes. We have measured the array in transmission, using a 10 × microscope objective with a numerical aperture of N A = 0.21 . The light source was a fiber coupled LED with a wavelength of 625 nm and a fiber diameter of 200 μ m. The measurement uncertainty ( 1 σ ) was σ = 2.5 nm, even though the setup is immune against vibrations.

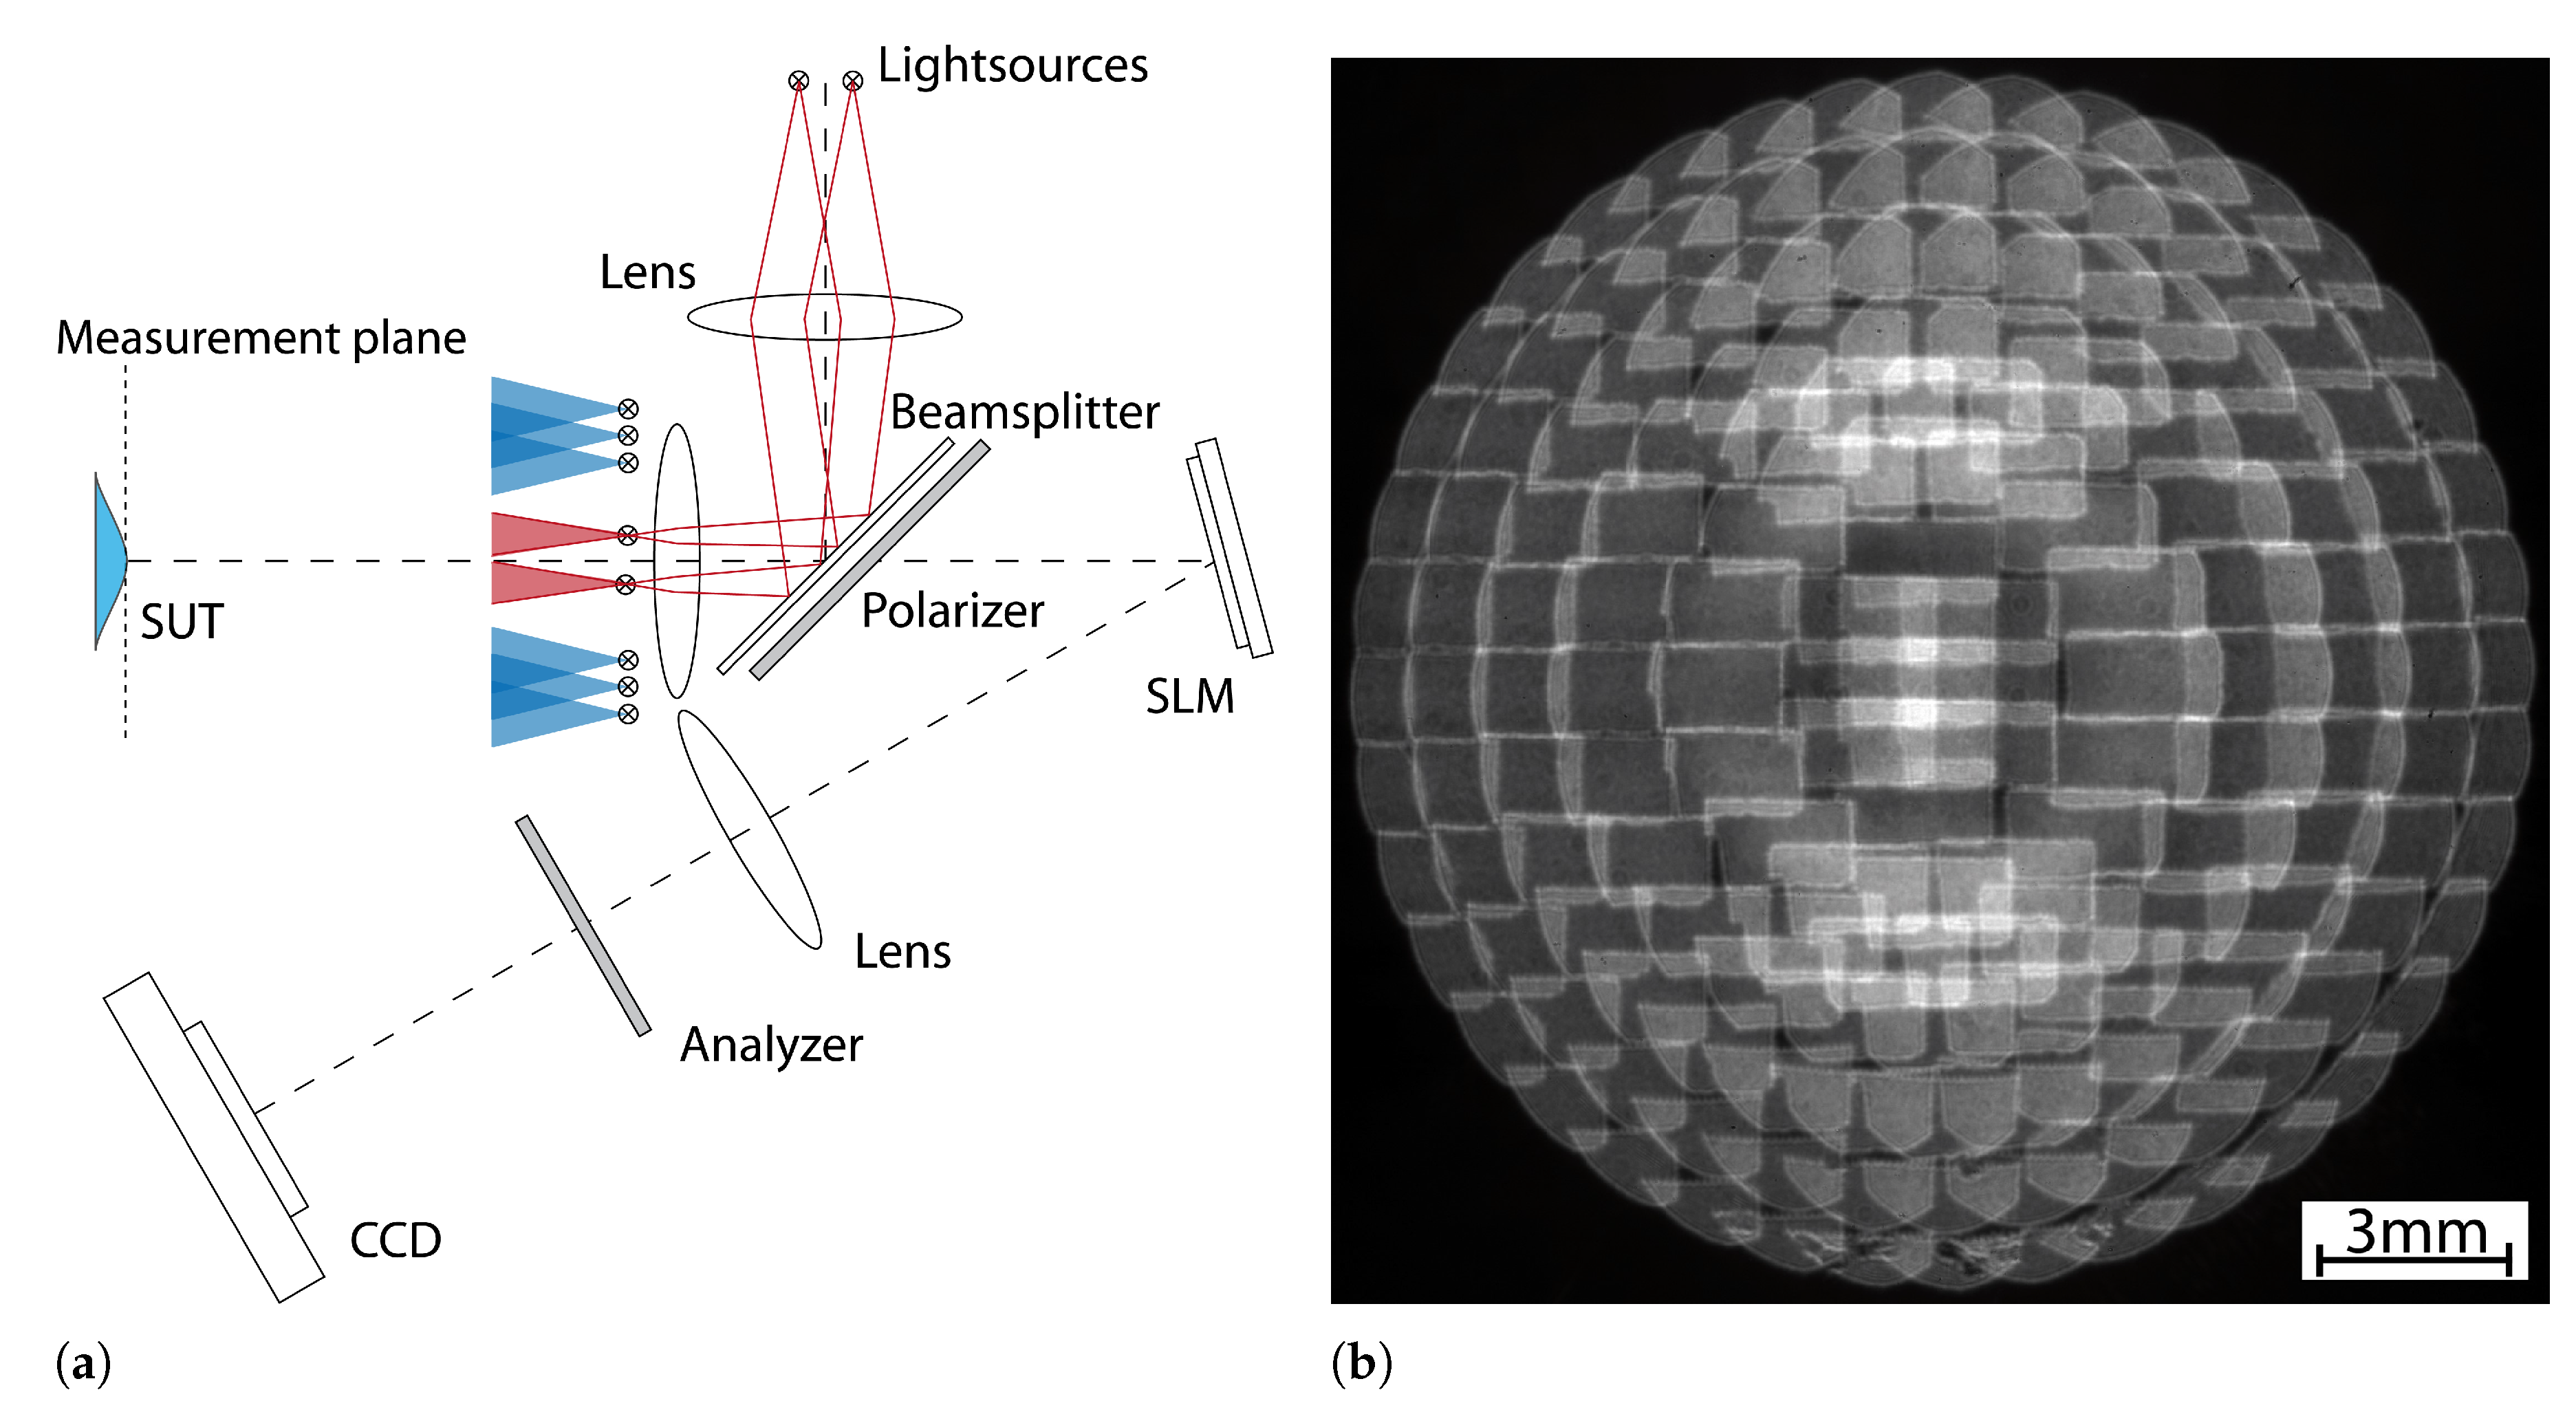
3.1.3. Multiple Aperture Shear Interferometry (MArS)

A very promising technique based on shear interferometry is Multiple Aperture Shear Interferometry (MArS), which is currently under development in collaboration with the Physikalisch-Technische Bundesanstalt (PTB). The aim of MArS is to compensate for the problem of a limited acceptance angle of current interferometers for lens testing. If lenses with steep slopes are investigated, only a small portion of the light reflected by the surface under test (SUT) is incident into the entrance pupil of the interferometer. Usually, computer generated holograms (CGH) are used to pre-shape the illuminating wave front, so that the reflected light can be imaged [33]. However, CGHs are expensive and not customizable for different lenses.
MArS exploits the fact that shear interferometers can be operated with multiple independent light sources, i.e., multiple illumination apertures [34]. In this situation, a large number of light sources can be distributed around the SUT, and each light source will partially contribute to the measurement. Figure 6a shows a sketch of the setup. It consists of a shear interferometer, similar to the arrangement introduced in Figure 5a, but instead of a single light source, we use multiple illumination apertures, where two of them are evenly transported through the observation lens. Figure 6b depicts the intensity in the image plane for the case of a spherical mirror such as SUT [35]. Each light source creates a rectangular spot across the image of the SUT. Together, they cover the entire surface.
When multiple independent wave fields are incident in the object plane, we cannot assign a consistent wave front to the light. However, we can still assign a coherence function
Γ ( x 1 , x 2 ) = u * ( x 1 , t ) u ( x 2 , t ) = lim T 1 T T / 2 T / 2 u * ( x 1 , t ) u ( x 2 , t ) d t
to it that depends on the two positions x 1 and x 2 in space. Shear interferometers measure the coherence function Γ ( x , x + s ) . In fact, for the fully coherent case, Equation (8) becomes the cross amplitude M introduced earlier. For the sum u ( x , t ) = u n ( x , t ) of multiple independent wave fields u n ( x , t ) , we find after insertion into Equation (8)
Γ ( x , x + s ) = n u * ( x ) u ( x + s ) .
In MArS, we perform a large number of measurements while varying the shear s along a lattice so that we can interpret Equation (9) as a function in s instead of the spatial coordinate x . If we select the shears across a small local area, we can regard Equation (9) as a sum of plane waves, with each of the waves being multiplied with a constant u n ( x ) . The plane waves can be associated with wave vectors k n ( x ) , where each of the superposing wave fields contributes with one wave vector. We can separate the k-vectors in frequency space using the Fourier transform F { Γ ( s ) } [36].
The idea is now to assign light rays to the directions given by the aggregate of wave vectors. The light rays can then serve as input to a variational problem, where an inverse ray-tracer is employed to determine the SUT [37], subject to the position of the light sources, which have to be known in advance by means of a calibration process. To solve the inverse problem, we use a method based on simulated annealing [38].
Figure 7 shows an example of a measurement [35]. The SUT in this case is an aspheric lens with a diameter of 25.4 mm and a design curvature radius of 49.8 mm. Figure 7a shows the aggregate of k-vectors, where different colors indicate that the light originated from different light sources. A total of 500 measurements with varying shears have been recorded to achieve this result. The object has been illuminated by 156 LEDs arranged around the SUT and 11 LEDs that have been projected through the lens. In Figure 7b, we see the measured shape of the SUT after 2000 iterations of the inverse ray-tracing approach. After subtraction of the best fit sphere, the deviation of the measured residual from the residual design topography was Peak-to-Valley (PV) 4 μ m. These results are promising and show that the principle works. Currently, we are working on an improved calibration procedure in order to reduce the PV value by at least one order of magnitude, which is the requirement to introduce the system into the market of aspheric lens testing.

3.2. Techniques Based on Geometrical Optics Suitable for In-Process and In Situ Applications

Deflectometry, formerly often denoted as Fringe Reflection (FR) and Fringe Projection (FP), have proven their suitability for precise form measurement [14]. Deflectometry is suitable for reflective surfaces and has demonstrated its usefulness not only for the detection of surface and surface-near defects [15], but also for form measurement in optical manufacturing and qualification [39], achieves high precision [40] and—as a gradient-based method—is precise and robust without using a laser light source [20] that may introduce concerns with respect to eye safety. Although the measurement principle is simple, adjusting the setup and proper evaluation is involved in order to avoid systematic errors. Recent results for simpler and more effective calibration procedures applied to FP [41] established recently at our institute may also foster a breakthrough for in-line measurements using deflectometry.
Fringe Projection is suited for diffuse scattering surfaces and has demonstrated its ability for precise, robust, in-process measurement of complex geometries [42]. It is well suited for many technical surfaces and is intrinsically benign with respect to complex surfaces. Data capturing can be comparatively fast. Using a 120 Hz fringe projection in combination with a camera that only requires 8 ms for one picture one just needs 32 ms to capture a phase distribution. Although further measurements are needed in the commonly employed hierarchical phase shifting approach, the measurement accuracy only depends on the first measurement that uses the highest spatial frequency. In the following two sub-chapters, we present one example for measuring large objects and one for small objects.

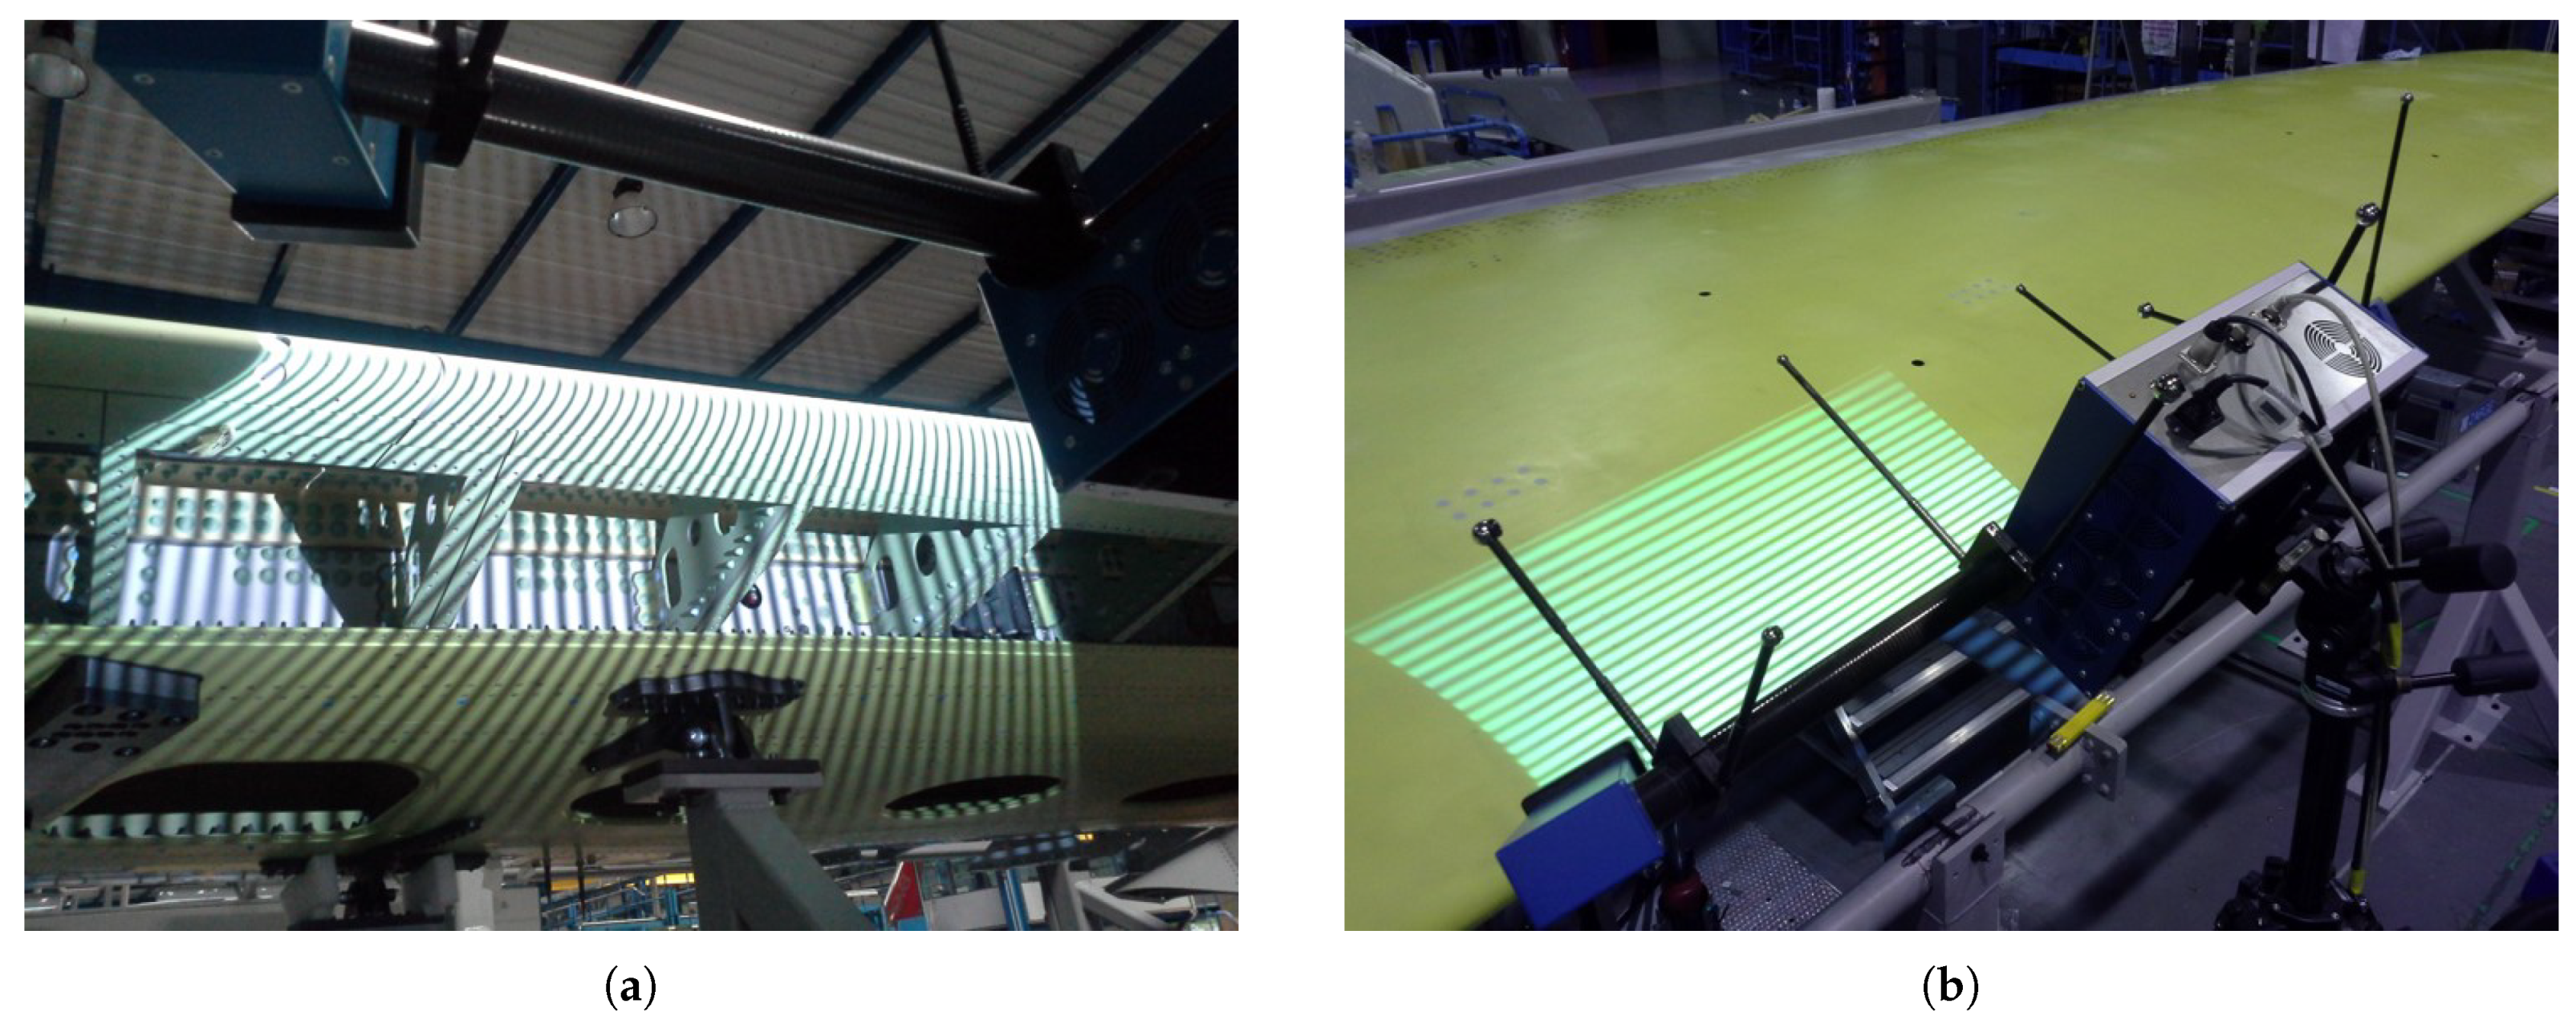
3.2.1. Measurement of Wing Shapes Using Fringe Projection

The demand for a reduction of the fuel consumption and therefore C O 2 -emission of aircrafts requires new technologies. One of them is to minimize turbulences on wings by manufacturing the surface with high quality. In the framework of the EU-Project CleanSky, we have developed a metrology technique that allows for precise form measurement during the wing production process [43].
Within the FP7 context of the European Union‘s CleanSky program, carried out as BLADE (Breakthrough Laminar Aircraft Demonstrator in Europe) under management of Airbus between 2011 and 2017, technology was being developed to build airplane wings for passenger planes that allow Natural Laminar Flow (NLF) under cruise conditions. “Natural” in this context means unsupported wings by extra flow sheets through micro-bores. The manufacturing of the surface requires tight tolerances on wing waviness and roughness. During manufacturing of NFL surfaces, an adequate quality control is therefore mandatory. At the start of BLADE, no measurement system existed that was capable of measuring large areas of wing surfaces with high lateral and depth resolution. For the purpose of the project, CleanSky’s BLADE flight lab, an Airbus A 340-300, was used. It is the first aircraft in the world combining a transonic laminar wing profile with a standard aircraft internal primary structure.
Our institute, together with the VEW Corp. Bremen, supported the BLADE demonstrator with the development and application of an innovative metrology system to measure and evaluate profile, waviness, steps, gaps, 3D disturbances, and surface roughness of the wings from the beginning of their manufacturing up to the final assembly phase [43,44]. The measurement system is an FP-based system, custom built for the specific requirements of wing metrology. The nominal field of view is 1300 × 800 mm 2 , making it perfectly suited for measurements in inter-rib spaces, the nose and on the upper cover of the BLADE wings with high accuracy. It can be adjusted to any orientation desired, and its position can be registered with laser tracker assistance. This makes it possible to locate unconnected surface segments correctly in 3D space, thus eliminating the need for large overlaps between surface sub-areas. To prevent problems of specular reflection of a glossy finish, the system can be equipped with three or more recording cameras. The depth resolution, in particular, the ability of the system to retrieve waviness, has been tested with a reference artifact that was designed in collaboration between Airbus and the National Physical Laboratory (NPL) of the UK and certified at the NPL. The artifact contains numerous features that are relevant to the BLADE metrology program. The measurement system is required to detect waves of different lengths and amplitudes. The smallest wave present on the test artifact has an amplitude of 100 μ m, and the smallest steps are 50 μ m high.
As an example, we report on measurements of an Invar (nickel-iron alloy) Outer Mold Line (OML) tool (size 9 × 2.1 m), which will serve as the exterior form of the experimental wing cover, and provide indications of the achievable 3D resolution in individual and combined measurements, as well as estimates on the match of the tooling surface against the CAD model [45]. In Figure 8, the measurement system is presented while measuring above the OML tool. In this case, a stereo-camera setup with an LED projector is used. For complete coverage of the tooling surface, over 50 individual measurements were necessary, generating a very large collection of data amounting to over 170 million points.
Figure 9 combines the measured point cloud and the nominal CAD data. Blue and red marked areas are slightly over the defined specifications. The surface was brought into the tolerance band over its entire surface by tweaking the frame support. After modifications were made, all measured points showed the surface to be within the specifications.
Figure 10 presents views of the FP system on-site at Aernnova aircraft manufacturing facility in Berantevilla (Spain) in recording mode after the NFL wing final assembly phase (campaigns: GKN wing recording in 06-2016, Saab wing recording in 07-2016). The situations given in Figure 10 are exemplary for extreme measurement tasks for FP-based techniques. On the one hand, we have very complex geometries, and on the other hand, we have to deal with specular reflection of a glossy finish surface, which is not allowed to be manipulated. All measurements had to be carried out in-process while employees of the aircraft facility were working on the wings without interruption.

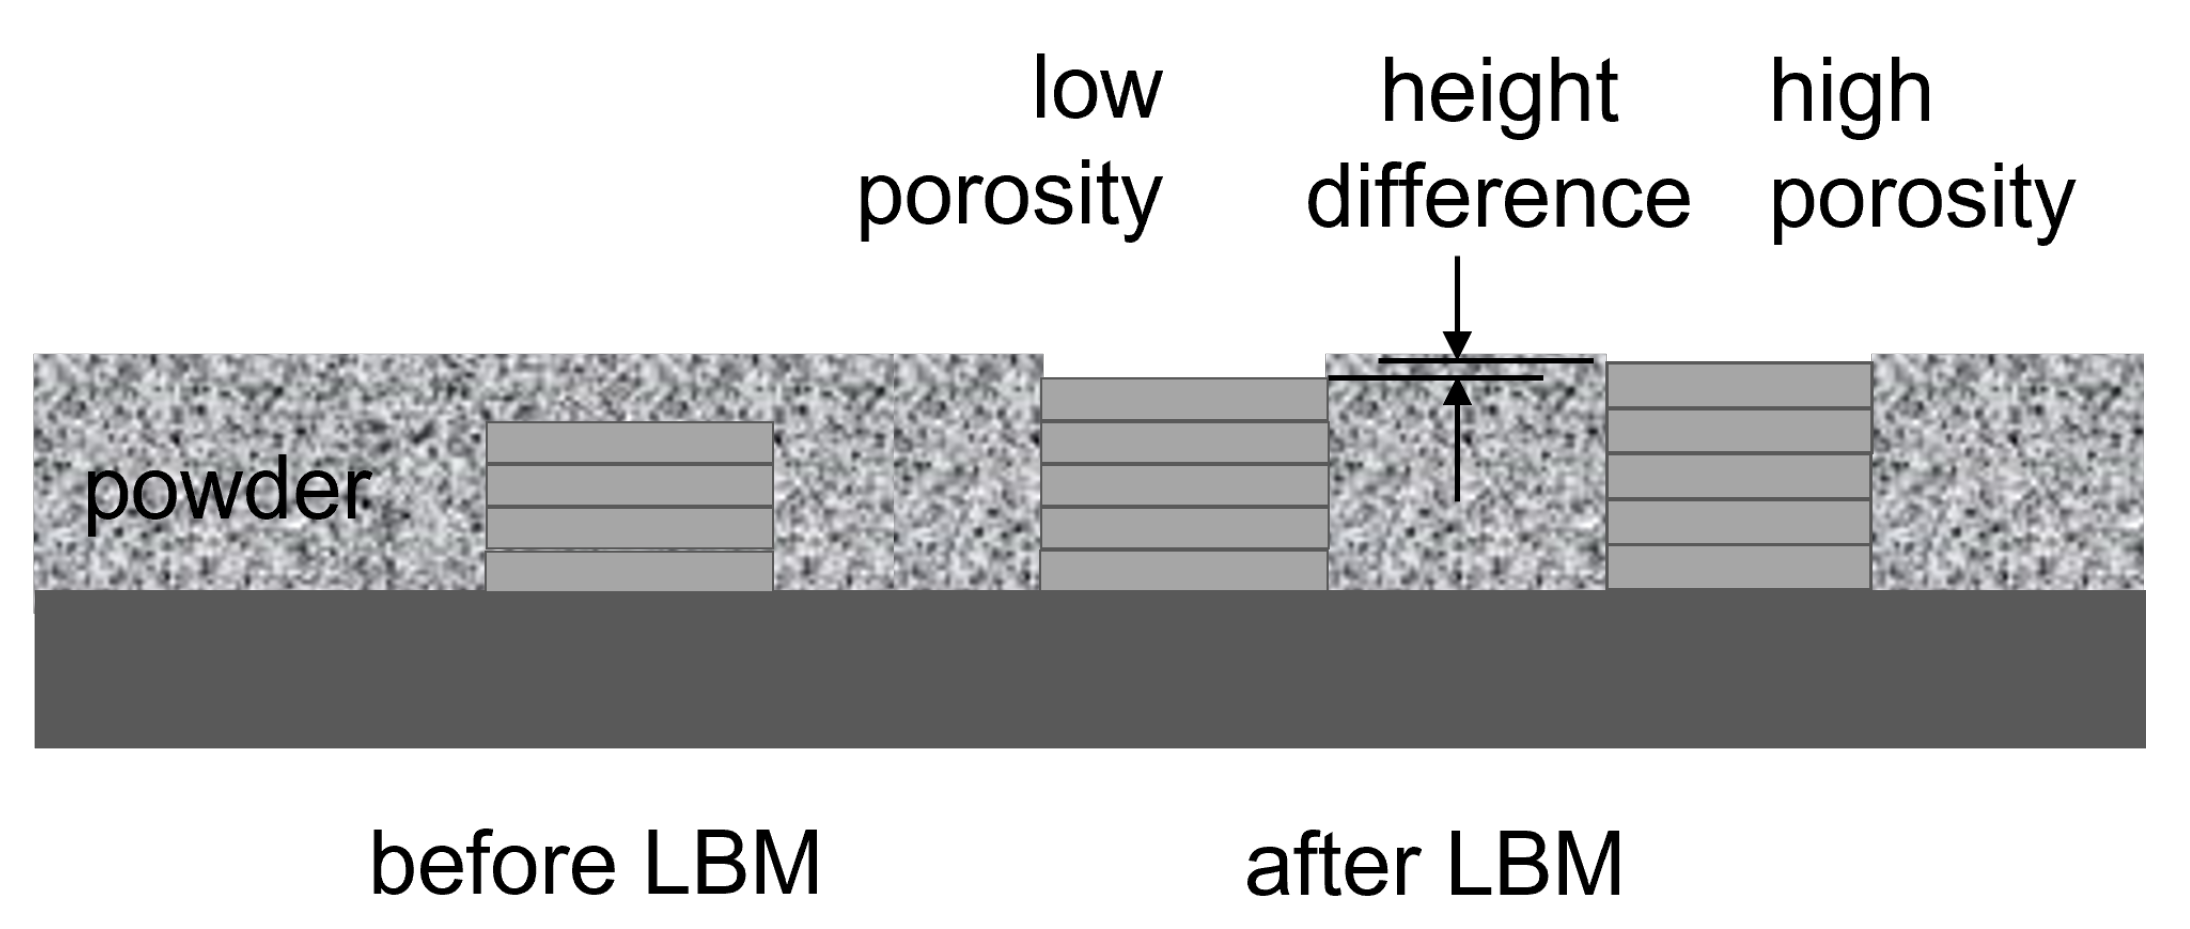
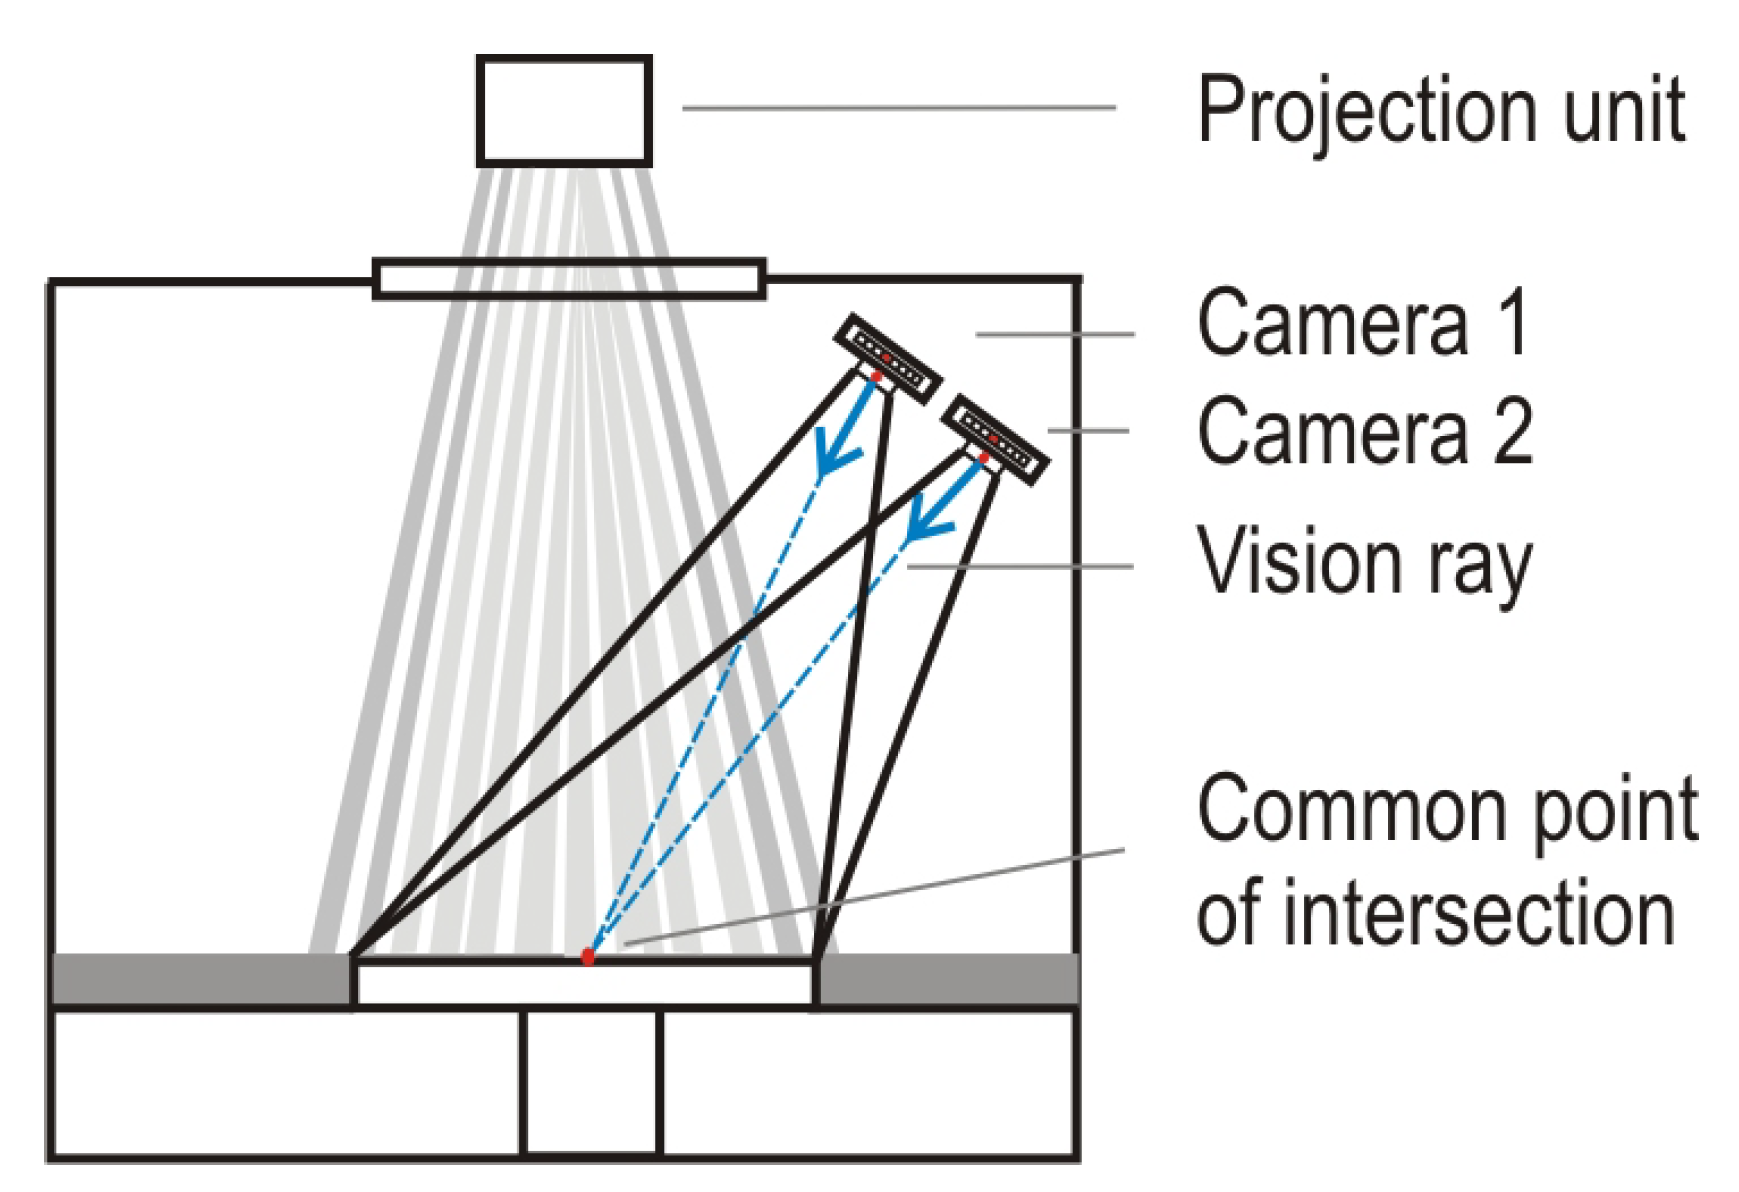
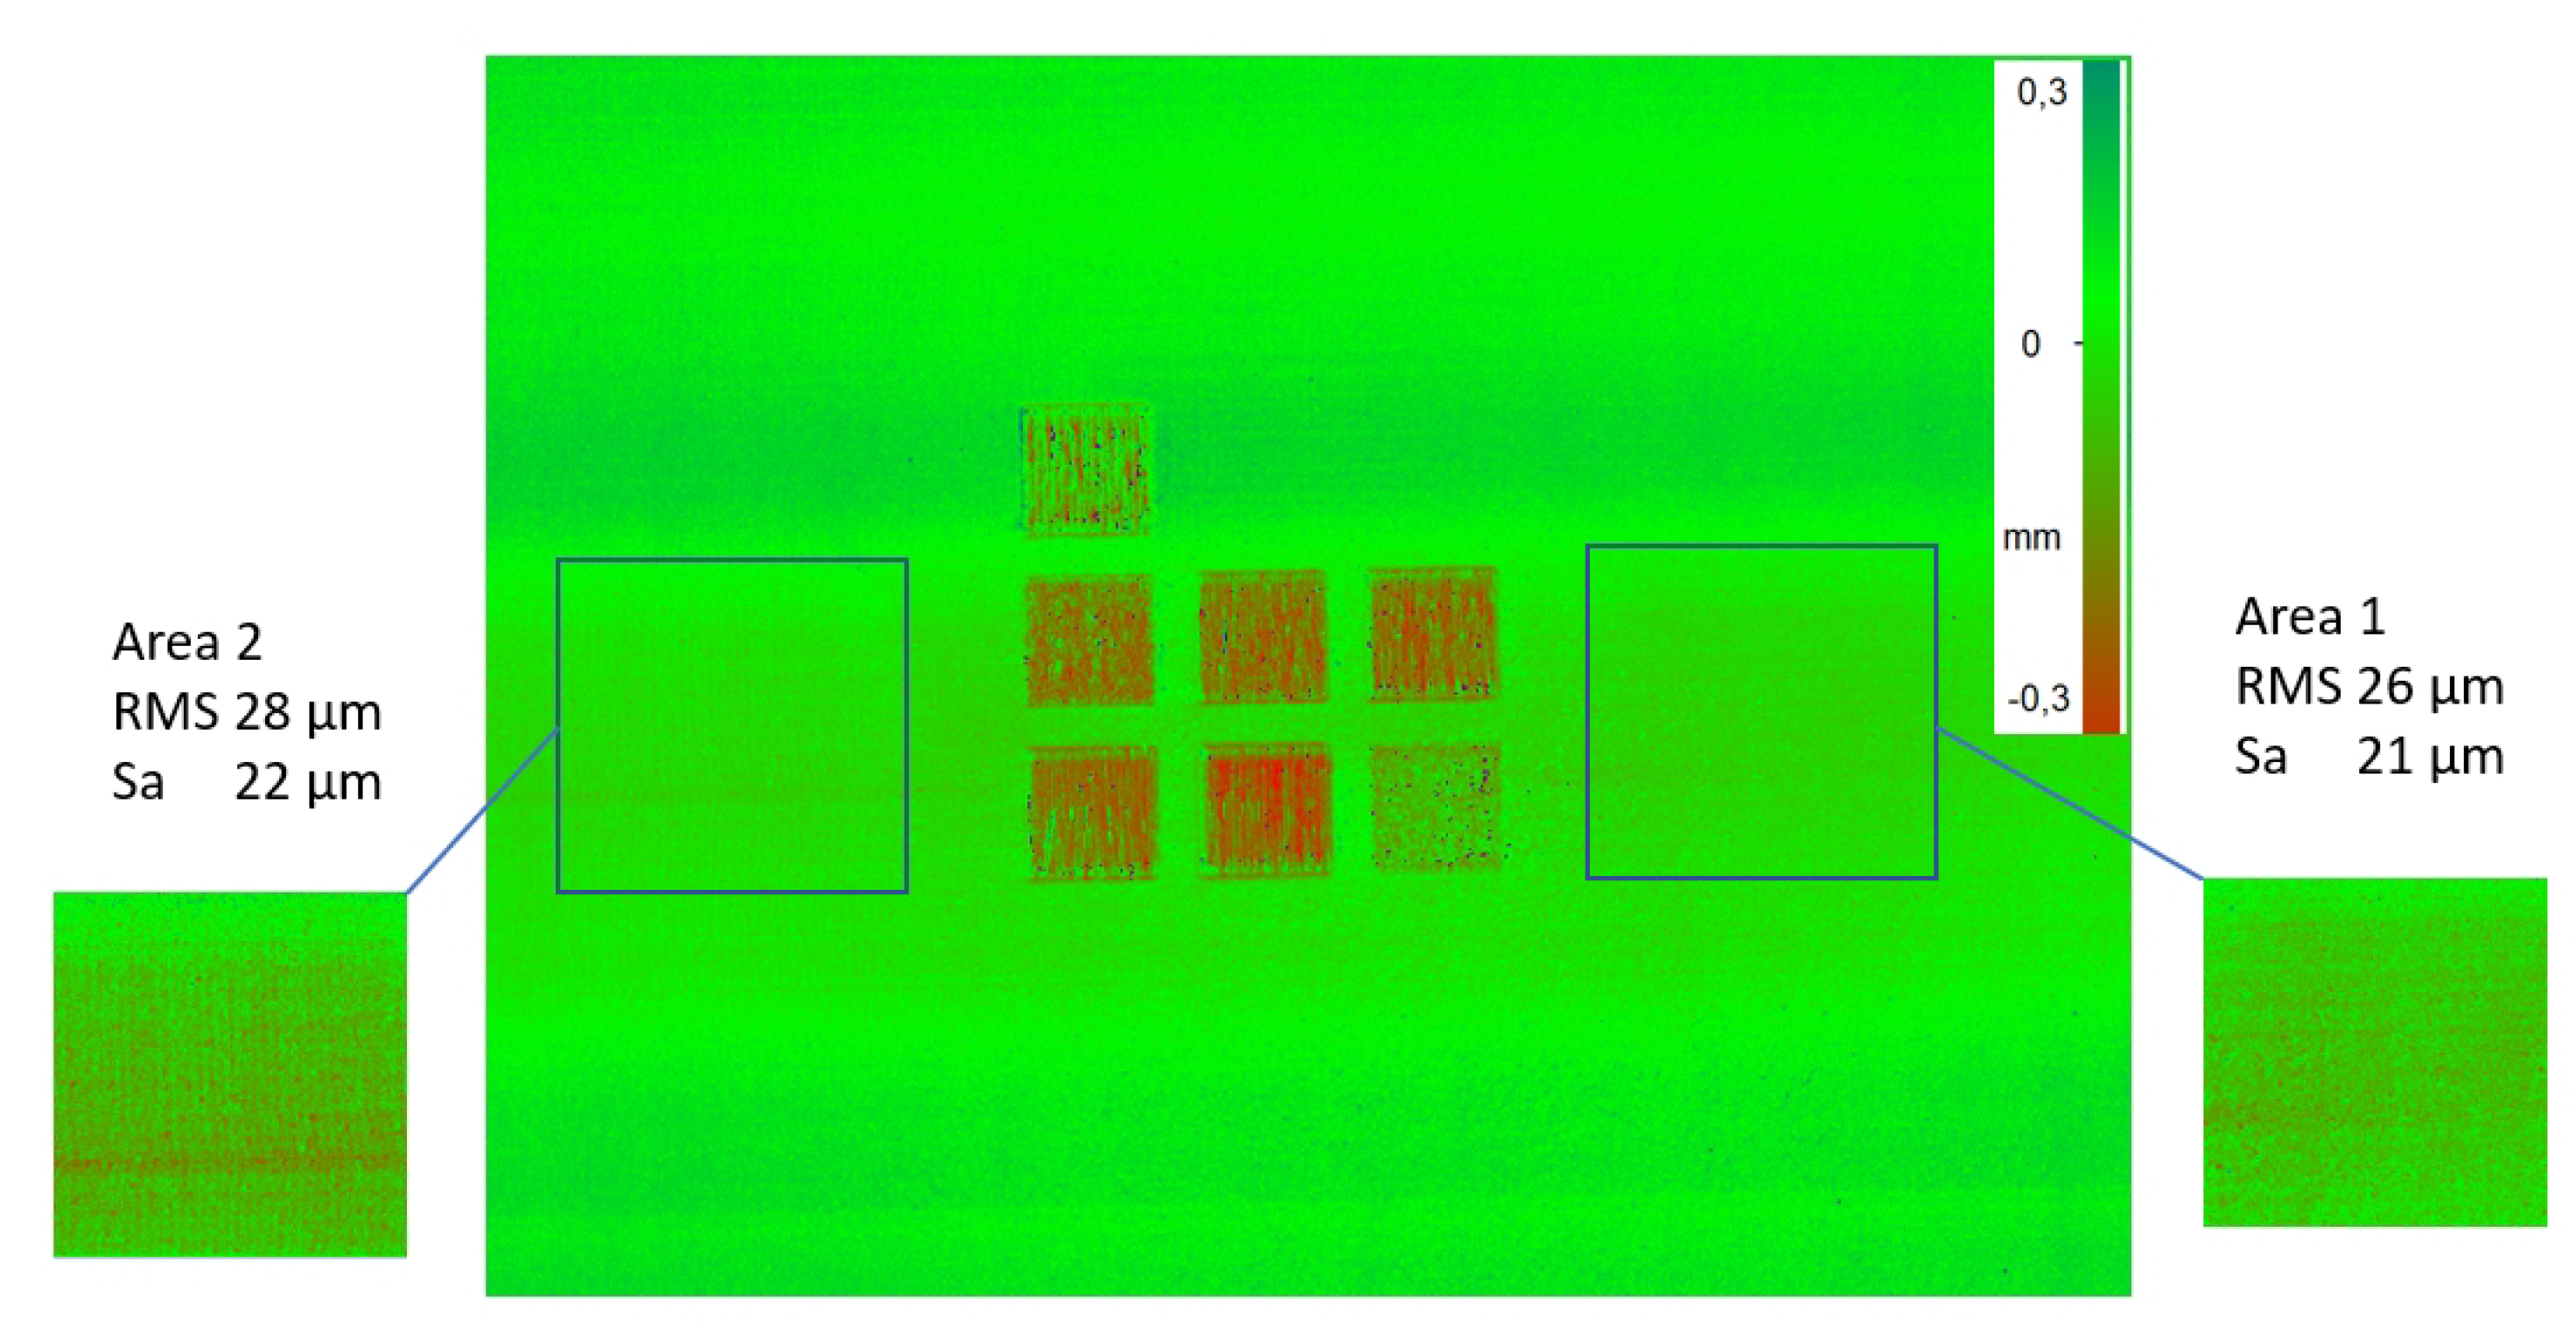
3.2.2. In-Process Measurement and Evaluation of Laser Added Manufacturing Processes for Metals

Additive manufacturing allowing layer-by-layer shaping of complex structures is of rapidly increasing interest in production technology. Especially for laser-based powder bed fusion processes of metals (PBF-LB/M), the authors of Reference [46] show a growing demand in production technology. As a consequence, there is a lively demand for quality inspection, process control and monitoring. There are more than 50 process parameters, adjustable or fixed concerning additive manufacturing (AM) technologies [47]. Among others, laser and scanning parameters, powder material and powder bed properties and recoating parameters are important for the PBF-LB/M. Many in-process sensing techniques such as cameras or pyrometers [48] for continuous temperature monitoring primarily focus on monitoring melt pool signatures. In Reference [49], a two-channel-pyrometer, coaxially integrated into the machine laser beam guidance, is implemented to identify thermal indicators with a resolution better than 10 μ m. Other non-contact methods, for example, optical coherence tomography in selective laser melting [50] and selective laser sintering [51], are also applied. However, none of the methods mentioned have shown that the measured parameters have a direct relation to the internal quality or target geometry. A review of process defects and in situ monitoring methods in metal powder bed fusion may be found in [52].
As one of the important quality parameters, the presence of pores created during laser beam melting has to be avoided or minimized. However, currently there is no method for obtaining information on the pore density or its change during the process. As the density of the material decreases with an increasing fraction of pores, it should, however, be possible to detect a change of pore density by a precise height measurement of the structures. Figure 11 shows a schematic representation of the corresponding situation: During the process, the volume of the initial powder shrinks due to the laser beam melting process. Therefore, the height of the recrystallized structure is lower than that of the powder bed surface. Due to the density dependence of the volume of recrystallized material on the volume of embedded pores, there is an additional slight height difference between structures that have a low and a high porosity. A measurement of this height difference should therefore give an indication for a change in the pore density of the current process.
In Reference [53], we demonstrated a new approach to evaluate 3D laser printed parts in powder bed fusion-based AM in-line within a closed space. It was shown that high-precision metrology based on structured light is suitable for dimensional in-process sensing. The accuracy of the system presented was qualified to be below 10 μ m in the z-coordinate perpendicular to the surface of the powder bed. This value is sufficient to reliably detect errors in powder coating or consolidation at a layer thickness of 50 μ m or higher.
The basic idea of the measurement technology to be used in the PBF-LB/M process is the application of the Fringe Projection method. With this dimensional measurement technique, one can, for example, derive the shape, size and position as well as waviness and roughness. Figure 12 illustrates the method. The surface area, spread with metallic alloy powder and/or laser consolidated parts, is illuminated by structured light. Generally, a one-dimensional sinusoidal fringe pattern distribution is projected onto a surface and the modulated phase is calculated with one of the numerous techniques for analyzing fringes. The measuring principle is based on the phase shift method combined with triangulation [54]. The information of the surface profile is obtained from the deformed fringe pattern following the object shape. A system consisting of two identical CCD-cameras captures the fringe images projected onto the building plate inside the process envelope. The two (or more) cameras do not necessarily have to be housed in the printing chamber. With appropriate viewing windows, the system can also be installed outside. By marking the pattern, individual points on the surface can be recorded and calculated with precision in (x, y, z) coordinates using the camera’s vision rays (sketched in blue in the picture). Our vision ray calibration technique for the cameras ensures the necessary high accuracy [41]. One advantage of the two-camera system implemented in this way is that the projector (outside the envelope) does not need to be calibrated.
The following results give insights to the performance of our latest measurement setup and research methods (Obtained within the IGF-Project no. 21.178 N, for further details see section Funding). It demonstrates the state-of-the-art performance of dimensional metrology based on structured light applied to PBF-LB/M processes in-line. Figure 13a shows a CAD-design as a basis for the precise positioning of the cameras in the PBF-LB/M building chamber shown in Figure 13b. The arrangement in the CAD-design relative to the building plate corresponds to the exact scale as it has to be integrated into the PBF-LB/M System (SLM Realizer 250) at BIAS. In order to be able to achieve a very high lateral measurement resolution (in the in-plane × and y directions) of 35 μ m, the measurement field should only depict the object to be evaluated. In addition, the fields of view of both cameras on the substrate must match as much as possible for the measurement principle to be implemented. The inner square within the gray ground plate in Figure 13a represents the size of a substrate of 150 × 150 mm. The measuring fields for the same system can, after a recalculation for the lenses, be expanded up to 280 × 280 mm on demand. The time required for the evaluation of a surface layer for this in-process measurement is about 5 s.
A special feature in the construction of the measuring system is the integration of the existing viewing windows of the PBF-LB/M system. The cameras are mounted and fixed in their final positions on a so-called “bridge” (compare Figure 13a). This camera bridge is installed under one of the two windows within the building envelope. The great advantage here is that the necessary cabling can be routed directly through the cover plate of the SLM chamber. The system closes off with the SLM chamber via a printed, heat-resistant hood (white part in Figure 13b with a height of only 90 mm). The fringe images are projected from outside the installation space through another viewing window of the PBF-LB/M system. That brings the further advantage that the projector does not have to be shielded from the process. No pressure loss in the building envelope after installation of the measuring system could be detected.
Figure 14a shows a recorded image of one camera from a series of measurements. It exactly shows what the camera observes coded in gray values without the fringe pattern. Cube shaped test consolidations were built with a size of 10 mm × 10 mm for each part with varying process parameters such as laser power and scanning speed, for details, see Table A1 of Appendix A. The scanning direction for all cubes is parallel to the y-axis of the SLM machine coordinate system (approximately vertical in Figure 14). A track is the result of the laser beam scanning along a straight line on the powder bed with a constant speed. The results presented below were taken from the layer 10 and 20 as stated in the following text and corresponding figures. In the complete printing procedure 40 layers have been formed.
As the melting tracks shown in Figure 14a have a different appearance depending on the camera’s perspective, one needs to calculate the point cloud of the final (x, y, z) coordinates of the structures created. These geometrical data are the product of the evaluation of both camera perspectives. The geometric coordinates of the point cloud are shown in Figure 14b in a view similar to that of the camera image in Figure 14a. It can be seen that the melting signatures of the consolidations are similar to the height profile.
A major goal of the research presented here is to derive conclusions about the quality of the printed parts from the measured dimensional values. In purely qualitative terms, it can be determined from the measurement data shown in Figure 14b that the tracks created by various process parameters have straight melted traces (e.g., upper and lower left), interruptions of the melted traces (e.g., middle row, center and right) or irregular patterns (middle row left or lower row right).
In order to determine the pore density as an important quantitative parameter of the process, we use X-ray computed tomography (X-CT). As described in Figure 11, one would expect a dependence of the structure height on the pore density. Figure 15 therefore shows the results of the porosity measured by X-CT as a function of the thickness difference between the structure with the highest porosity and the other structure heights. The height level of the structure with the highest porosity is therefore used as a reference level and set to zero. The results show a significant dependence of porosity on the thickness difference, as would be expected from the discussion of Figure 11. It should be noted, that the goal of this study is to determine the suitability of the measurement principle demonstrated here for an in-process characterization of the quality of the laser beam melting. An optimization of the PBF-LB/M process itself is beyond the scope of this study. Our results demonstrate, however, for the first time, the suitability of precise thickness evaluation using Fringe Projection for the in-process detection of the material quality created by an PBF-LB/M process.
For the assessment of the recorded data, usually surface parameters such as mean roughness (Sa), RMS roughness (Sq), Peak to Valley (PV) value (Sz), skewness (Ssk) or kurtosis (Sku) are determined according to Reference [55]. However, it turns out that the structure function (SF) [56] is much more useful for assessing 3D surface characteristics to reveal process deviations compared to the parameters stated above. The SF of order d depends on the separation parameter n for a one-dimensional discrete set of height values z i with i = 1, …, N and is defined by
S d ( n ) = 1 N n i = 1 N n ( z i z i + n ) d .
The SF that represents the mean distance of each spatial distance (separation) does not refer to a statistical expectation of the data and is therefore independent of the measurement system. One of the important advantages that apply here is the significantly high sensitivity of the SF for roughness differences. In Reference [57], we therefore proposed a method for the in-process evaluation of powder beds used in PBF-LB/M based on the SF analysis. We have indicated that when comparing metallic powder height distributions, which differ only by 3 μ m in their standard deviations, differences in roughness and waviness can be evaluated using SF. Our results [57,58] demonstrated that the SF can be interpreted as a criterion of the frequency content of the surface with respect to roughness and waviness, in which a periodicity within the sample surface is again represented by a periodicity in the SF. For more detailed definitions of the one- and two-dimensional SF, we refer to [59,60].
The following result demonstrates the successful assessment of the quality of the powder distribution on the basis of height values, which are shown in Figure 16 using the (x, y, z) values of layer 10, as described in the analysis above. The powder recoating procedure took place from right to left. For evaluation purposes, the geometric coordinates (z) of the point cloud are calculated perpendicular to the (x, y) plane. Two areas of 25 × 25 mm in size were selected out of the powder bed to compare and assess the even distribution. These areas are denoted as area 1 (right) and area 2 (left) in Figure 16. The calculated mean roughness Sa of the absolute of the ordinate values show a small difference of 1 μ m only. The color values of the areas have been adjusted to make the height values more recognizable. Therefore, they have no relation to the color scale of Figure 16.
It is important to note that no powder features can be seen in the camera image (Figure 14). This means that a simple 2D photographic detection and evaluation does not provide any results here. In contrast, evaluation with height values is a good way of assessing the quality of the powder distribution.
Since the assessment with surface parameters such as Sa or RMS is only based on one value, the application of the structure function provides a wealth of information. In Figure 17, the calculated SF of both areas is documented. While the SF of area 1 runs relatively smoothly, the SF of area 2 shows the ripples of the powder distribution very clearly. In the high to mid spatial frequency range, both SFs show almost the same ordinate values. This confirms the similar roughness values presented in Figure 16. One can notice further that the two SFs differ a little from a separation value of around 150. This may be due to a slight slope in the powder distribution.
In summary, it can be stated that an evaluation of the PBF-LB/M AM technology using a non-contact measurement of (x, y, z) coordinates provides useful knowledge with regard to quality. The assessment of the consolidated material has shown that the mean height of a printed layer depends on its porosity. This result should now further be exploited and correlated with experiments using a wide range of parameters from other PBF-LB/M processes. As a second result, the uniformity of the powder application can be assessed down to the single-digit micrometer range. The statistical method of the structure function provides very precise and instructive results here.

4. Discussion

The following discussion describes some highlights on the conceptional progress to achieve fast, precise and rugged optical metrology for complex samples or measurement situations as discussed in the context of Figure 1. Speed (S) and Precision (P) have been continuously enhanced in the past until they meet physical or economic limits. In general, short illumination times and/or single shot measurements are not only beneficial for measurement speed but also for an increase in Robustness (R). We have concentrated here on intrinsically robust methods that lend themselves also to complex geometries (C). Gradient- or differential-based measuring principles are a clue to obtaining rugged measurement systems. Table 1 thus describes successful concepts discussed in this paper with respect to robustness and complexity.
For interferometry, vibrations are a major concern, since they disrupt phase measurements [7]. This problem is often targeted, e.g., by compensation measures [61] or fast data acquisition [62]. In contrast to such approaches, we are concentrating on intrinsically robust interferometry approaches, especially based on CoSI. Additional degrees of freedoms are gained from CoSI, as it allows for a better adaption to surface gradients by a proper choice of the shear. In terms of geometrical complexity, we have demonstrated approaches that not only concentrate on the geometrical complexity as such but also use the tailoring of the coherence of light to approach difficult geometric conditions as tackled by MuVie and MArS. A substantial further benefit results from MArS that solves the aperture problem by simultaneously using multiple light sources.
For geometrical methods, the situation appears a bit different. Deflectometry, being a differential measurement technique, is intrinsically robust against rigid body motion. It does not need vibration isolation and usually copes with ordinary in-door illumination. Due to its dependence on specular reflection, an aperture problem may, however, easily arise for free form surfaces. Fringe projection requires diffusely scattering surfaces and is thus less dependent on the curvature or aspect ratio or complexity of the test surface. Geometrically based optical metrology usually has a comparatively simple and cheap setup as compared to interferometric systems, is rugged, and use of incoherent light sources such as projectors or monitors lends itself to easy use in a fabrication environment. However, it requires substantial effort to turn geometrical metrology techniques into a precise and easy to use measurement tool. Here, our recent work on improved and faster calibration techniques for Deflectometry and Fringe Projection has shown significant progress in precision and speed of system calibration [41,63,64].

5. Conclusions and Outlook

Optical metrology for industrial applications needs to be precise, fast, robust and capable of coping with complex geometrical conditions. The paper emphasizes on progress in dealing with robustness and complexity as prime areas of improvement.
The development starting from traditional phase front measurements to the measurement of the full complex amplitude of a wave field comes to its limits. Tailoring the coherence properties of light according to sample requirements has been demonstrated in the Multi View Digital Holography (MuVie) microscope approach, which employs careful adjustment of the coherence properties of the light in order to separate holograms created simultaneously during the measurement. Already during the work using CoSI, but finally using Multiple Aperture Shear Interferometry (MArS), a new paradigm becomes mandatory, as the use of a multitude of independent light sources requires a description of light fields based on the coherence function.
Substantial progress is also demonstrated for measurement methods based on geometrical optics such as deflectometry and fringe projection. Due to faster and more accurate calibration, these techniques are now much better suited for metrology applications in an industrial environment. The examples shown in this paper demonstrate that optical metrology based on fringe projection can deliver reliable results even under such harsh conditions as inside a chamber for powder-based metal melting processes.
Further work quantifying the improvements of robustness and complexity is outside the scope of this paper as such a quantification depends on a large number of technical parameters. Further work is also needed in order to achieve faster measurement and data evaluation. Progress in Computer Vision [65], Compressed Sensing [66] and Machine Learning [67] are expected to lead to significantly improved performance.

Author Contributions

Conceptualization: R.B.B.; methodology: C.F., M.K.; software: C.F., M.K.; validation, C.F., M.K.; formal analysis: C.F., M.K.; investigation: C.F., M.K.; resources: R.B.B.; data curation: C.F., M.K.; writing—original draft preparation: R.B.B., C.F., M.K.; writing—review and editing: R.B.B.; visualization: R.B.B., C.F., M.K.; supervision: R.B.B.; project administration: R.B.B., C.F., M.K.; funding acquisition, R.B.B. All authors have read and agreed to the published version of the manuscript.

Funding

Research based on holography and shear interferometry has been funded by the projects Quality Inspection and Logistic Quality Assurance of Micro Technical Manufacturing Processes (B5) and Inspection of Functional Surfaces on Micro Components in the Interior of Cavities (T3) within the collaborative research center Cold Micro Metal Forming (SFB 747), the project Optical surface metrology with spatially and temporally partially coherent light wave fields (OPAL) project no. 258565427, and the project Verfahren zur vollständigen Bestimmung kohärenter Wellenfelder nach dem Prinzip der Selbstreferenz (WeSer), project no. 60045034, all funded by the Deutsche Forschungsgemeinschaft (DFG), and project Robuste Digitale Holografie in der Produktionsumgebung (RobuHoP), project no. ZF4587001LT8, funded by the Federal Ministry for Economic Affairs and Energy (BMWi) via the German Federation of Industrial Research Associations (AiF). Work concerning BLADE was carried out within the EU’s CleanSky program under JTI-CS-2010-5-SFWA-03-004 and Grant Agreement 286745 and 641489 as well. We sincerely thank the EU for support of this research. We would like to thank Sebastien Dubois (EU Project Officer CSJU) and David Belfourd (Project Lead, Metrology and Assembly, Airbus UK) for collaboration and support within BLADE. The work concerning PBF-LB/M is funded in the framework of the IGF-Project No.: 21.178 N/DVS-No.: 13.3214 of the “Forschungsvereinigung Schweißen und verwandte Verfahren e.V.” of the German Welding Society (DVS), Aachener Str. 172, 40223 Düsseldorf. Funded originates from the Federal Ministry for Economic Affairs and Energy (BMWi) via the German Federation of Industrial Research Associations (AiF) in accordance with the policy to support the Industrial Collective Research (IGF) on the orders of the German Bundestag.

Institutional Review Board Statement

Not applicable.

Informed Consent Statement

Not applicable.

Data Availability Statement

All data leading to the presented results are available on reasonable request from either the corresponding author R. B. Bergmann ([email protected]) or from C. Falldorf ([email protected]).

Acknowledgments

The authors gratefully acknowledge technical support from M. Agour, C. Kapitza and R. Klattenhoff, A. F. Müller and R. Tietjen and acknowledge the preparation of test samples by R. Dörfert, all at BIAS, and are thankful for the partnership with S. Wagner, A. Gesierich and W. Li from VEW Bremen in the BLADE project mentioned in the funding section and for the collaboration with industrial members of the committee associated with the IGF-project mentioned in the funding section.

Conflicts of Interest

The authors declare no conflict of interest. The funders had no role in the design of the study; in the collection, analyses, or interpretation of data; in the writing of the manuscript, or in the decision to publish the results.

Abbreviations

The following abbreviations are used in this manuscript:
AMAdditive Manufacturing
CoSiComputational Shear Interferometry
DHDigital Holography
FPFringe Projection
MArSMultiple Aperture Shear Interferometry
MuVieMultiple Viewing Direction Digital Holographic Microscopy
NANumerical Aperture
PBF-LB/MLaser-based Powder Bed Fusion of Metals
SFStructure Function
SLMSpatial Light Modulator
SUTSurface Under Test
X-CTX-Ray Computed Tomography

Appendix A

Table A1. Parameters of processing (two top lines) and characterization (two bottom lines) of samples shown in Figure 14. For all samples, hatch distance = 70 μ m, layer thickness = 50 μ m. A hatch distance is the difference between adjacent tracks. The chosen parameters lead to 142 hatches per layer for one cube. The metallic powder used in the investigations was TruForm™ 718 (PraxAir), a high-strength, corrosion-resistant nickel-chromium material with a melting temperature of 1260–1336 C. The values are taken from layer 20, the center of the cubes. For an easier overview, the level of the sample in the lower right (highest degree of porosity) was set to the value 0. The sample on the upper left of Figure 14a was not taken into account because the z-values do not appear plausible due to the large distance between the melted tracks (compare Figure 14b).
Sample Location
Row Middle Lower
Position in RowLeftCenterRightLeftCenterRight
laser power (W)11014017017020080
scanning speed (mm/s)500500500400400500
mean height ( μ m)−111−145−149−137−1620
degree of porosity (%)3.90.530.660.971.27.6

References

  1. Gao, W.; Haitjema, H.; Fang, F.Z.; Leach, R.K.; Cheung, C.F.; Savio, E.; Linares, J.M. On-machine and in-process surface metrology for precision manufacturing. CIRP Ann. Manuf. Technol. 2019, 68, 843–866. [Google Scholar] [CrossRef] [Green Version]
  2. Shimizu, Y.; Chen, L.C.; Kim, D.W.; Chen, X.; Li, X.; Matsukuma, H. An insight into optical metrology in manufacturing. Meas. Sci. Technol. 2021, 32, 042003. [Google Scholar] [CrossRef]
  3. Vacharanukul, K.; Mekid, S. In-process dimensional inspection sensors. Measurement 2005, 38, 204–218. [Google Scholar] [CrossRef]
  4. Takaya, Y. In-Process and On-Machine Measurement of Machining Accuracy for Process and Product Quality Management: A Review. Int. J. Automat. Technol. 2014, 8, 566–590. [Google Scholar] [CrossRef]
  5. Bergmann, R.B. Computational Optical Metrology. In Proceedings of the International Conference on Optical and Photonic Engineering (icOPEN 2016), Chengdu, China, 26–30 September 2016; p. 13. [Google Scholar]
  6. de Groot, P. Principles of interference microscopy for the measurement of surface topography. Adv. Opt. Photon. 2015, 7, 1–65. [Google Scholar] [CrossRef]
  7. de Groot, P. Vibration in phase-shifting interferometry. J. Opt. Soc. Am. A 1995, 12, 354–365. [Google Scholar] [CrossRef] [Green Version]
  8. Albertazzi, A. Interferometry in harsh environments. In Optical Imaging and Metrology; Osten, W., Reingand, N., Eds.; Wiley-VCH: Weinheim, Germany, 2012; pp. 369–391. [Google Scholar]
  9. Häusler, G.; Leuchs, G. Physikalische Grenzen der optischen Formerfassung mit Licht. Physikalische Blätter 1997, 53, 417–422. [Google Scholar] [CrossRef]
  10. Pavliček, P.; Häusler, G. Methods for Optical Shape Measurement and their Measurement Uncertainty. Optomechatronics 2014, 8, 292–303. [Google Scholar] [CrossRef] [Green Version]
  11. Schnars, U.; Falldorf, C.; Watson, J.; Jüptner, W. Digital Holography and Wavefront Sensing; Springer: Berlin/Heidelberg, Germany, 2016. [Google Scholar]
  12. Fischer, A. Fisher information and Cramér-Rao bound for unknown systematic errors. Measurement 2018, 113, 131–136. [Google Scholar] [CrossRef]
  13. Yoshizawa, T. Handbook of Optical Metrology; CRC Press: Boca Raton, FL, USA, 2009. [Google Scholar]
  14. Bergmann, R.B.; Bothe, T.; Falldorf, C.; Huke, P.; Kalms, M.; von Kopylow, C. Optical Metrology and Optical Non-Destructive Testing from the Perspective of Object Characteristics. In Proceedings of the SPIE 7791, Interferometry XV: Applications, San Diego, CA, USA, 4–5 August 2010; p. 779102. [Google Scholar]
  15. Bergmann, R.B.; Huke, P. Advanced methods for optical non-destructive testing. In Optical Imaging and Metrology–Advanced Technologies; Osten, W., Reingand, N., Eds.; Wiley-VCH: Weinheim, Germany, 2012; pp. 393–412. [Google Scholar]
  16. Schuth, M.; Buerakov, W. (Eds.) Handbuch Optische Messtechnik–Praktische Anwendungen für Entwicklung, Versuch, Fertigung und Qualitätssicherung; Hanser: Munich, Germany, 2017. [Google Scholar]
  17. Harding, K. (Ed.) Handbook of Optical Dimensional Metrology; CRC Press: Boca Raton, FL, USA, 2013. [Google Scholar]
  18. Elandaloussi, F.; Mueller, B.; Osten, W. Determination of technological parameters in strip mining by time-of-flight and image processing. In Proceedings of the Optical Measurement Systems for Industrial Inspection, Munich, Germany, 16–17 June 1999; pp. 346–352. [Google Scholar] [CrossRef]
  19. Sirohi, R.S. Introduction to Optical Metrology; CRC Press: Boca Raton, FL, USA, 2016. [Google Scholar]
  20. Bergmann, R.B.; Burke, J.; Falldorf, C. Precision optical metrology without lasers. In Proceedings of the International Conference on Optical and Photonic Engineering (icOPEN 2015), Singapore, 14–16 April 2015; Volume 9524, p. 952403. [Google Scholar]
  21. Agour, M.; von Freyberg, A.; Staar, B.; Falldorf, C.; Fischer, A.; Lütjen, M.; Freitag, M.; Goch, G.; Bergmann, R.B. Quality inspection and logistic quality assurance of micro technical manufacturing processes. In Cold Micro Metal Forming; Vollertsen, F., Kuhfuß, B., Thomy, C., Friedrich, S., Maaß, P., Zoch, H.W., Eds.; Springer Nature: Cham, Switzerland, 2020; pp. 256–274. [Google Scholar]
  22. Agour, M.; Falldorf, C.; Bergmann, R. Spatial multiplexing and autofocus in holographic contouring for inspection of micro-parts. Opt. Express 2018, 26, 28576–28588. [Google Scholar] [CrossRef]
  23. Simic, A.; Falldorf, C.; Bergmann, R. Internal Inspection of Micro Deep Drawing Parts Using Digital Holography. In Proceedings of the Imaging and Applied Optics 2016, Heidelberg, Germany, 25–28 July 2016; Optical Society of America: Washington, DC, USA, 2016; p. DW1H.3. [Google Scholar]
  24. Falldorf, C.; Huferath-von Luepke, S.; von Kopylow, C.; Bergmann, R.B. Reduction of speckle noise in multiwavelength contouring. App. Opt. 2012, 51, 8211–8215. [Google Scholar] [CrossRef] [PubMed]
  25. Agour, M.; Falldorf, C.; Staar, B.; von Freyberg, A.; Fischer, A.; Lütjen, M.; Bergmann, R.B. Fast Quality Inspection of Micro Cold Formed Parts using Telecentric Digital Holographic Microscopy. In Proceedings of the MATEC Web of Conferences, Auckland, New Zealand, 4–8 February 2018; EDP Sciences: Les Ulis, France, 2018; Volume 190, p. 15008. [Google Scholar]
  26. De Groot, P.; Kishner, S. Synthetic wavelength stabilization for two-color laser-diode interferometry. Appl. Opt. 1991, 30, 4026–4033. [Google Scholar] [CrossRef]
  27. Goodman, J.W. Introduction to Fourier Optics, 3rd ed.; Roberts and Company: Englewood, CO, USA, 2005. [Google Scholar]
  28. Falldorf, C.; von Kopylow, C.; Bergmann, R.B. Wave field sensing by means of computational shear interferometry. J. Opt. Soc. Am. A 2013, 30, 1905–1912. [Google Scholar] [CrossRef] [PubMed]
  29. Falldorf, C.; Agour, M.; Bergmann, R.B. Digital holography and quantitative phase contrast imaging using computational shear interferometry. Opt. Eng. 2015, 54, 024110. [Google Scholar] [CrossRef]
  30. Falldorf, C.; Kopylow, C.; Juptner, W. Compact lateral shearing interferometer to determine continuous wave fronts. In Proceedings of the 2007 3DTV Conference, Kos, Greece, 7–9 May 2007; pp. 1–4. [Google Scholar]
  31. Falldorf, C.; Osten, S.; Kopylow, C.V.; Jüptner, W. Shearing interferometer based on the birefringent properties of a spatial light modulator. Opt. Lett. 2009, 34, 2727–2729. [Google Scholar] [CrossRef]
  32. Hariharan, P.; Oreb, B.F.; Eiju, T. Digital phase-shifting interferometry: A simple error-compensating phase calculation algorithm. Appl. Opt. 1987, 26, 2504–2506. [Google Scholar] [CrossRef]
  33. Burge, J.H. Applications of computer-generated holograms for interferometric measurement of large aspheric optics. In Proceedings of the International Conference on Optical Fabrication and Testing, Tokyo, Japan, 2 August 1995; International Society for Optics and Photonics: Bellingham, WA, USA, 1995; Volume 2576, pp. 258–269. [Google Scholar]
  34. Falldorf, C. Taking the next step: The advantage of spatial covariance in optical metrology. In Proceedings of the Imaging and Applied Optics 2016, Heidelberg, Germany, 25–28 July 2016; Optical Society of America: Washington, DC, USA, 2016; p. DW3E.1. [Google Scholar]
  35. Müller, A.F.; Falldorf, C.; Lotzgeselle, M.; Ehret, G.; Bergmann, R.B. Multiple Aperture Shear-Interferometry (MArS): A solution to the aperture problem for the form measurement of aspheric surfaces. Opt. Express 2020, 28, 34677–34691. [Google Scholar] [CrossRef]
  36. Falldorf, C.; Hagemann, J.H.; Ehret, G.; Bergmann, R.B. Sparse light fields in coherent optical metrology. Appl. Opt. 2017, 56, F14–F19. [Google Scholar] [CrossRef]
  37. Hagemann, J.H.; Falldorf, C.; Ehret, G.; Bergmann, R.B. Form determination of optical surfaces by measuring the spatial coherence function using shearing interferometry. Opt. Express 2018, 26, 27991–28001. [Google Scholar] [CrossRef]
  38. Kirkpatrick, S.; Gelatt, C.D.; Vecchi, M.P. Optimization by simulated annealing. Science 1983, 220, 671–680. [Google Scholar] [CrossRef]
  39. Burke, J.; Li, W.; Heimsath, A.; von Kopylow, C.; Bergmann, R.B. Qualifying parabolic mirrors with deflectometry. J. Eur. Opt. Soc. Rap. Public 2013, 8, 13014. [Google Scholar] [CrossRef] [Green Version]
  40. Schachtschneider, R.; Fortmeier, I.; Stavridis, M.; Asfour, J.; Berger, G.; Bergmann, R.B.; Beutler, A.; Blümel, T.; Klawitter, H.; Kubo, K.; et al. Interlaboratory comparison measurements of aspheres. Mess. Sci. Technol. 2018, 29, 055010. [Google Scholar] [CrossRef]
  41. Bartsch, J.; Sperling, Y.; Bergmann, R.B. Efficient vision ray calibration of multi-camera systems. Opt. Express 2021, 29, 17125–17139. [Google Scholar] [CrossRef] [PubMed]
  42. Reh, T.; Li, W.; Gesierich, A.; Bergmann, R.B. Vision Ray Camera Calibration for Small Field of View. In Proceedings of the Deutsche Gesellschaft für Angewandte Optik (DGAO), Brunswick, Germany, 21–25 May 2013; p. A019-9. Available online: http://www.dgao-proceedings.de (accessed on 29 October 2021).
  43. Kalms, M. WIMO (Outer Wing Metrology)—Novel Strategies to Better Measure the Quality of Wing Surfaces—Final Report Summary; European Commission: Brussels, Belgium, 2017; Available online: https://cordis.europa.eu/article/id/147160-novel-strategies-to-better-measure-the-quality-of-wing-surfaces (accessed on 29 October 2021).
  44. Kalms, M. WiMo (286745) & WIMCAM (641489) Outer Wing Metrology & Measurement Campaigns, Final Report Summary; European Commission: Brussels, Belgium, 2017; Available online: https://cordis.europa.eu/docs/results/286/286745/final1-wimo-wimcam-publishable-summary.pdf (accessed on 29 October 2021).
  45. Burke, J.; Gesierich, A.; Li, W.; Bergmann, R.B. Measurement of Mould Tool for Laminar-flow Carbon-fibre Composite Airplane Wing Cover. In Photogrammetrie—Laserscanning—Optische 3D-Messtechnik: Beiträge der Oldenburger 3D-Tage; Wichmann Verlag: Berlin, Germany, 2014; pp. 116–125. [Google Scholar]
  46. ISO/ASTM. Additive Manufacturing—Design—Part 1: Laser-Based Powder Bed Fusion of Metals; ISO/STN; Iteh Standards: Newark, NJ, USA, 2019; Volume 52911-1:2019. [Google Scholar]
  47. Spears, T.G.; Gold, S.A. In-process sensing in selective laser melting (SLM) additive manufacturing. Integr. Mater. Manuf. Innov. 2016, 5, 1–25. [Google Scholar] [CrossRef] [Green Version]
  48. Doubenskaia, M.; Pavlov, M.; Grigoriev, S.; Tikhonova, E.; Smurov, I. Comprehensive optical monitoring of selective laser melting. J. Laser Micro/Nanoeng. 2012, 7, 236–243. [Google Scholar] [CrossRef]
  49. Tyralla, D.; Seefeld, T. Thermal based process monitoring for laser powder bed fusion (LPBF). Adv. Mater. Res. 2021, 1161, 123–130. Available online: https://www.scientific.net/AMR.1161.123 (accessed on 29 October 2021). [CrossRef]
  50. Neef, A.; Seyda, V.; Herzog, D.; Emmelmann, C.; Schoenleber, M.; Kogel-Hollacher, M. Low coherence interferometry in selective laser melting. Phys. Procedia 2014, 56, 82–89. [Google Scholar] [CrossRef] [Green Version]
  51. Gardner, M.R.; Lewis, A.; Park, J.; McElroy, A.B.; Estrada, A.D.; Fish, S.; Beaman, J.J.; Milner, T.E. In situ process monitoring in selective laser sintering using optical coherence tomography. Opt. Eng. 2018, 57, 041407. [Google Scholar] [CrossRef] [Green Version]
  52. Grasso, M.; Colosimo, B.M. Process defects and in situ monitoring methods in metal powder bed fusion: A review. Meas. Sci. Technol. 2017, 28, 044005. [Google Scholar] [CrossRef] [Green Version]
  53. Kalms, M.; Narita, R.; Thomy, C.; Vollertsen, F.; Bergmann, R.B. New approach to evaluate 3D laser printed parts in powder bed fusion-based additive manufacturing in-line within closed space. Addit. Manuf. 2019, 26, 161–165. [Google Scholar] [CrossRef]
  54. Geng, J. Structured-light 3D surface imaging: A tutorial. Adv. Opt. Photonics 2011, 3, 128–160. [Google Scholar] [CrossRef]
  55. DIN EN ISO. Geometrical Product Specification (GPS)—Surface Texture: Areal—Part 2: Terms, Definitions and Surface Texture Parameters; DIN; Beuth-Verlag: Berlin, Germany, 2012; Volume 25178-2:2012-09. [Google Scholar]
  56. Kolmogorov, A.N. The local structure of turbulence in incompressible viscous fluids at very large Reynolds numbers. Dokl. Akad. Nauk SSSR 1941, 30, 299–303. (In Russian) [Google Scholar]
  57. Kalms, M.; Bergmann, R.B. Structure function analysis of powder beds in additive manufacturing by laser beam melting. Addit. Manuf. 2020, 36, 101396. [Google Scholar] [CrossRef]
  58. Kalms, M.; Bergmann, R.B. In-line quality control using dimensional metrology of 3D metal parts printed by laser beam melting. In Proceedings of the Nondestructive Characterization and Monitoring of Advanced Materials, Aerospace, Civil Infrastructure and Transportation XIII, Denver, CO, USA, 3–7 March 2019; p. 109710N. [Google Scholar] [CrossRef]
  59. Kreis, T.; Burke, J.; Bergmann, R.B. Surface characterization by structure function analysis. J. Eur. Opt. Soc. Rap. Public 2014, 9, 14032. [Google Scholar] [CrossRef] [Green Version]
  60. Kalms, M.; Kreis, T.; Bergmann, R.B. Characterization of technical surfaces by structure function analysis. In Proceedings of the Nondestructive Characterization and Monitoring of Advanced Materials, Aerospace, Civil Infrastructure, and Transportation XII, Denver, CO, USA, 4–8 March 2018; p. 1059924. [Google Scholar] [CrossRef]
  61. Wiersma, J.T.; Wyant, J.C. Vibration insensitive extended range interference microscopy. Appl. Opt. 2013, 52, 5957–5961. [Google Scholar] [CrossRef] [Green Version]
  62. Li, Y.; Kästner, M.; Reithmeier, E. Vibration-insensitive low coherence interferometer (LCI) for the measurement of technical surfaces. Measurement 2017, 104, 36–42. [Google Scholar] [CrossRef]
  63. Bartsch, J.; Kalms, M.; Bergmann, R.B. Improving the calibration of phase measuring deflectometry by a polynomial representation of the display shape. J. Europ. Opt. Soc.—Rap. Publ. 2019, 15, 1–7. [Google Scholar] [CrossRef] [Green Version]
  64. Bartsch, J.; Sperling, Y.; Bergmann, R.B. Qualification of holistic and generic camera-system calibration by fringe projection. In Proceedings of the Automated Visual Inspection and Machine Vision IV, Online, 20 June 2021; p. 117870G. [Google Scholar] [CrossRef]
  65. Szeliski, R. (Ed.) Computer Vision—Algorithms and Applications; Springer: Berlin/Heidelberg, Germany, 2011. [Google Scholar]
  66. Eldar, Y.; Kutyniok, G. (Eds.) Compressed Sensing—Theory and Application; Cambridge University Press: Cambridge, UK, 2012. [Google Scholar]
  67. Bishop, C.H. (Ed.) Pattern Recognition and Machine Learning; Information Science and Statistics; Springer: Berlin/Heidelberg, Germany, 2006. [Google Scholar]
Figure 1. Tetrahedron of optical metrology and its applications: (a) Requirements are speed (S), robustness (R), precision (P) and geometric complexity (C) as described in the text. As an example, the small, darker shaded volume shows a measurement system, which may represent a given type of interferometer with high measurement speed, high precision but low robustness suitable for only simple geometric shapes such as flat or near flat surfaces. In contrast, a production process for certain micro-parts may not only require high speed and high precision but may also require a measurement process that allows measuring a complex geometry in the presence of high levels of vibrations as indicated in this scheme by the larger lighter shaded volume. (b) Example of complex shaped parts of a commercially available razor. The cap (upper part) has a diameter of approximately one cm. The ensemble consists of three parts with the cap also shown from the inside (on the right). The cap and the knife blades (upper and lower part) require suitable tolerances to guarantee proper cutting function.
Applsci 11 10533 g001
Figure 2. Digital holographic microscope setup: The reference wave and the illumination are provided by an optical fiber. The object and reference wave are superposed using a beam splitter between the long distance microscope objective (LDM) and the tube lens. From the recorded interference pattern, it is possible to refocus the object subsequent to the measurement by means of computational methods.
Applsci 11 10533 g002
Figure 3. Digital holographic microscope for the inspection of micro cold formed micro cups: (a) The measurement system consists of 4 digital holographic microscopes to provide a full view of the top area of the object. (b) The measurement result shows a micro cup with diameter and height of approximately 1 mm. The lateral resolution is 2 μ m over an extended range of 700 μ m. The system can be used to quantify local imperfections, such as dents and deformations. The measurement uncertainty in the current configuration is 5 μ m. Reprinted according to Creative Commons license from Reference [21].
Applsci 11 10533 g003
Figure 4. Digital holographic microscopy inside of cavities: (a) Digital holographic microscope, which is capable of testing one part per second. The inset shows a sketch of a typical object the system is designed for. The highlighted surface inside the cylinder is the region of interest. (b) A composed image of the same measurement result. The lower half depicts the measured profile, while the upper half shows the deviation from the known shape. We can clearly see a groove with a depth of approximately 5 μ m, which indicates that this part is damaged.
Applsci 11 10533 g004
Figure 5. Computational Shear Interferometry: (a) Commercially available shear interferometer Golden Eye, which creates the shear using a liquid crystal SLM in the Fourier plane of a 4 f -configuration. The interferometer can be attached to any imaging optics and measures with interferometric precision while being insensitive against mechanical vibrations. (b) Measured shape of a micro lens array using CoSI in transmission. The system measures relatively steep slopes with a measurement uncertainty of σ = 2.5 nm. For more details, please refer to the text.
Applsci 11 10533 g005
Figure 6. Multiple Aperture Shear Interferometry (MArS): (a) The setup consists of a shear interferometer and multiple independent light sources for illumination (illumination apertures). Some of the illumination apertures have to be guided through the observation lens in order to access the entire surface under test (SUT). (b) Intensity image recorded by the camera with a spherical mirror as the SUT. The illumination apertures appear as rectangular areas, where one aperture corresponds to one light source. Reprinted with permission from Reference [35].
Applsci 11 10533 g006
Figure 7. Measurement results for an aspheric lens as the surface under test: (a) An aggregate of wave vectors extracted from the measured coherence function. Different colors indicate light from different light sources. (b) Calculated profile of the lens after 2000 iterations of the inverse ray-tracer. Reprinted with permission from Reference [35].
Applsci 11 10533 g007
Figure 8. Fringe Projection system in the measurement position over the outer mold line (OML) surface. This part serves as the female tool of the upper cover part of the natural laminar flow (NLF) wing section on the starboard wing of the Airbus A340 BLADE flight test aircraft. The wing tool is fixed by a frame support beneath. Reprinted with permission from Reference [45].
Applsci 11 10533 g008
Figure 9. Comparison of measured mold tool surface sized 9 × 2.1 m with CAD data. The deviations are about 2 (red) and −2 mm (blue) caused by tweaking the frame support beneath the tool. Reprinted with permission from Reference [45].
Applsci 11 10533 g009
Figure 10. Fringe Projection measurements on wings. (a) Measurement of the BLADE GKN wing. Aerospace wing (front nose section and lower cover). Due to the size of the measuring field, the strongly curved front nose section, the subsequent geometry of the wing and recordings under daylight, we show here an example of an extreme measuring situation for the FP-technology. (b) Measurement of the BLADE Saab wing (front nose section and upper cover). The setup is equipped with retro-reflectors mounted on CFRP sticks for interacting with the laser tracker system. Reprinted with permission from Reference [44].
Applsci 11 10533 g010
Figure 11. Schematic representation of the height change of structures due to laser beam melting. From left to right: An already existing structure is covered with metal powder ready for the next process step. The volume of the initial powder shrinks due to the processing. Therefore, the height of the recrystallized structure is lower than that of the surrounding powder bed surface. The shrinkage of the volume due to the melting process depends on the fraction of pores included in the treated material. Therefore, during growth of the structure, a small height difference evolves due to the density dependence of the volume of recrystallized material.
Applsci 11 10533 g011
Figure 12. Principle of the fringe-projection technique used to analyze the PBF-LB/M process. A structured pattern is projected onto the powder bed by the projection unit. A stereo camera system (cameras 1 and 2) records this pattern. With the mathematical combination of the vision rays at a common point of intersection (sketched in blue as an example), an (x, y, z)-value of the surface can be obtained by triangulation for each pixel pair of the cameras. Reprinted with permission from Reference [53], where more information on the measurement principle can be found.
Applsci 11 10533 g012
Figure 13. In-process measurement system. (a) CAD-Drawing of the dimensions and positions of the measuring system within the installation space. The calculated vision rays of the cameras on the building board are drawn in blue. For best practice, both cameras should capture the same field of view (here for the size of 150 × 150 mm). (b) Installation and test of the measuring system inside the Realizer 250 system of BIAS. A 3D printed, temperature-stable hood (white) shields the process. The reference pattern is projected from outside through a viewing window.
Applsci 11 10533 g013
Figure 14. Results of printing depending on process parameters showing melted tracks of layer 10 with a size of 10 × 10 mm. (a) Perspective view of one measurement camera. (b) Visualized 3D data from the calculated point cloud. The measured geometry values show a high degree of similarity to the image of the camera. For height information, see the color scale. Process and sample parameters are given in Table A1 of Appendix A.
Applsci 11 10533 g014
Figure 15. Porosity measured by X-CT of structures created by PBF-LB/M as a function of the height difference measured in-process by Fringe Projection. The values represent measurements using samples presented in Figure 14 after further growth to layer 20. The values of the height difference are taken from layer 20, the center of the cubes, which consist of 40 layers at the end of the growth process. For an easier overview, the material with the highest degree of porosity was used as a height reference with height difference = 0. Measured values follow the tendency that the height difference increases with the degree of sample porosity. The value of the structure located individually in the upper part of Figure 14a was not taken into account because the z-values do not appear plausible due to the large distance between the melted tracks (compare Figure 14b). Sample parameters are given in Table A1 of Appendix A.
Applsci 11 10533 g015
Figure 16. Presentation of the height distribution of layer 10 before powder recoating takes place from right to left. The measured sample has a size of about 150 × 150 mm (x, y). Two fields of the powder bed are chosen for investigation. For area 1 (right): Sa = 21 μ m, RMS = 26 μ m, powder appears rather smooth. For area 2 (left): Sa = 22 μ m, RMS = 28 μ m, suggests slight ripples in the gray values. For each area, approximately 90,000 height values are obtained, and the lateral dimension is approximately 25 × 25 mm.
Applsci 11 10533 g016
Figure 17. Multidirectional determined structure functions of area 1 (red) and area 2 (black). In the higher spatial frequency range up to about the separation n = 100, the amplitude of both SFs is almost identical. This clearly confirms the very similar roughness values. For further explanation, see text.
Applsci 11 10533 g017
Table 1. Overview over measurement methods discussed in this paper and their impact on robustness (R) and the ability to deal with complex measurement situations (C). Compare to the tetrahedron of optical metrology, as shown in Figure 1.
RequirementMethodPrinciple FeatureBenefits
Robustness (R)Computational Shear Interferometry (CoSi)measures finite phase differences (defined by shear)(i) enables interferometry using low coherent light, (ii) intrinsically robust against vibration
Deflectometrydifferential measurementintrinsically robust against vibration
Fringe Projectiontriangulationrobust against ambient conditions
Complexity (C)Multiple Viewing Directions for digital holography (MuVie)multiple illumination and observation directionsenables 360 -view
Computational Shear Interferometry (CoSI)measures coherence function(i) measures extended curvature due to variable shear, (ii) enables use of MArS
Multiple Aperture Shear Interferometry (MArS)simultaneous use of multiple light sources(i) enables measurement of aspheres, (ii) solves aperture problem
Fringe Projectiontriangulationsuitable for complex sample geometry
Publisher’s Note: MDPI stays neutral with regard to jurisdictional claims in published maps and institutional affiliations.

