Article

Nondestructive Tomographic Imaging of Rust with Rapid THz Time-Domain Spectroscopy

1
Department of Physics and Department of Energy Systems Research, Ajou University, Suwon 16499, Korea
2
Department of Physics and Optoelectronics Convergence Research Center, Chonnam National University, Gwangju 61186, Korea
3
Panoptics Corp., Seongnam 13516, Korea
*
Author to whom correspondence should be addressed.
Appl. Sci. 2021, 11(22), 10594; https://doi.org/10.3390/app112210594
Submission received: 18 October 2021 / Revised: 7 November 2021 / Accepted: 9 November 2021 / Published: 11 November 2021
(This article belongs to the Special Issue Terahertz Applications for Nondestructive Testing)

Abstract

:
In this study, we developed a rapid nondestructive tool for testing rust spread in a metal covered by a paint layer by using a THz time-domain spectroscopy system at a speed of 100 Hz/pixel. Time-of-flight imaging helps identify rust formation by exclusively obtaining the reflection from the steel below the paint surface. The use of frequency-selective imaging allows us to manipulate the contrast in rust imaging. Higher contrast is generally obtained when monitoring using the higher frequency component. In addition, we monitored the spread of rust in a steel plate under the influence of two different chemical solutions: NaCl and acid. We found that in the early stages, the decrease in THz reflection was governed by the high-frequency components due to the formation of lepidocrocite, whereas the low-frequency component develops as the proportion of hematite increases with time.

1. Introduction

Rapid identification of rust in various metals is important to prevent structural failures in infrastructure, transportation, and utilities that use corrosive metals, as rust can lead to catastrophic failures [1,2,3]. In many cases, the metal is coated to provide stronger protection against corrosion. However, this metal is still vulnerable to corrosion as several paint ingredients are degradable, including additives [4,5,6]. In addition, the coating layers conceal the rust, which makes it difficult for the rust to be detected before structural failure becomes critical. Various nondestructive tests have been attempted for efficient and early detection of corrosion beneath the coating. However, their utility is limited when the metal surfaces are covered by a thick coating and are frequently obscured by lift-off effects [7,8,9]. For instance, ultrasonic testing cannot distinguish between the reflection from corrosion and that from other materials. Though the eddy current technique is a powerful tool for detecting corrosion, it can only be used to detect corrosion near the surface and is sensitive to other variations, except for conductance variation.
Recently, THz spectroscopy was introduced as an efficient nondestructive testing (NDT) tool for label-free sensing, material characterization, and inspection of the internal structures of objects [10,11,12,13,14,15,16,17,18,19,20,21,22,23,24,25]. In particular, time-domain spectroscopy (TDS) provides direct 3D mapping of an object by using the time-of-flight (TOF) of the reflected THz pulses. Conventional THz-TDS systems suffer from long acquisition times, and recently, novel THz-TDS systems based on compact femtosecond fiber laser technology have been introduced, delivering a rapid time delay of 100–500 Hz. For example, 3D imaging has been introduced with time-delay techniques such as electronically controlled optical sampling (ECOPS), asynchronous optical sampling (ASOPS), and optical sampling by cavity tuning (OSCAT) [17,26,27]. More recently, galvano-scanning systems have been incorporated into the rapid time-delay technique for the efficient inspection of defects in packaged chips, which provides information on the type of defects together with their locations [28]. Although THz imaging is a powerful tool for nondestructive mapping of conductive objects, the THz-TDS system has rarely been considered for NDT of rust embedded in the paint layer, particularly at imaging speeds higher than 100 Hz/pixel.
In this study, we report high-speed nondestructive imaging of rust on a metal plate covered by paint coatings. Using the THz-TDS system incorporated with galvano-mirror scanning, we obtained TOF imaging of the rust formation at a speed of 100 Hz/pixel. The 3D information was analyzed with respect to both the temporal and spectral domains. We also monitored the spread of rust when the steel plate was influenced by ionic and acidic solutions.

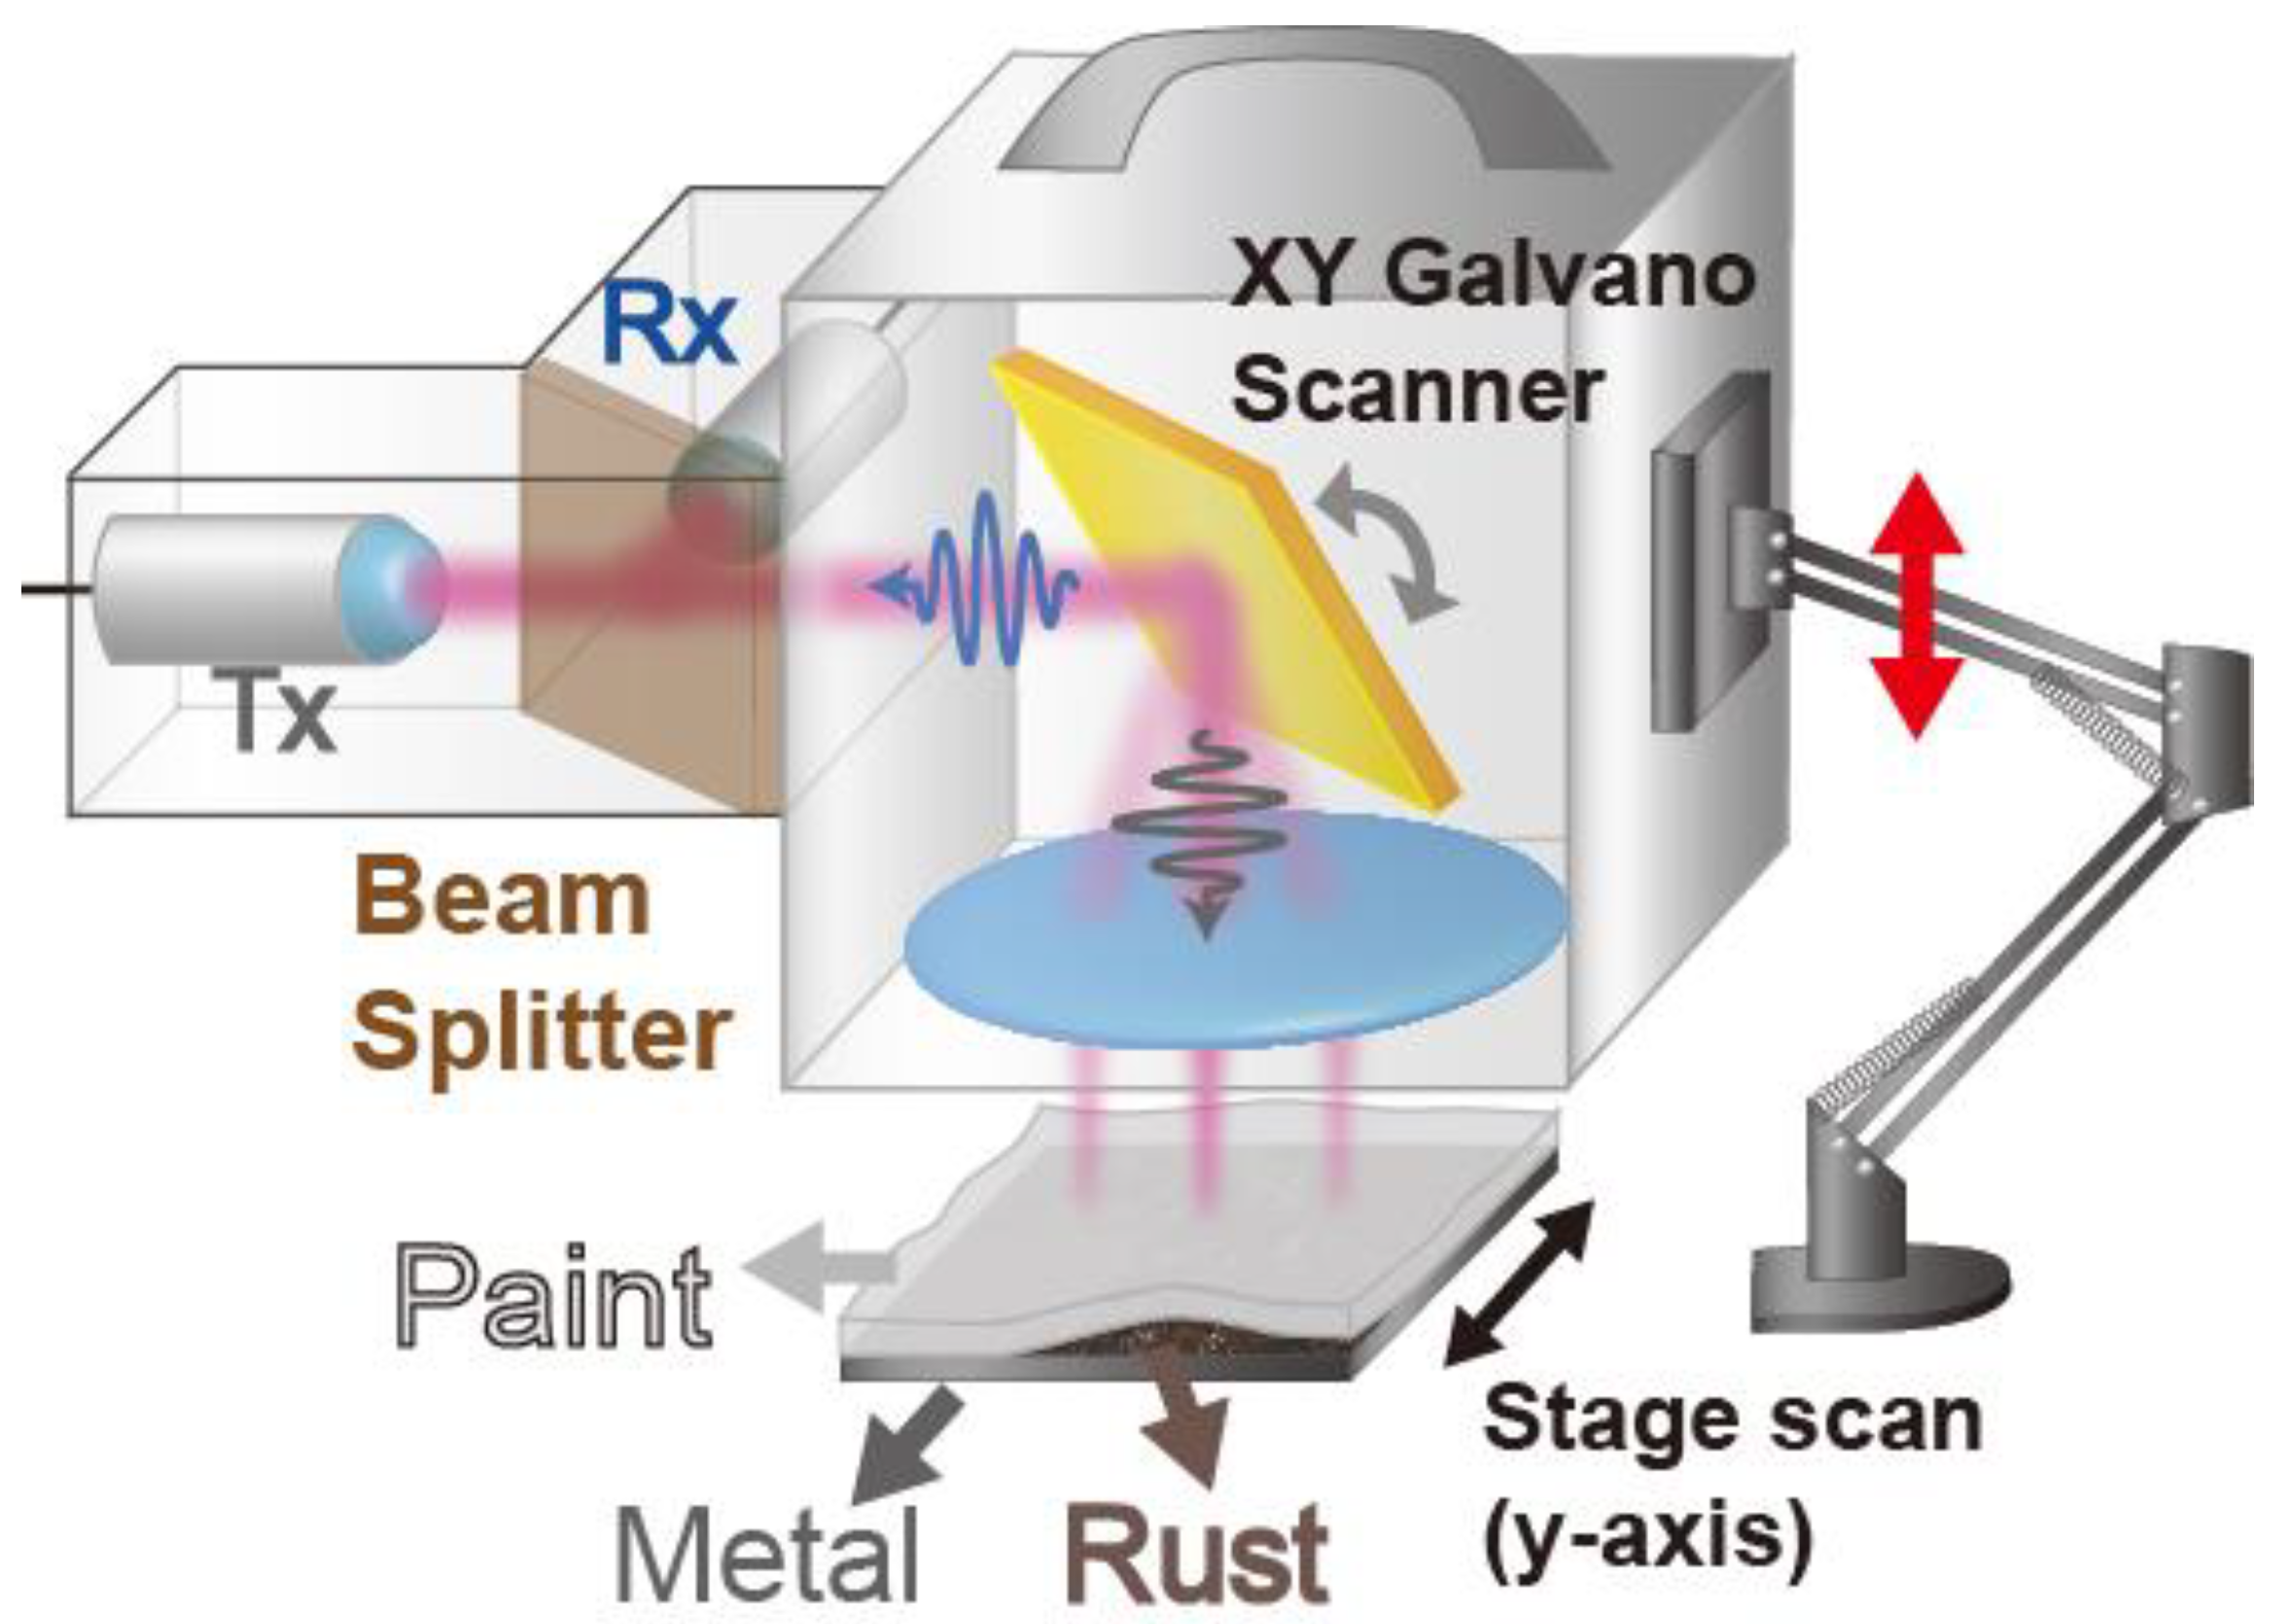
2. Experimental Setup

A schematic of the TOF imaging equipment is shown in Figure 1 Our rapid THz-TDS system is based on the commercialized OSCAT (TERA-OSCAT, MenloSystems GmbH, Germany), which allows for a sampling rate of 100–200 Hz/pixel; for instance, a measurement time of 16 s was allowed for each image with a size of 40 × 40 pixels at 100 Hz/pixel [28]. The details of the experimental setup can be obtained from published literature, except that the THz imaging system was equipped with spring-loaded flexible arms, as shown in Figure 1. This made our THz-TOF system portable, enabling us to inspect metallic objects at various locations. Importantly, we incorporated a galvano-scanner to obtain the high-speed images with a scan rate that is limited by the OSCAT system. The THz signal was focused onto the rusted metal sample using a convex lens with a diameter of 3.8 cm and a focal length of 5 cm. Conversely, the combined galvano-scanning (x-axis) and slow stage scanning (y-aixs) method can be used for larger samples (extending over 20 mm in one direction) and for inspecting the series of samples located in a row. The reflected THz signal was collected by the receiving antenna (denoted by Rx) using a beam splitter. Using home-built software, we recorded and analyzed 3D binary data as a function of the time delay, x-axis, and y-axis. We converted the time delay (T) into depth information (i.e., in the z-axis), where 1 ps corresponds to 0.15/n mm and n is the refractive index of the material.

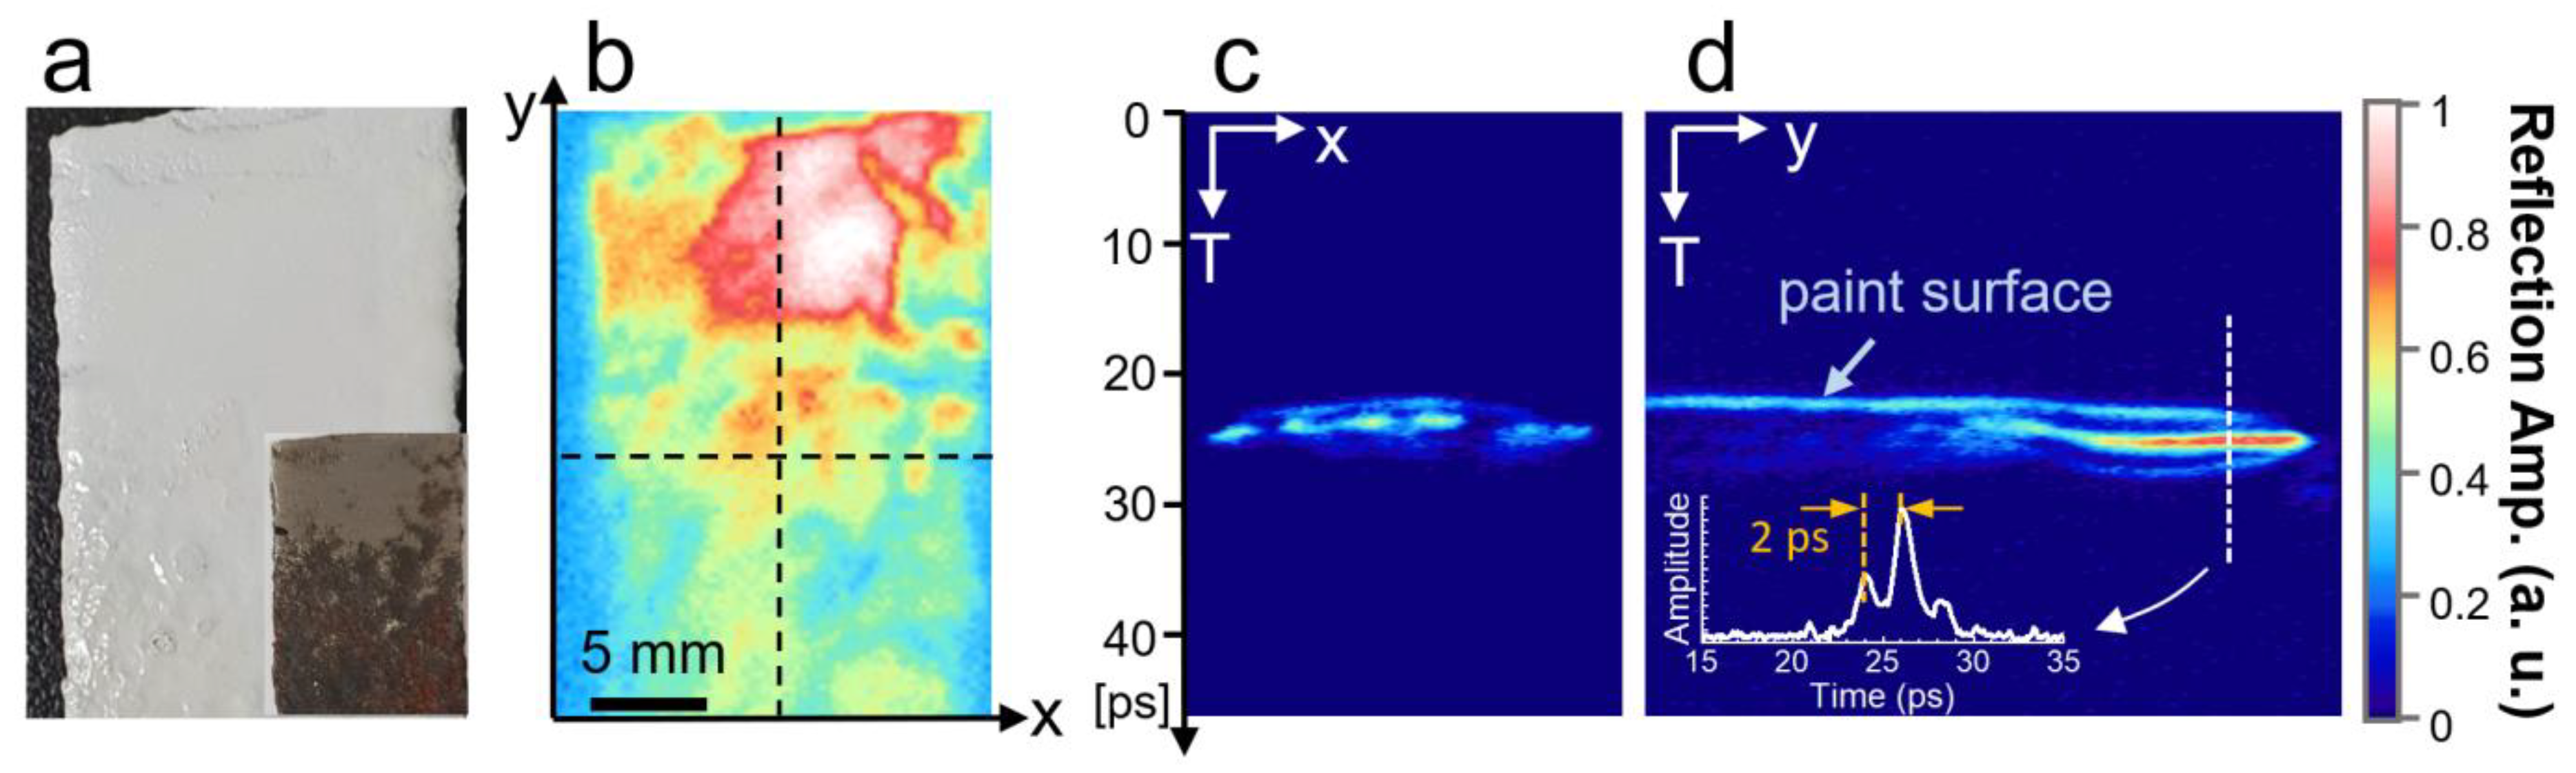
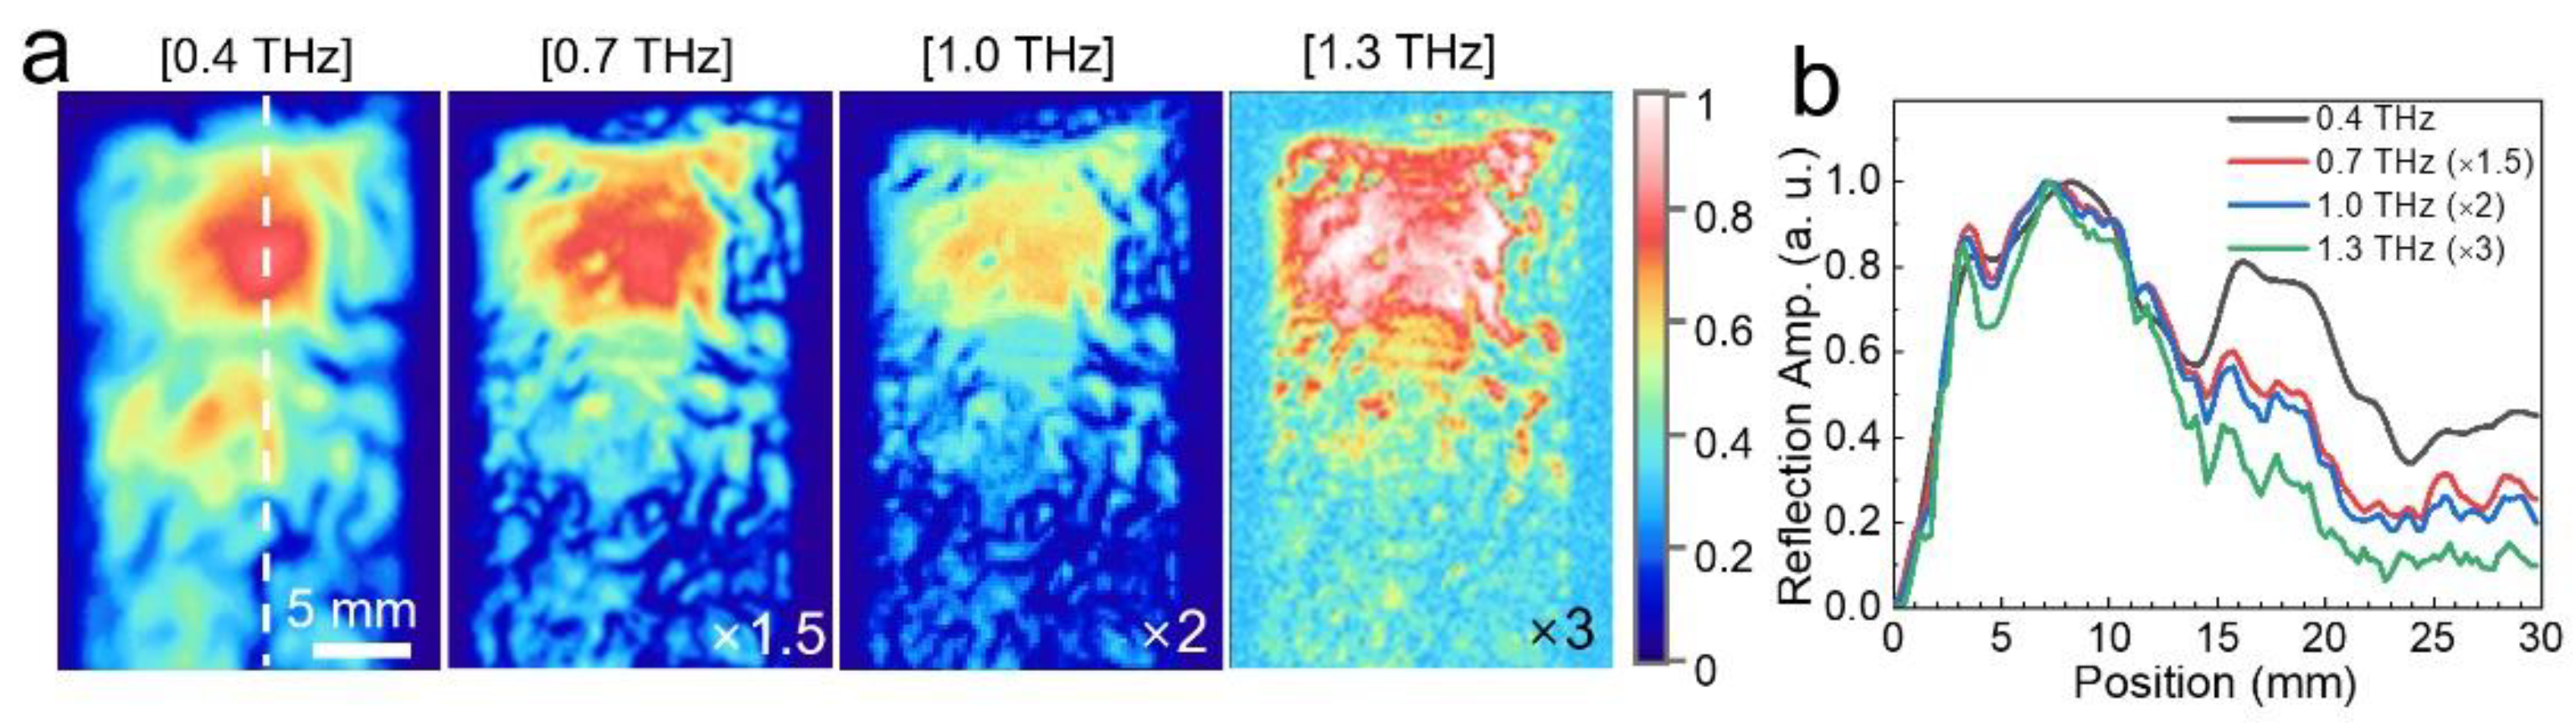
3. Results and Discussion

Figure 2b shows the THz-TOF image of the rusted metal plate covered by a paint film, as shown in the photograph in Figure 2a. To verify the usefulness of our technique, we sprayed a paint layer with a thickness of 230 μm on a partially rusted metal film. The inset of Figure 2a shows a photograph when we removed the paint film. Figure 2b shows the time-integrated C-scan data (plotted as a function of the x- and y-axes). The THz envelope signal obtained via the Hilbert transformation was time-integrated for each pixel. Here, the envelope function was obtained from the complex function, E ˜ THz = E THz + i H ( E THz ) , where E THz is the phase-sensitive THz amplitude from the measurement, and H(x) is the Hilbert transformation of x [29]. The scan range was 20 × 30 mm2 with a pixel size of 80 × 120 pixel2. The bright signal in the upper middle region indicates the conductive metal region without rust formation, whereas the other regions are severely corroded. The formation of iron oxides, which strongly absorb the THz waves, is responsible for the reduced reflection in the rust region, and has been addressed elsewhere [30,31,32].
Two-dimensional tomographic images allow us to obtain depth profiles of the objects, reconstructed from the original 3D binary data. In other words, Figure 2c is a B-scan image in which the THz envelope signal is shown as a function of position (x) along the horizontal dashed line in Figure 2b and time (T). Another B-scan image is shown in Figure 2d, which was taken along the vertical dashed line in Figure 2b. The rusted (where the reflected signal is weak) and the nonrusted regions can be clearly distinguished. The THz reflection at the paint’s top surface and metal surface appeared at T = 24 and 26 ps, respectively, as shown in the inset of Figure 2d. The TOF time difference of 2 ps between the top and bottom is consistent with the paint thickness of 230 μm, considering the refractive index of the paint (n = 2.6). The rusted area can be clearly identified in the TOF imaging, whereas the time-integrated imaging does not distinguish between the low reflection originating from the rust and that from the destructive interference. Therefore, THz-TOF imaging is advantageous over conventional NDT imaging techniques that are frequently obscured by the presence of lift-off in the paint layer [9].
Figure 3a shows a series of frequency-resolved C-scan images obtained using a Fourier transformation of the phase-sensitive THz amplitudes, which allows us to inspect the objects at specific spectral ranges. In other words, C-scan images were obtained for 0.4, 0.7, 1.0, and 1.3 THz (from left to right in the figure). As discussed earlier, the transverse resolution can be substantially improved by employing high-frequency components; in other words, the signal resolution improves from 1.8 mm at 0.4 THz to 700 μm at 1.0 THz [28]. In addition to the improved spatial resolution, the reflection from the rust-rich region is suppressed more for the high-frequency components in general, whereas some of iron oxides have a relative strong absorption below 1 THz [31]. Figure 3b shows plots of the THz amplitude as a function of position along the vertical dashed line in Figure 3a, taken for different frequency components. THz reflection was suppressed relatively strongly at the rusted area (for y > 15 mm) with increasing frequency. Therefore, it is desirable to have THz sources with higher frequency ranges for efficient nondestructive testing of the rusted metal with a better image contrast and transverse resolution.
We monitored the spread of rust in a steel plate under the influence of two different ionic solutions. For instance, the use of NaCl solution induced rust in metal over a relatively long period of time. Conversely, acidic solutions (such as a mixture of hydrogen peroxide and acetic acid) resulted in a more rapid corrosion process. Figure 4a shows a series of photographs acquired over two weeks after the metal was submerged in 3.5% NaCl solution. The corresponding THz images (i.e., time-integrated C images) are illustrated in Figure 4b. The THz reflection images were normalized by that of gold film. We temporarily extracted the sample from the solution for the measurements and returned it to the solution for further rust formation. Again, the scan range was 20 × 30 mm2 with a pixel size of 80 × 120 pixel2, and the THz signal was averaged five times per pixel this time. It was observed that the THz reflection was suppressed significantly with increasing time in the ionic solution. In a few regions, the THz amplitude reached less than 10% of the original amplitude (i.e., below 1% in terms of intensity).
Importantly, the THz reflection images deviated significantly from the photographic images in most cases. For instance, the THz images taken on Day 3 showed a uniformly distributed reflection, which is similar to that of Day 0, whereas the photograph strongly implies rust formation over the entire surface. Similarly, in the dark region (surrounded by a dashed line) found in the photograph of Day 14, we found a bright reflection in the corresponding region of the THz reflection. In other words, the photograph was obscured by the shallow oxide layers (which tend to work as a protective layer to prevent further corrosion) and does not distinguish between the lightly and heavily rusted areas, which proves the usefulness of NDT with THz imaging techniques.
Figure 5 shows the results of rapid imaging where we applied an acidic solution (a mixture of 24 mL hydrogen peroxide (30%), 1.1 mL acetic acid (13%), and 4.5 g NaCl) to the steel plate. As the measurement time was 16 s for each image taken at 40 × 40 pixels, the rapid THz-TOF system was ideal for inspecting the rust spread that occurred over the course of a few minutes. Here, we dropped the acidic solution on the steel plate for fast rust formation, whereas we washed out the solution temporarily to take the THz imaging measurements each time. This is because we could not take the image in the presence of the solution and the bubbles that are produced violently in chemical reactions. We demonstrated a series of photographs and THz reflection images (i.e., time-integrated C images), respectively, in Figure 5a,b. Although the photographs did not show a noticeable change over time after the first 5 min, the THz reflection images showed a continuous change, where the THz amplitude decreased to 80% of the original value. In other words, there was no strong correlation between the optical and THz reflection images, as shown in Figure 4.
Finally, in Figure 5c, we show the reflection spectra for different times averaged over the entire area in Figure 5b. We found that in the early stages, the decrease in the reflection (i.e., absorption by the iron oxides) was governed by the high-frequency component, whereas the lower-frequency component becomes more pronounced with time. In the end, the absorption peaked at approximately 0.8 THz on average after 60 min. Interestingly, we observed dynamic transitions between the different oxide types. However, their dynamic behavior in terms of different types of metal oxides has not been addressed previously. We observed a very similar tendency for the data shown in Figure 4 with the slow corrosion processes, in which the absorption peak reached 0.8 THz after Day 14 (when the reflection amplitude reached less than 10% of the initial value).
To unravel the oxide types responsible for the THz reflection change, we performed Raman spectroscopy, as shown in Figure 5d. We used a laser source at 632.8 nm, focused with a spot size of 1 μm. We identified two types of iron oxides from the rusted area; i.e., lepidocrocite (γ-FeOOH) and hematite (α-Fe2O3). It is likely that the initial frequency response is governed by γ-FeOOH whose THz absorption is known to be pronounced in the higher frequency range [33]. Contrarily, the THz response of α-Fe2O3 has not been reported; we performed THz reflection measurement on a thick α-Fe2O3 pallet, which showed a strong absorption at around 0.6–0.8 THz (inset of Figure 5d). Therefore, we conclude that the transition toward the lower frequency region over time was mainly due to the increased amount of α-Fe2O3. The monitoring of dynamical behavior in chemical reactions is crucial for optimizing material processing. Therefore, our study necessitates future investigation on the development of in situ THz imaging tools, for instance, by incorporating fluidic devices that enable the use of thin chemical solutions for efficient THz detection.

4. Conclusions

In this study, we conducted rapid nondestructive testing on rusted metal using a high-speed THz-TDS spectroscopy system at a rate of 100 Hz/pixel. The rusted area was clearly identified in the TOF imaging in the presence of the paint layer, which is advantageous over conventional NDT imaging techniques that are frequently obscured when there is lift-off in the protective layer. In addition, the THz reflection images enable us to distinguish between the lightly and heavily rusted area in contrast to the photographic images. Via Fourier transformation of the phase-sensitive signals, we obtained frequency-selective imaging in the range 0.2–1.3 THz. Overall, a higher contrast was achieved with the higher frequency component. In addition, we monitored the spread of rust in a steel plate when the steel was submerged in NaCl and acidic solution (a mixture of hydrogen peroxide and acetic acid). We found that in the early stages, the decrease in the THz reflection signal was governed by the high-frequency components, whereas the contrast in the lower frequency range developed for longer periods. In other words, the absorption peak reached 0.8 THz as hematite was formed over a long period of time. THz response on a ferrous oxide pallet (combined with the Raman spectroscopy results) revealed the dynamic transition between the different oxide types, i.e., from lepidocrocite to hematite. Consequently, the rapid imaging technique was found to be a very powerful tool for the nondestructive inspection of rust in metals, including their dynamic behaviors.

Author Contributions

Conceptualization, Y.H.A.; formal analysis, H.S.K., S.Y.B. and Y.H.A.; investigation, H.S.K. and S.Y.B., J.W.L. and Y.H.A.; resources, J.K.; writing—original draft, H.S.K. and Y.H.A.; writing—review and editing, H.S.K., J.W.L., J.K. and Y.H.A. All authors have read and agreed to the published version of the manuscript.

Funding

This work was supported by the Midcareer Researcher Program (2020R1A2C1005735) and Basic Science Research Program (2021R1A6A1A10044950) through a National Research Foundation grant funded by the Korea Government, and by the Human Resources Program in Energy Technology (20184030202220) of the Korea Institute of Energy Technology Evaluation and Planning (KETEP) grant funded by the Korea Government.

Institutional Review Board Statement

Not applicable.

Informed Consent Statement

Not applicable.

Data Availability Statement

Data are contained within the article.

Conflicts of Interest

The authors declare no conflict of interest.

References

  1. Shaw, B.; Kelly, R. What is corrosion? Electrochem. Soc. Interface 2006, 15, 24. [Google Scholar] [CrossRef]
  2. El-Meligi, A. Corrosion Preventive Strategies as a Crucial Need for Decreasing Environmental Pollution and Saving Economics. Re. Pat. Corr. Sci. 2010, 2, 22–33. [Google Scholar] [CrossRef] [Green Version]
  3. Hansson, C.M. The impact of corrosion on society. Metall. Mater. Trans. 2011, 42, 2952–2962. [Google Scholar] [CrossRef]
  4. Leidheiser, H., Jr. Corrosion of Painted Metals A Review. Corrosion 1982, 38, 374–383. [Google Scholar] [CrossRef]
  5. Morcillo, M. Soluble salts: Their effect on premature degradation of anticorrosive paints. Prog. Org. Coat. 1999, 36, 137–147. [Google Scholar] [CrossRef]
  6. Chico, B.; Morcillo, M. The effects of soluble salts at the metal/paint interface: Advances in knowledge. Port. Electrochim. Acta 2006, 24, 191–206. [Google Scholar]
  7. Rifai, D.; Abdalla, A.N.; Ali, K.; Razali, R. Giant magnetoresistance sensors: A review on structures and non-destructive eddy current testing applications. Sensors 2016, 16, 298. [Google Scholar] [CrossRef] [Green Version]
  8. Si, D.; Gao, B.; Guo, W.; Yan, Y.; Tian, G.Y.; Yin, Y. Variational mode decomposition linked wavelet method for EMAT denoise with large lift-off effect. NDT E Int. 2019, 107, 102149. [Google Scholar] [CrossRef]
  9. Wu, R.; Zhang, H.; Yang, R.; Chen, W.; Chen, G. Nondestructive Testing for Corrosion Evaluation of Metal under Coating. J. Sens. 2021, 2021. [Google Scholar] [CrossRef]
  10. Kawase, K.; Ogawa, Y.; Watanabe, Y.; Inoue, H. Non-destructive terahertz imaging of illicit drugs using spectral fingerprints. Opt. Express 2003, 11, 2549–2554. [Google Scholar] [CrossRef] [Green Version]
  11. Federici, J.F.; Schulkin, B.; Huang, F.; Gary, D.; Barat, R.; Oliveira, F.; Zimdars, D. THz imaging and sensing for security applications—Explosives, weapons and drugs. Semicond. Sci. Technol. 2005, 20, S266–S280. [Google Scholar] [CrossRef]
  12. Shen, Y.C.; Lo, T.; Taday, P.F.; Cole, B.E.; Tribe, W.R.; Kemp, M.C. Detection and identification of explosives using terahertz pulsed spectroscopic imaging. Appl. Phys. Lett. 2005, 86, 1–3. [Google Scholar] [CrossRef] [Green Version]
  13. Zhong, H.; Xu, J.; Xie, X.; Yuan, T.; Reightler, R.; Madaras, E.; Zhang, X.C. Nondestructive defect identification with terahertz time-of-flight tomography. IEEE Sens. J. 2005, 5, 203–207. [Google Scholar] [CrossRef]
  14. Karpowicz, N.; Redo, A.; Zhong, H.; Li, X.; Xu, J.; Zhang, X.C. Continuous-wave terahertz imaging for non-destructive testing applications. In Proceedings of the Joint 30th International Conference on Infrared and Millimeter Waves and 13th International Conference on Terahertz Electronics, Williamsburg, VA, USA, 19–23 September 2005. [Google Scholar]
  15. Schirmer, M.; Fujio, M.; Minami, M.; Miura, J.; Araki, T.; Yasui, T. Biomedical applications of a real-time terahertz color scanner. Biomed. Opt. Express 2010, 1, 354–366. [Google Scholar] [CrossRef] [Green Version]
  16. Kawase, K.; Shibuya, T.; Hayashi, S.; Suizu, K. THz imaging techniques for nondestructive inspections. Comptes Rendus Phys. 2010, 11, 510–518. [Google Scholar] [CrossRef]
  17. Jin, K.H.; Kim, Y.-G.; Cho, S.H.; Ye, J.C.; Yee, D.-S. High-speed terahertz reflection three-dimensional imaging for nondestructive evaluation. Opt. Express 2012, 20, 25432–25440. [Google Scholar] [CrossRef] [PubMed]
  18. Park, S.H.; Jang, J.W.; Kim, H.S. Non-destructive evaluation of the hidden voids in integrated circuit packages using terahertz time-domain spectroscopy. J. Micromech. Microeng. 2015, 25, 095007. [Google Scholar] [CrossRef]
  19. Park, S.J.; Yoon, S.A.N.; Ahn, Y.H. Dielectric constant measurements of thin films and liquids using terahertz metamaterials. RSC Adv. 2016, 6, 69381–69386. [Google Scholar] [CrossRef]
  20. Fan, S.; Li, T.; Zhou, J.; Liu, X.; Liu, X.; Qi, H.; Mu, Z. Terahertz non-destructive imaging of cracks and cracking in structures of cement-based materials. AIP Adv. 2017, 7, 115202. [Google Scholar] [CrossRef] [Green Version]
  21. Park, S.J.; Kim, A.R.; Hong, J.T.; Park, J.Y.; Lee, S.; Ahn, Y.H. Crystallization Kinetics of Lead Halide Perovskite Film Monitored by In Situ Terahertz Spectroscopy. J. Phys. Chem. 2017, 8, 401–406. [Google Scholar] [CrossRef] [PubMed]
  22. Kim, H.S.; Sung, H.C.; Roy, B.; Kim, S.; Ahn, Y.H. Humidity sensing using THz metamaterial with silk protein fibroin. Opt. Express 2018, 26, 33575–33581. [Google Scholar] [CrossRef]
  23. Ahi, K.; Shahbazmohamadi, S.; Asadizanjani, N. Quality control and authentication of packaged integrated circuits using enhanced-spatial-resolution terahertz time-domain spectroscopy and imaging. Opt. Lasers Eng. 2018, 104, 274–284. [Google Scholar] [CrossRef]
  24. Zhang, J.Y.; Ren, J.J.; Li, L.J.; Gu, J.; Zhang, D.D. THz imaging technique for nondestructive analysis of debonding defects in ceramic matrix composites based on multiple echoes and feature fusion. Opt. Express 2020, 28, 19901–19915. [Google Scholar] [CrossRef] [PubMed]
  25. Kim, H.S.; Ha, N.Y.; Park, J.Y.; Lee, S.; Kim, D.S.; Ahn, Y.H. Phonon-Polaritons in Lead Halide Perovskite Film Hybridized with THz Metamaterials. Nano Lett. 2020, 20, 6690–6696. [Google Scholar] [CrossRef] [PubMed]
  26. Bartels, A.; Cerna, R.; Kistner, C.; Thoma, A.; Hudert, F.; Janke, C.; Dekorsy, T. Ultrafast time-domain spectroscopy based on high-speed asynchronous optical sampling. Rev. Sci. Instrum. 2007, 78, 035107. [Google Scholar] [CrossRef] [Green Version]
  27. Wilk, R.; Hochrein, T.; Koch, M.; Mei, M.; Holzwarth, R. OSCAT: Novel technique for time-resolved experiments without moveable optical delay lines. J. Infrared Millim. Terahertz Waves 2011, 32, 596–602. [Google Scholar] [CrossRef]
  28. Yim, J.H.; Kim, S.Y.; Kim, Y.; Cho, S.; Kim, J.; Ahn, Y.H. Rapid 3d-imaging of semiconductor chips using thz time-of-flight technique. Appl. Sci. 2021, 11, 4770. [Google Scholar] [CrossRef]
  29. Kong, D.Y.; Wu, X.J.; Wang, B.; Gao, Y.; Dai, J.; Wang, L.; Ruan, C.J.; Miao, J.G. High resolution continuous wave terahertz spectroscopy on solid-state samples with coherent detection. Opt. Express 2018, 26, 17964–17976. [Google Scholar] [CrossRef]
  30. Komatsu, M.; Sato, R.; Mizuno, M.; Fukunaga, K.; Ohki, Y. Feasibility study on terahertz imaging of corrosion on a cable metal shield. Jpn. J. Appl. Phys. 2012, 51, 122405. [Google Scholar] [CrossRef]
  31. Wu, D.B.; Zhao, H.; Liu, H.L.; Zhao, K.; Sun, Q. THz spectrum of iron corrosion products. In Proceedings of the Selected Photoelectronic Technology Committee Conferences, China, China, 1 August 2014. [Google Scholar]
  32. Fuse, N.; Sugae, K. Non-destructive terahertz imaging of alkali products in coated steels with cathodic disbanding. Prog. Org. Coat. 2019, 137, 105334. [Google Scholar] [CrossRef]
  33. Fuse, N.; Fukuchi, T.; Takahashi, T.; Mizuno, M.; Fukunaga, K. Evaluation of applicability of noncontact analysis methods todetect rust regions in coated steel plates. IEEE Trans. Terahertz Sci. Technol. 2012, 2, 242–249. [Google Scholar] [CrossRef]
Figure 1. Schematic illustration of the THz-TOF imaging equipment. Tx and Rx denote the THz emitter and receiver, respectively, from the OSCAT THz-TDS system.
Applsci 11 10594 g001
Figure 2. (a) Photograph of rusted metal concealed by paint. (b) Time-integrated C-scan image (in terms of envelope function) for (a). (c,d) Cross-sectional B-scan images along with the x-axis and y-axis taken from (b). (See dashed lines in (b)). Inset shows A-scan plot (i.e., THz amplitude vs. time-delay) obtained along the dashed line.
Applsci 11 10594 g002
Figure 3. (a) A series of C-scan images corresponding to the frequencies of 0.4, 0.7, 1.0, and 1.3 THz. Because the signal strength decreased toward the high-frequency region, the THz amplitude signal was magnified for clarity for the high-frequency images. (b) THz amplitudes as a function of position along the vertical dashed line in (a) for the different frequencies.
Applsci 11 10594 g003
Figure 4. (a) Photographs of the steel plate taken on different days after the plate was submerged in the NaCl solution. (b) THz reflection amplitude images from the rusted metal plate taken on different days. Dashed line in (a) is a guide to eye for a direct comparison between the photographic image and THz image.
Applsci 11 10594 g004
Figure 5. Photograph images (a) and rapid THz reflection images (b) for different measurement time after it is exposed to acidic solution. (c) THz reflection amplitude spectra averaged over the entire region in (b) for different measurement time. (d) Raman spectra of lepidocrocite and hematite found in our experiments. Inset shows the THz reflection signal from a thick hematite pallet.
Applsci 11 10594 g005
Publisher’s Note: MDPI stays neutral with regard to jurisdictional claims in published maps and institutional affiliations.

