Abstract
In this study, we present the development and validation of an inductively coupled plasma-atomic emission spectrometric (ICP-AES) method for the determination of Ag, Ba, Bi, Ca, Cd, Co, Cr, Cu, Fe, Mg, Mn, Ni, Pb and Zn in different candies. Various wet digestion protocols were examined in order to ensure minimum consumption of chemicals and sample preparation time. Under optimized conditions, less than 10 min were required for complete sample decomposition. The ICP-AES method was validated in terms of linearity, accuracy, precision, limits of detection (LODs) and limits of quantification (LOQs). The relative recoveries for the proposed method ranged between 80.0% and 119.0%, while the relative standard deviation values were lower than 9.0%, indicating good method accuracy and precision, respectively. The LODs for the examined analytes were 0.04–2.25 mg kg−1. Finally, the proposed method was successfully employed for the analysis of hard candies, jellies and lollipops that are sold in the Greek market, which are highly likely to be consumed by children.
1. Introduction
Elemental food composition data are of high importance both for consumers and for health professionals, and their need is highlighted by food labeling legislation [1]. The mineral composition of food samples depends on many factors, including their preparation, storage, packaging and transport. Foods contain metals that are essential for human health, such as Mg, Cu, Fe and Zn [2]. However, due to environmental pollution from urban, industrial and agricultural emissions, toxic metal such as Pb and Cd may be also present in food samples since they can accumulate along the food chain [3].
Candies such as lollipops, hard candies and jellies are food products that are widely sold in retail stores and they are consumed by a wide and heterogenous group of consumers, ranging from small children to elderly people [4,5]. The main constituent of these products is sugar, which is typically incorporated in the form of sucrose syrup and/or glucose, while they also contain other ingredients such as aromas or artificial food colorants to make them attractive, especially for children [5,6]. For the preparation of jellies, a gelling agent (i.e., gelatin) is also employed [6]. Currently, there is ongoing research regarding the incorporation of natural ingredients (e.g., antioxidants) into candies and jellies [5] and the development of healthier alternatives [7].
Similar to other food products, candies and jellies may contain a plethora of different elements that derive from the raw materials used in their preparation, contamination from the equipment, as well as contamination from the environment during storage and transport [8]. The migration of toxic elements from candy packages to the final product can result in contamination of the candies with toxic metals such as Pb and Cr [4]. As a result, it is critical to develop simple, rapid, accurate and precise methodologies for the determination of the elemental composition of these food products.
Among the different spectroscopic techniques that are used for the elemental analysis of food samples are flame atomic absorption spectrometry (FAAS), electrothermal atomic absorption spectroscopy (ETAAS), cold vapor atomic absorption spectroscopy (CV-AAS), inductively coupled plasma–atomic emission spectrometry (ICP-AES) and inductively coupled plasma–mass spectrometry (ICP-MS) [1,8,9]. Until now, ICP-AES has been found to be a powerful analytical instrument for the assessment of the elemental composition of a wide variety of food and beverages samples, including fruits and vegetables [10], legumes [11], savory snack products [8], coffee [12], alcoholic drinks [13], milks [12], vegan milks and oils [14], rice [15,16], cereals [16], nuts and seeds [17], fruit juices [18], seaweeds [19,20], etc.
Typically, sample preparation is required in order to make the food sample compatible with the ICP-AES system. Among the different sample preparation methods that are used for the elemental analysis of food samples are dry ashing, wet ashing, conventionally heating procedures, microwave-assisted digestion, autoclave digestion, etc. [2,8]. Kim et al. [4] studied the levels of various metals in candy packages and candies, including lollipops, chocolates, chewing gums and jelly samples. For this purpose, candy samples were subjected to microwave-assisted digestion using 9.0 mL of nitric acid (HNO3) and 1.0 mL of hydrogen peroxide (H2O2) as the digestion mixture. Among the examined elements were Cd, Co, Cr, Cu, Mn, Pb and Zn. Orisakwe et al. [21] proposed an atomic absorption spectroscopic method for the determination of Pb, Cd, Cr, Ni and Zn in candies and chocolate. In this approach, sample digestion was performed using 9 mL of nitric acid and 3 mL of perchloric acid. The digestion mixture was heated at 120 °C for about 5 h, followed by wet ashing for 18 h. Another study for the determination of metals (i.e., Zn, Pb, Ni and Cd) in candies was proposed by Devi at al. [22]. Sample decomposition was achieved by ashing followed by wet digestion with 25 mL of a mixture containing nitric and perchloric acid. In these approaches, either the consumption of chemicals and the sample preparation time was high, or the use of microwaves was required.
In this study, we aimed to develop a simple and rapid ICP-AES method for the determination of toxic and nutrient elements (i.e., Ag, Ba, Bi, Ca, Cd, Co, Cr, Cu, Fe, Mg, Mn, Ni, Pb and Zn) in various sweets, including jellies, hard candies and lollipops. For this purpose, different wet digestion methods were examined to ensure low consumption of chemicals, as well as a low sample preparation time. Subsequently, the developed method was validated in terms of accuracy, precision, linearity and sensitivity. Finally, the proposed method was employed for the analysis of various hard candies, jellies and lollipops in the Greek market.
2. Materials and Methods
2.1. Materials and Reagents
HNO3 of analytical grade was supplied by Merck (Darmstadt, Germany). A multi-element stock standard solution of 1000 mg L−1 containing all the examined toxic and nutrient elements was also supplied by Merck (Darmstadt, Germany). Sucrose (≥99.5%) was supplied by Sigma-Aldrich (Saint Louis, MO, USA). The working standard solution was prepared by appropriate dilution of the stock standard solution in 1.5 M HNO3. This concentration was chosen, since the residual acidity of the digested samples ranged between 0.6 M and 1.7 M. Finally, during the whole experimental procedure, high purity, double-distilled water was used.
2.2. Instrumentation
The determination of toxic and nutrient elements in all samples was performed using a Perkin-Elmer Optima 3100XL axial viewing ICP-AES instrument (Norwalk, CT, USA, https://www.perkinelmer.com/) equipped with a GemTip cross-flow nebulizer, a fully demountable Fassel type torch and a Scott double-pass cyclonic spray chamber. The sample solutions were introduced into the instrument using a peristaltic pump equipped with Tygon-type tubes. A segmented-array charge-coupled 235 sub-arrays detector and an Echelle grating polychromator were used. Table 1 summarizes the working parameters of the ICP-AES system.

Table 1.
Working parameters of the ICP-AES system.
For each element, two spectral emission lines were recorded, aiming to achieve the highest sensitivity. The selection of the spectral emission line was based on the absence of interferences, as well as the slope of their regression lines [11]. The chosen wavelengths for each element in this study were Ag 328.068 nm, Ba 233.527 nm, Bi 223.061 nm, Ca 396.847 nm, Cd 226.502 nm, Co 238.892 nm, Cr 357.869 nm, Cu 324.752 nm, Fe 238.204 nm, Mg 280.271 nm, Mn 257.610 nm, Ni 232.003 nm, Pb 217.000 and Zn 213.857 nm.
All vessels, beakers and glassware were soaked with 10% v/v HNO3 for at least 24 h prior to their use to avoid contamination and they were further rinsed with double de-ionized water. A Heidolph Instruments GmbH & CO hot plate (Heidolph Instruments GmbH & CO, Schwabach, Germany) was used for sample digestion.
2.3. Sample Collection and Preparation
In this study, sixteen samples of jellies (coded as JS), hard candies (coded as CS) and lollipops (coded as LS) were analyzed in order to determine their elemental composition in fresh weight (FW). All samples were purchased from local shops in Thessaloniki, Greece, and they belong to the most popular brands sold in the Greek market. In brief, the following samples were analyzed: JS-1 (cherry flavor), JS-2 (orange flavor), JS-3 (lemon flavor), JS-4 (strawberry flavor), JS-5 (orange flavor), JS-6 (cherry flavor), JS-7 (mint flavor), JS-8 (Chios gum flavor), CS-1 (strawberry flavor), CS-2 (strawberry flavor), CS-3 (mint flavor), CS-4 (mint and cherry flavor), CS-5 (orange flavor), CS-6 (mint flavor), LS-1 (orange flavor) and LS-2 (strawberry flavor).
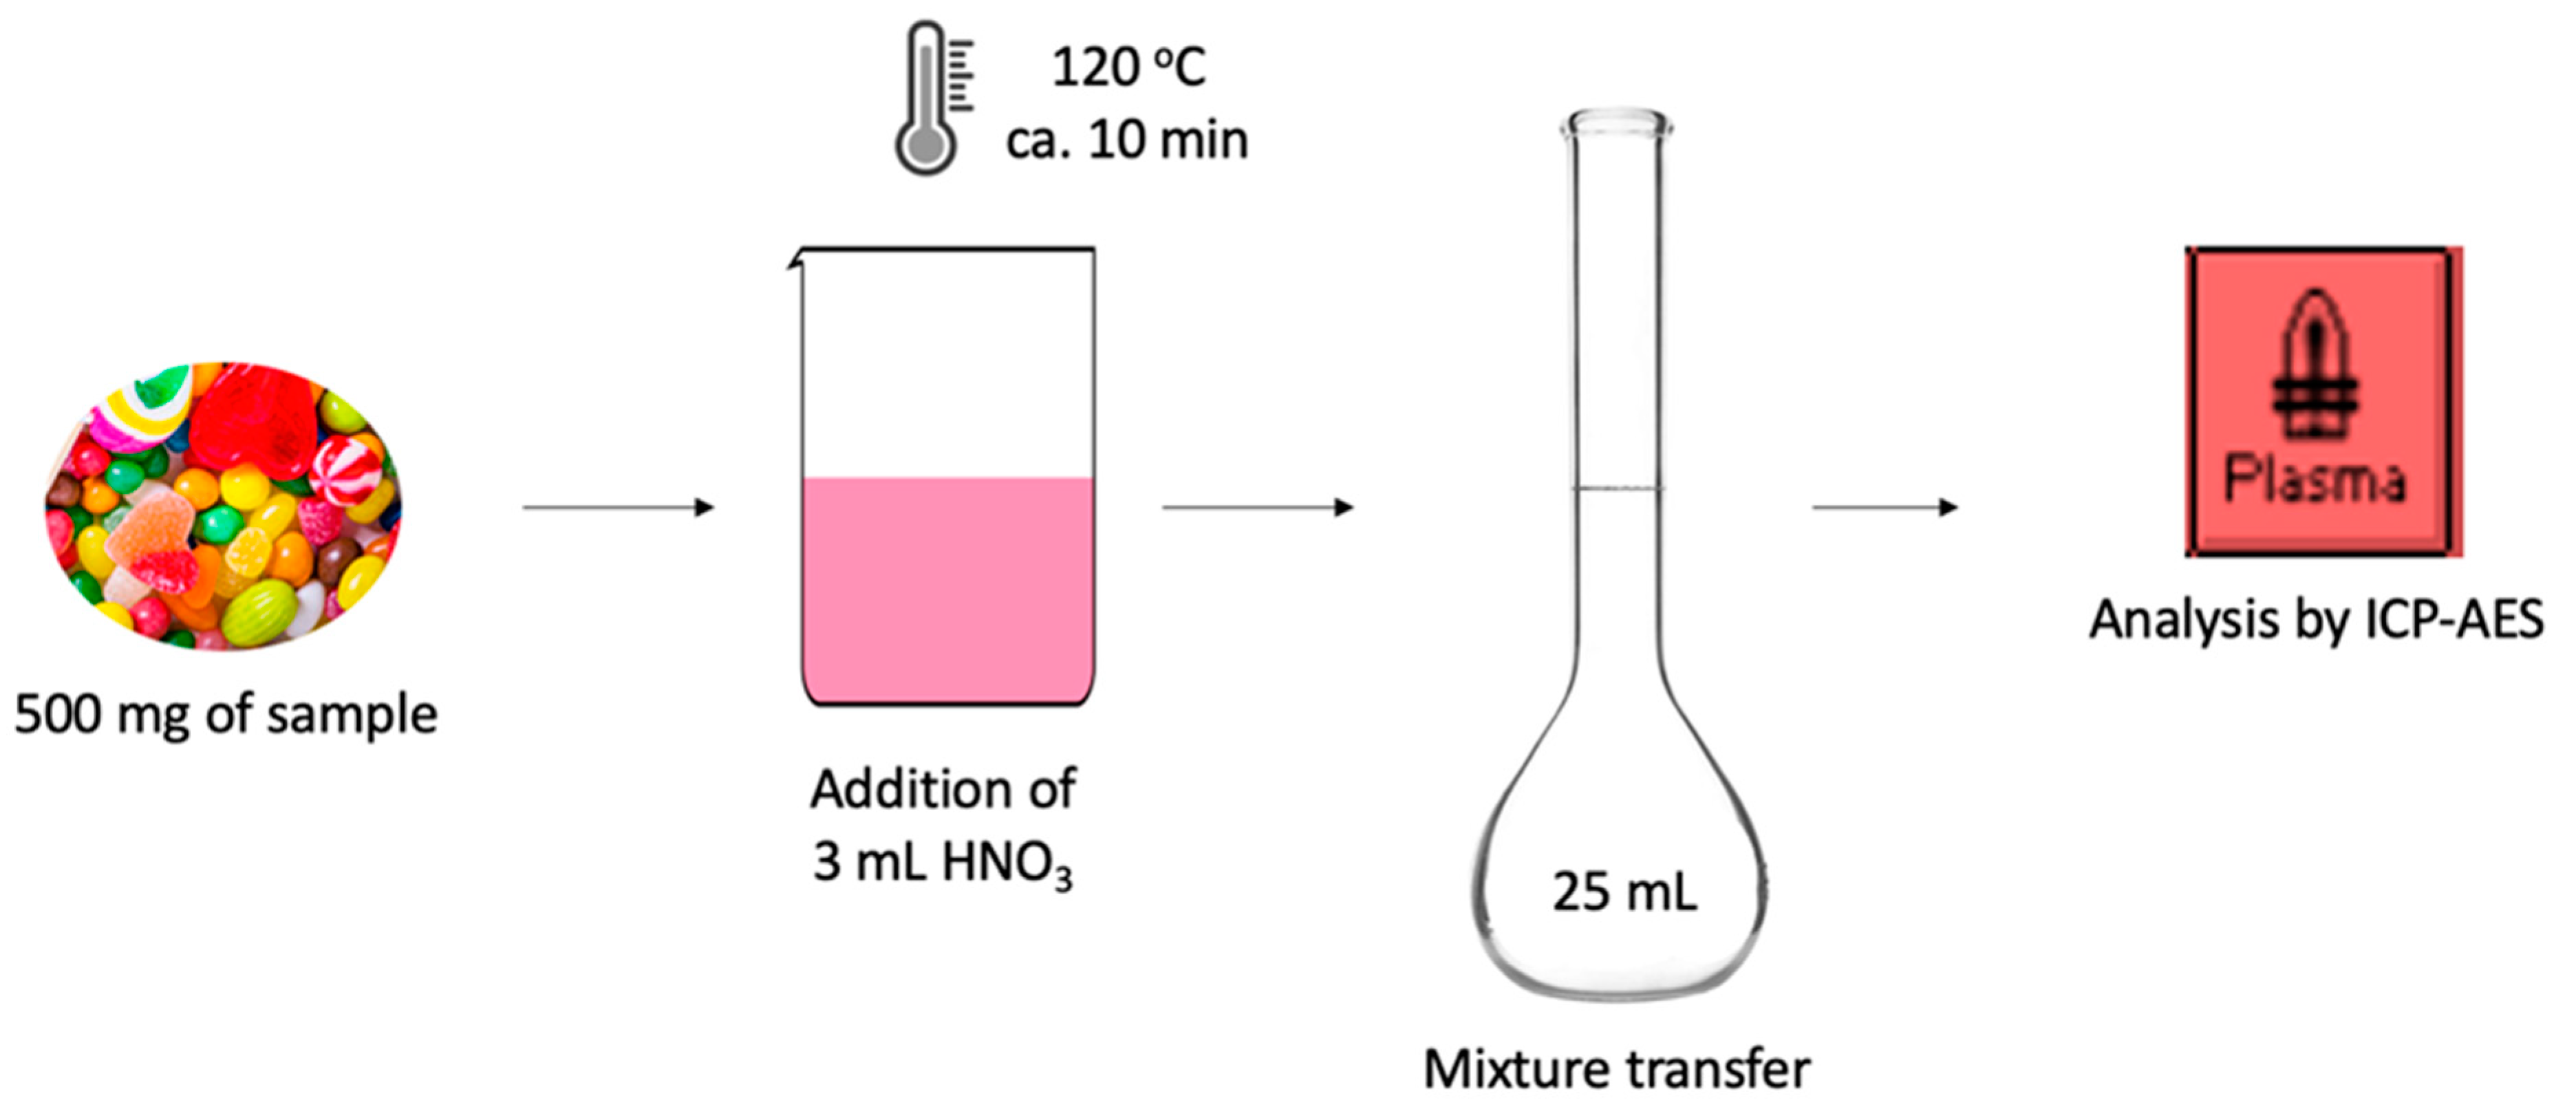
For the digestion of the samples, about 500 mg of a sample was weighed into dry, clean polytetrafluoroethylene (PTFE) beaker, followed by the addition of 3 mL of conc. HNO3. Complete sample decomposition was achieved by heating the samples at 120 °C for approximately 10 min. Accordingly, the samples were left to cool down to room temperature, after which they were then transferred to 25 mL volumetric flasks and their volume was made up to the mark using double de-ionized water. A schematic representation of the experimental procedure is shown in Figure 1.
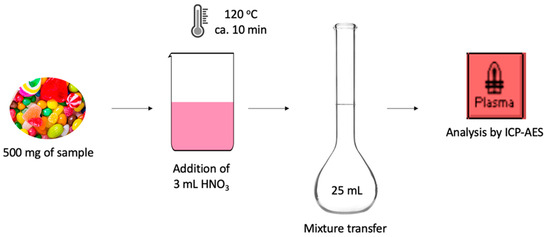
Figure 1.
Schematic representation of the experimental procedure.
2.4. Method Validation
The proposed method was validated in terms of accuracy, precision, linearity and sensitivity. The linearity of the ICP-AES method was evaluated using least square linear regression. The slope, intercept and coefficients of determination for the calibration curves of each element were calculated. Aqueous calibration curves, calibration curves in 2% w/v sucrose and standard addition curves using sample JS-4 were constructed. The sensitivity of the method was assessed by calculating the limits of detection (LODs) and the limits of quantification (LOQs). For this purpose, ten blank solutions were prepared and analyzed. The LOD and LOQ values were the concentration that correspond to three and ten times the standard deviation of the measurements for the blank solutions divided by the slope of calibration curves, respectively. Finally, the accuracy and precision of the method was assessed by analyzing spiked sample solutions in three replicates. The accuracy of the method was expressed as relative recovery (bias between the theoretical and the found concentrations of the spiked samples), while the precision of the method was expressed as the relative standard deviation (RSD%) of the replicate measurements [8,23].
3. Results and Discussion
3.1. Dissolution Procedures
In order to find the optimum digestion protocol for hard candies and jellies samples, multiple wet acid methods using double de-ionized water, concentrated HNO3 and H2O2 were evaluated. For this purpose, 0.5 g of the samples (CS-2 for hard candies and JS-4 for jellies) were placed in a PTFE beaker, followed by the addition of the digestion mixture and heating. The final digests were transferred to volumetric flasks of 25 mL and their volume was made up to the mark using double de-ionized water. Table 2 summarizes the visual observations for the digestion protocols that were examined in order to achieve complete decomposition of the solid sample. It was observed that H2O2 and double de-ionized H2O could not decompose the sample completely in the absence of an oxidizing agent. At room temperature, approximately 2 h were required for the complete decomposition of 0.5 g of the jelly samples, while hard candies were decomposed at approximately 1 h when 5 mL of conc. HNO3 were used as the oxidizing agent. The addition of H2O2 could assist the digestion procedure. As such, when 3 mL of conc. HNO3 and 2 mL of conc. H2O2 were used as the digestion mixture, the jelly and hard candy samples were completely decomposed at approximately 60 min and 30 min, respectively.
Table 2.
Dissolution tests for the digestion of hard candies and jellies (0.5 g sample).
In order to further increase the sample preparation time, boiling of the sample was employed. As such, the jelly and hard candy samples were completely decomposed in less than 10 min by the addition of 3 mL of conc. HNO3 at 120 °C. As a result, in order to ensure the minimum sample preparation time and the minimum consumption of chemicals, digestion of hard candies and jellies was performed by the addition of 3 mL of conc. HNO3 in a beaker containing 0.5 g of sample, followed by heating at 120 °C for approximately 10 min. Moreover, lower consumption of chemicals was required compared with previous studies for the candy samples [4].
3.2. Figures of Merit
In order to study the linearity of the proposed method, aqueous calibration curves, calibration curves in 2% w/v sucrose and standard addition curves were constructed. Table 3 summarizes the results of the slopes, their corresponding standard deviation and the coefficients of determination of all the examined elements for the calibration curves and the standard addition curves. For all elements, the difference between the slopes of the calibration curves of aqueous solutions, the calibration curves prepared in 2% w/v and the standard addition curves were less than 10%, indicating that there is no important matrix effect due to the presence of sugar. This observation is in agreement with the results of a previous study [24]. As a result, aqueous standard solutions were chosen to evaluate method linearity.
Table 3.
Slope ± standard deviation (coefficients of determination) of the different matrices.
Table 4 summarizes the regression lines, the coefficients of determination, the LODs, the LOQs and the upper limits of linear range for all the examined toxic and nutrient elements that were determined from the samples. As can be observed, the LODs for all the examined elements were between 0.04 mg kg−1 and 2.25 mg kg−1, while the LOQs were between 0.12 mg kg−1 and 7.50 mg kg−1. Wide linear ranges up to 125 mg kg −1 were observed for Bi, Ni, Pb and Zn, up to 500 mg kg−1 for Ag, Ba, Cd, Cr, Cu, Fe and Mn and up to 2000 mg kg−1 for Ca and Mg. The coefficients of determination were >0.9990, showing excellent fitness for the expected and the experimentally found values for all metals. For all metals, the linear working range ranges from the LOQ to the upper limit of the calibration curve.
Table 4.
Regression analysis, LODs, LOQs and upper limits of the linear range.
In order to evaluate the accuracy and the precision of the ICP-AES method, spiked samples (sample CS-2 for hard candies and sample JS-4 for jellies) at three concentration levels (25 mg kg−1, 100 mg kg−1 and 500 mg kg−1) were prepared and analyzed in triplicates. The results for the accuracy and the precision of the ICP-AES method are summarized in Table 5. As can be observed, the RSD values were lower than 9.0%, indicating that the precision of the ICP-AES method is good, while the relative recoveries for all concentration levels ranged between 80.0% and 119.0%, indicating good accuracy.
Table 5.
Accuracy and precision of the determination of nutrient and toxic elements by ICP-AES.
3.3. Analysis of Samples
The proposed method was employed for the analysis of 16 samples (jellies, hard candies and lollipops). The results for the examined analytes that were quantified in the jellies are summarized in Table 6, while the results for hard candies and lollipops are summarized in Table 7.
Table 6.
Elemental composition of the jelly samples.
Table 7.
Elemental composition of the hard candy and lollipop samples.
As can be observed, Ca and Mg were the metals that were determined in the highest concentration in the analyzed samples. The concentration of Ca ranged between 2.52 and 1182 mg kg−1 in jellies, between 5.93 and 26.3 mg kg−1 in hard candies and between 2.64 and 5.10 mg kg−1 in lollipops. The concentration of Mg ranged between 0.71 and 463 mg kg−1 in jellies, between 1.93 and 7.46 mg kg−1 in hard candies and between 0.71 and 2.37 mg kg−1 in lollipops. Ba was only determined in JS-7 at a concentration of 4.03 mg kg−1; in the same sample, the concentration of Ca and Mg were the highest among the examined samples. The concentration for Fe was up to 6.24 mg kg−1 (JS-8) and the concentration for Bi was up to 4.03 mg kg−1 (LS-2). Cr was determined in all samples at a concentration range of 0.15–0.78 mg kg−1 for the examined samples. Cr has been previously determined in candy samples [4], and its presence was attributed to contamination from packaging material; however, Cr also has been reported in food samples since it can be present in the raw materials used for their production. Ag, Cd, Co, Cu, Mn, Ni, Pb and Zn were not detected in the examined samples and Ba was not detected in the hard candy and lollipop samples, which indicates that their concentrations were lower than their LOD using the herein developed ICP-AES method.
3.4. Comparison with Other Studies
A comparison of the proposed methodology with other studies is presented in Table 8.
Table 8.
Comparison of the herein developed procedure with other studies.
As can be observed, in this study the number of the examined analytes was significantly higher, and the simultaneous multi-elemental determination of both toxic and nutrient metals was possible. Moreover, the proposed methodology exhibited adequate accuracy and precision. Regarding the experimentally found concentration ranges of the proposed elements, lower LOD values were reported in other methodologies [4,21]. This can be considered as a limitation of the proposed methodology, which can be overcome by coupling the herein mentioned experimental procedure (i.e., open-vessel wet digestion) with more advanced instrumentation, such as ICP-MS instruments, that are able to provide better sensitivity. It is important to mention that the proposed methodology could efficiently reduce the required sample preparation time and the consumption of chemicals compared to other studies [4,21,22], since only 3 mL of conc. HNO3 was needed, while complete sample decomposition was achieved within 10 min.
4. Conclusions
A plethora of sweet food products, including jellies, hard candies and lollipops, are available in local markets and are widely consumed by many consumers, ranging from children to elderly people. Therefore, the determination of the concentration of toxic and nutrient elements in these samples is of high importance. In this study, a simple and rapid ICP-AES method for multi-element determination in hard candies, jellies and lollipops was developed and validated. To the best of our knowledge, this is the first validated approach for the simultaneous determination of Ag, Ba, Bi, Ca, Cd, Co, Cr, Cu, Fe, Mg, Mn, Ni, Pb and Zn in jelly, hard candy and lollipop samples using open-vessel wet digestion. Under optimized conditions, less than 10 min were required for complete sample decomposition and there was no need for additional laboratory equipment (e.g., microwaves, autoclaves, etc.). The proposed method showed good linearity, accuracy and precision, as well as adequate LOD and LOQ values. Further reduction of the LODs and LOQs of the examined analytes could be potentially achieved by coupling the proposed methodology with the increasingly popular ICP-MS instruments, which provide enhanced sensitivity. In this study, Ca and Mg were determined in the highest concentrations in the samples. Ag, Cd, Co, Cu, Mn, Ni, Pb and Zn were not detected in the samples. Ba was determined in one sample, in which the concentration of Ca and Mg was the highest. Fe, Bi and Cr were also determined in the examined samples.
Author Contributions
Conceptualization, N.M. and G.A.Z.; methodology, experimental work, N.M.; N.M. and G.A.Z.; validation, N.M. and G.A.Z.; formal analysis, N.M. and G.A.Z.; investigation, N.M. and G.A.Z.; resources, G.A.Z.; data curation, N.M. and G.A.Z.; writing—original draft preparation, N.M.; writing—review and editing, N.M. and G.A.Z.; supervision, G.A.Z.; project administration, G.A.Z. All authors have read and agreed to the published version of the manuscript.
Funding
This research received no external funding.
Institutional Review Board Statement
Not applicable.
Informed Consent Statement
Not applicable.
Data Availability Statement
Not applicable.
Conflicts of Interest
The authors declare no conflict of interest.
References
- Miller-Ihli, N.J. Trace Element Determinations in Foods and Biological Samples Using Inductively Coupled Plasma Atomic Emission Spectrometry and Flame Atomic Absorption Spectrometry. J. Agric. Food Chem. 1996, 44, 2675–2679. [Google Scholar] [CrossRef]
- Momen, A.A.; Zachariadis, G.A.; Anthemidis, A.N.; Stratis, J.A. Use of fractional factorial design for optimization of digestion procedures followed by multi-element determination of essential and non-essential elements in nuts using ICP-OES technique. Talanta 2007, 71, 443–451. [Google Scholar] [CrossRef] [PubMed]
- Birghila, S.; Dobrinas, S.; Stanciu, G.; Soceanu, A. Determination of major and minor elements in milk through ICP-AES. Environ. Eng. Manag. J. 2008, 7, 805–808. [Google Scholar] [CrossRef]
- Kim, K.C.; Park, Y.B.; Lee, M.J.; Kim, J.B.; Huh, J.W.; Kim, D.H.; Lee, J.B.; Kim, J.C. Levels of heavy metals in candy packages and candies likely to be consumed by small children. Food Res. Int. 2008, 41, 411–418. [Google Scholar] [CrossRef]
- de Moura, S.C.S.R.; Berling, C.L.; Garcia, A.O.; Queiroz, M.B.; Alvim, I.D.; Hubinger, M.D. Release of anthocyanins from the hibiscus extract encapsulated by ionic gelation and application of microparticles in jelly candy. Food Res. Int. 2019, 121, 542–552. [Google Scholar] [CrossRef]
- Cano-Lamadrid, M.; Calín-Sánchez, Á.; Clemente-Villalba, J.; Hernández, F.; Carbonell-Barrachina, Á.A.; Sendra, E.; Wojdyło, A. Quality parameters and consumer acceptance of jelly candies based on pomegranate juice “mollar de elche”. Foods 2020, 9, 516. [Google Scholar] [CrossRef] [Green Version]
- Mutlu, C.; Tontul, S.A.; Erbaş, M. Production of a minimally processed jelly candy for children using honey instead of sugar. LWT 2018, 93, 499–505. [Google Scholar] [CrossRef]
- Manousi, N.; Zachariadis, G.A. Development and application of an ICP-AES method for the determination of nutrient and toxic elements in savory snack products after autoclave dissolution. Separations 2020, 7, 66. [Google Scholar] [CrossRef]
- Nardi, E.P.; Evangelista, F.S.; Tormen, L.; Saint-Pierre, T.D.; Curtius, A.J.; de Souza, S.S.; Barbosa, F., Jr. The use of inductively coupled plasma mass spectrometry (ICP-MS) for the determination of toxic and essential elements in different types of food samples. Food Chem. 2009, 112, 727–732. [Google Scholar] [CrossRef]
- Melai, V.; Giovannini, A.; Chiumiento, F.; Bellocci, M.; Migliorati, G. Occurrence of metals in vegetables and fruits from areas near landfill in Southern Italy and implications for human exposure. Int. J. Food Contam. 2018, 5, 8. [Google Scholar] [CrossRef]
- Momen, A.A.; Zachariadis, G.A.; Anthemidis, A.N.; Stratis, J.A. Investigation of four digestion procedures for multi-element determination of toxic and nutrient elements in legumes by inductively coupled plasma-optical emission spectrometry. Anal. Chim. Acta 2006, 565, 81–88. [Google Scholar] [CrossRef]
- El-Sayed, E.M.; Hamed, A.M.; Badran, S.M.; Mostafa, A.A. A survey of selected essential and heavy metals in milk from different regions of Egypt using ICP-AES. Food Addit. Contam. Part B Surveill. 2011, 4, 294–298. [Google Scholar] [CrossRef] [PubMed]
- Terol, A.; Paredes, E.; Maestre, S.E.; Prats, S.; Todolí, J.L. Alcohol and metal determination in alcoholic beverages through high-temperature liquid-chromatography coupled to an inductively coupled plasma atomic emission spectrometer. J. Chromatogr. A 2011, 1218, 3439–3446. [Google Scholar] [CrossRef]
- Karasakal, A. Determination of Trace and Major Elements in Vegan Milk and Oils by ICP-OES After Microwave Digestion. Biol. Trace Elem. Res. 2020, 197, 683–693. [Google Scholar] [CrossRef] [PubMed]
- Srinuttrakul, W.; Busamongkol, A. Elemental analysis of brown rice by inductively coupled plasma atomic emission spectrometry and instrumental neutron activation analysis. Energy Procedia 2014, 56, 85–91. [Google Scholar] [CrossRef] [Green Version]
- Sneddon, E.J.; Hardaway, C.J.; Sneddon, J.; Boggavarapu, K.; Tate, A.S.; Tidwell, S.L.; Gary, D.P.; Douvris, C. Determination of selected metals in rice and cereal by inductively coupled plasma-optical emission spectrometry (ICP-OES). Microchem. J. 2017, 134, 9–12. [Google Scholar] [CrossRef]
- Naozuka, J.; Carvalho Vieira, E.; Nascimento, A.N.; Oliveira, P.V. Elemental analysis of nuts and seeds by axially viewed ICP OES. Food Chem. 2011, 124, 1667–1672. [Google Scholar] [CrossRef]
- Velimirović, D.S.; Mitić, S.S.; Tošić, S.B.; Kaličanin, B.M.; Pavlović, A.N.; Mitić, M.N. Levels of major and minor elements in some commercial fruit juices available in Serbia. Trop. J. Pharm. Res. 2013, 12, 805–811. [Google Scholar] [CrossRef] [Green Version]
- Paz, S.; Rubio, C.; Frías, I.; Revert, C.; Hardisson, A. Toxic metals (Al, Cd, Pb and Hg) in the most consumed edible seaweeds in Europe. Chemosphere 2019, 218, 879–884. [Google Scholar] [CrossRef]
- Paz, S.; Rubio, C.; Frías, I.; Luis-gonzález, G.; Gutiérrez, Á.J. Human exposure assessment to macro- and trace elements in the most consumed edible seaweeds in Europe. Environ. Sci. Pollut. Res. 2019, 26, 36478–36485. [Google Scholar] [CrossRef]
- Orisakwe, O.E.; Igweze, Z.N.; Udowelle, N.A. Candy consumption may add to the body burden of lead and cadmium of children in Nigeria. Environ. Sci. Pollut. Res. 2019, 26, 1921–1931. [Google Scholar] [CrossRef]
- Devi, P.; Bajala, V.; Garg, V.K.; Mor, S.; Ravindra, K. Heavy metal content in various types of candies and their daily dietary intake by children. Environ. Monit. Assess. 2016, 188, 86. [Google Scholar] [CrossRef] [PubMed]
- Alampanos, V.; Kabir, A.; Furton, K.G.; Roje, Ž.; Vrček, I.V.; Samanidou, V. Fabric phase sorptive extraction combined with high-performance-liquid chromatography-photodiode array analysis for the determination of seven parabens in human breast tissues: Application to cancerous and non-cancerous samples. J. Chromatogr. A 2020, 1630, 461530. [Google Scholar] [CrossRef] [PubMed]
- Ioannidou, M.D.; Zachariadis, G.A.; Anthemidis, A.N.; Stratis, J.A. Direct determination of toxic trace metals in honey and sugars using inductively coupled plasma atomic emission spectrometry. Talanta 2005, 65, 92–97. [Google Scholar] [CrossRef] [PubMed]
- Dahiya, S.; Karpe, R.; Hegde, A.G.; Sharma, R.M. Lead, cadmium and nickel in chocolates and candies from suburban areas of Mumbai, India. J. Food Compos. Anal. 2005, 18, 517–522. [Google Scholar] [CrossRef]
Publisher’s Note: MDPI stays neutral with regard to jurisdictional claims in published maps and institutional affiliations. |
© 2021 by the authors. Licensee MDPI, Basel, Switzerland. This article is an open access article distributed under the terms and conditions of the Creative Commons Attribution (CC BY) license (https://creativecommons.org/licenses/by/4.0/).