Abstract
This article compares direct turbine throttle control and active turbine throttle control for a turboelectric system; the featured turboprop is rated for 7 kW of shaft output power. The powerplant is intended for applications in unmanned aerial systems and requires a control system to produce different amounts of power for varying mission legs. The most straightforward control scheme explored is direct turbine control, which is characterized by the pilot controlling the throttle of the turbine engine. In contrast, active control is characterized by the turbine reacting to the power demanded by the electric motors or battery recharge cycle. The transient response to electric loads of a small-scale turboelectric system is essential in identifying and characterizing such a system’s safe operational parameters. This paper directly compares the turbogenerator’s transient behavior to varying electric loads and categorizes its dynamic response. A proportional, integral, and derivative (PID) control algorithm was utilized as an active throttle controller through a microcontroller with battery power augmentation for the turboelectric system. This controller manages the turbine’s throttle reactions in response to any electric load when applied or altered. By comparing the system’s response with and without the controller, the authors provide a method to safely minimize the response time of the active throttle controller for use in the real-world environment of unmanned aircraft.
Keywords:
hybrid propulsion; turboelectric; UAV; UAS; turbogenerator; E.V.; power management; throttle control 1. Introduction
1.1. Purpose
The Federal Aviation Administration (FAA) funded research at Oklahoma State University to assemble, test, and integrate turboelectric powerplants to assess proper safe operating parameters and identify potential safety hazards. A turboelectric system is a turbomachinery-based powerplant that develops its usable energy by burning hydrocarbon fuels, which can be used for applications such as unmanned aircraft. The shaft work of the turbine is then converted to electricity by spinning a generator. The energy created, in turn, powers the electric motors that propel the aircraft. The size and scale of turboelectric systems vary significantly. The largest body of research focuses on multi-megawatt-scale systems meant to power the next generation of commercial aircraft [1,2,3]. Because of the large amounts of power being transmitted, current designs for these large aircraft require superconducting transmission lines. This major constraint has led to a body of research focused on modeling the cooling system requirements for such a complex system [4,5].
The next step down in scale focuses on turboelectric systems that are meant to be integrated into urban air mobility systems (UAM). This class of turboelectric systems generally operates at more than 100 kW of power. These UAM concepts utilize electric motors to enable their vertical takeoff and landing (VTOL) flight modes. NASA has explored how such systems could be realized, but the research is currently limited to modeling [6,7]. Current battery technology lacks the energy density required to make a battery-only system viable for even medium distance travel [8]. After accounting for installation loss, the current best commercially available battery packs have approximately 170 Wh/kg specific energy. However, a commercially viable aircraft requires specific energy of at least 300 Wh/kg [9]. The range and endurance of current prototype battery-only aircraft are limited for commercial UAM applications, and there are currently no flight-worthy turboelectric UAM systems.
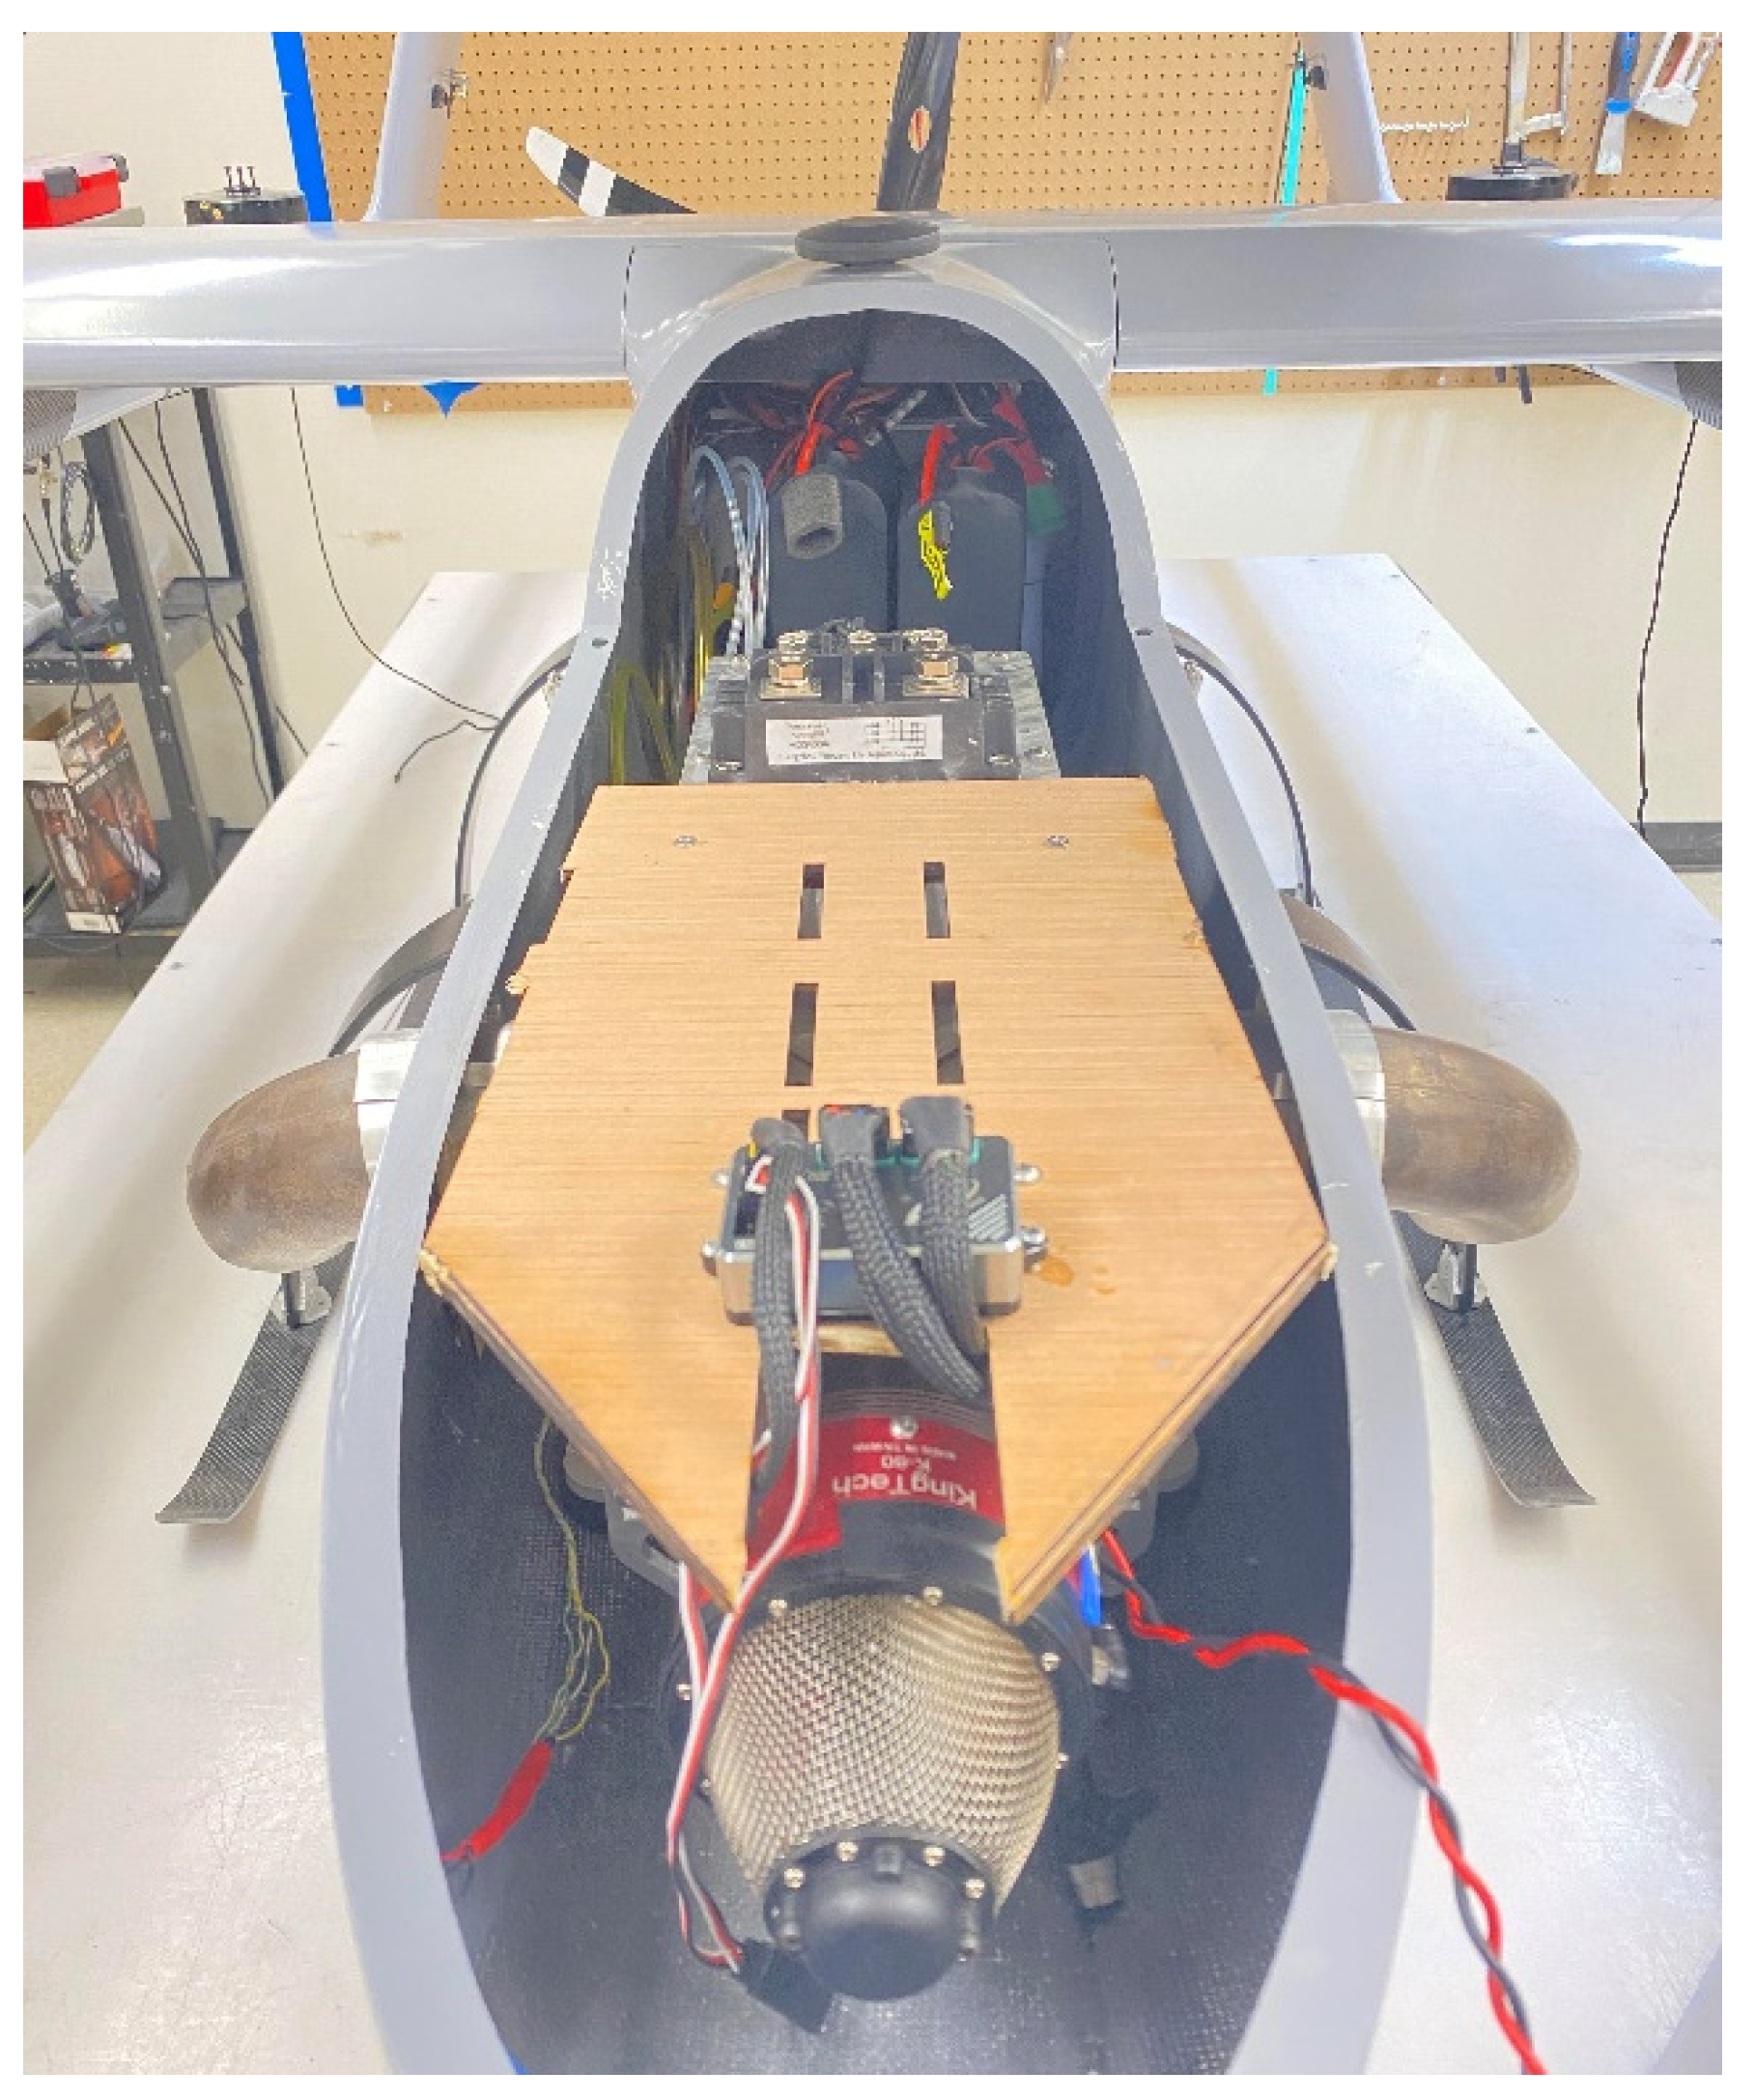
The class of turbines at the bottom of the scale is meant for miniature unmanned aerial systems (UAS). These turbines are called ultra-micro gas turbines and typically produce less than 1 kW of power. These proposed turbines can weigh less than 500 g and allow for an entirely new class of UAS to be realized [10,11]. However, significant engineering challenges have prevented any ultra-micro gas turbine from achieving its design point output power. This article focuses on a 7.3 kW shaft-power-rated turboprop engine. This turboelectric system is intended to act as the powerplant for UAS and can be seen installed within an unmanned aircraft in Figure 1.

Figure 1.
The 7.3 kW turboelectric system integrated into a UAS.
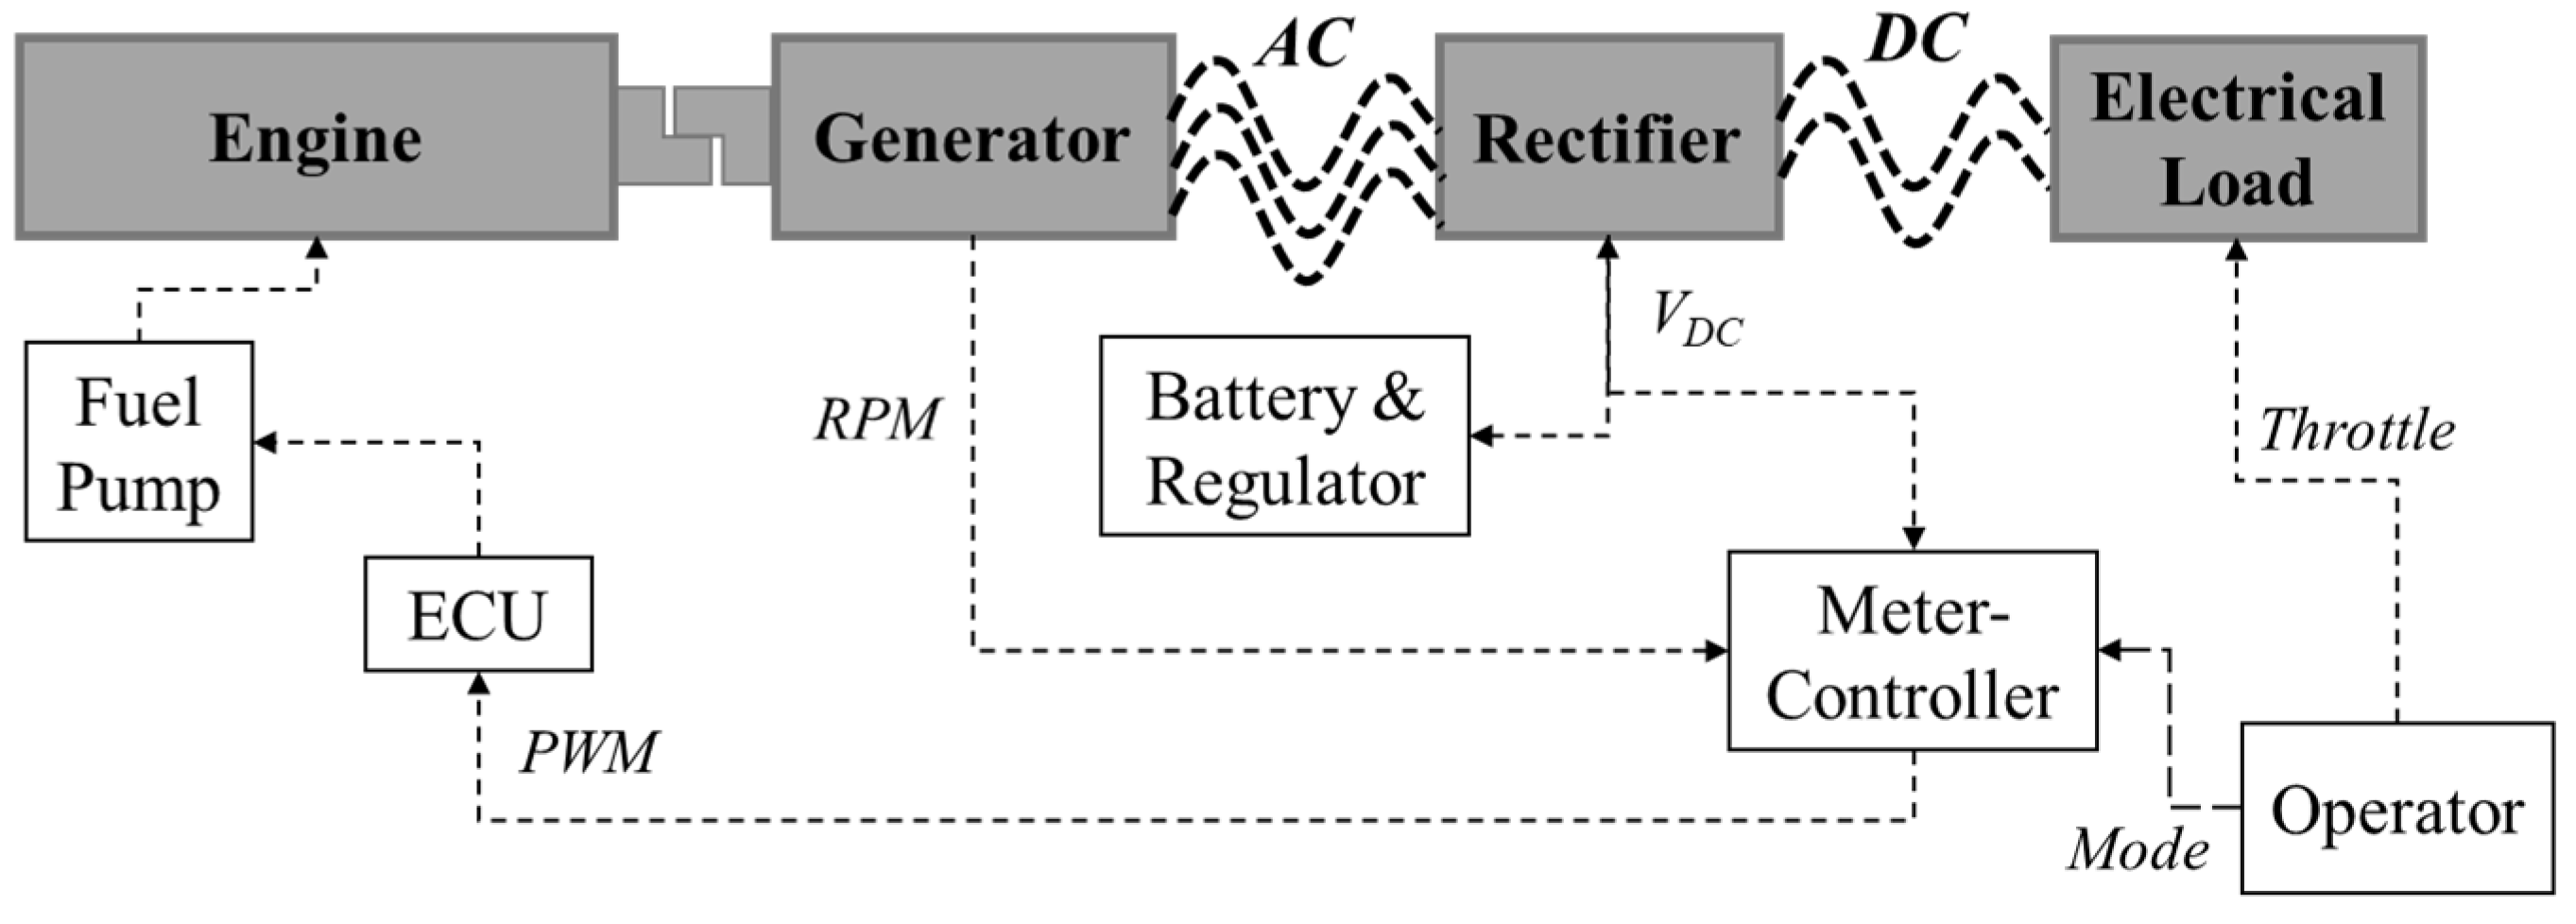
A basic schematic for a turboelectric system like the one investigated can be seen in Figure 2. These small-scale turboelectric systems have prospective advantages in higher-altitude flight applications when compared to reciprocating gas-burning engines. Small reciprocating gas engines are limited in operational altitude without the use of forced induction.
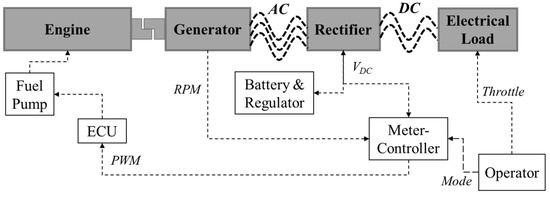
Figure 2.
A basic schematic of the turboelectric system. The meter-controller determines the throttle sent to the turbine.
Commercially available micro turbojets intended for UAS applications can operate up to approximately 9000 m because of a turbine engine’s increased inlet compression ratio compared to naturally aspirated piston engines [12]. There is no literature on turbocharger modeling for small UAS known to the authors. Large, turbocharged, piston-driven systems (over 100 kW) are used on UAS meant for high-altitude weather data collection typically. These turbochargers tend to be relatively heavy and multi-spool, and they are also optimized for performing at much higher altitudes (18,000 m) than commercially available microturbines [13,14].
This gap in the market creates a niche whereby a smaller-scale UAS could use a turboelectric system when operating at specific altitude regimes. Compared to batteries alone, a turboelectric system provides the option to utilize the improved energy density of hydrocarbon fuels over battery-only power sources while maintaining the flexibility and convenience of electrified propulsion. Higher-altitude missions are also in colder ambient conditions than corresponding lower-altitude missions. These low and potentially extreme operating temperatures are a significant concern for battery-based systems.
There is not a significant body of research focusing on the actual fabrication and implementation of turboelectric systems known to the authors. Most research to date related to turboelectric systems has been performed in theory or has been simulated. Notably, work has begun by NASA at the Glenn research center on ground test hardware for a megawatt-scale turboelectric system [15]. NASA has also created a 200 kW ground test device that has successfully operated and distributed power [16]. Overall, there is a lack of research on the actual construction of such a system. In particular, there has been little focus on the more practical real-life considerations of design, especially for the UAS scale, where there is limited research being conducted. Far-reaching survey papers on the subject offer various piston-driven hybrid aircraft but contain no mention of turbine-based hybrid systems [17].
1.2. Background
Few small-scale turbine-based power systems are rated for approximately under 30 kW of power production. Turbine powerplants are commercially available, ranging near the 30 kW capability intended for grid power applications. However, those from Capstone turbines are not designed for UAS applications and tend to be too heavy for said uses. The turboelectric variant of the commercial Monarch 5 turboprop is the only other system of a similar class that may be flightworthy to the authors’ awareness. However, publicly available information is limited, and the system does not appear to have been flown.
Because of this market gap, there were no commercially available turboelectric systems for UAS applications. The team had to modify an existing turboprop to act as the powerplant. The turboprop’s output shaft was modified to drive a generator instead of a propellor, as typically suited. The turbine used for experimentation is a model K-60TP. According to Kingtech, the manufacturer, this engine can produce approximately 7.3 kW of shaft power at approximately 7000 RPM. This constraint meant that the team had to design the electrical portion of the turboelectric system from the ground up to operate at this design point. It also meant implementing a way to control the turbine to operate the turbogenerator effectively was needed.
Research has been conducted at Oklahoma State University for active throttle control for UAS turboelectric systems [18,19]. The need for a dynamic, transient throttle control had been identified in this paper, and there was a preliminary attempt to implement a throttle controller. Some challenges were highlighted, and a fully realized controller was not implemented.
The active throttle control implemented in this paper directs the turboelectric system without input from the pilot. The source voltage from the rectifier bus of the turboelectric system is used as the input variable for the active throttle controller. The voltage must be maintained within a particular window to ensure safe operation for the entire system. Each component must be sized and appropriated to fit within the voltage constraints of the system. This voltage window also acts as the target voltage margin for the throttle controller, with the median being the target voltage. The controller monitors the source voltage and responds, as necessary, with the proper PWM throttle signal to the turbine electronic control unit to maintain the desired system source voltage.
Characterized by the velocity constant of the electric generator, , the rotational velocity of the output shaft of the turboprop is directly proportional to the generator’s voltage production because of the mechanical coupling of the output shaft to the generator. For example, if the known supplied voltage to an electric motor under no load is multiplied by that motor’s value, then one would derive the instantaneous angular velocity of said motor. This detail is essential when compiling and sizing the various components that make up the turboelectric system.
With the application of an electric load to the turboelectric system, the generator rotational speed will lower as the electric motor uses increased torque levels on the turbine shaft, and the electric demand increases. This reduction in angular velocity results in a measurable source voltage drop from the turbogenerator combination. A sudden voltage increase, or “spike”, can occur when an electric load is removed or reduced. The active throttle controller monitors these voltage discrepancies and reacts accordingly to maintain the proper system voltage. The relationship between an electric motor’s , voltage, and is detailed in Equation (1) [20].
1.3. DTC and ATC
For proper flight control, it is vital to characterize the throttle behavior of a propulsion system. Oklahoma State conducted previous flights with turbine-based, direct throttle control. The pilot supplied throttle inputs directly to the turboprop engine electronic control unit (ECU), leaving the electrical load (the electric motors propelling the aircraft) to respond to the turbogenerator’s power output naturally. Without classifying this performance, it is difficult to control the turbine system, and in the case of a turbogenerator, this can lead to extensive electrical system damage.
This control style is not desirable because of the lag between throttle input and variation in thrust output. There are also further difficulties at lower power outputs when the pilot desires to throttle the aircraft to a power output more inferior than the idle power output of the turbine. In this idle scenario, when the pilot has the throttle reduced to the minimum, the aircraft may utilize too much power and be unable to slow down sufficiently.
In dissimilar motors with differing throttle demands, DTC is incapable of supplying power individually or adequately. An example of a dissimilar motor setup aircraft would be a quadrotor, VTOL aircraft. It is, therefore, necessary to develop an active throttle control scheme, where the pilot or autopilot throttles the electric motors propelling the aircraft, and the turbine responds to any demands of the load. This active controller will significantly improve pilot control and decrease pilot workload compared to the turbine-based throttle control. The active throttle controller will also help ensure proper system voltage and power management utilization throughout the operation during nominal working conditions.
One of the benefits of using electric motors as propulsors is the short response time to a given throttle input or power demand. From a pilot’s perspective, an electric motor is desirable for its near-instantaneous throttle response compared to the response time of a combustion-based engine. Electric motors can be commanded to make drastic, sporadic throttle changes, and the motors can respond as quickly as the power source can supply current to the motor.
A significant example of this need for rapid throttle change is in VTOL aircraft. VTOL electric aircraft use rapid changes in throttle response to balance the aircraft between its points of control, which places a time constraint on the electrical power bank that must respond quickly to a changing load. The time it takes for the turbine engine to throttle from idle to full power is measured in seconds, while the response of an electronic speed controller is measured in milliseconds. So, while the turbine is revving up, there is a need for the system to be supplying instantaneous power. For this reason, having batteries integrated into the power system is essential.
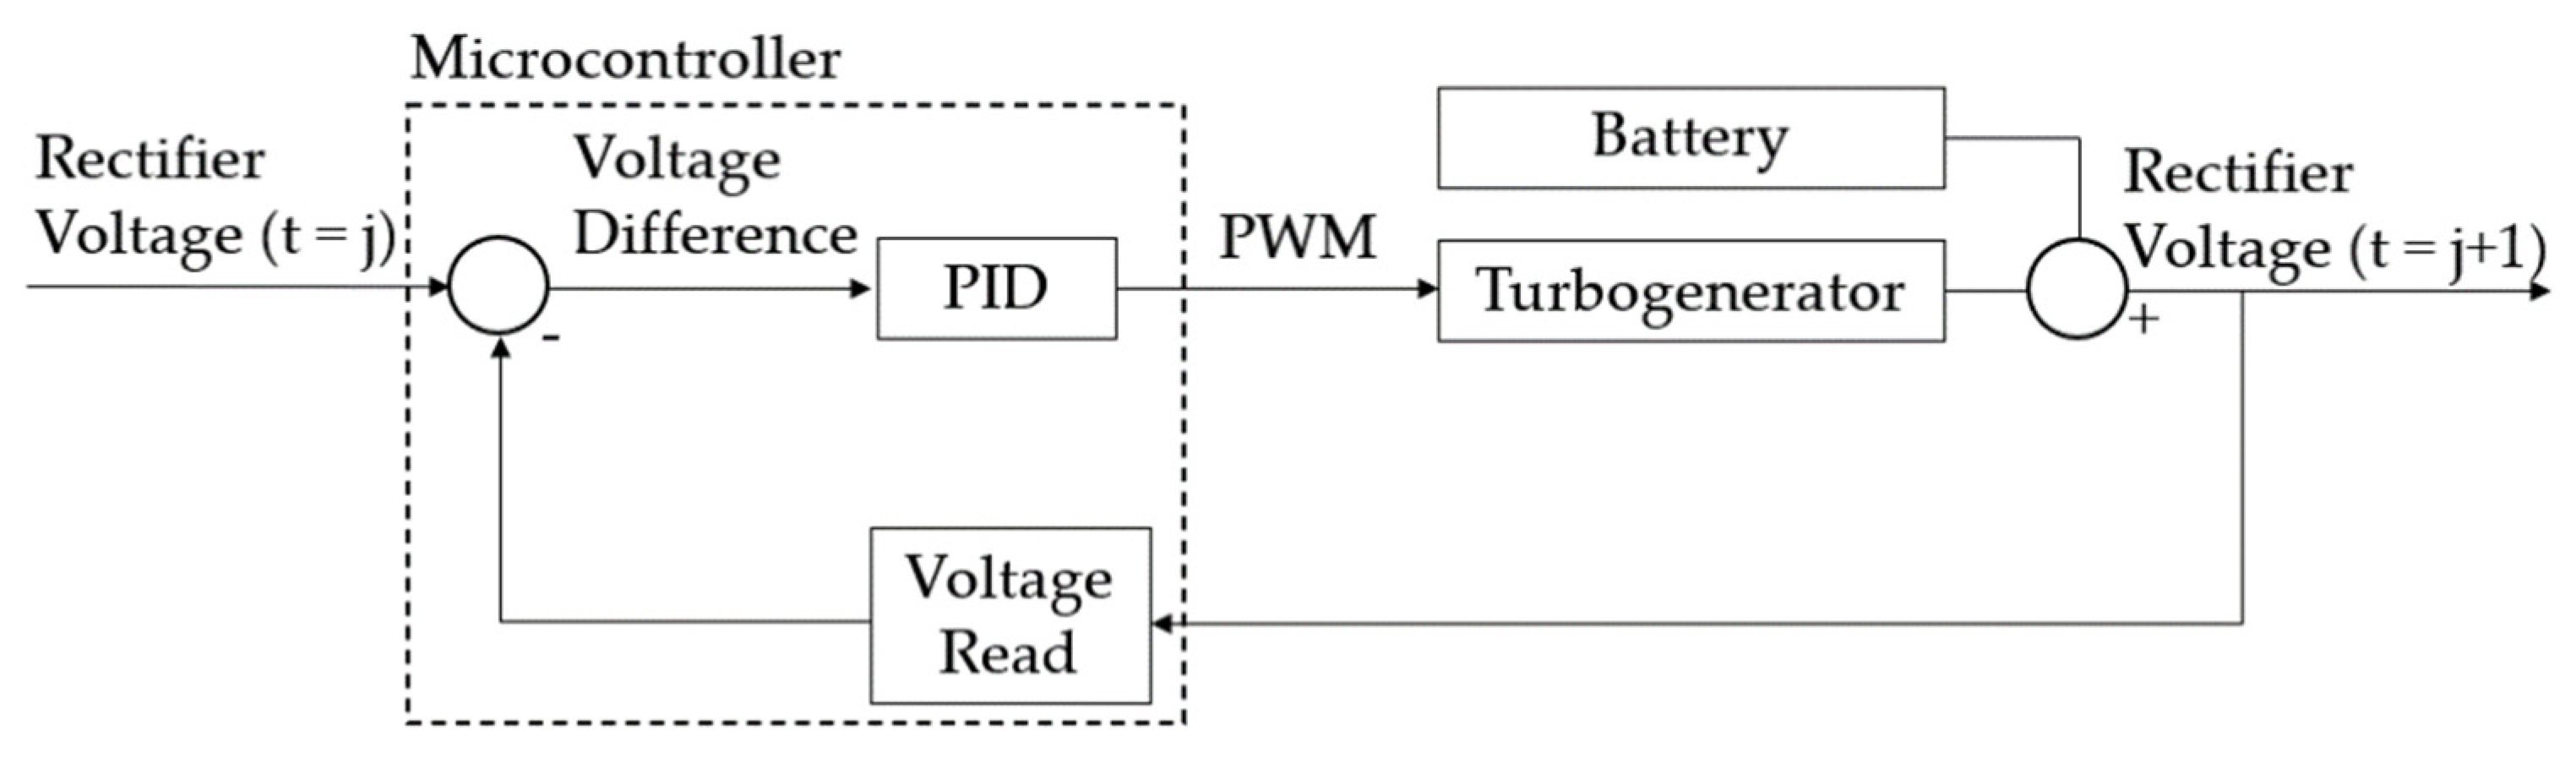
Active throttle control, ATC, provides an autonomous method for the turbine to react to any given electric load supplied by the pilot or operator. From an operability standpoint, the ATC, in conjunction with battery augmentation, allows the pilot to control the aircraft as if the power source were solely battery-powered. The turbine has time to react to demands from the fluctuating electric loadings on the turbine output shaft with battery supplementation. The turbine mechanically can take up to five seconds to increase from idle to maximum throttle, while electric motors are capable of a full-throttle sweep in under a second in most conditions. The control schematic can be seen in Figure 3.
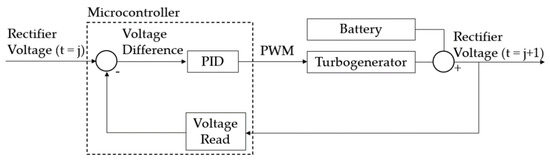
Figure 3.
A block diagram of the ATC operating mode.
A PID controller was used to control the throttle inputs to the turbine. In this operating mode, the main goal of the turbine is to maintain a constant supply voltage to the electrical load. The voltage supplied by the turbogenerator varies as the demanded load is changed (this can be seen later in this paper). The voltage supplied to the load (i.e., the rectifier voltage) is used as a feedback variable for the PID. The rectifier voltage directly depends on the voltage from the turbogenerator, with discrepancies due to the current traveling through the rectifier and the rectifier’s temperature. As the temperature of the device increases, its internal resistance and subsequent voltage drop through the device increases directly with it, shown in Equation (2). This increase in resistance supplies a more significant discrepancy between the turbogenerator voltage and the rectifier bus voltage shown in Equation (3). However, with proper current and temperature monitoring, this change in rectifier forward voltage, , can be estimated and accounted for in real-time or in post-processing.
The battery pack allows the electric loads to charge and discharge safely based on the operator’s inputs. When the electric load suddenly throttles down, the turbine’s lag creates a charging potential voltage difference across the battery pack. During extended charging cycles, individual cell balancing is required for safe use. Without monitoring the instantaneous voltage of every cell within the battery system, one or multiple cells could exceed or fall below safe voltage operation ranges. In this case, the batteries could swell, causing volumetric issues. Another, more detrimental failure could cause the battery to combust onboard the aircraft or lose partial, if not all, battery-supplied power to the system.
2. Materials and Methods
A static, ground test stand was designed and assembled to test the turboelectric system’s capabilities and potential safety concerns, specifically during transient, dynamic loading. This bench test stand utilized an aluminum optical breadboard attached to a steel rolling table for ease of mobility and modularity. A 20 kW-rated electric motor, driving a three-blade, 28 in. propeller, and two separate five kW-rated electric ducted fans (EDFs) were chosen as the applied electric loads during the experiments.
Electric motors pose a danger risk more severe than that of piston engines, as stated in [20]: “Model aircraft electric motors can be more dangerous than gas engines of the same power class because the propeller does not slow down readily when a body part is hit; rather, the motor just pulls more current from the battery (source) as it attempts to retain the RPM”. The 20 kW motor and corresponding propeller were housed within a wire-mesh assembly to ensure foreign objects could not impact the blades to help prevent injury during testing. The ground test stand provides a portable testbed that can be utilized for differing ranges of turboelectric systems, with a maximum overall power loading capability of 23 to 28 kW. A photo of this system can be seen in Figure 4.
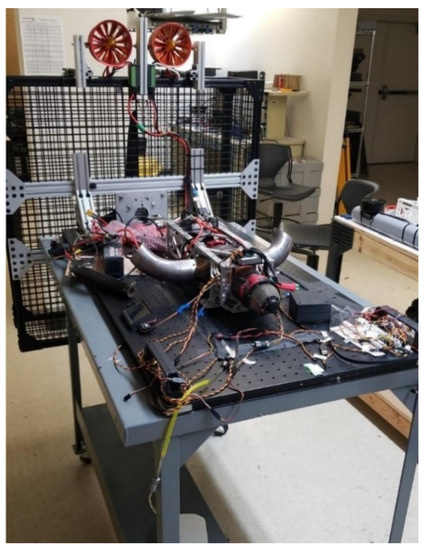
Figure 4.
A photo of the bench test stand with the K-60TP-based system installed, showing the available electric loads of the 28 in. propeller motor and two additional five kW EDFs.
Multiple temperature sensors were installed to monitor the thermal performance at critical locations on the test setup. Voltage and current produced by the generator were monitored and logged to provide real-time power production values of each system. The power produced was calculated using voltage and current values measured by the Mauch Power Module in Table 1. This power module was placed inline between the turboelectric system and the electric load (motor). This hall effect sensor package designed to monitor voltage and current data can be seen in Figure 5. Power was calculated from the measured voltage and current values. Turbine throttle data and turbine fuel consumption rate were also observed in real-time to help ensure the turbine was not operating in a dangerous regime (e.g., operating at too high of a voltage).

Table 1.
Test equipment used during the experimentation.
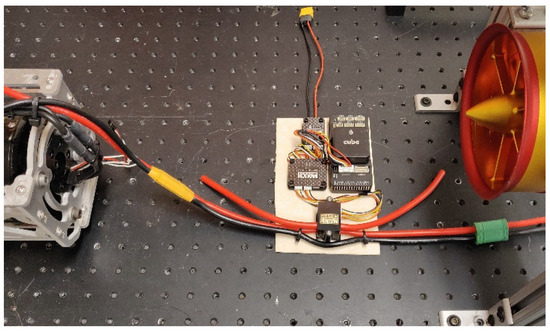
Figure 5.
A photo of the Mauch Power Module used to measure voltage and current between the turboelectric system and the load (both lines of the power module were used during the testing for this paper).
For a battery pack to achieve total voltages higher than the 4.2 V maximum of the individual cells, the cells can be placed in series to add their corresponding voltages together in total, as shown in Equation (4) [20]. For example, a 12S battery pack has 12 individual Lithium polymer (Li-Po) cells tied together in series, hence the “S”. This 12S battery pack adds the twelve 3.7 V cells together to create a 44.4 V nominal battery pack. Suppose the battery assembly voltage is monitored with disregard to individual cells. In that case, it is a potential hazard that an individual cell could under or overvolt while the battery pack appears to be within a tolerable voltage window altogether. For this reason, it is necessary to ensure that each cell of the Li-Po battery packs used in the turboelectric system maintains an acceptable voltage. Li-Po batteries present potential safety hazards if any under or overvoltage is experienced for extended periods. General characteristics of a select number of battery chemistries can be found in Table 2—Specific energy of different battery chemistries [20].
Table 2.
Specific energy of different battery chemistries.
A battery augmentation system was developed to aid with the performance of the turbine and system response time. A battery package can add power in conjunction with the turbogenerator output and respond to desired power inputs more quickly than the turbine is physically able to. A battery management system (BMS) was used to monitor the voltages of the individual cells of the batteries. The battery’s charge capacity, instantaneous charge/discharge rates, and voltages for each battery cell were tracked by the BMS to ensure the battery system would not be damaged. The individual cell voltage tolerances for Li-Po batteries are 3.7 V ± 0.5 V. This restriction means that the minimum recommended voltage for an individual Li-Po battery cell is 3.2 V volts. In comparison, its maximum is 4.2 V, and its nominal voltage is 3.7 V. The BMS ensured that these voltage constraints were maintained for each cell rather than solely monitoring the combined battery assembly. A data screen from the BMS can be seen in Figure 6.
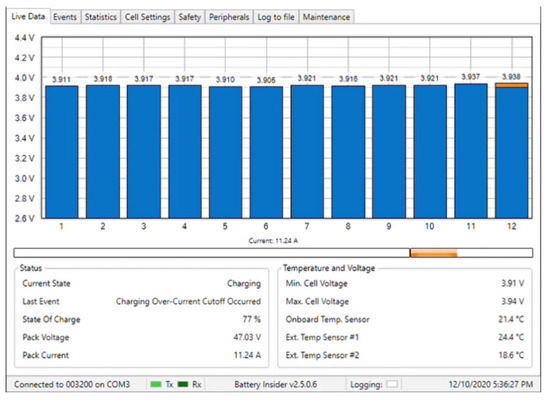
Figure 6.
Screen capture of the BMS showing cell voltages nearly leveled during charging.
3. Results
3.1. Identification of Transient Endpoints
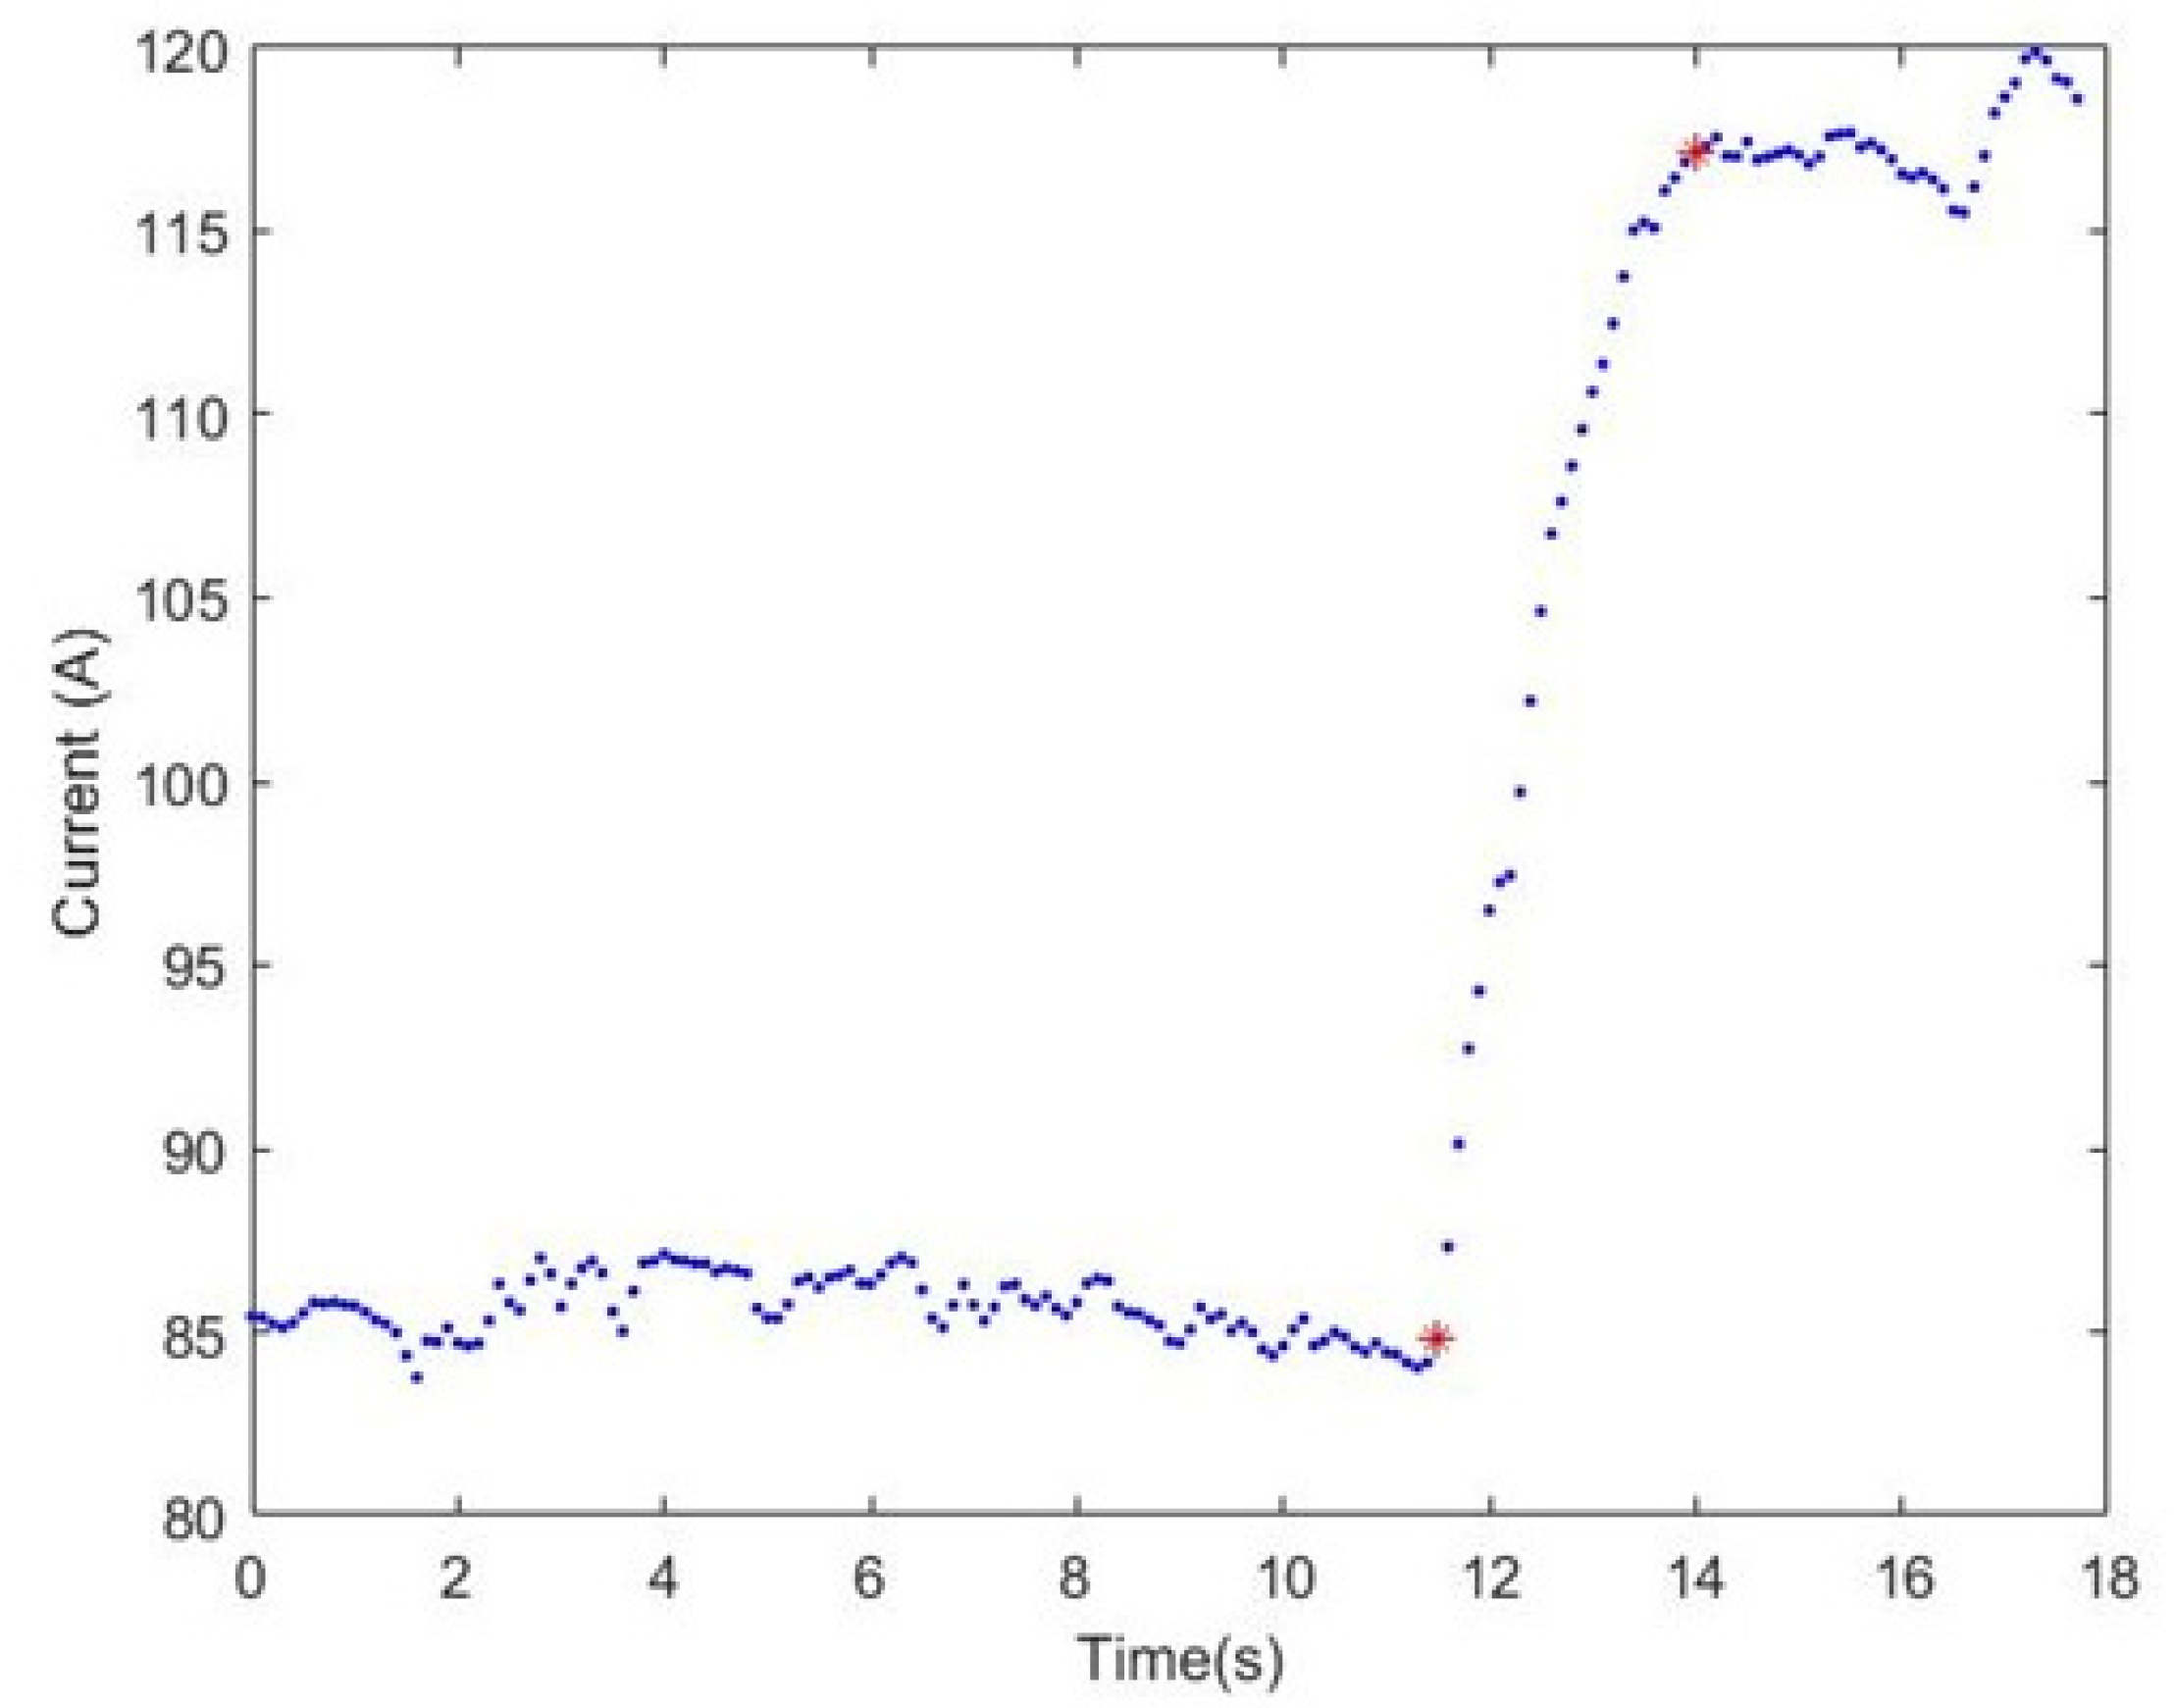
A program was needed to be developed in order to determine where variations in voltage and current occurred. These variations were used to classify the transient regime of the throttle tests within the program. The first step involved cropping data around each throttle transient window so that the data only contained the transient and the steady-state period before and after the transient points. The data generally appeared, as shown in the example in Figure 7. Each test point had the turbine or load settled at one throttle point and was rapidly changed to another pre-determined point. The abrupt change noted can be seen in Figure 7, where the current is steady until it rapidly increases and settles at a new, higher steady point.
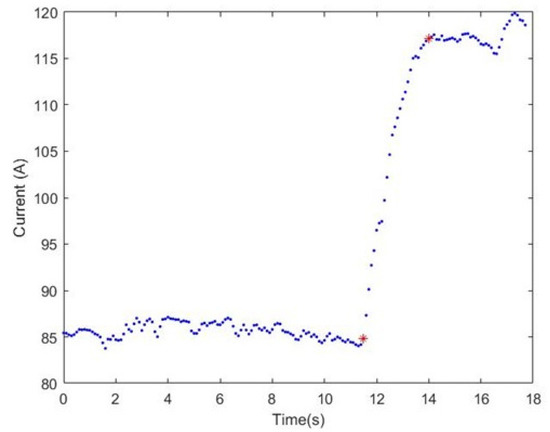
Figure 7.
An example of transient throttle data displaying current as a function of time. The endpoints of the transient are marked in red.
Start and endpoints needed to be identified to extract the dynamic section from these data successfully. A running average of the last 20 points (n-20, n) was generated for every point in the data set to identify the starting point. The standard deviation of the previous 20 points was also calculated. An example of these averages can be seen in Figure 8. Once these values were calculated, the program would step through each point, n. The program would check if the next point, n + 1, exceeded ±1 standard deviation from the running average. If the n + 1 point exceeded +1 standard deviation, the program would check if the n + 2 point exceeded +2 standard deviations from the original (n) point.
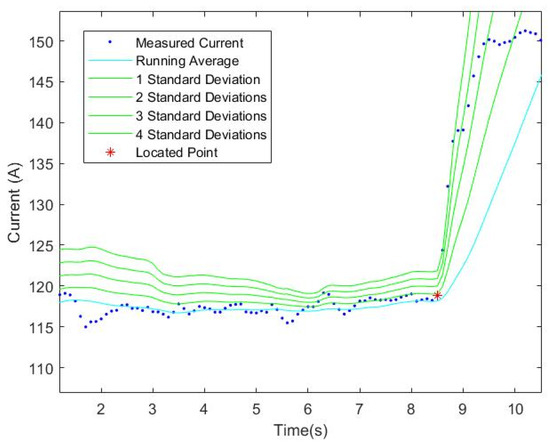
Figure 8.
A plot showing measured currents, a running average, and positive multiples of the standard deviation.
Similarly, if the n + 1 point exceeded −1 standard deviation, the program would check if n + 1 exceeded −2 standard deviations. This process was repeated for n + 3 and n + 4 against ±3 and ±4 standard deviations, respectively. If all four standard deviation comparisons were exceeded, then point n was considered the beginning point of the throttle transient. A similar process was used for the endpoint of the throttle transient. The endpoint program differed in that instead of using the last 20 points for the running average, the following 20 points (n, n + 20) were used. The program also ran from the end of the data set backward.
This method was used instead of one which checks for consecutively rising points because there was a possibility that some data sets involved an extremely rapid change within a few points. There was also the possibility of consecutively rising points not part of the transient test, as seen at approximately the 16 s mark in Figure 7. An algorithm based on the absolute magnitude of change at the beginning and end of the throttle transient could not be used because the magnitude of change varied between throttle tests (e.g., the 50–100% transient would have a more considerable shift in current than the 50–75%). The method used is advantageous as it automatically scales to the magnitude of change in current and avoids many potential false transient points.
3.2. Direct Turbine Control Data
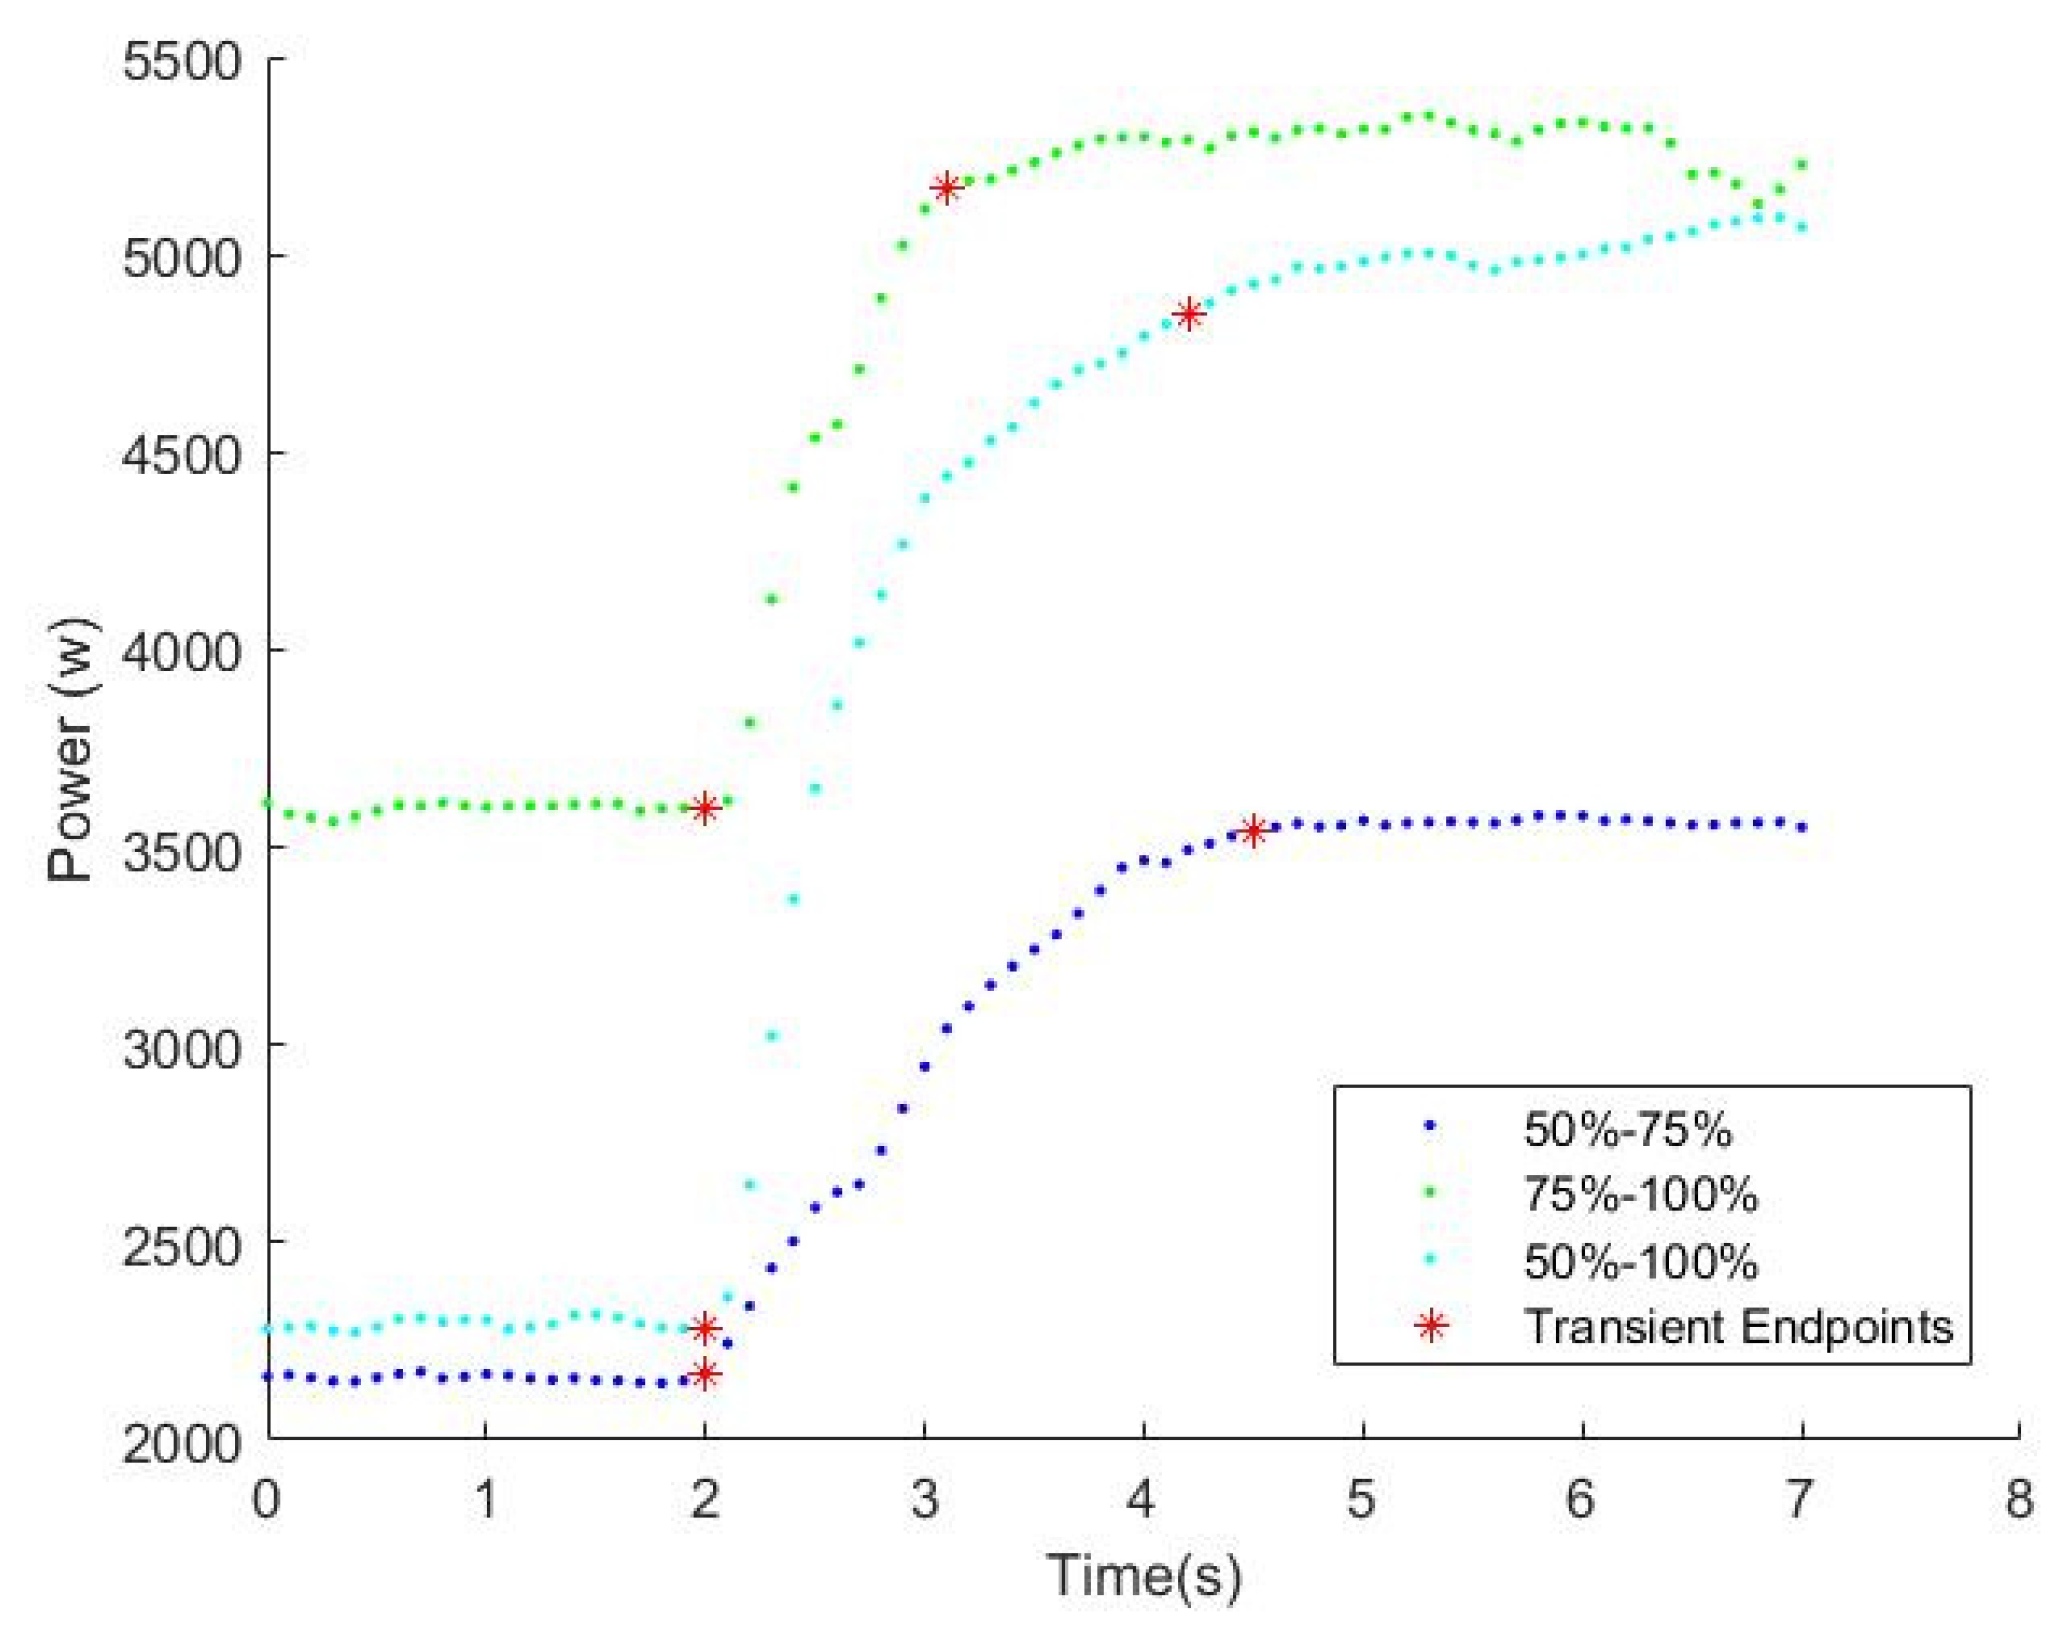
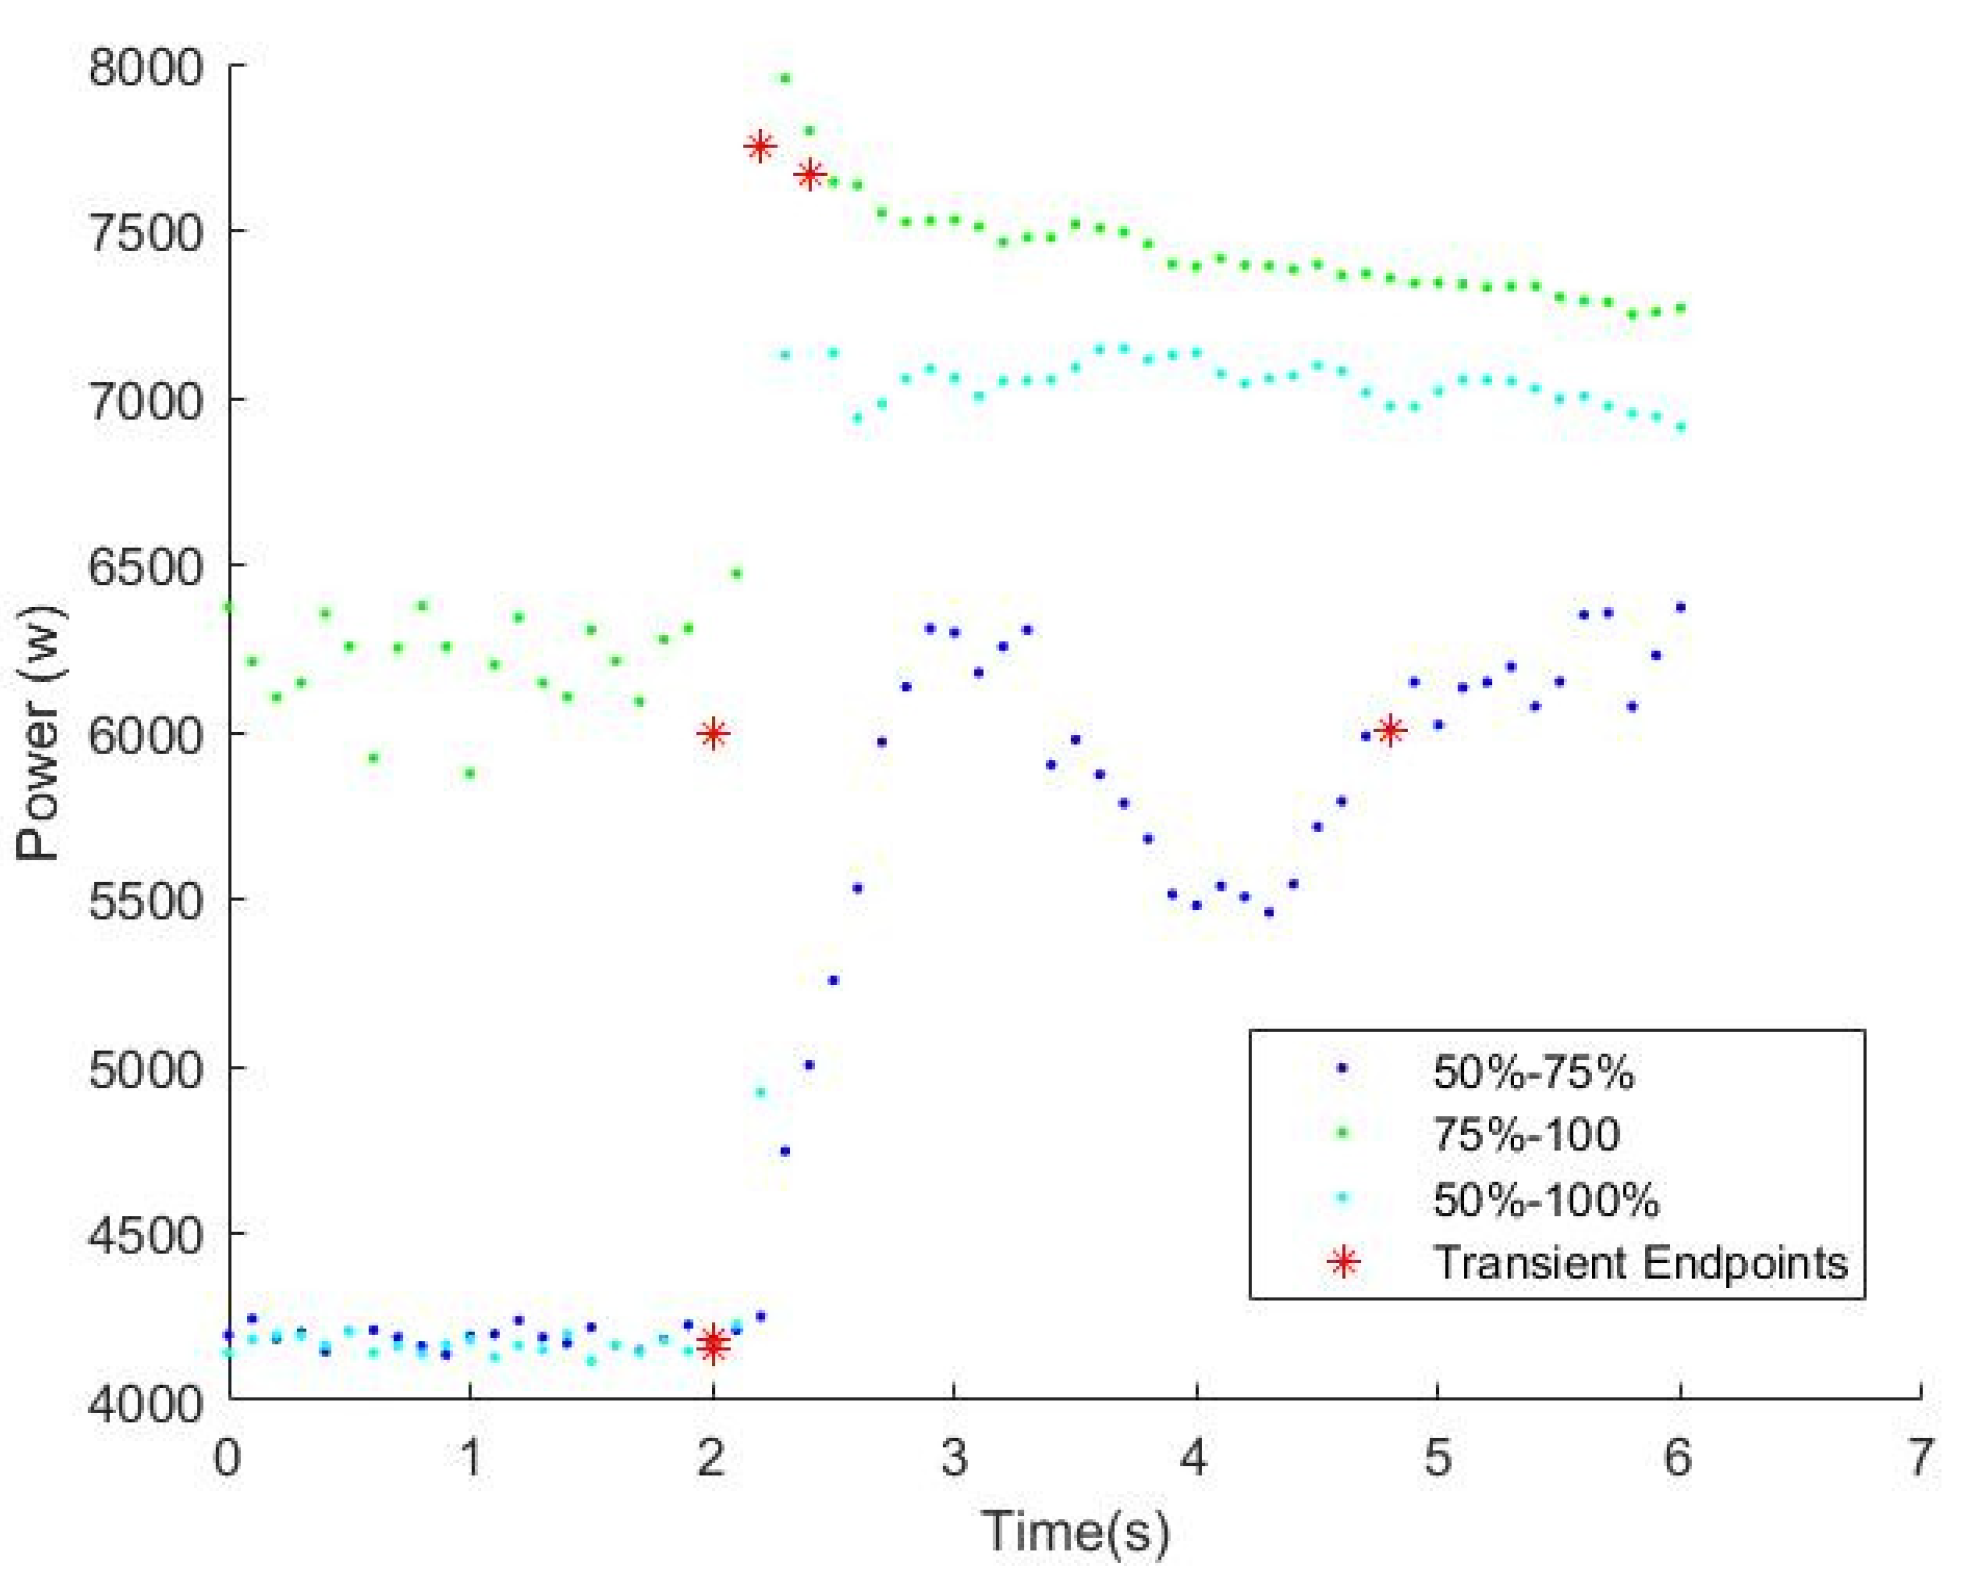
The program generated plots for throttle transients and compared them along shared axes using the algorithm described above (Figure 9). While current was used to determine the start and endpoints of the transient period, the power provided is a more pertinent parameter to compare different throttle steps. Initial observations show that the 50–100% test took nearly as long as the 50–75% test point to complete. The 50–100% test did not reach maximum power as soon as the 75–100% test.

Figure 9.
DTC transient power data results.
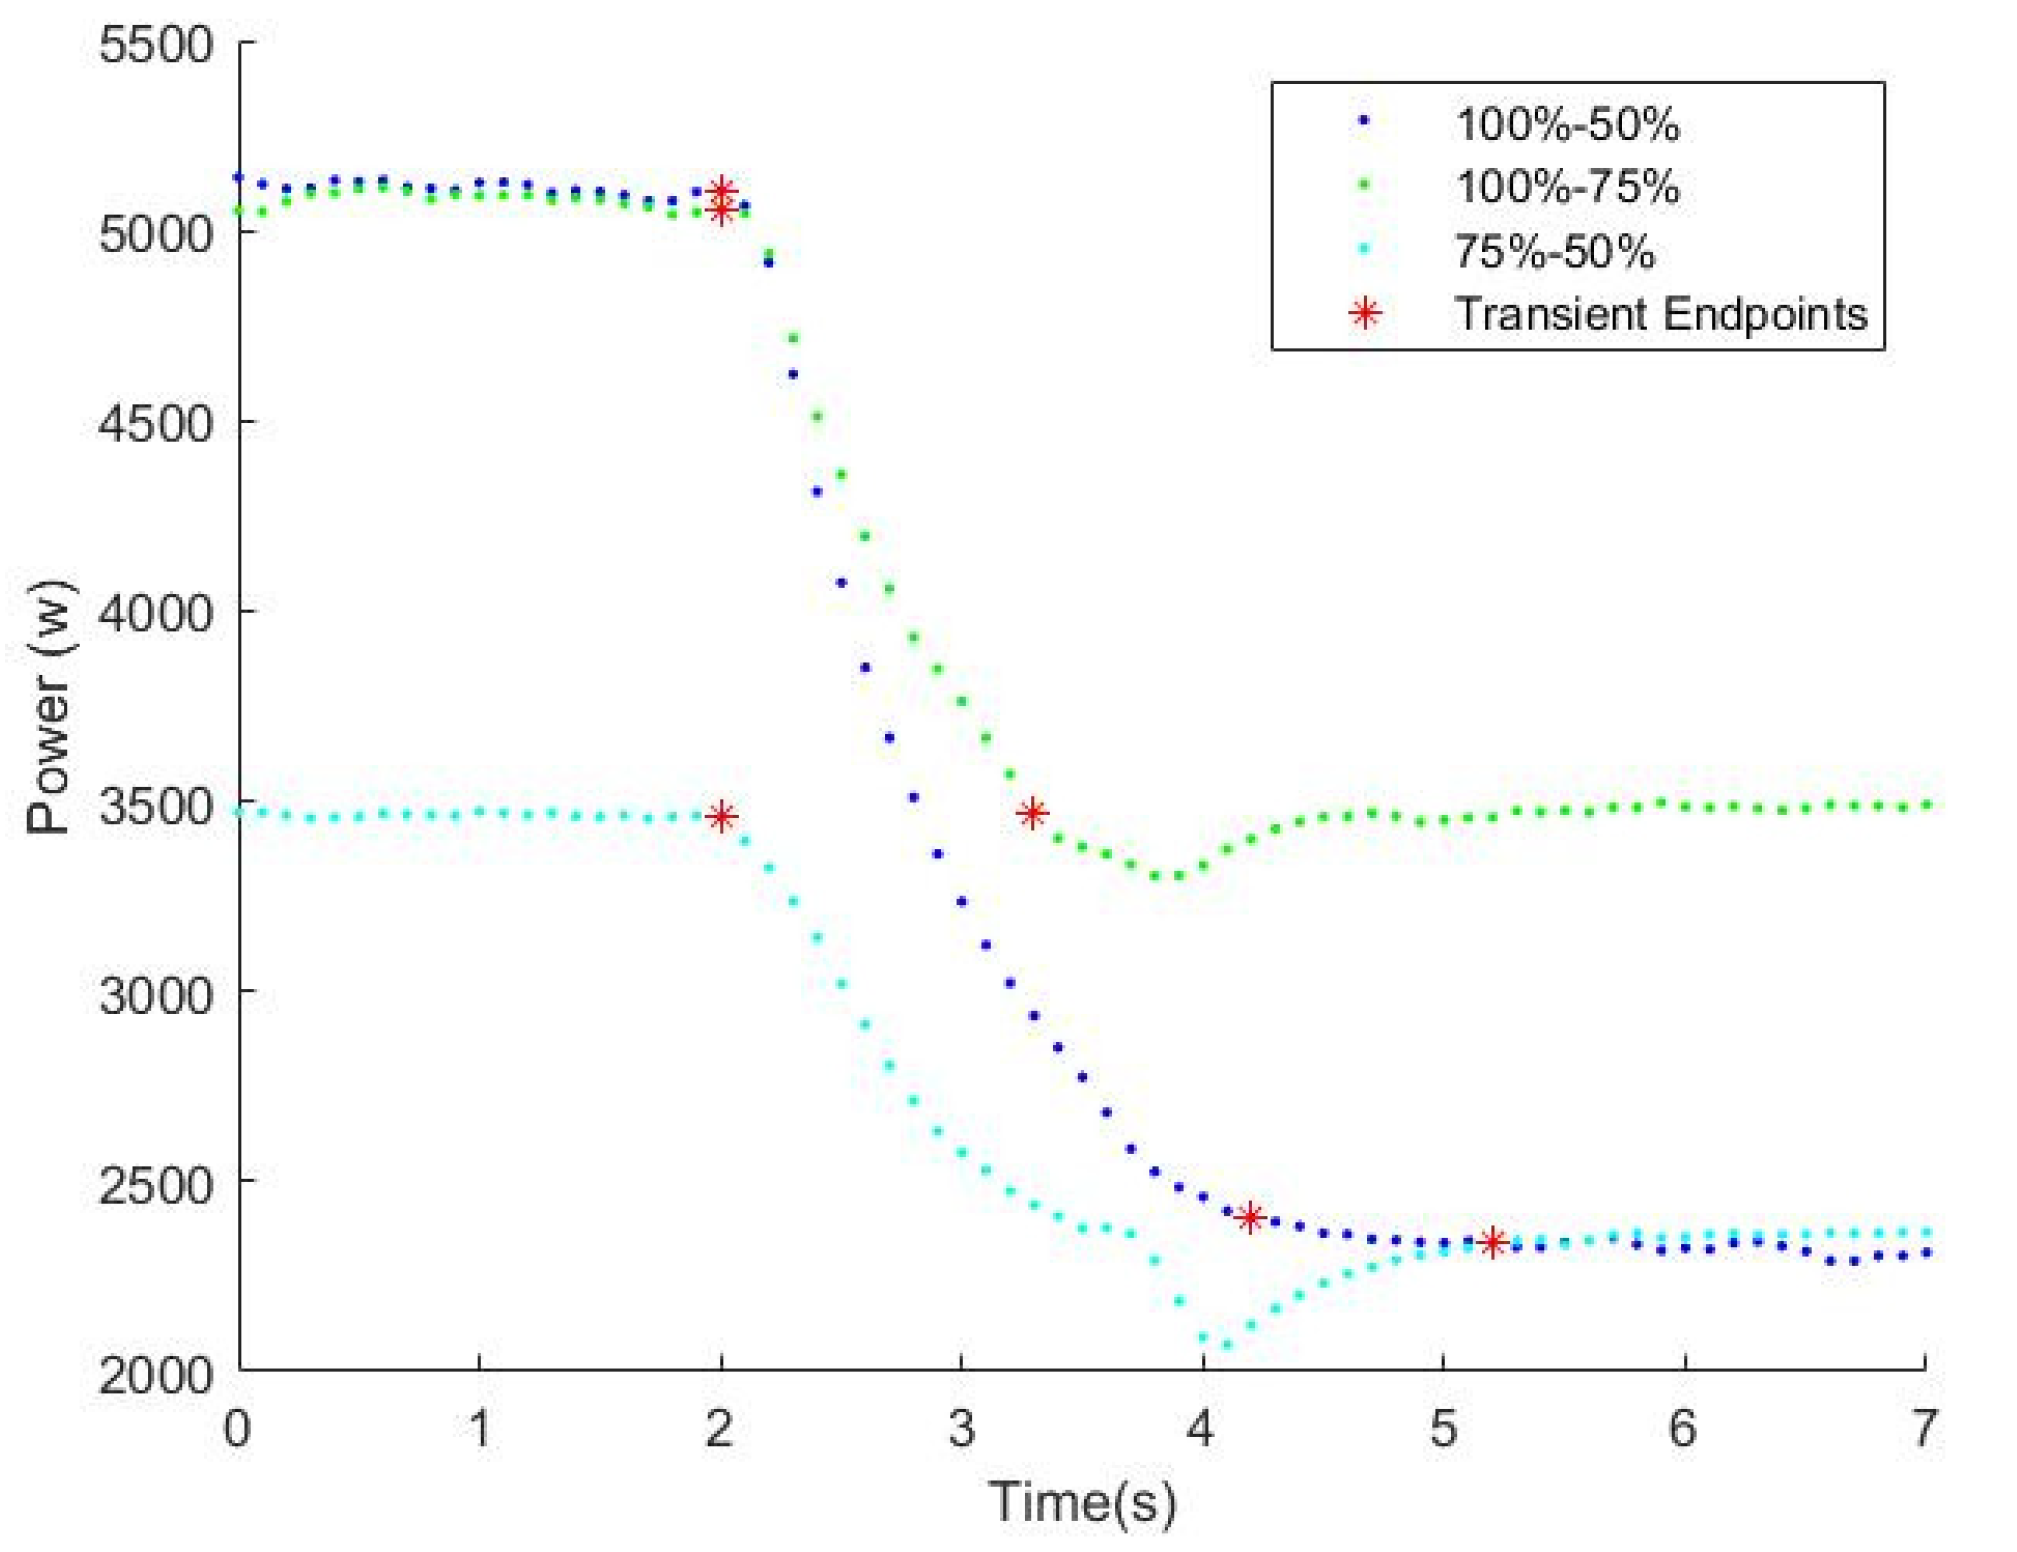
Similar tests were performed for negative steps in throttle settings for the turbine. These transient tests can be seen in Figure 10. The negative throttle steps were qualitatively smoother than the positive steps, except for the 75–50%, where a dip in power can be seen shortly before the turbine reaches steady-state condition.
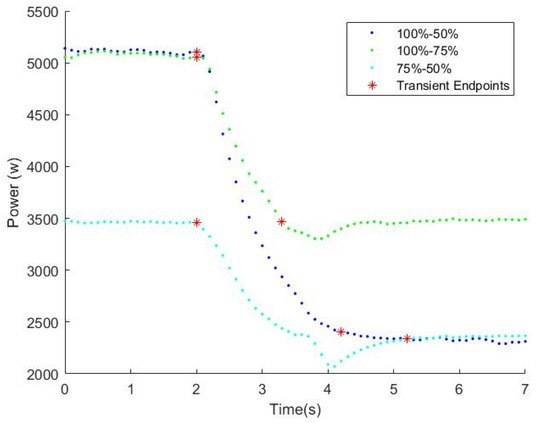
Figure 10.
Negative throttle change DTC transient experimentation results.
3.3. Active Turbine Control Data
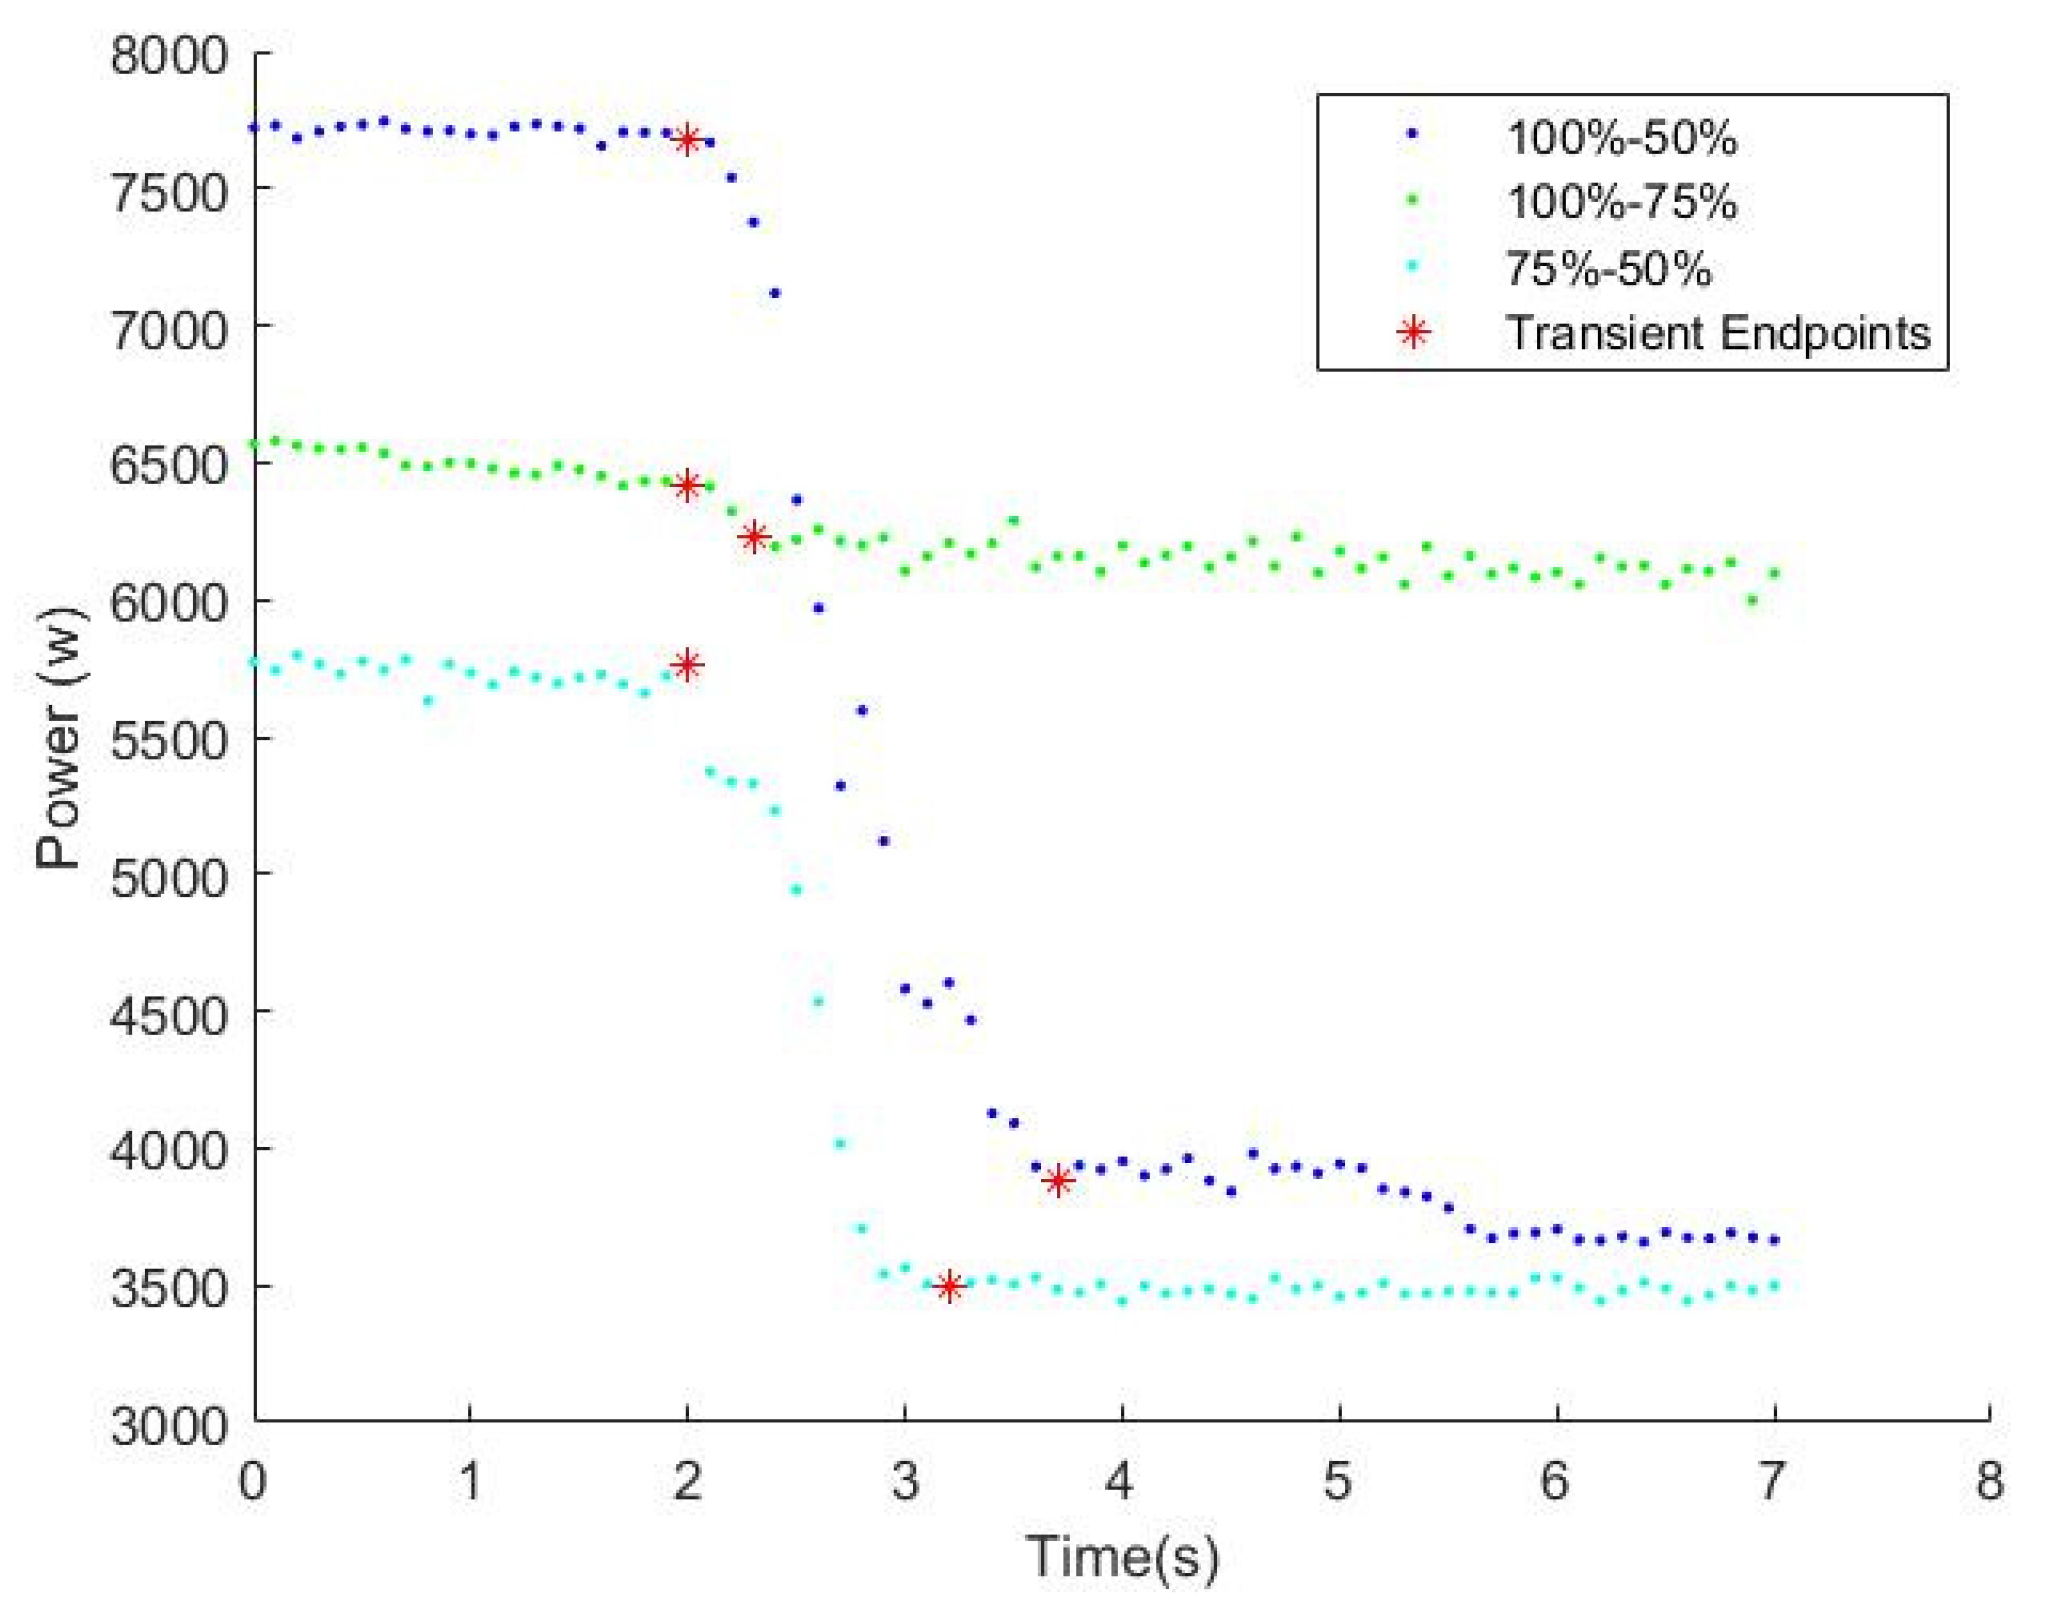
Similar tests were performed with the turbine controlled in the ATC configuration. The most obvious difference is that the power provided to the load is higher than that in DTC. This increased power usage is because the available battery power can be supplied in conjunction with the power produced by the turbine, which differs from DTC, where the turbogenerator supplies the only power available. The batteries used were capable of approximately 2 kW of power output. As expected, the turboelectric system’s maximum power output is approximately 2 kW higher in the DTC mode than in the ATC mode of operation, as shown in Figure 11 and Figure 12.
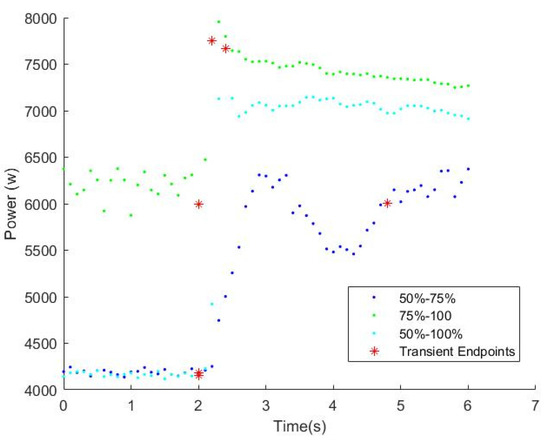
Figure 11.
ATC transient throttle testing results.
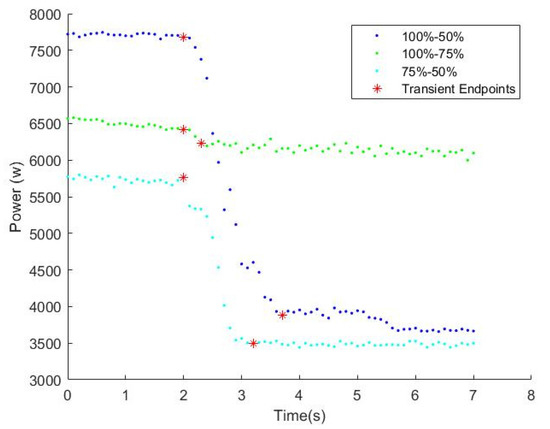
Figure 12.
Results from the negative throttle step changes during ATC experimentation.
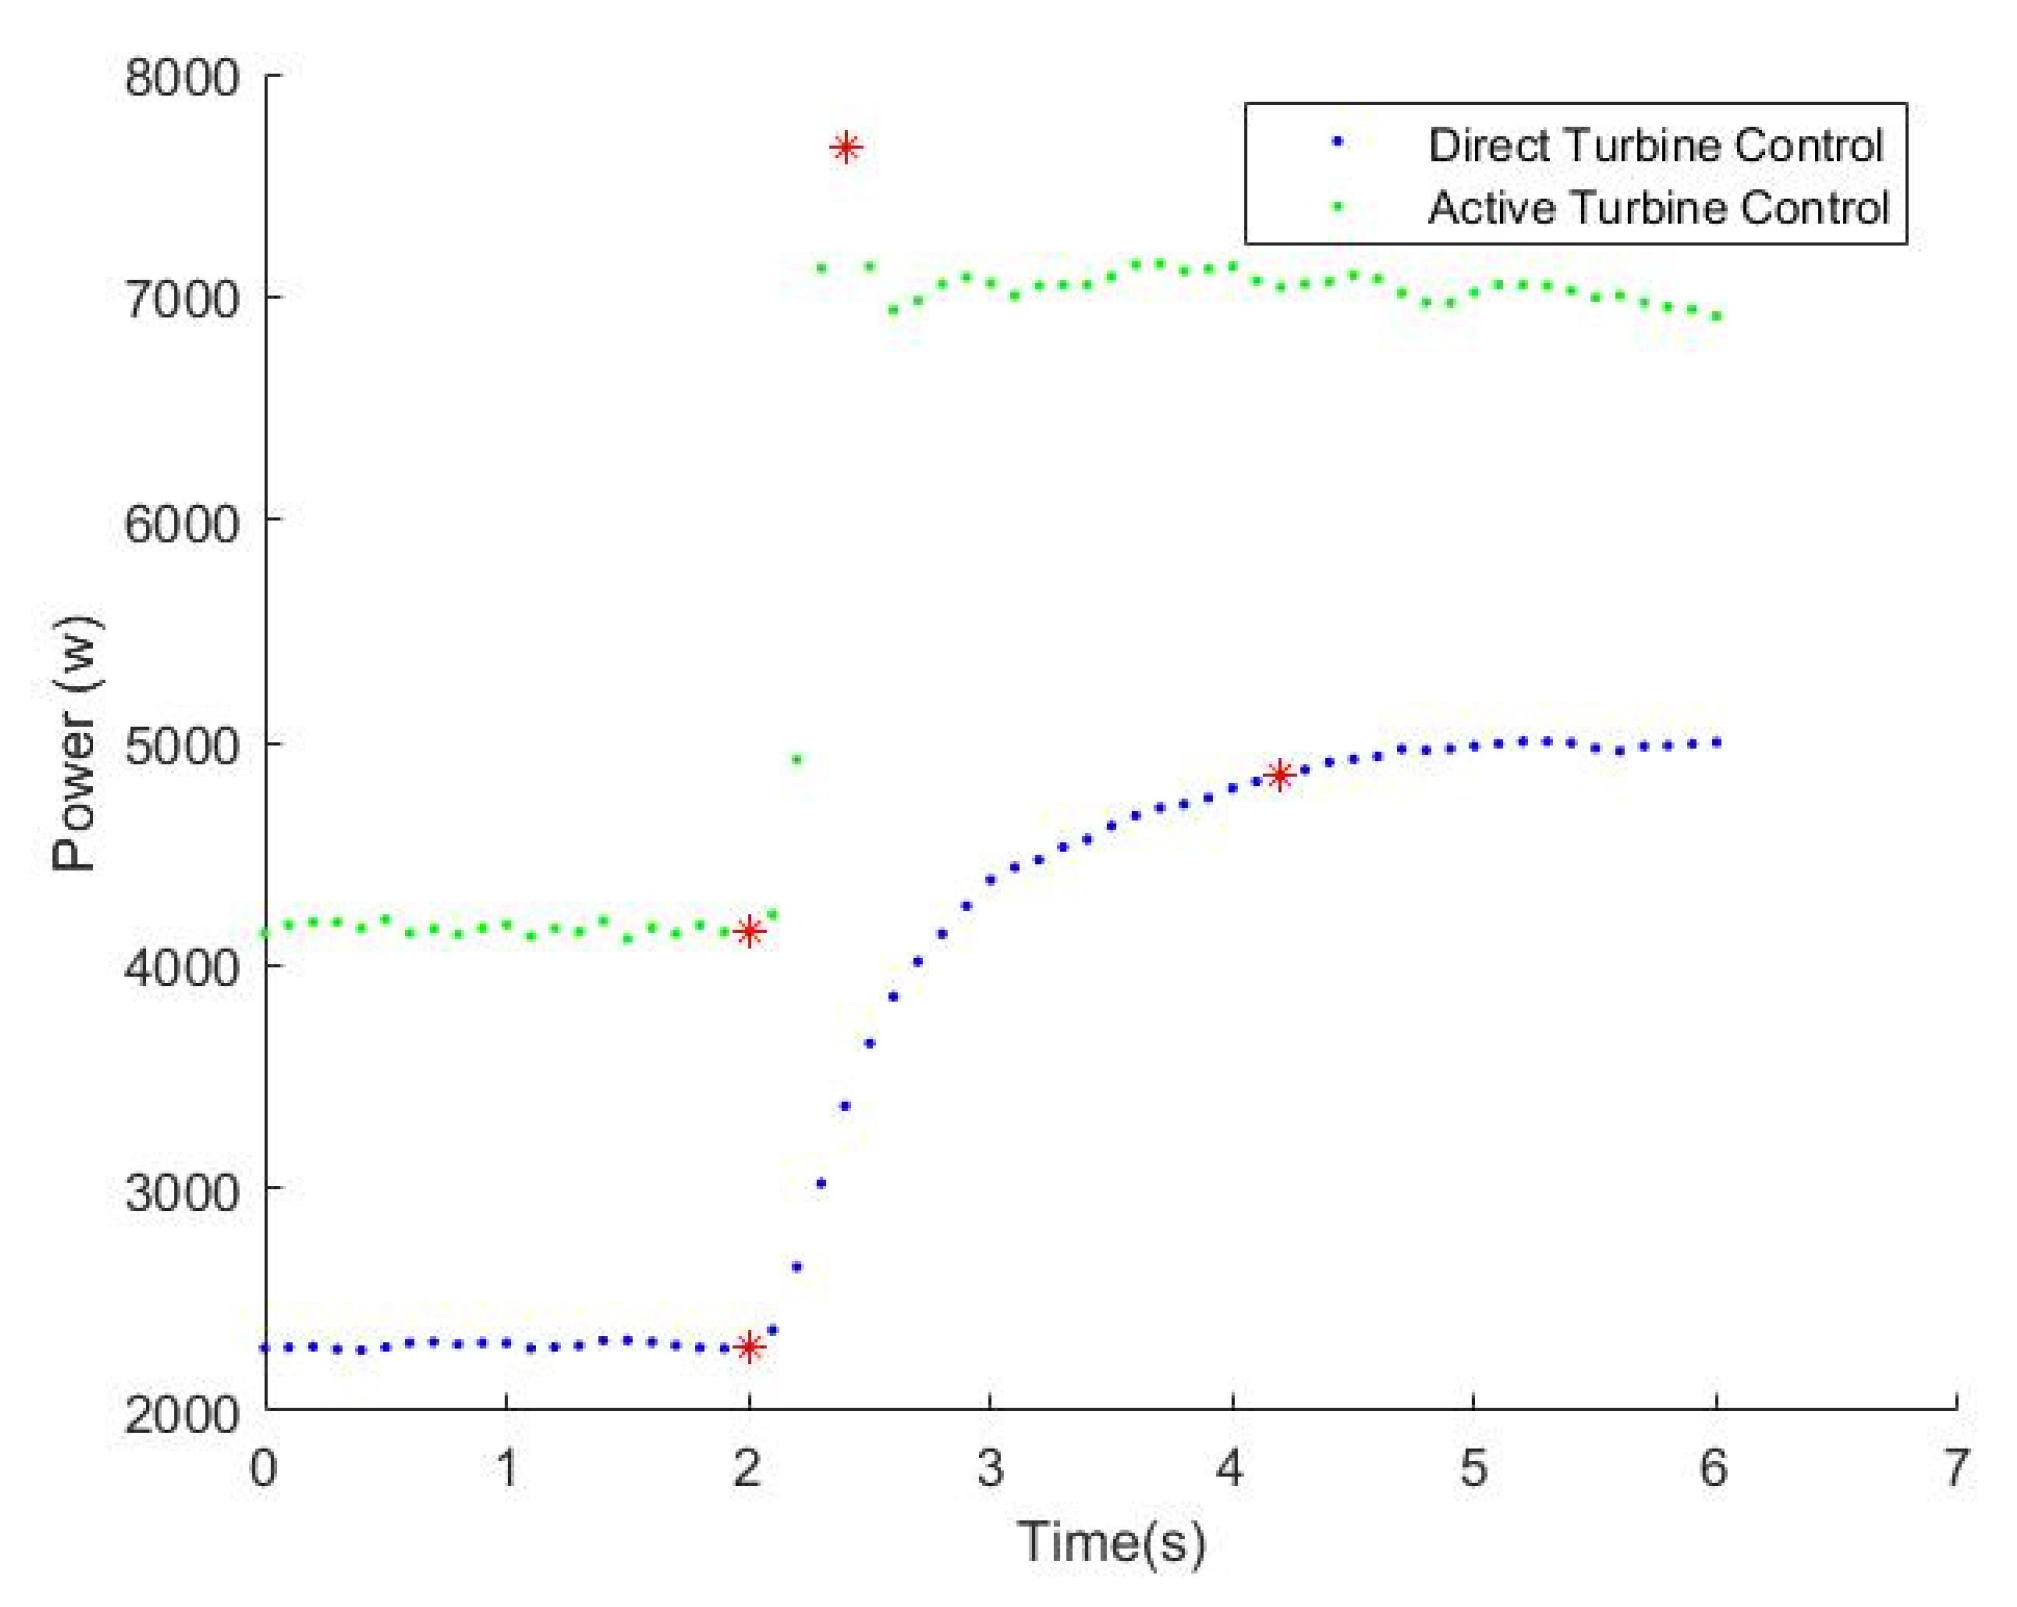
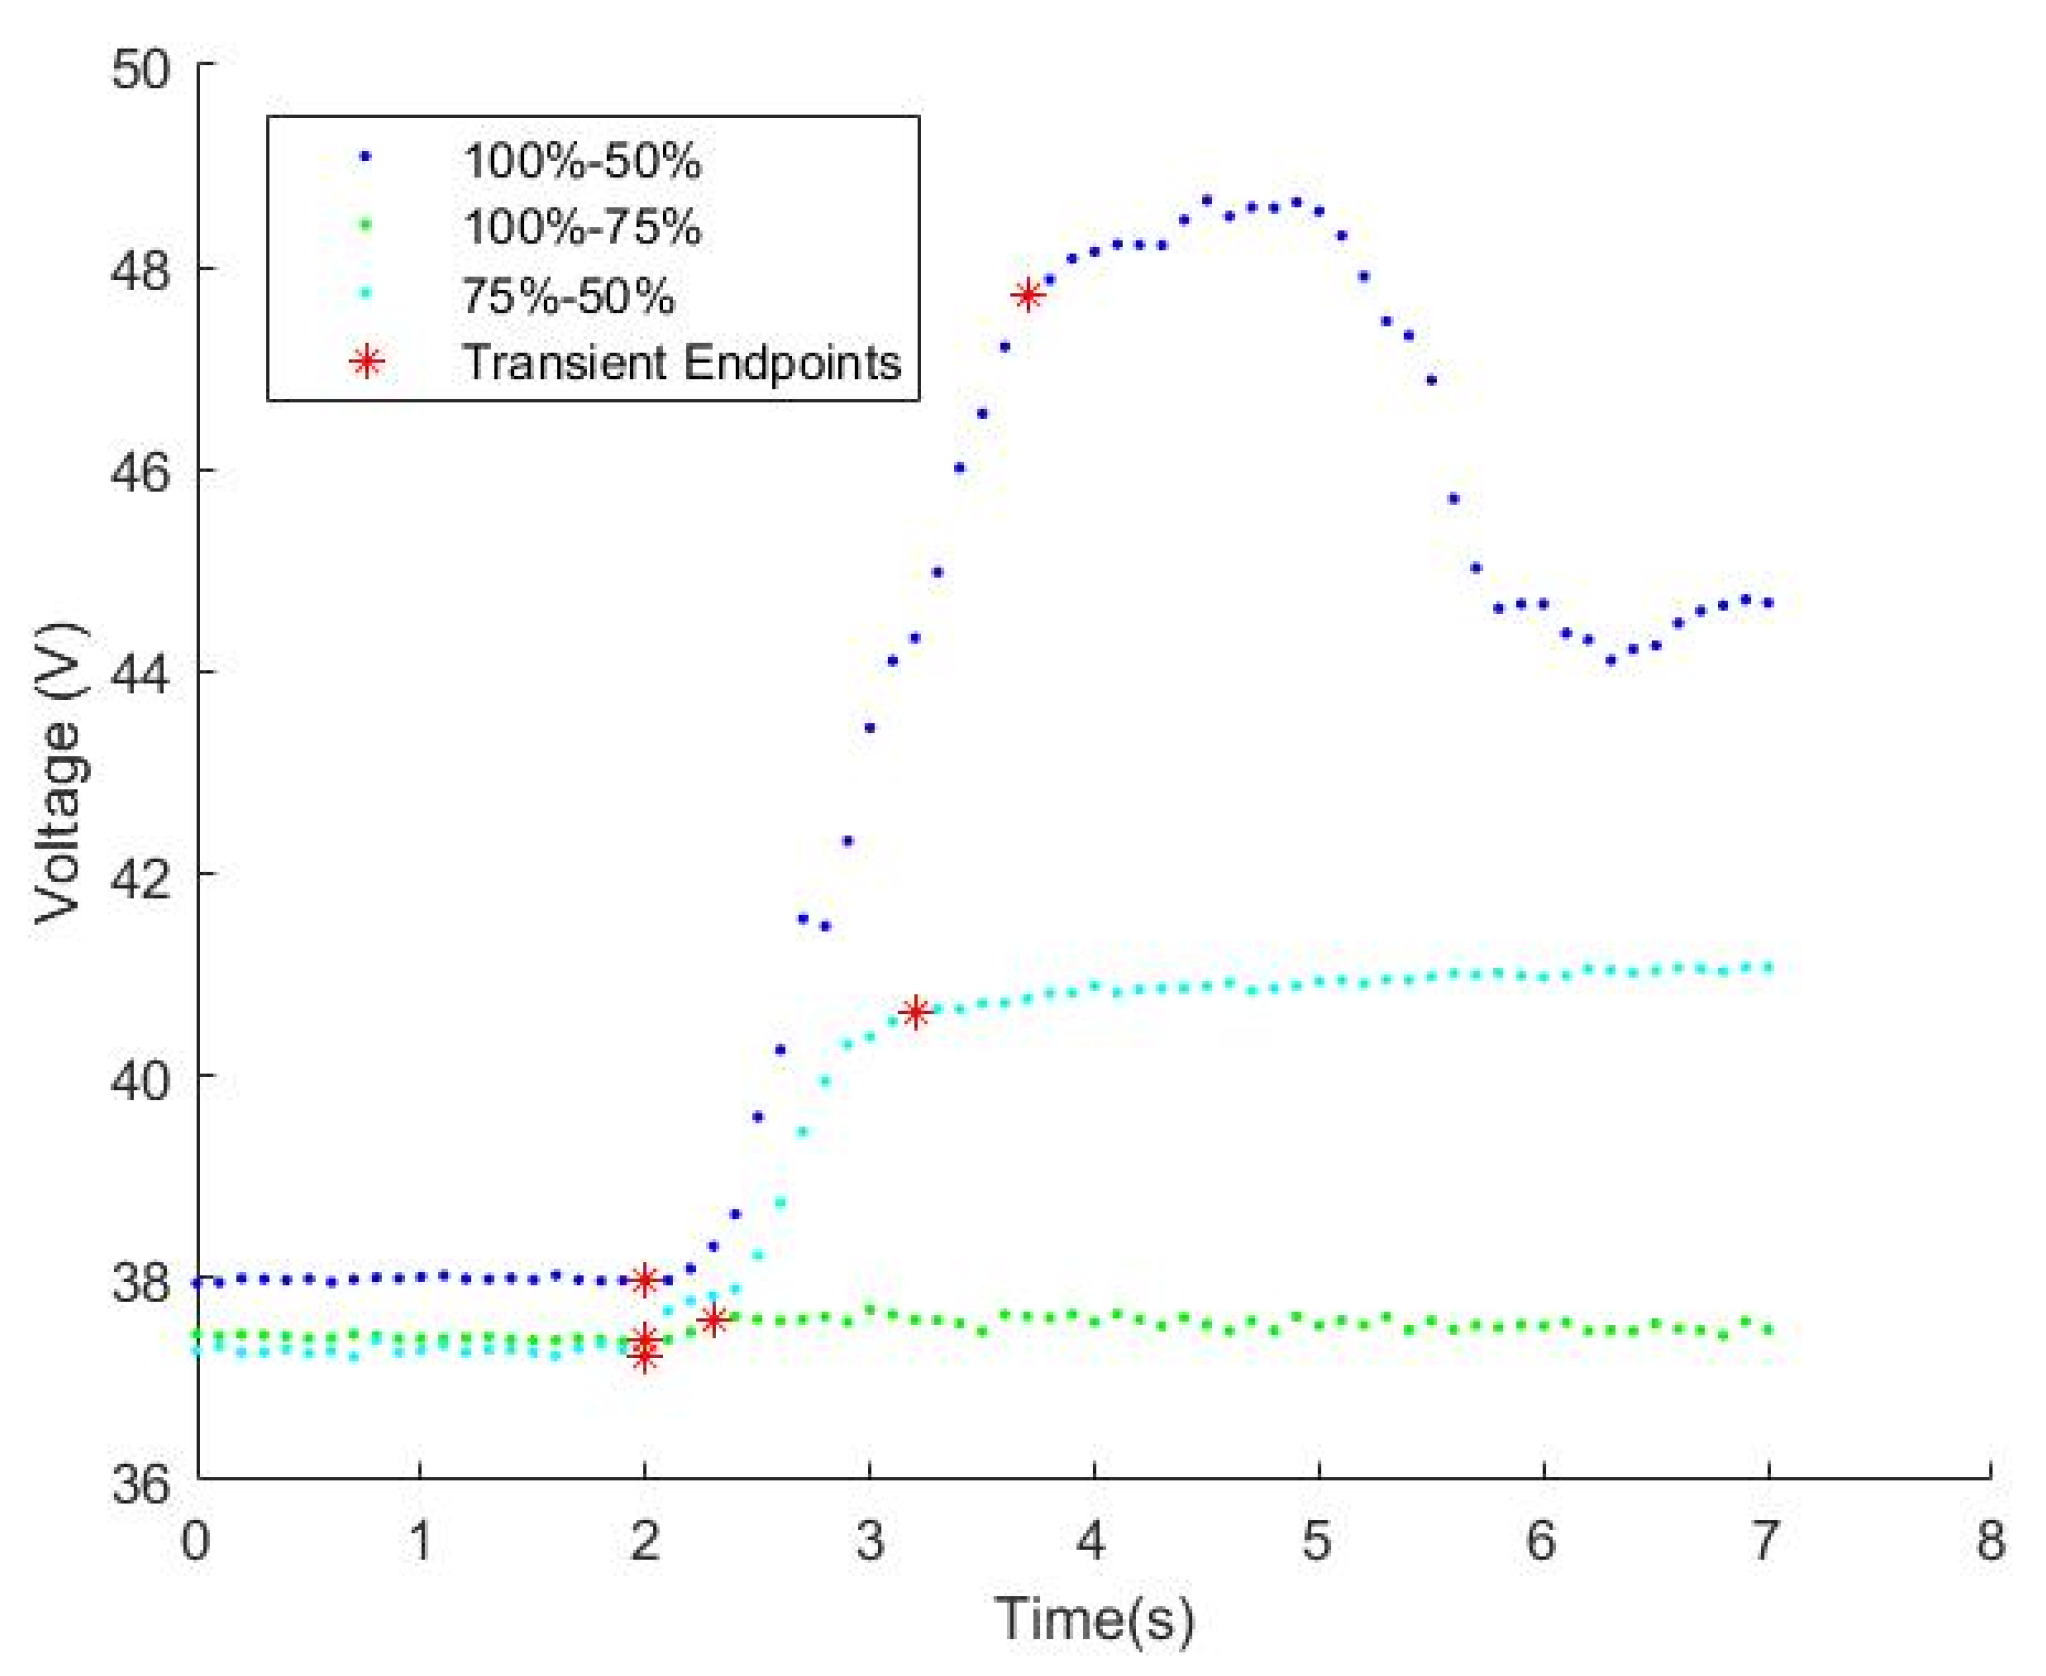
3.4. Comparing Active and Direct Turbine Control Data
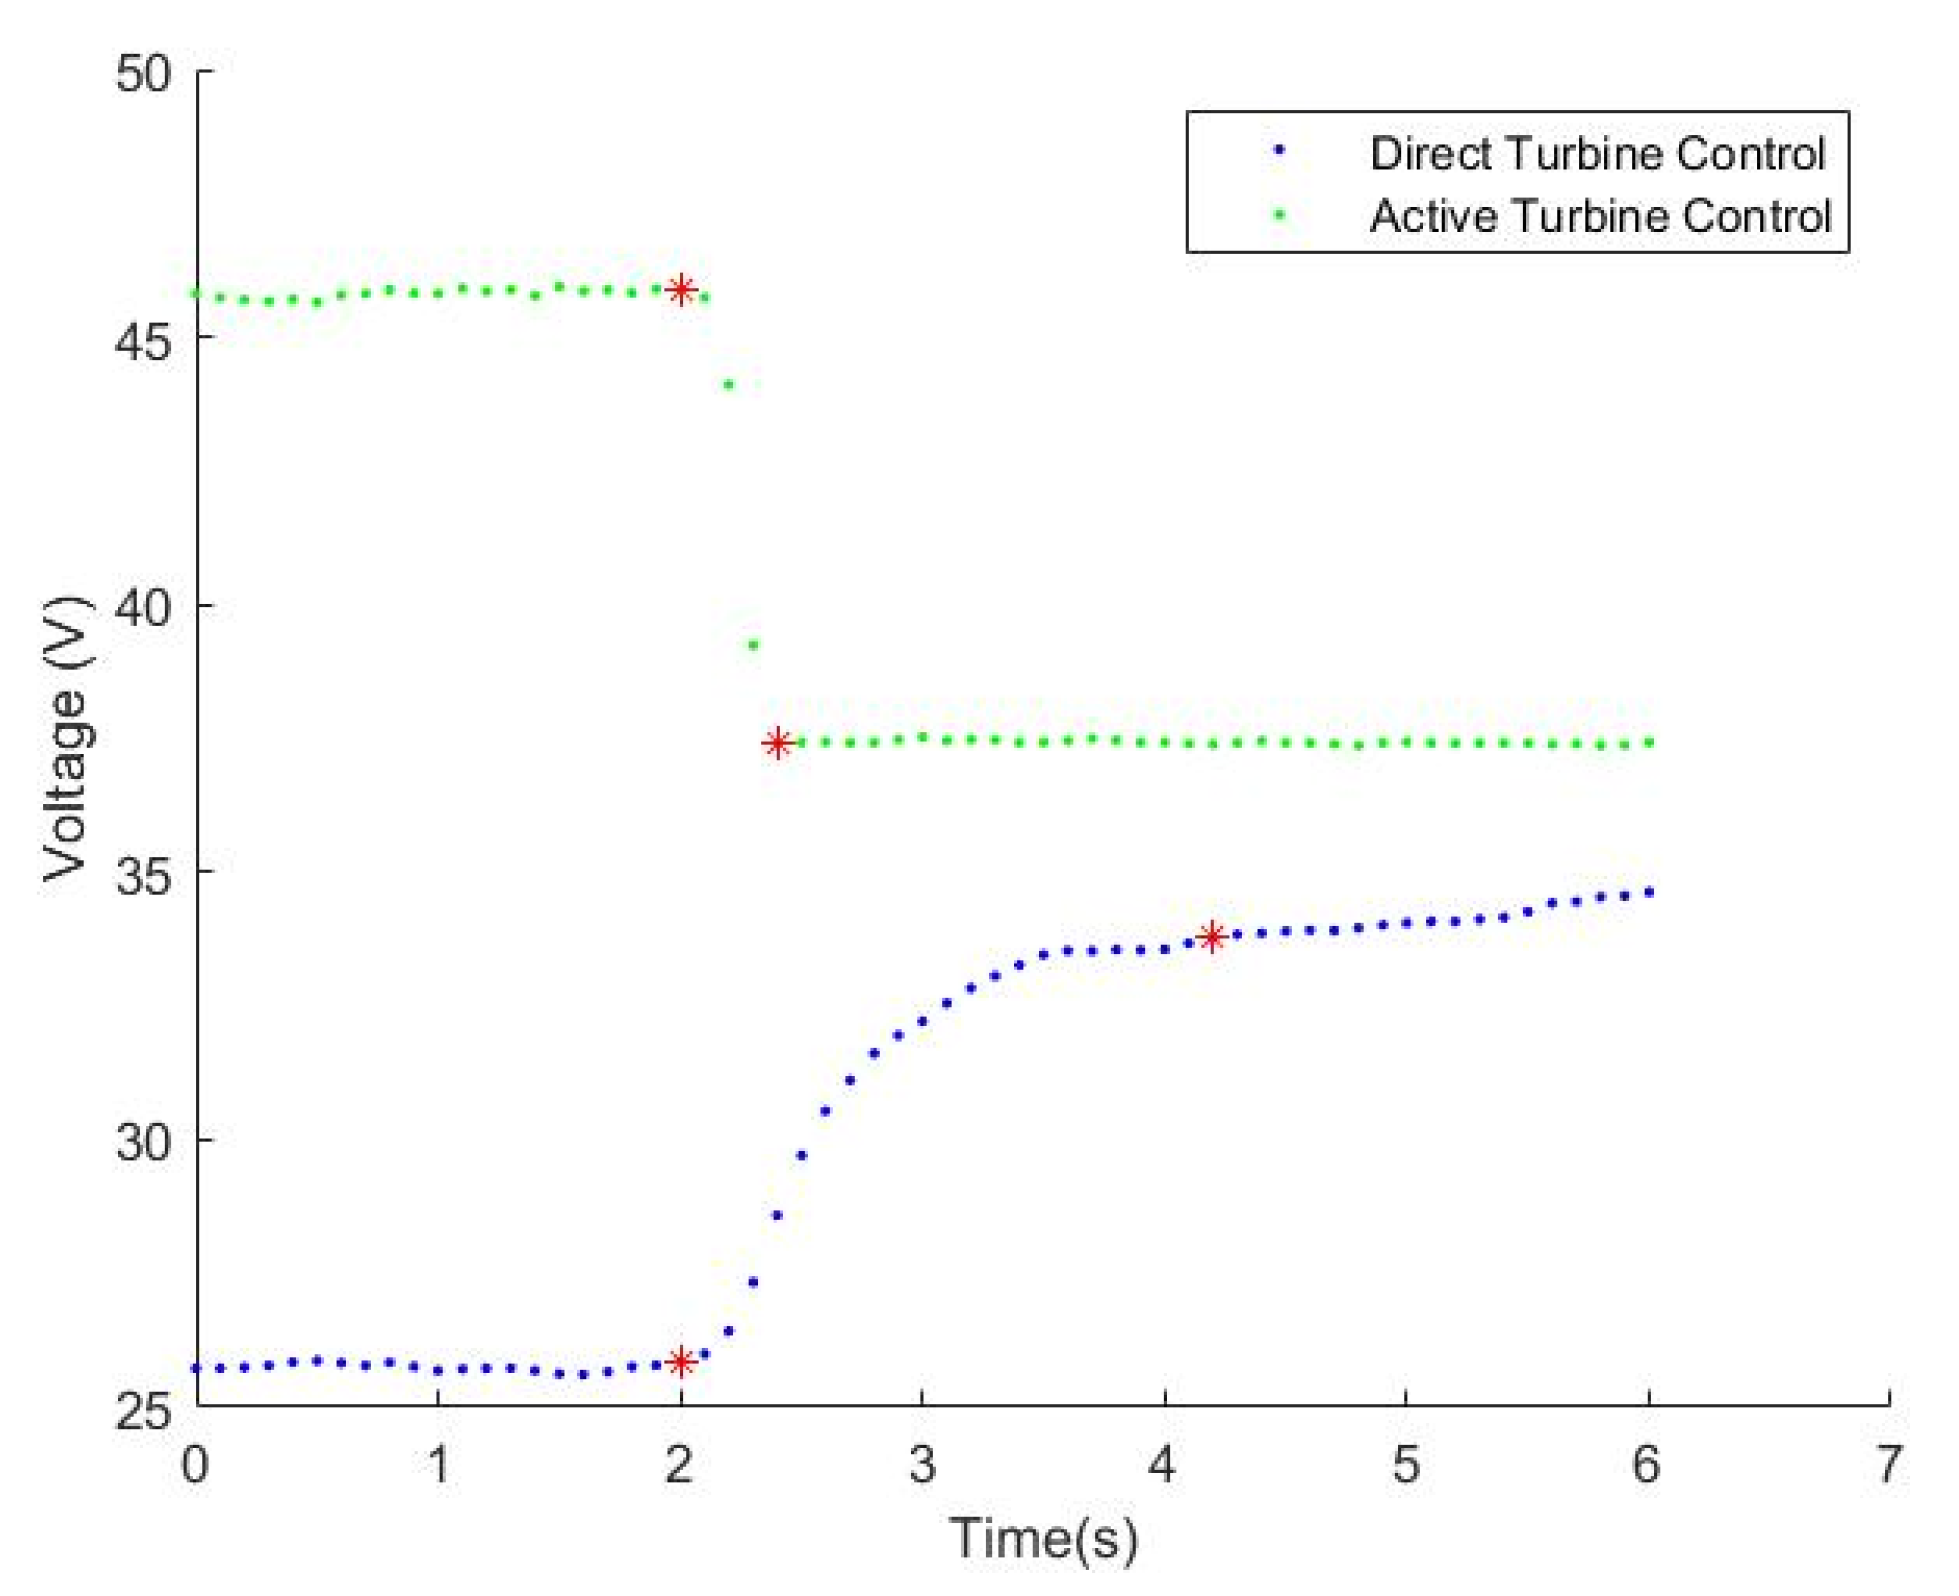
One of the first noteworthy differences in ATC and DTC operating modes appears in the voltage data acquired. The voltage supplied to the load is solely dictated by the generator shaft RPM in DTC operating mode. In ATC, current flow is provided both by the turbogenerator and the battery assembly in parallel. Because of this parallel battery-turbine arrangement in ATC, the voltage supplied behaves much more like that offered by only a battery. This battery-like behavior results in the voltage dropping when a higher load is demanded. The power provided by the ATC system increased despite the voltage dropping when comparing Figure 13 and Figure 14. This behavior contrasts against DTC, where increasing throttle settings result in a higher voltage due to an increasing shaft RPM. The ATC arrangement also kept the supplied voltage much closer to the desired 12S voltage range. This fact is because the 12S battery configuration strongly drives the overall voltage behavior.
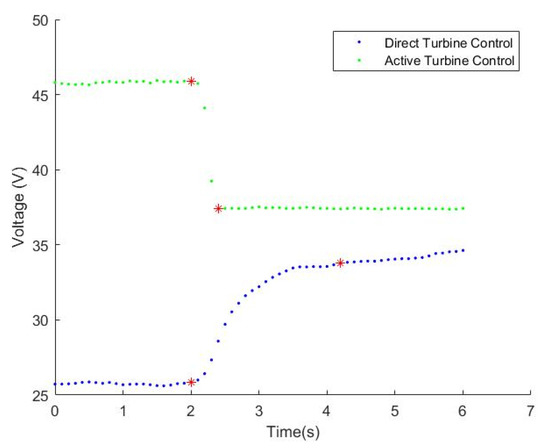
Figure 13.
A comparison of voltage supplied by ATC and DTC arrangements was taken from the 50–100% tests.
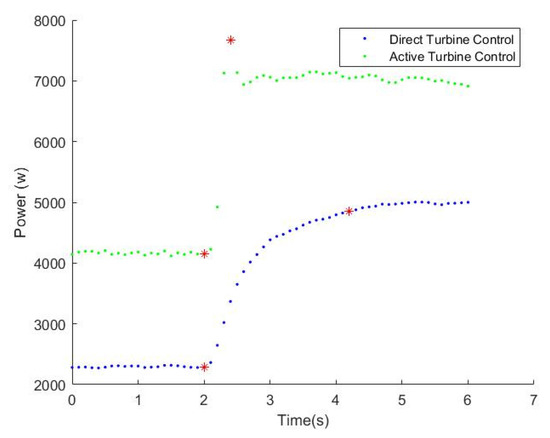
Figure 14.
A comparison of power supplied by ATC and DTC systems during the 50–100% throttle experimentation.
Another takeaway that is apparent from Figure 13 and Figure 14 is that the ATC scheme has a faster response time in general when compared to DTC. This faster response time is due to the amperage flow response time of the battery pack in the system. The battery can respond almost instantaneously relative to the time it takes for the turbine to spool up or down between two different throttle settings. Table 3 displays a comparison of the response times between the ATC and DTC modes.
Table 3.
ATC and DTC response time.
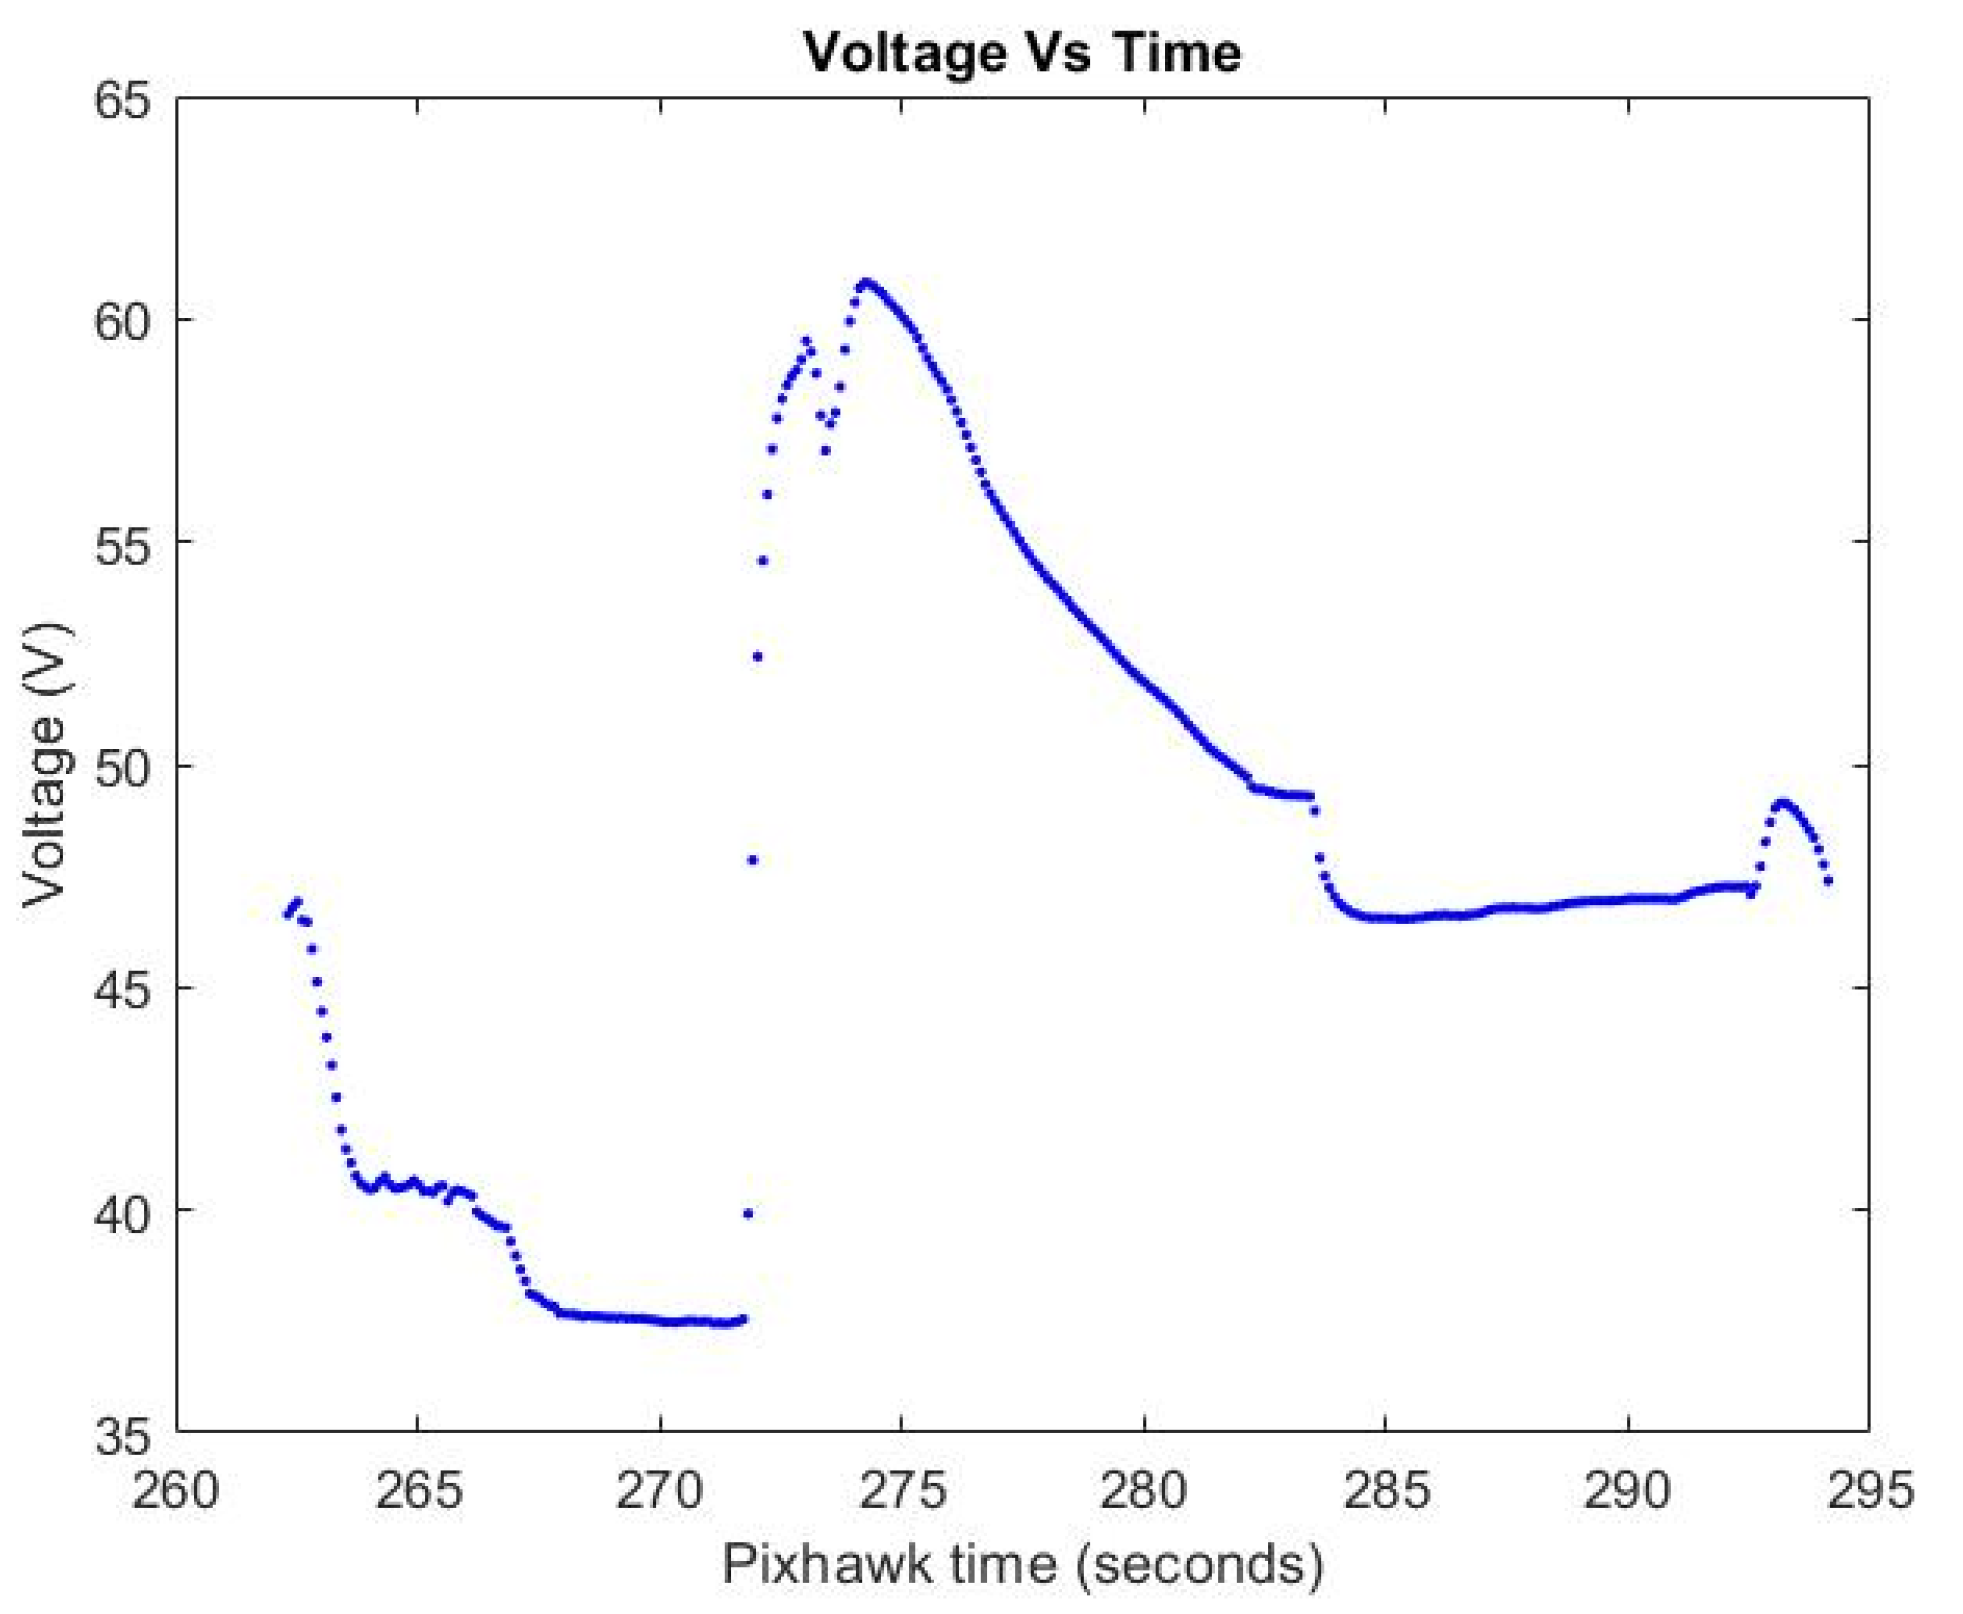
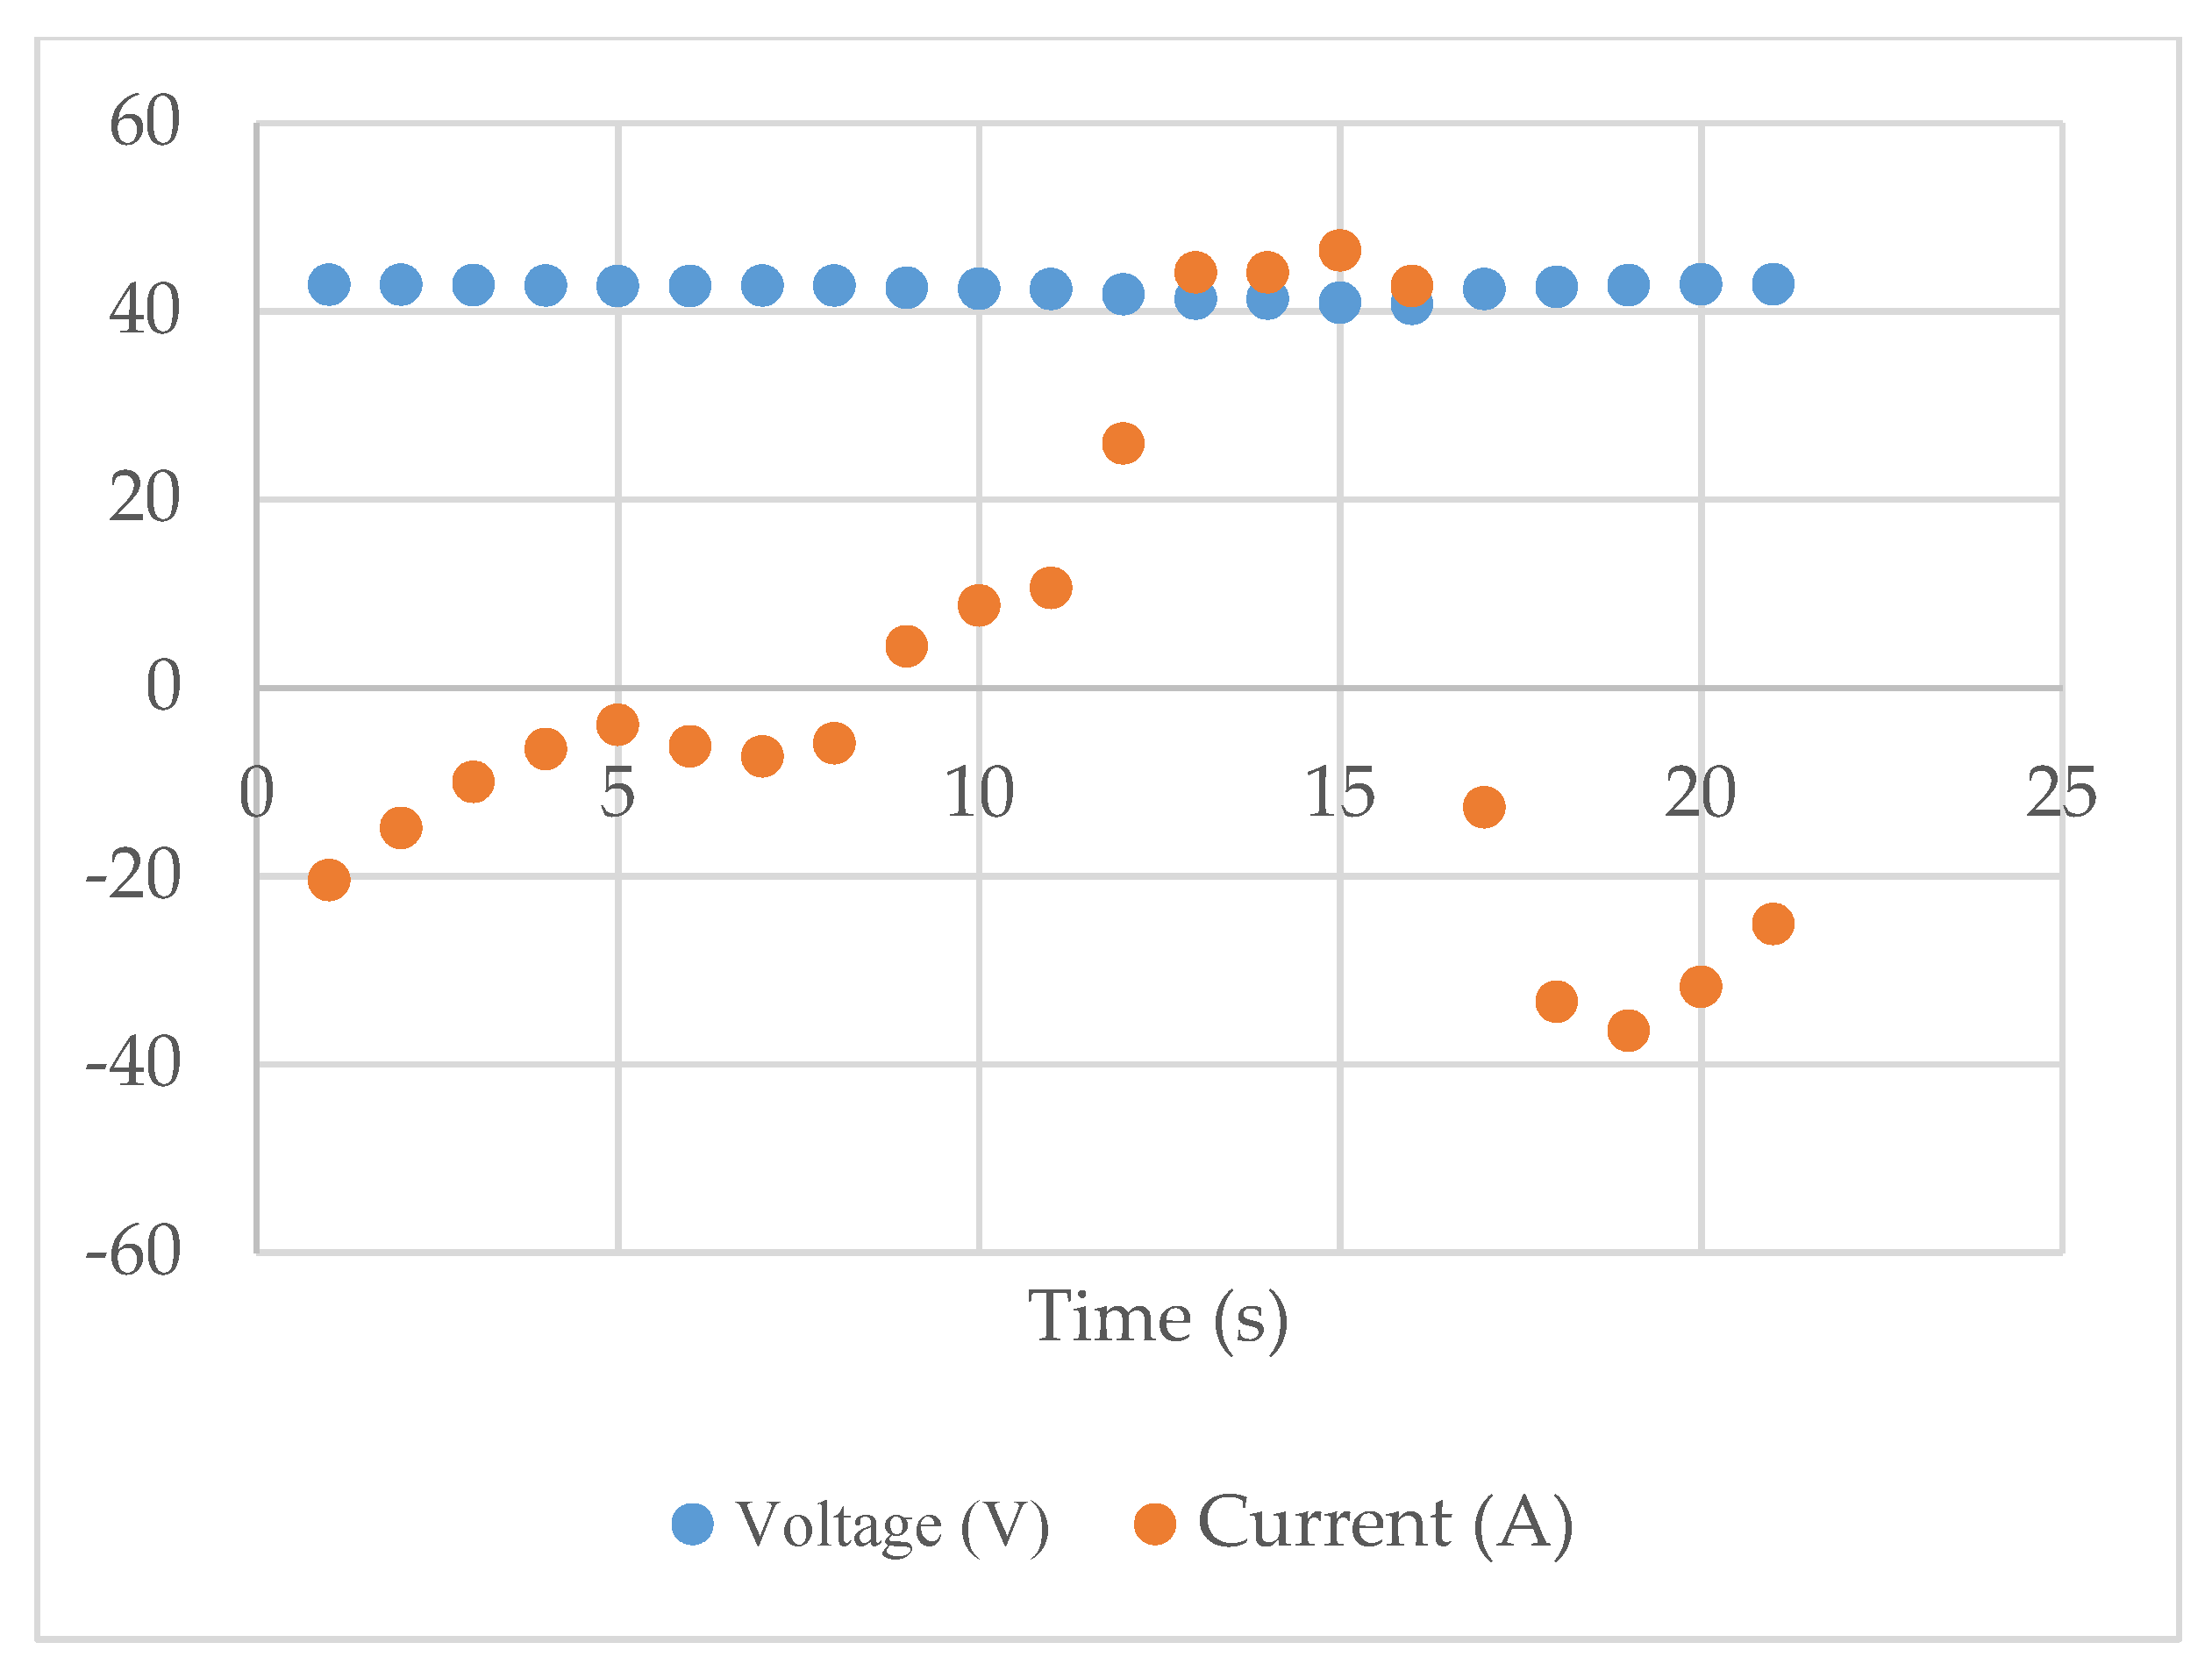
A key challenge for an active controller to overcome is how to handle excess power produced by the turbine. The electrical load can change the power it consumes much more rapidly than the turbine can respond. Because of this difference in response time, a sudden voltage increase will occur if the turbine is spinning at a high throttle when the load is cut. This can be seen in an electric load cutoff test performed, where the load motor was throttled fully to zero percent from full throttle. A path needs to be provided for excess power to flow, increasing the current coming from the generator and lowering the voltage supplied to mitigate the potential voltage spike. It is important to note that the results shown in Figure 15 include a battery integrated into the system for excess power to flow to, while voltages still reached above 60 V. A battery was included for all testing due to the potential that the voltage increases produced would have been high enough to damage the load ESCs and current sensors used in the test. In other tests where the throttle reduction was less severe, the voltage only appeared to rise above 49 V in one test, as seen in Figure 16. However, the mentioned voltage spike stayed within the acceptable limits of the 12S Li-Po battery. The load cutoff test and other throttle transients displayed that the battery could withstand excess power produced by the turbine in a sudden load shutoff up to 30-A. Data from the BMS (Figure 17) show that the battery could successfully switch from discharge (positive) to recharge (negative) during the load shutoff test, successfully switching from providing power to the load to absorbing excess power from the turbine. The battery did not see a high voltage spike because resistors were included on the bench test circuitry to guarantee the battery did not ingest too much electrical current. These resistors, alongside the battery charging, ensured that voltages remained nearly constant during the load cutoff test (Figure 17).
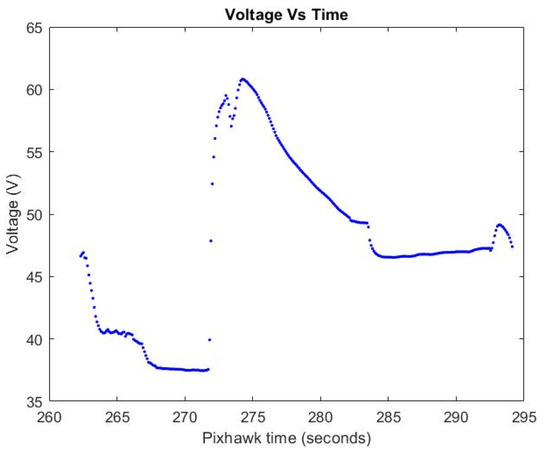
Figure 15.
The voltage plot was produced with a 100% throttle load cutoff test.
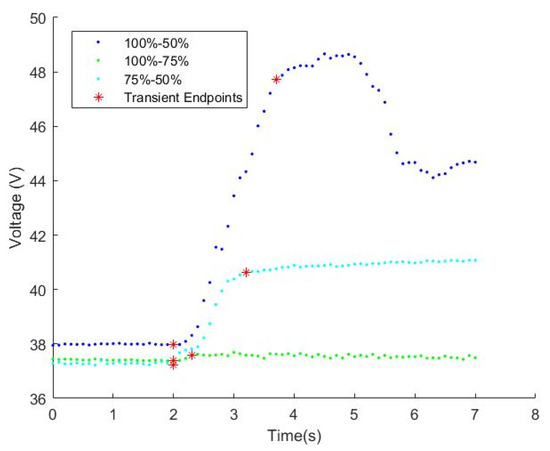
Figure 16.
Voltages produced by the turboelectric system in ATC with negative throttle steps.
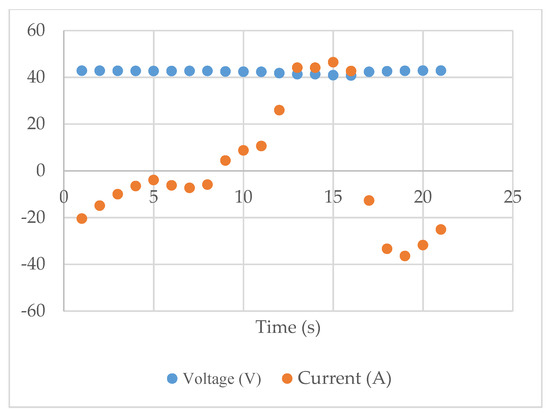
Figure 17.
Battery pack voltage and current during the 100% throttle load cutoff test. The battery pack voltage successfully switches from discharge (positive) to recharge (negative).
In other tests where the throttle reduction was less severe, the voltage only appeared to rise above 49 V in one test. However, the mentioned voltage spike stayed within the acceptable limits of the 12S Li-Po battery.
4. Discussion
4.1. Interpretation of Results
Before discussing the results, it is essential to discuss the uncertainty in the measurements taken. The temporal resolution of the Pixhawk datalogger is 0.1 s, which means that there is a base level uncertainty of ±0.05 s for each data point. Consider the response times shown in Table 3. For all data points except for those between 50–75%, the ATC scheme responded far quicker than the DTC model. The difference in response time between ATC and DTC was significant compared to the temporal uncertainty of the Pixhawk. The results seen are not merely an artifact of instrument noise because the difference ATC and DTC response times lie far outside the ±0.05 s uncertainty in timing.
Findings showed that, in general, the active control scheme was capable of a much faster response to desired power outputs than direct turbine control. The ATC scheme is also more capable of supplying voltage in the desired 12S range, which was expected because of the addition of the battery. Tests also confirmed theories that sudden drops in demanded load could lead to a spike in system voltage.
Data collected showed that, in general, the active control scheme showed a significantly faster response to desired power outputs. One exception was seen within the 50–75% test point. The ATC system took longer to reach steady-state condition after the throttle change than the DTC system did. The supplied power oscillated as the power approached its final state (Figure 11). These oscillations occurred as a result of the active control scheme not being optimally tuned. More optimization was not performed on this controller because the controller operated sufficiently for the desired tests. In addition, a more optimally tuned controller would perform better in managing power spikes, but a less optimized controller allowed the authors to prove a higher factor of safety for the switching circuitry than would have otherwise been possible with a fully optimized system. A completely optimal controller is of interest to the authors. More testing and iterating could be performed to establish a controller that gives little-to-no oscillations in provided power.
The 12S Li-Po battery ensemble used during testing did not register voltages outside of its safe operating conditions while conducting the experiments (Figure 17). However, the circuitry, wiring, and generator experienced temporary, sudden increases in voltage up to 60 V during the 100–0% throttle experiments, as seen in Figure 15. The power saturation during sudden load shutdowns was protected from the battery by its resistor bank during testing. While the resistors aided the battery in power digestion during these load shutdowns, the resistors did not protect the rest of the system. Experimenting in acceptable increments would help identify more potential system limitations and safety factors without a resistor bank protecting the battery. Further optimization may be possible as a result of said research.
4.2. Future Work
The battery management implemented will experience limitations in-flight applications. Current works have shown that more development will need to ensure the aircraft’s proper battery protection and continuous power provision during prolonged use.
The assembly and experimentation for this article were simple in order to validate the control theory. Therefore, there are more areas for future testing to help optimize a turboelectric powerplant. Current research with this turboelectric system has used flat-pack, pouch-style Li-Po batteries. Future endeavors could experiment with cylinder-style, Li-Po batteries. Additionally, future tests could compare Graphene Li-Po batteries to take advantage of potential higher charge and discharge rates. This initial system utilized one 12S battery in the system. Further development could be performed by placing multiple 12S batteries in parallel to reduce the current requirements of each battery and corresponding individual cells. Using multiple batteries in parallel could also increase the potential overall power output of the system.
The integration of this actively controlled turboelectric system in a VTOL UAS was conducted successfully [21]. Oklahoma State University has flown the featured turboelectric system on two platforms testing and proving flight worthiness. Ongoing and future flight testing will help to make the system more reliable for future applications.
Another way this turboelectric system could be further refined is with the manufacturing of the system. Currently, this turboelectric system is built with commercial-off-the-shelf (COTS) parts. Less manufacturing is required for parts such as the housing of the turboelectric system. There are many possibilities to optimize the manufacturing for this system. The main area that could be improved is the housing for the system, which could be made significantly lighter.
Additionally, the design of the overall system could be optimized by using parts other than COTS parts. Potential future turboelectric research could investigate applications where the generator is fully integrated with the turbine. An integrated system would reduce weight and offer the potential for further optimization with the electrical generator of the system. It would be advantageous for a future production turbogenerator to design the system from the “ground-up”.
5. Conclusions
A key area of interest for hybrid power systems in aircraft is in VTOL and multi-rotor applications. It is in these areas where the quicker response time seen in the ATC mode is vital. It is also essential that the pilot is not directly responsible for controlling the turbine power output magnitude for VTOL and multi-rotor flight. Each of the VTOL rotors operates at different power levels to maintain steady and level flight, which is a power source that can react to the changing demands in real-time. The pilot controls the other four primary controls (roll, pitch, yaw, and throttle). Adding a fifth control input, which must be carefully balanced, would overburden the pilot during flight. From the pilot perspective, ATC is generally preferred in all flight cases.
There are situations, however, where DTC would be advantageous. An example of when DTC could be utilized is using a conventional, fixed-wing aircraft. The pilot could directly control the turbine and allow the electric propulsors to respond accordingly based on the power made available by the turbogenerator at any given time. Using DTC can save weight compared to ATC configurations by not having switching circuitry or additional power batteries. Fixed-wing aircraft have a much more responsive throttle with the ATC control scheme than the DTC.
The more responsive ATC scheme is generally preferable to the pilot. In other words, the ATC control scheme more accurately imitates battery power output, whereas the DTC scheme behaves more like a turbine. ATC offers additional advantages to safety. The active control scheme has the potential to provide better instrumentation and state determination for the turboelectric system. This instrumentation can govern the turboelectric system and ensure it is behaving correctly and not risking damage to the rest of the power system. Having a battery in the loop for a VTOL system can also add redundancy by ensuring a VTOL aircraft can land even if the turbine fails in flight.
The most extreme example of throttle lag was assessed in this paper when the turbine engine was run at the maximum throttle until the load was entirely cut. Even with a battery in the loop, a voltage spike was observed when this was performed. If the battery were not integrated into the system to receive the current dissipation, the voltage spikes would have been more severe. The voltage increase mentioned above can be seen in Figure 14, where the voltage did not exceed the range a 12S battery would tolerate. Inevitably, the turbine will briefly produce more power than is commanded by the system in certain conditions. Having a battery integrated into the main power supply ensures that voltages do not rise beyond system capabilities. It is also essential that the battery is appropriately selected to ensure sufficient charge and discharge rates. Another critical metric is a battery’s amperage-hour capacity to ensure the endurance required to fulfill the desired mission.
This paper lays the groundwork for further work for the safe integration of turboelectric power plants into unmanned aircraft.
Author Contributions
Bench Test Stand Design, J.B., J.D., J.J., T.R. and K.R.; Battery Circuit Design, J.D. and J.B.; Control Software, J.B.; Testing and Validation, T.R. and J.B.; Data Reduction, T.R.; Draft Preparation, J.B., J.J. and T.R.; Review and editing; K.R.; Supervision and Project Administration, K.R. All authors have read and agreed to the published version of the manuscript.
Funding
This research was funded by the Federal Aviation Administration, grant number 692M15-20-C-00012.
Data Availability Statement
The data presented in this study is available on request from the corresponding author. The data is not publicly available without a coordinated release from the Federal Aviation Administration.
Acknowledgments
The authors thank undergraduate students Rannock Thomas and Jay Welke for support in the design and fabrication of the turboelectric system test stand.
Conflicts of Interest
The authors declare no conflict of interest. The funders had no role in the design of the study; in the collection, analyses, or interpretation of data; in the writing of the manuscript, or in the decision to publish the results.
References
- Felder, J.; Kim, H.; Brown, G. Turboelectric Distributed Propulsion Engine Cycle Analysis for Hybrid-Wing-Body Aircraft. In Proceedings of the 47th AIAA Aerospace Sciences Meeting including the New Horizons Forum and Aerospace Exposition, Orlando, FL, USA, 5–8 January 2009; American Institute of Aeronautics and Astronautics: Reston, VA, USA, 2009. [Google Scholar]
- Armstrong, M.J.; Ross, C.A.H.; Blackwelder, M.J.; Rajashekara, K. Propulsion System Component Considerations for NASA N3-X Turboelectric Distributed Propulsion System. SAE Int. J. Aerosp. 2012, 5, 344–353. [Google Scholar] [CrossRef]
- Gesell, H.; Wolters, F.; Plohr, M. System Analysis of Turbo-Electric and Hybrid-Electric Propulsion Systems on a Regional Aircraft. Aeronaut. J. 2019, 123, 1602–1617. [Google Scholar] [CrossRef]
- Masson, P.J.; Ratelle, K.; Delobel, P.; Lipardi, A.; Lorin, C. Development of a 3D Sizing Model for All-Superconducting Machines for Turbo-Electric Aircraft Propulsion. IEEE Trans. Appl. Supercond. 2013, 23, 3600805. [Google Scholar] [CrossRef]
- Kim, J.; Kwon, K.; Roy, S.; Garcia, E.; Mavris, D.N. Megawatt-Class Turboelectric Distributed Propulsion, Power, and Thermal Systems for Aircraft. In Proceedings of the 2018 AIAA Aerospace Sciences Meeting, Kissimmee, FL, USA, 8–12 January 2018; American Institute of Aeronautics and Astronautics: Reston, VA, USA, 2018. [Google Scholar]
- Hendricks, E.S.; Falck, R.D.; Gray, J.S.; Aretskin-Hariton, E.D.; Ingraham, D.J.; Chapman, J.W.; Schnulo, S.L.; Chin, J.C.; Jasa, J.P.; Bergeson, J.D.; et al. Multidisciplinary Optimization of a Turboelectric Tiltwing Urban Air Mobility Aircraft. In Proceedings of the AIAA Aviation 2019 Forum, Dallas, TX, USA, 17–21 June 2019; pp. 1–20. [Google Scholar] [CrossRef] [Green Version]
- Hendricks, E.; Aretskin-Hariton, E.; Chapman, J.; Gray, J.; Falck, R. Propulsion System Optimization for a Turboelectric Tiltwing Urban Air Mobility Aircraft. In Proceedings of the International Society for Air Breathing Engines (ISABE) Conference, Canberra, ACT, Australia, 22–27 September 2019; Available online: https://ntrs.nasa.gov/citations/20190032149 (accessed on 3 November 2021).
- Donateo, T.; Cucciniello, L.; Strafella, L.; Ficarella, A. Control Oriented Modelling of a Turboshaft Engine for Hybrid Electric Urban Air-Mobility. In E3S Web of Conferences; EDP Sciences: Les Ulis, France, 2020; Volume 197, p. 05003. [Google Scholar] [CrossRef]
- Misra, A. Energy Storage for Electrified Aircraft: The Need for Better Batteries, Fuel Cells, and Supercapacitors. IEEE Electrif. Mag. 2018, 6, 54–61. [Google Scholar] [CrossRef]
- Badum, L.; Leizeronok, B.; Cukurel, B. New Insights From Conceptual Design of an Additive Manufactured 300 W Micro Gas Turbine Towards UAV Applications. In Industrial and Cogeneration; Manufacturing Materials and, Metallurgy; Marine; Microturbines, Turbochargers, and Small Turbomachines; American Society of Mechanical Engineers: New York, NY, USA, 2020; Volume 8. [Google Scholar]
- Seo, J.; Lim, H.-S.; Park, J.; Park, M.R.; Choi, B.S. Development and Experimental Investigation of a 500-W Class Ultra-Micro Gas Turbine Power Generator. Energy 2017, 124, 9–18. [Google Scholar] [CrossRef]
- Grannan, N.D.; Moosmann, K.; Hoke, J.; McClearn, M.J.; Schauer, F. Small Turbojet Altitude Test Facility with Two-Stage Turbocharger Inlet Air Cooling. In Proceedings of the AIAA Aerospace Sciences Meeting, Kissimmee, FL, USA, 8–12 January 2018. [Google Scholar] [CrossRef]
- Kang, Y.S.; Lim, B.J.; Cha, B.J. Multi-Stage Turbocharger System Analysis Method for High Altitude UAV Engine. J. Mech. Sci. Technol. 2017, 31, 2803–2811. [Google Scholar] [CrossRef]
- Rodgers, C. Turbocharging a High Altitude UAV C.I. Engine. In Proceedings of the 37th Joint Propulsion Conference and Exhibit, Salt Lake City, UT, USA, 8–11 July 2001; American Institute of Aeronautics and Astronautics: Reston, VA, USA, 2001. [Google Scholar]
- Jansen, R.; Bowman, C.; Jankovsky, A.; Dyson, R.; Felder, J. Overview of NASA Electrified Aircraft Propulsion (EAP) Research for Large Subsonic Transports. In Proceedings of the 53rd AIAA/SAE/ASEE Joint Propulsion Conference, Atlanta, GA, USA, 10–12 July 2017; American Institute of Aeronautics and Astronautics: Reston, VA, USA, 2017. [Google Scholar]
- Papathakis, K.; Kloesel, K.; Lin, Y.; Clarke, S.; Ediger, J.; Ginn, S. NASA Turbo-electric Distributed Propulsion Bench. In Proceedings of the 52nd AIAA/SAE/ASEE Joint Propulsion Conference, Salt Lake City, UT, USA, 25–27 July 2016. [Google Scholar] [CrossRef]
- Saeed, A.S.; Younes, A.B.; Cai, C.; Cai, G. A Survey of Hybrid Unmanned Aerial Vehicles. Prog. Aerosp. Sci. 2018, 98, 91–105. [Google Scholar] [CrossRef]
- Moody, K.J.; Replogle, C.J.; Rouser, K.P. Validation of Analytical Model for Turboelectric Power System for Preliminary Design Purposes. J. Eng. Gas Turbines Power 2020, 142, 081011. [Google Scholar] [CrossRef]
- Moody, K.J. Design, Analysis, and Integration of a Turboelectric Propulsion and Power System for Unmanned Aircraft. Master’s Thesis, Oklahoma State University, Stillwater, OK, USA, 2020. [Google Scholar]
- Gundlach, J. Designing Unmanned Aircraft Systems: A Comprehensive Approach, 2nd ed.; American Institute of Aeronautics and Astronautics, Inc.: Reston, VA, USA, 2014. [Google Scholar]
- Johnsen, J.P.; Runnels, T.; Burgess, J.M.; Rouser, K.P. Integration of a 7-KW Turboelectric Power System in a Vertical Take-Off and Landing Unmanned Aircraft. In Proceedings of the AIAA Propulsion and Energy 2021 Forum, Virtual Event, 9–11 August 2021. [Google Scholar] [CrossRef]


Publisher’s Note: MDPI stays neutral with regard to jurisdictional claims in published maps and institutional affiliations. |
© 2021 by the authors. Licensee MDPI, Basel, Switzerland. This article is an open access article distributed under the terms and conditions of the Creative Commons Attribution (CC BY) license (https://creativecommons.org/licenses/by/4.0/).