Abstract
The main challenge of automatic license plate recognition (ALPR) systems is that the overall performance is highly dependent upon the results of each component in the system’s pipeline. This paper proposes an improved ALPR system for the Jordanian license plates. Ceiling analysis is carried out to identify potential enhancements in each processing stage of a previously reported ALPR system. Based on the obtained ceiling analysis results, several enhancements are then suggested to improve the overall performance of the system under study. These improvements are (i) vertical-edge histogram analysis and size estimation of the candidate regions in the detection stage and (ii) de-rotation of the misaligned license plate images in the segmentation unit. These enhancements have resulted in significant improvements in the overall system performance despite a <1% increase in the execution time. The performance of the developed ALPR is assessed experimentally using a dataset of 500 images for parked and moving vehicles. The obtained results are found to be superior to those reported in equivalent systems, with a plate detection accuracy of 94.4%, character segmentation accuracy of 91.9%, and character recognition accuracy of 91.5%.
1. Introduction
The rapid growth in the number of vehicles has led to the continuous need for more use of the Intelligent Transportation System (ITS) to address many security- and traffic-management challenges, including finding stolen cars, banning violations, managing parking lots, monitoring cars at traffic lights, and others. The ITSs that aim to make the use of transportation networks safer and smarter have been benefiting from recent advances in image processing and machine intelligence techniques towards the development of more intelligent roads, vehicles, and users [1,2]. License plate recognition (LPR) is typically one of the key components of the ITS.
LPR is one of the essential elements of a mass surveillance method. It is sometimes known as a license plate recognition system (LPRS), automatic license plate reader (ALPR), automatic vehicle identification (AVI), mobile license plate reader (MLPR), or vehicle license plate recognition (VLPR). The design and format of the license plates vary in different countries. However, these systems typically comprise four main components: image capturing, detection, segmentation, and recognition.
The work presented in this paper extends on and improves on the performance of an ALPR that was previously reported in [3]. The primary contributions of this paper can be summarized as follows:
- (a)
- A ceiling analysis is carried out to identify potential enhancements in each stage of the ALPR that have a significant impact on the overall system performance.
- (b)
- Based on the obtained ceiling analysis results, the following enhancements are suggested:
- ○
- In the detection stage, new processing units are suggested; a vertical-edge histogram analysis and size estimation of the candidate regions.
- ○
- In the segmentation stage, a new processing unit is suggested to de-rotate the misaligned license plate images.
These improvements have resulted in significant improvements in overall system performance despite only a 1% increase in execution time.
The remainder of this paper is organized as follows. Works related to ALPR systems are reviewed in Section 2. The style and attributes of Jordanian license plates, as well as the dataset used in this study, are detailed in Section 3. The suggested ceiling analysis and ALPR system are shown in Section 4 and Section 5, respectively. The obtained results are presented and discussed in Section 6. Finally, the work is concluded in Section 7.
2. Related Work
The current ALPR systems can be categorized into multi- and single-stage approaches [4]. However, most of the existing ALPR systems are based on the multi-stage approach. The work related to both approaches is reviewed in this section as follows.
2.1. Multi-Stage Approach
The main three components of the multi-stage method are detection, segmentation and recognition. These components, which were of particular interest in many studies including those of the Jordanian license plates [5,6], are described as follows.
2.1.1. Detection
Automatic License Plate Recognition (ALPR) relies mainly on the detection of the license plate from an image source, the captured vehicle and part of the road background. Numerous techniques have been reported to detect the license plate of the captured vehicle. Ashtari [7] reported a connected component analysis technique related to colour images to improve the performance of the algorithm. It was reported that colour images add more flexibility and help to achieve fairly reliable results under all types of weather conditions. Menon and Omman [8] proposed an edge detection filter that can be used with a support vector machine (SVM) to detect Spanish and Indian license plates.
In [8,9,10], researchers used an edge detection filter with morphological operations to detect the license plate. Chowdhury [11] proposed an adaptive license plate detection technique using the edge detection filter with vertical histogram analysis. In [12,13,14], canny-edge and Sobel-edge detection filters were utilized in the plate detection phase. A combination of edge detection filtering and connected component analysis was also used to build a robust license plate detection algorithm [13]. In [15], the authors proposed a Hough transform technique to extract features from the license plate image. Gabor filters morphological closing operation and connected component analysis were also used in [16] to detect plate regions.
2.1.2. Segmentation
Segmentation of the license plate characters starts after the completion of the license plate detection. The system must extract the characters and numbers from the plate. Character segmentation relies on different techniques. The most common technique of character segmentation is the connected component analysis (CCA), as reported in [6,10,13,14,15,16]. CCA technique depends on the connectivity of the character region (pixels), especially for letters and numbers. Other techniques include the utilization of the morphological and histogram [3,4,5,6,7] and radon transformation [9]. The latter technique is concerned with the angle of inclination and partial vertical projection to extract and divide the characters. Ha and Vajgl [13] used a method in which the detected character is compared to an embedded database of templates until a match occurs, and they also used template techniques. Chun-Cheng Peng et al. [17] used a binarization method, which was inspired by the symmetry principle, rather than the outs algorithm. Qadri and Asif [15] divided the image into regions, and then the regions were split into segments. Finally, a classifier was used to decide whether these segments are characters or not. Nigussie [16] used statistical features of characters to classify these features and segment them.
2.1.3. Recognition
Character recognition is performed to convert the segmented characters into text plate numbers. Different types of artificial neural networks (ANNs) have been used in character recognition. In [7,9,14,15,16], multi-layer perceptron ANNs with error backpropagation were used. Huang [7] used an Extreme Learning Machine (ELM) where it was a new category of ANNs, which possesses compelling characteristics essential for license plate recognition, such as low computational complexity, fast training, and good generalization. When comparing ELM with other types of ANN; the recognition rate of the ELM is better, and the time consumed is shorter. To recognize the extracted letters and numbers, Ashtari [7] replaced the ANN with a hybrid classifier that was comprised of a decision tree and a support vector machine (SVM) with a homogeneous fifth degree polynomial kernel. Ha [12] and Hurtik [13] used template matching techniques suitable for the recognition of characters and numbers. Nigussie [16] used the k-Nearest Neighbor (kNN) algorithm; it is nonparametric, as it has no explicit assumptions about the relationship between the predictor and the dependent variable.
2.2. Single-Stage Approach
Recently, several works were reported on the single-stage ALPR approach. Most of these works utilized deep neural networks that were trained for end-to-end detection, localization and recognition of the license plate in a single forward pass [4]. Li et al. [18] used VGG16, which is a convolutional neural network model [19], as a feature extractor. Alghyaline [20] reported a real-time Jordanian license plate recognition using deep learning; his work was based on Convolutional Neural Networks (CNNs), which were used with the YOLO3 framework. Q. Huang et al. [21] used a single neural network called ALPRNet for the detection and recognition of mixed style LPs. H. Li et al. [22] proposed a unified deep neural network, which localized license plates and recognized the letters simultaneously in a single forward pass.
3. Jordanian License Plate
In this section, the Jordanian license plate standards are described along with the image dataset used in this work.
3.1. Style and Attributes
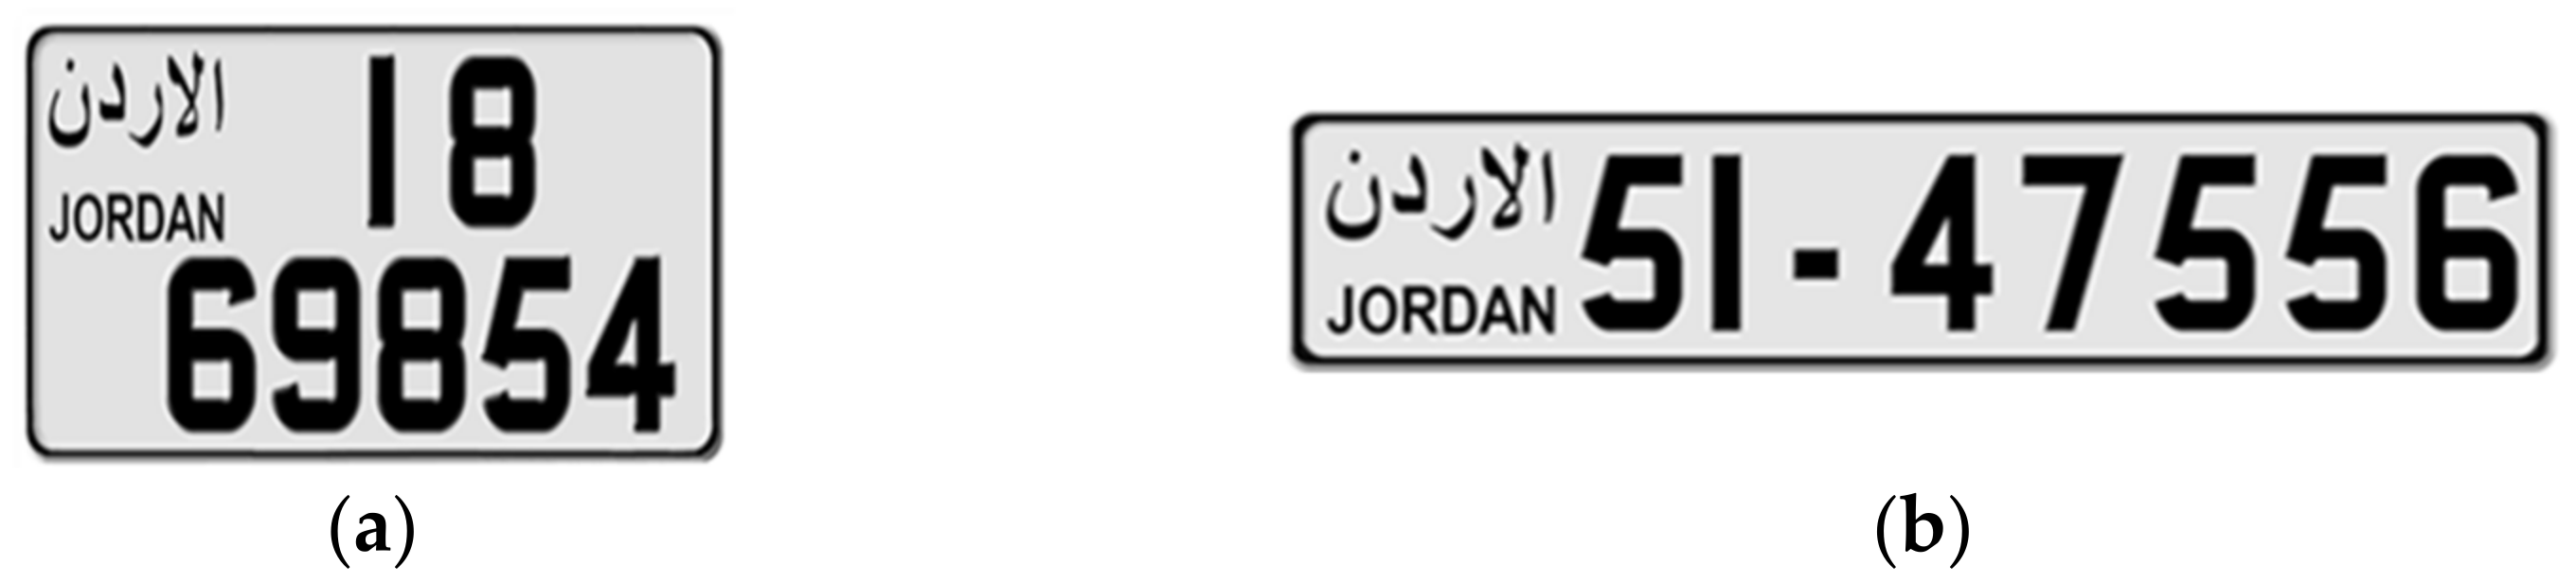
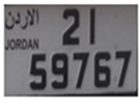
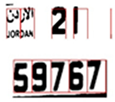
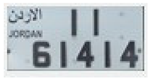
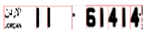
The most recent version of the Jordanian license plates was introduced in 2007 [23]. The style and formats of these plates are based on American and European standards, as shown in Figure 1. As illustrated, the differences between those standards are the plate’s shape, size and position of the first one or two digits that correspond to the vehicle’s category while the following numerical digits represent the vehicle’s ID (up to five digits). Both types of plates are made of aluminum and are covered with reflective phosphorus tape. The characters on these plates are printed using an excessive pressure technique. These plates consist of four colored codes that represent the background color for both English and Arabic characters for the word “JORDAN الأردن”. These color codes represent four different vehicle’s categories: (i) Red for government vehicles, (ii) Yellow for diplomatic and temporary vehicles, (iii) Green for public transport vehicles, and (iv) White for private vehicles.

Figure 1.
Examples of Jordanian license plates for private vehicles. (a) American standard (34 × 22 cm). (b) European standard (52 × 11.4 cm).
3.2. Study Dataset
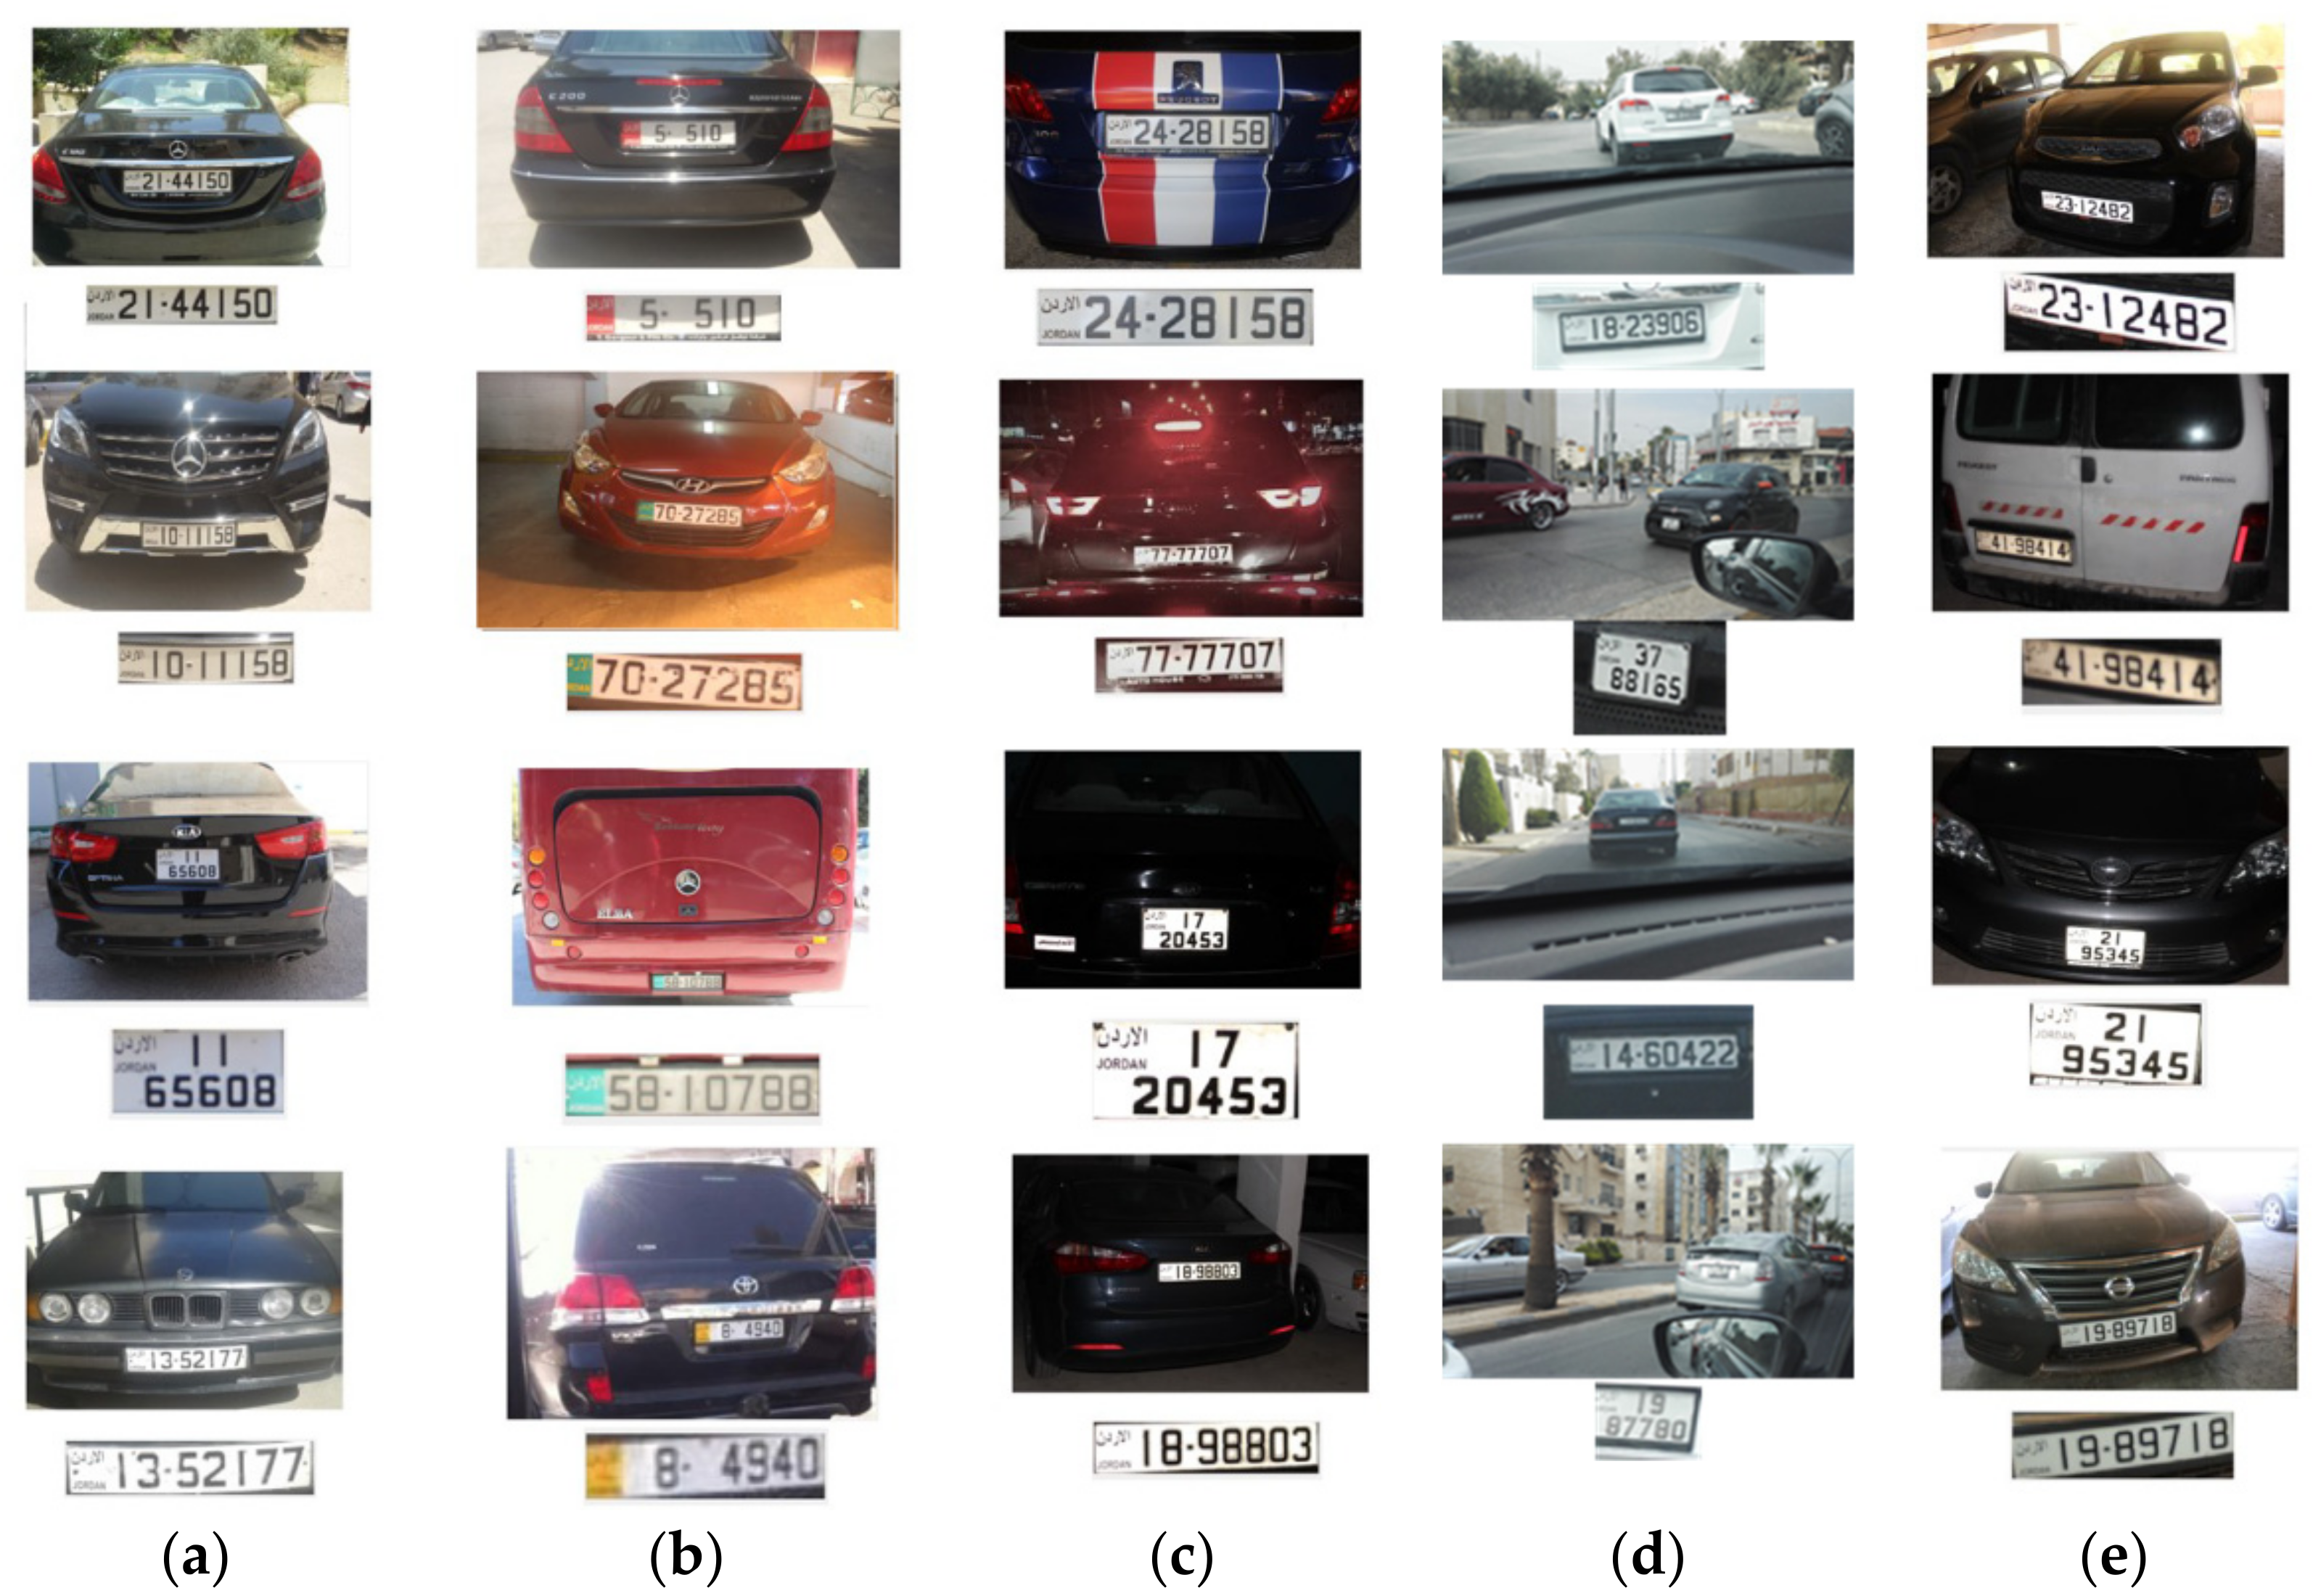
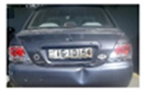
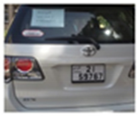
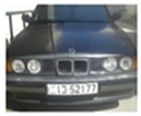
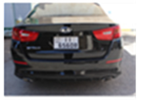
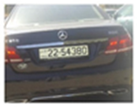
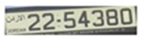
A dataset of 500 Jordanian license plate images (size 1188 × 960 pixels) was collected by the authors using a Canon EOS-650d Camera. The collected images were taken under different conditions for stationary vehicles (immobilized/parking mode). These images were taken of vehicles inside and outside of the parking garage and during different times of day (i.e., early morning, afternoon, and at night). The collected dataset images were equally divided between the American- and European-standard license plates where both standards are considered in Jordan. Different samples of the collected images are shown in Figure 2. The first row represents samples for images captured outside and the second row represents images captured from inside the parking garages. The first column is for images taken early in the morning on a sunny day, the second column is for images taken later in the afternoon, the third column is taken from various angles for moving vehicles, and the fourth column is for vehicles with license plates taken from various tilt angles.

Figure 2.
Samples of the collected dataset elements, taken at/for: (a) a sunny day, (b) different vehicles’ categories, (c) different lighting conditions, (d) vehicles in movement, and (e) different tilt angles.
4. Ceiling Analysis
Ceiling analysis is a method of identifying the weakest component in the system, and then optimizing that component to improve the performance of the total system. In the present work, the ceiling analysis is applied to an ALPR which was previously reported in [3] to identify potential improvements in various components of the system, detection, segmentation, and recognition. This is typically achieved by manually replacing the inputs of each component with artificial inputs to provide 100% accurate predictions with that component. The overall improvement of the system performance can then be observed, component by component.
In this work, the ALPR system under study was initially tested with real inputs using the study dataset. This test revealed that the overall accuracy of the system was approximately 52%. Next, the ceiling analysis was carried out for each component as follows:
- Detection—for this stage, a total of 500 vehicles’ images were used as test input and the correctly detected license plate images were considered as an output. The system detected 410 correct license plates that represented about 82%, compared to the ground truth (100%).
- Segmentation—the license plate images were manually extracted from the vehicles’ images and used as a test input for segmentation. In this test, the system correctly segmented 475 images that represented 95% of the input images, compared to the ground truth.
- Recognition—a total of 3365 character-images were manually extracted from 500 license plate images and used as test input at this stage. The system correctly recognized 3254 characters which represented 96.7% of the input character-images, compared to the ground truth.
Table 1 summarizes performance comparisons for both actual and artificial inputs for the ALPR system under study. As expected, the artificial inputs used in this analysis resulted in a significant potential for performance improvement as compared to that of the original system [3]. More importantly, the possible improvement margins for individual system components were extremely diverse, with detection (40.2%), segmentation (13%), and recognition (1.7%). These findings suggest that the detection component has the most potential for development, followed by segmentation and finally the recognition component.

Table 1.
Summary performance comparisons for both actual and artificial inputs for the ALPR system under study. As expected, the artificial inputs used in this analysis resulted in a significant potential for performance improvement as compared to that of the original system.
5. The ALPR System
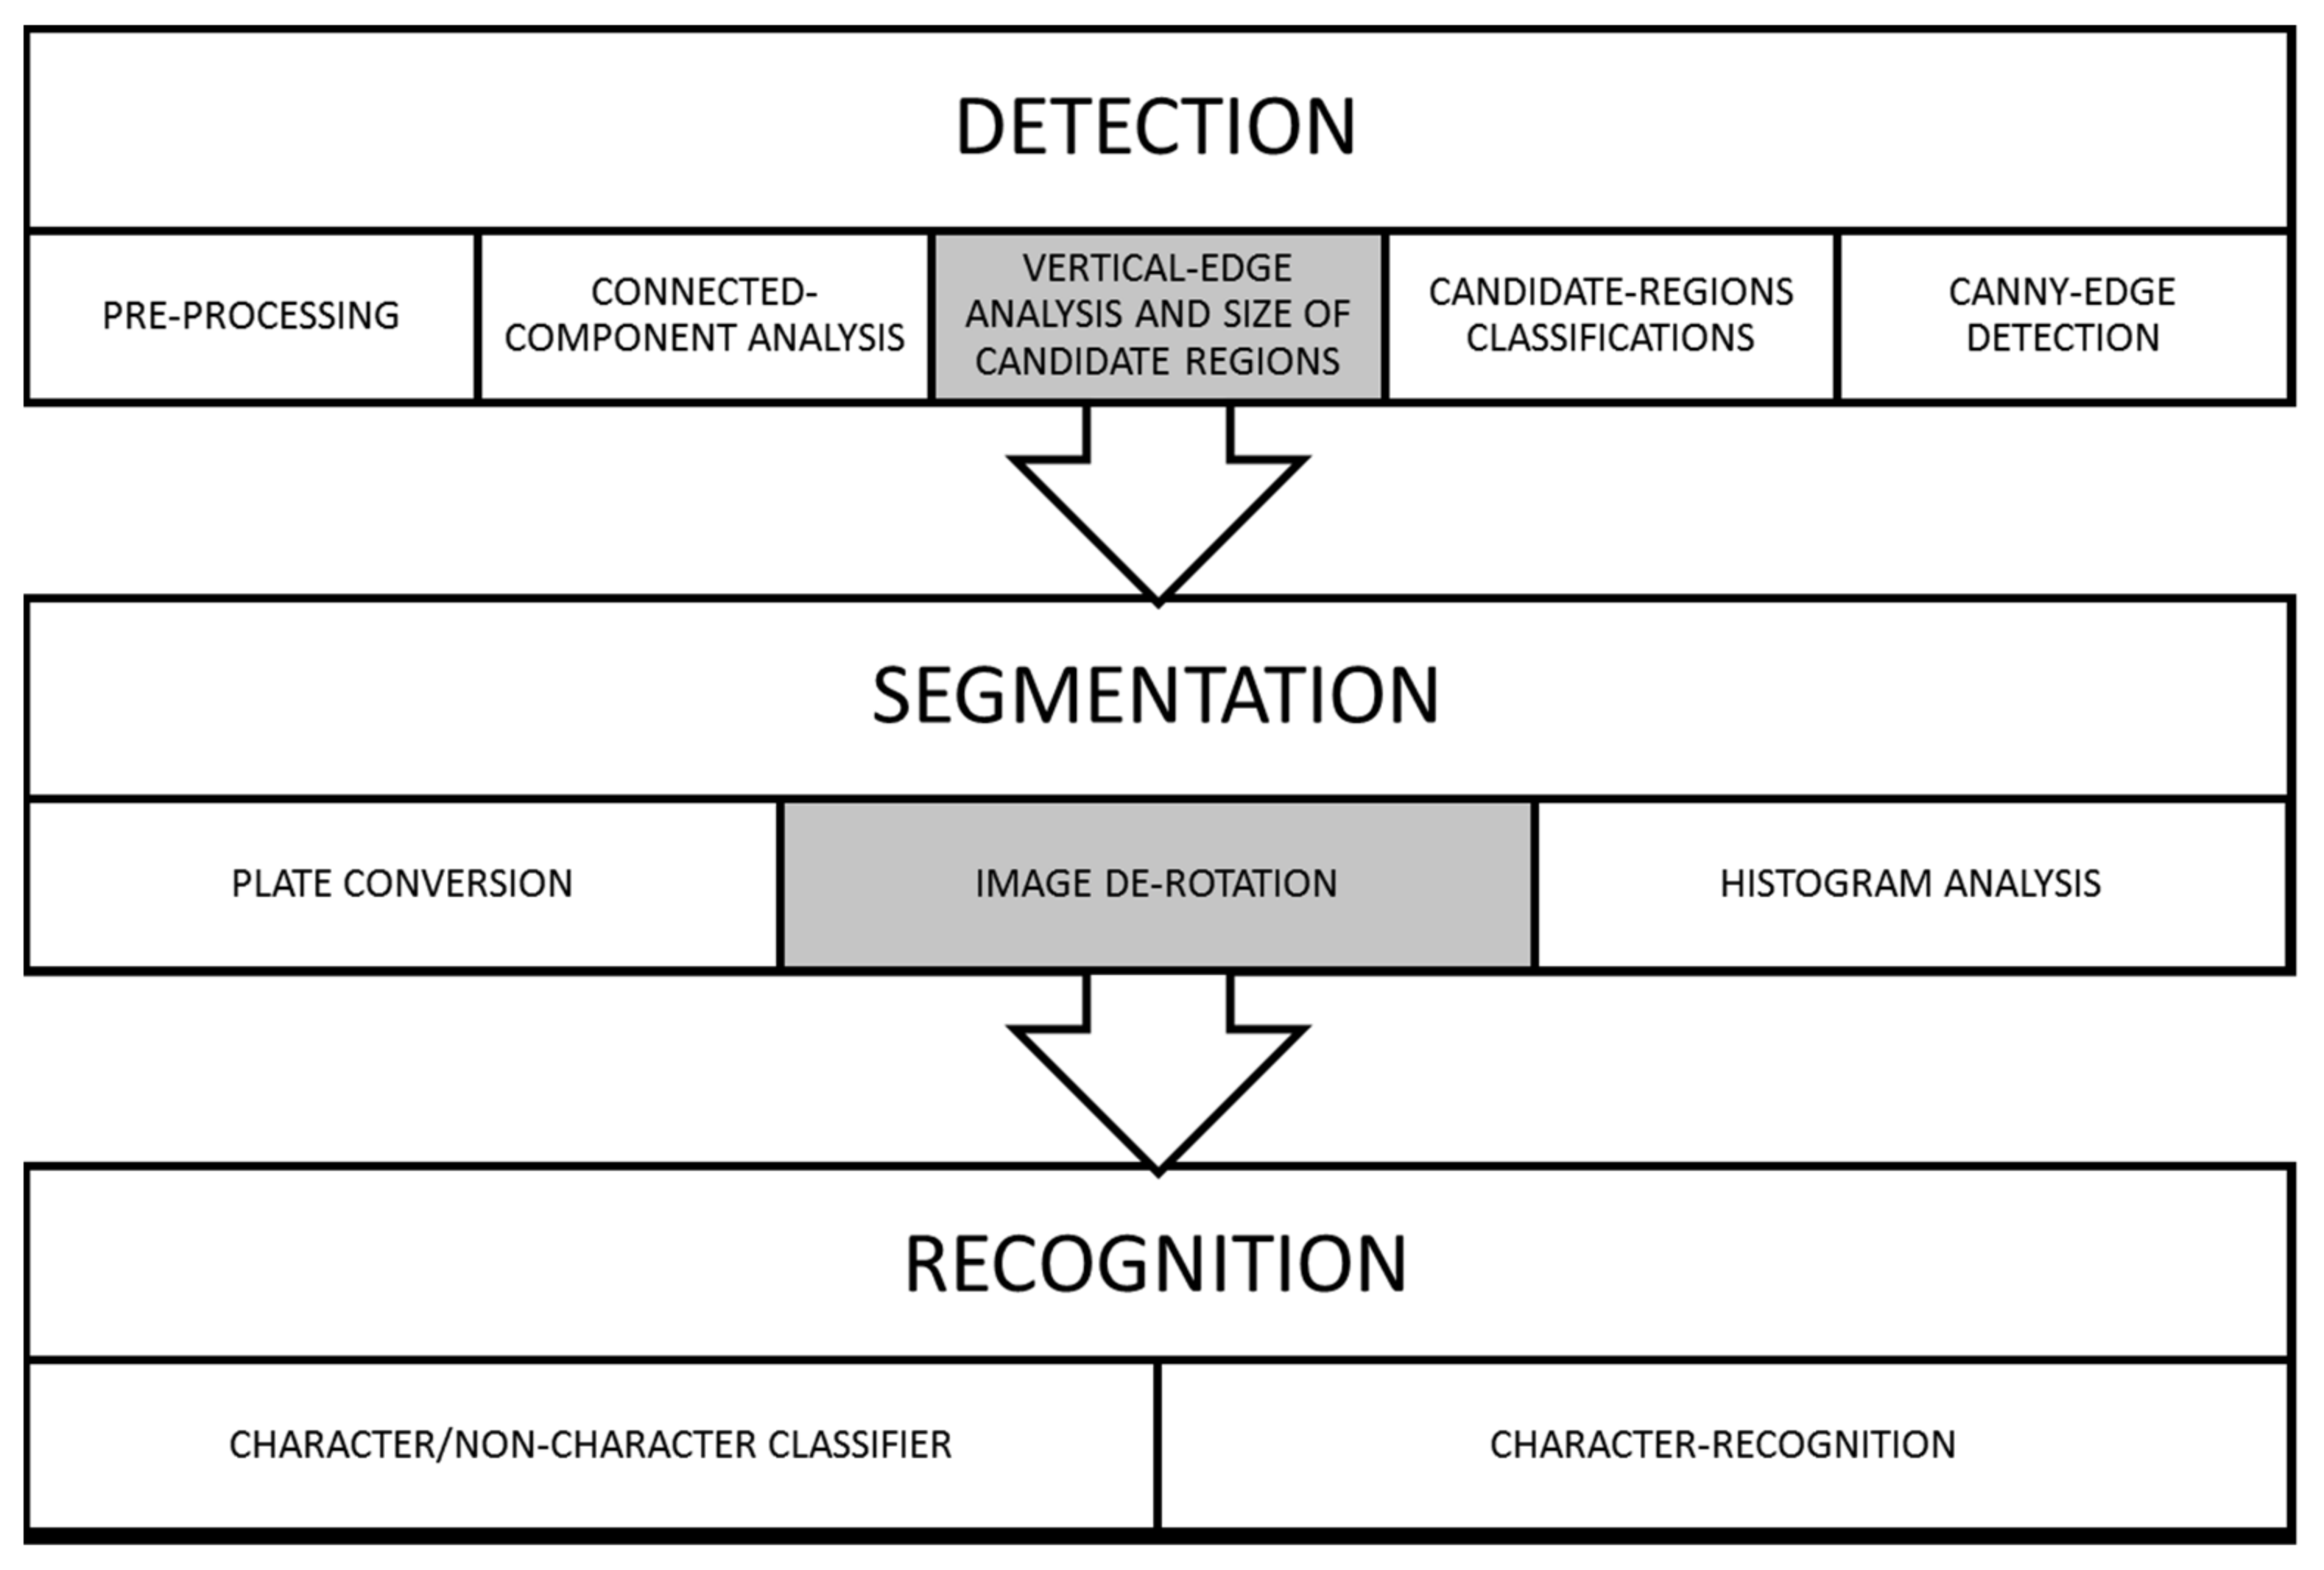
A block diagram of the ALPR system is shown in Figure 3. In this section, the main system components are described with a particular focus on the suggested enhancements in the detection and segmentation components.

Figure 3.
A block diagram of the proposed ALPR system with the suggested enhancements highlighted.
5.1. Detection
The dataset images are pre-processed using image resizing, grey color conversion, banalization, and morphological operations and filtering. Next, the connected neighbors are analyzed, using the Connected Component Analysis (CCA) algorithm, to obtain the possible candidates for a license plate. The potential number of candidates are then reduced using the newly added features; vertical-edge analysis (VEA) and this is achieved by filtering some of the candidates’ regions that may cause the next detection stages to be misled and hence affect the overall detection performance. The aspect and edge ratios of the image under processing are then checked to identify the correct license plate’s candidate. This process passes through several stages that are outlined as follows.
5.1.1. Pre-Processing
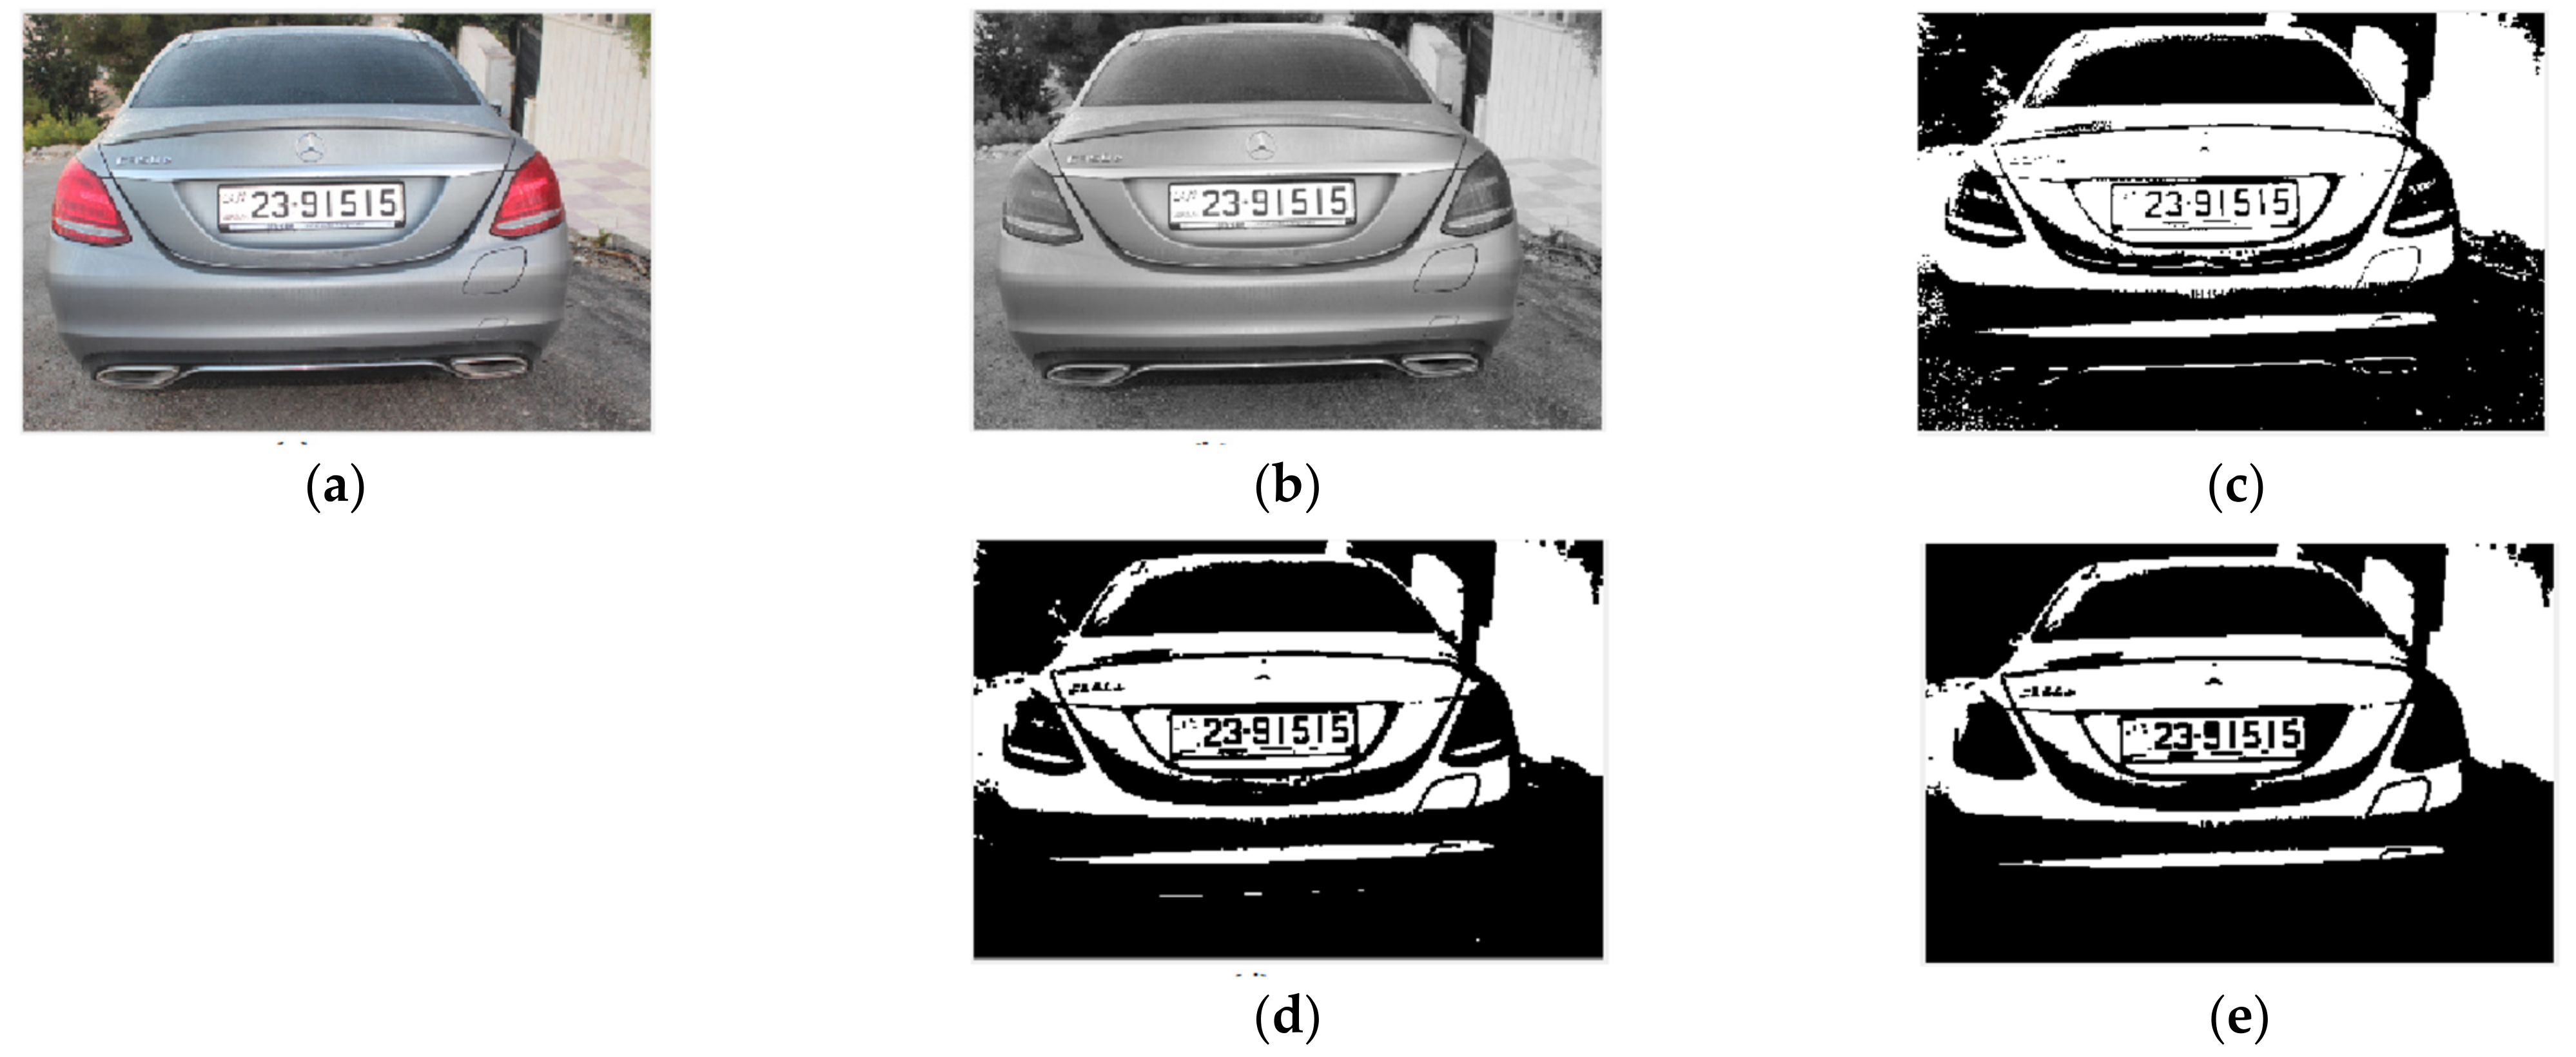
The source images are pre-processed to reduce the complexity of the image features and make the details clearer. Different pre-processing techniques are applied at this stage including (i) image resizing to maintain the same aspect ratio, (ii) converting colored images into greyscale, (iii) binarizing the resultant image by replacing its pixels with luminance values that are greater than a specified threshold by bit 1 (white) and replacing all other pixels with bit 0 (black). The threshold value is calculated as suggested in [24] using the OTSU method, (iv) dilating the binary image with a 3 × 3 structure element to reduce the noise; this will grow the foreground regions and the noise within these regions become smaller, and (v) removing noise from the binary image with all connected pixels less than a fixed threshold. Figure 4 shows an example of applying different pre-processing techniques to a source image.

Figure 4.
Pre-processing of the source image: (a) RGB, (b) gray, (c) binary, (d) binary after dilation, and (e) image after noise removal.
5.1.2. Connected-Component Analysis
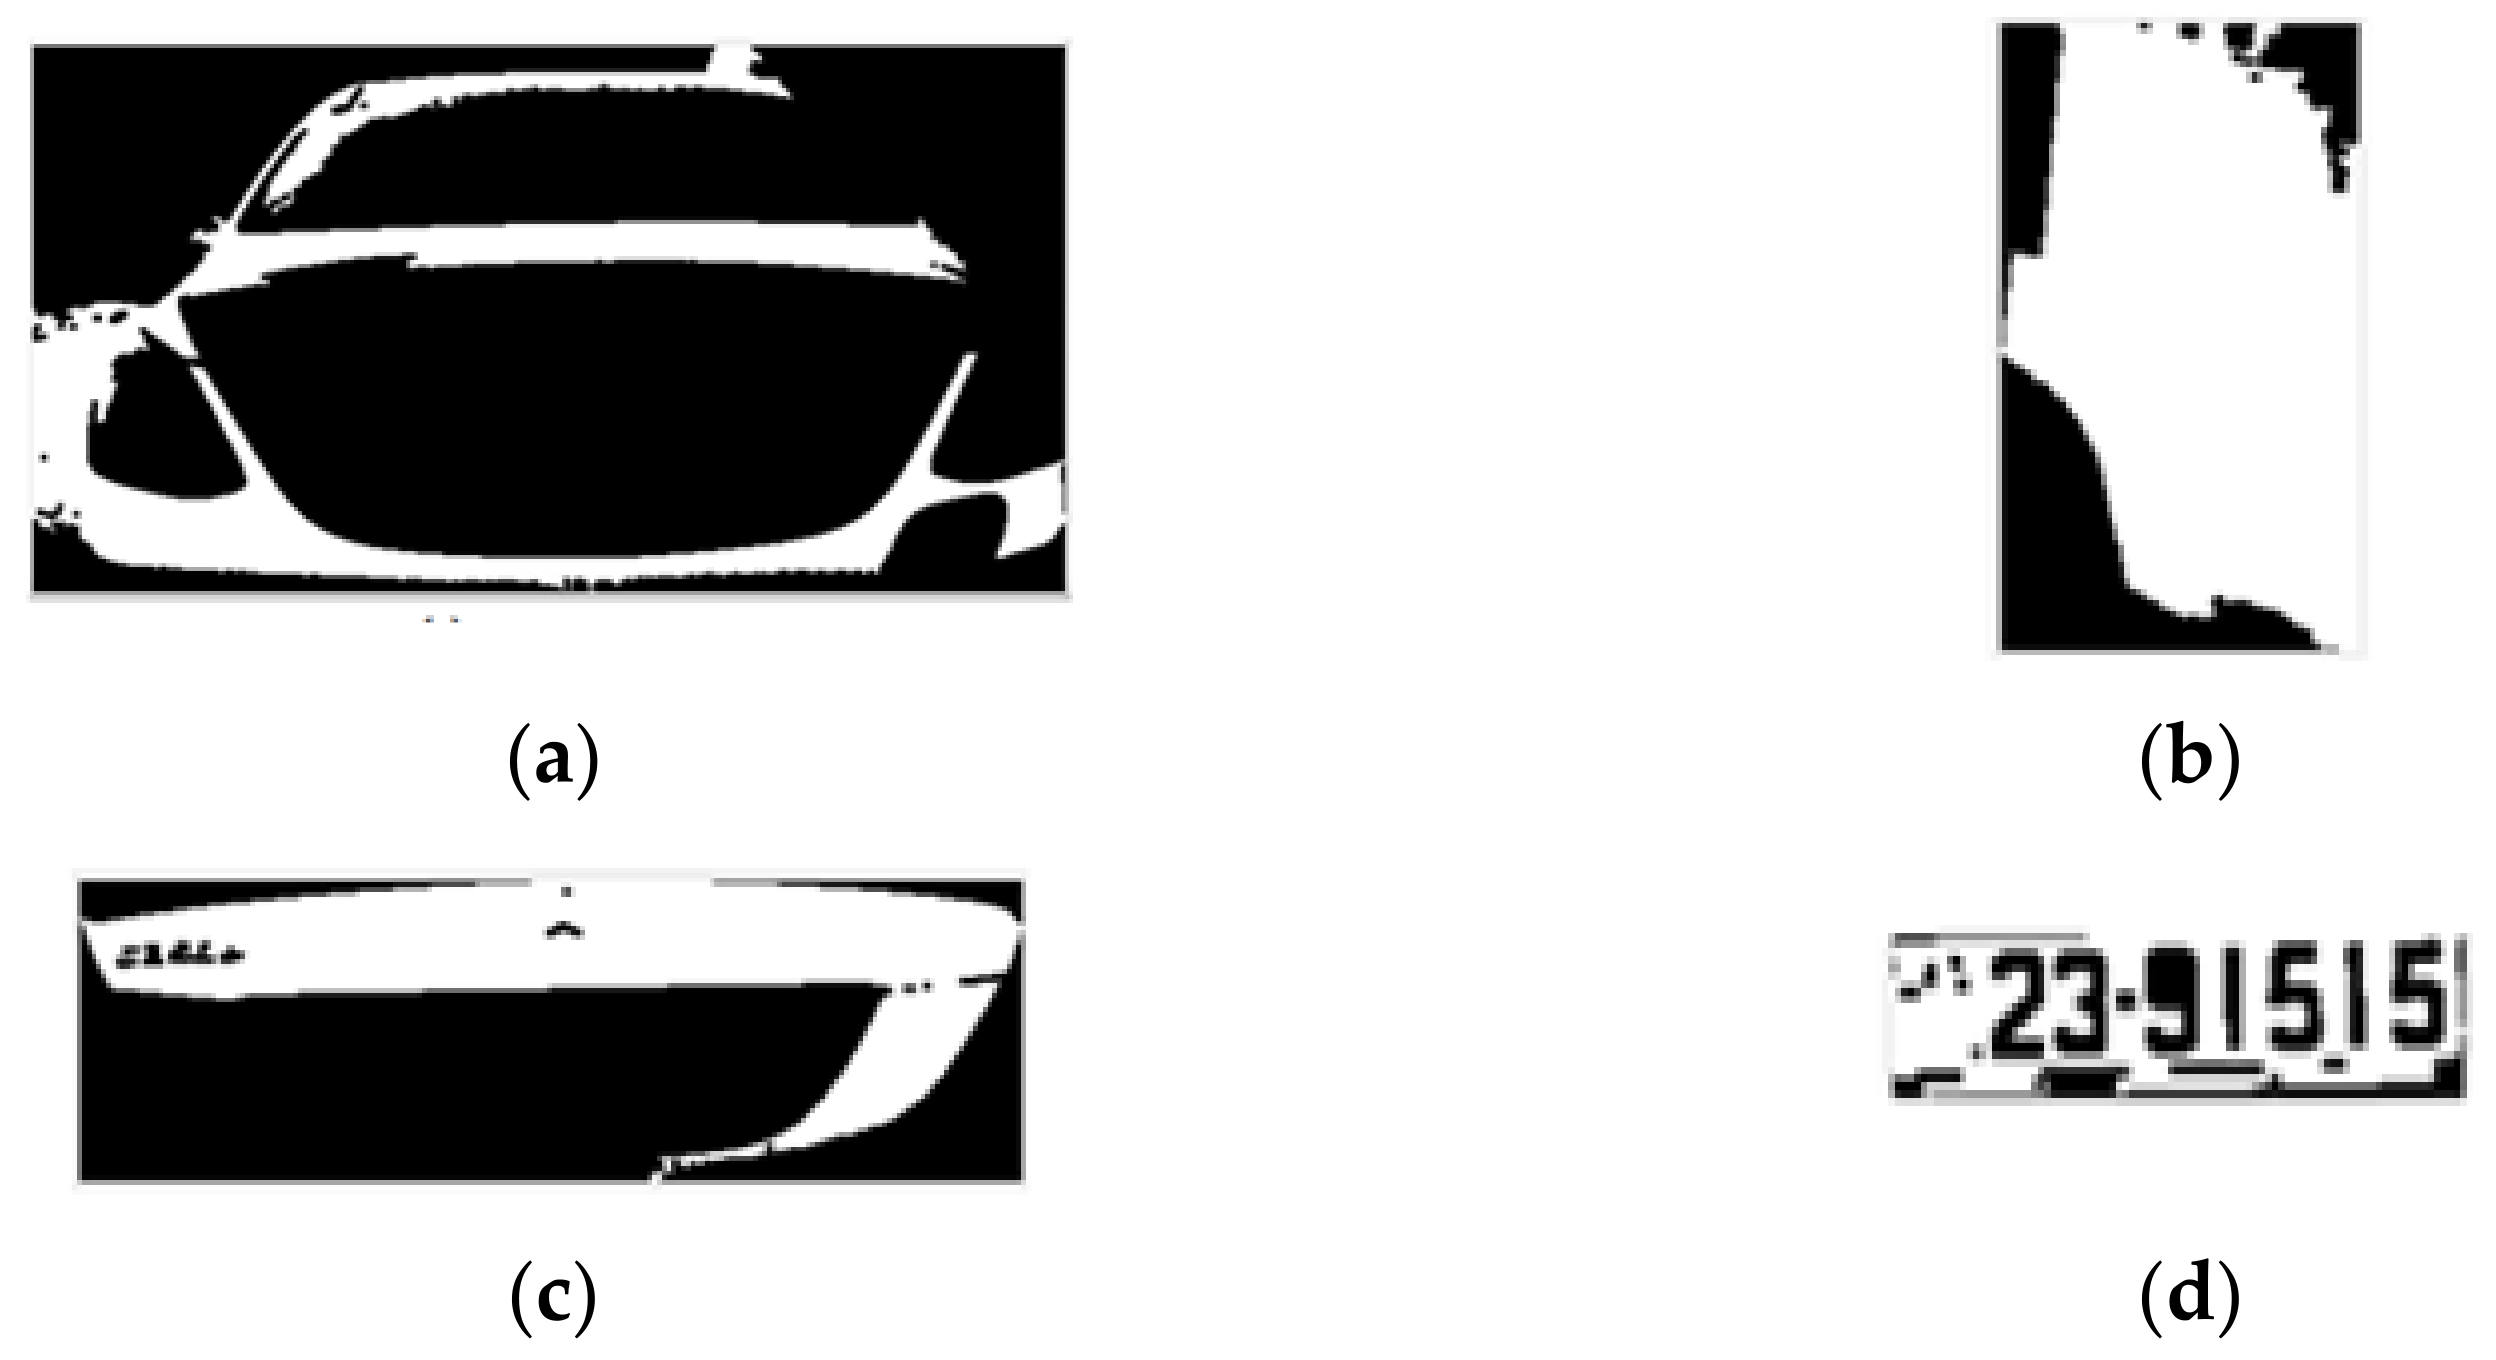
At this stage, a connected component analysis technique is used. An 8-pixels neighborhood method is used to find the candidate plate regions. In this method, the image is initially scanned, then a set of pixels that share the same values is created to form groups; the size of each group is at least 8 pixels. Once formed, the groups are separated from each other to create a single image that becomes a license plate candidate region. The location of these candidate regions should be known in the image source and preserved. Examples of candidate regions for an image are shown in Figure 5.

Figure 5.
Examples of candidate regions, (a–d) are samples of candidate regions.
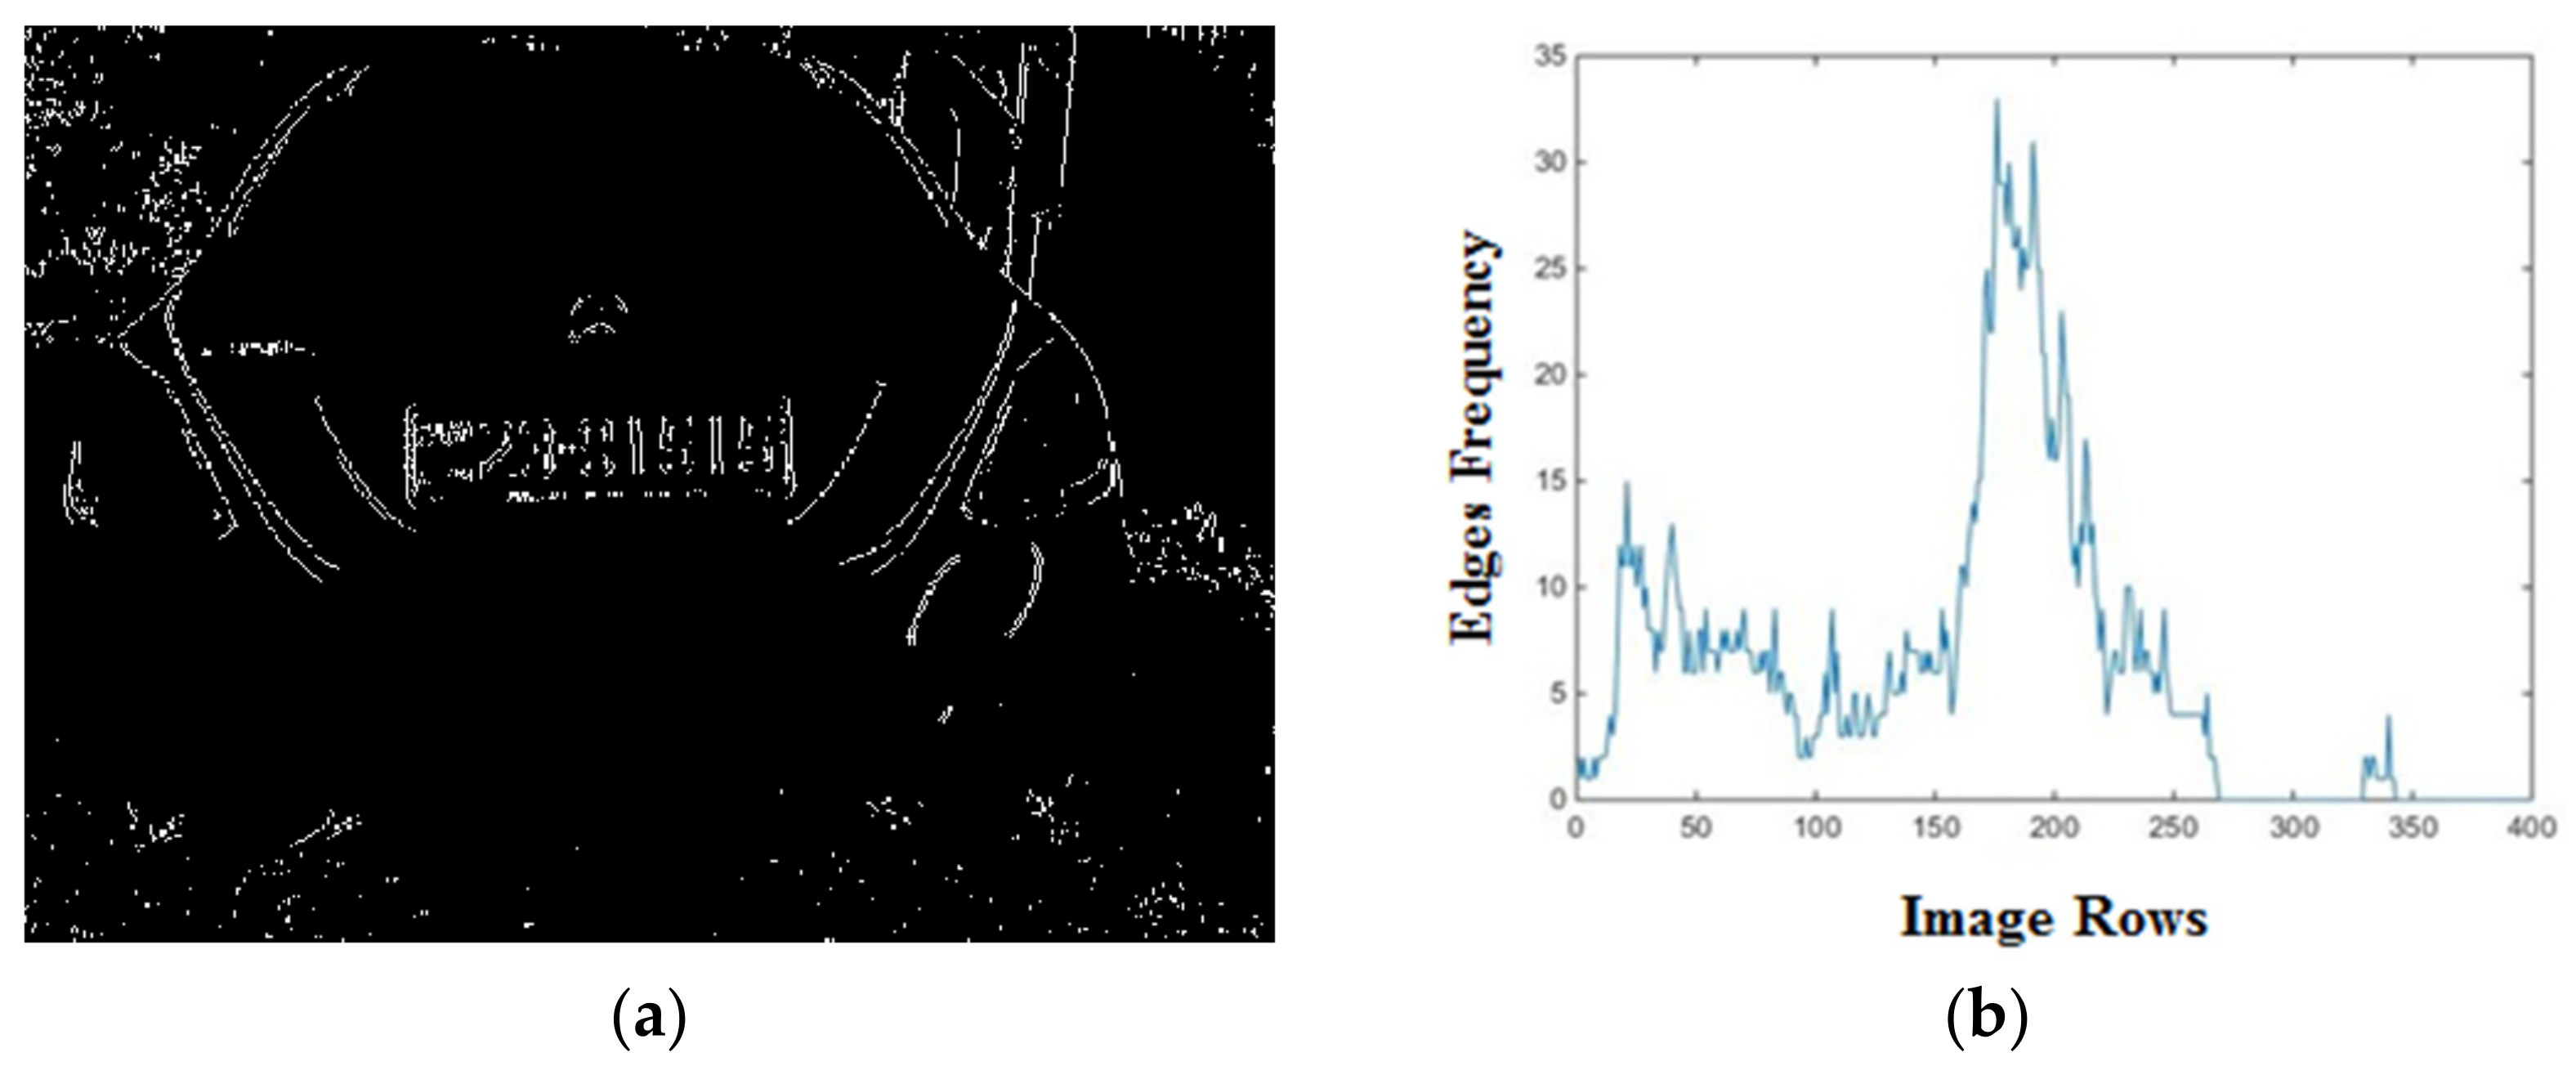
5.1.3. Vertical-Edge Analysis and Size of Candidate Regions
The Jordanian license plates are rectangular shaped with Arabic numerals that have vertical edges more than horizontal edges. These vertical edges can therefore be used to find the most candidate horizontal edges. This involves finding the candidate of the horizontal lines on the plate. A Sobel filter is used for edge detection, and the result is an image with white edges on black background. The vertical-edge density is then obtained by computing the sum of the edges in each row of the images. Next, a projection histogram of vertical edges is generated as shown in Figure 6.
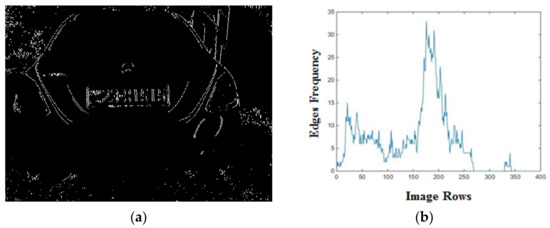
Figure 6.
An example of a vertical-edge image and projection histogram of its vertical edges. (a) A vertical-edge image. (b) Projection histogram of the vertical edges.
From the projection histogram, the image row with the maximum-edge density is obtained. Next, each of the candidate regions is assessed whether it passes through this row or not; if yes, the region is passed to the classification stage, otherwise, it is discarded. The size of each candidate region is also obtained and compared to the original image size. If the size of the candidate plate equals the original binary image, it is considered a non-plate; otherwise, it is a plate, thus it passes to the classification stage.
5.1.4. Candidate-Regions Classifications
Depending on the corresponding aspect ratio (AR), each candidate region is classified as either a plate or a non-plate. The AR is obtained from:
where W is the plate width and H is the plate height.
5.1.5. Canny-Edge Detection
Finally, a canny-edge detection filter is applied to detect edges in the candidate plates. The edge ratio (ER) of each candidate plate is then determined from:
where ER is the edge ratio and Pw is the pixel intensity after edge detection.
The position of the candidate region is chosen with the maximum edge ratio since the license plates contain Arabic numerals with high edges. If no plate is found, the maximum-edge ratio is set to zero. In this case, the maximum intensity of the vertical edges of the selected row is set to zero. This process is repeated for the row that contains the next maximum intensity in the histogram projection of the vertical edges.
5.2. Segmentation
The identified license-plate candidate is segmented to extract the desired candidate region; it is then converted to grey and binary format. The resultant image is then de-rotated to offset any tilted angle if it exists. This newly added feature has significantly improved histogram analysis, especially in the American-standard plates due to the requirement of multiple-line segmentation of the license-plate image. This is achieved using the following three stages:
5.2.1. Plate Conversion
The license plate location is cropped from the source image with RGB status. Next, it is converted to a binary image. Such a conversion results in a new threshold, thus a clearer image is obtained.
5.2.2. Image De-Rotation
The resulting image from the previous stage is almost elliptical. Once the angle between the x-axis and the major axis of the ellipse shape of the plate is found, it is used as the rotation angle to the plate. Figure 7 shows an example of a rotated image that is based on the calculated angle of the ellipse shape.
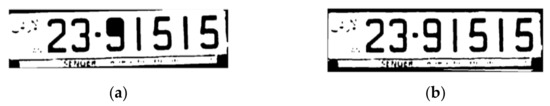
Figure 7.
An example of image rotation. (a) A tilted image. (b) Image after rotation.
5.2.3. Histogram Analysis
The vertical and horizontal histogram analysis is performed on the rotated image. This is obtained by the summation of each row and column of the resulting vertical and horizontal histogram matrices, where the first result represents the summation of each row and the second one represents the summation of the columns. For the character segmentation, a Threshold that determines the character border is calculated from:
where x is the value of each matrix. Now, if x is greater than the threshold, replace it with 1 in the array; otherwise, replace it with 0. For a vertical matrix, an index is used where the value changes from 1 to 0 each time. These indices are stored in a new matrix and the same procedure is repeated for the horizontal matrix. Finally, each candidate character is cropped to make it ready for recognition.
5.3. Recognition
The segmented regions need to be converted into license plate numbers. A two stage consecutive Artificial Neural Network (ANN) is used to achieve this purpose. The first stage is used to classify characters or non-characters regions while the second stage is used to recognize the characters of the nameplate.
5.3.1. Character/Non-Character Classifier
This stage is used to identify whether the segmented image is a character or not. Training of the neural network is divided into 1000 positive data elements for numbers and 1000 negative elements for non-numbers. The training dataset is fed to a feed-forward neural network with 6 layers; a single input layer with a size 1600 representing the size of the input image after resizing, four hidden layers in different sizes and finally an output layer with one activation unit. The output activation unit represents whether a character is recognized (1) or not (0). To reduce the non-linearity of the output of neurons, the sigmoid activation function is used.
5.3.2. Character-Recognition
In this stage, the neural network training data consists of 1000 examples (100 per number). This ANN has three layers; an input layer in size 1600 is the same as the first ANN input layer, a hidden layer in 50 activation units and an output layer with 10 activators to represent numbers from 0–9. Once the ANN is trained, the corresponding parameters are saved and used for making informed decisions on recognizing the actual characters from the corresponding candidates.
6. Results and Discussion
6.1. Results
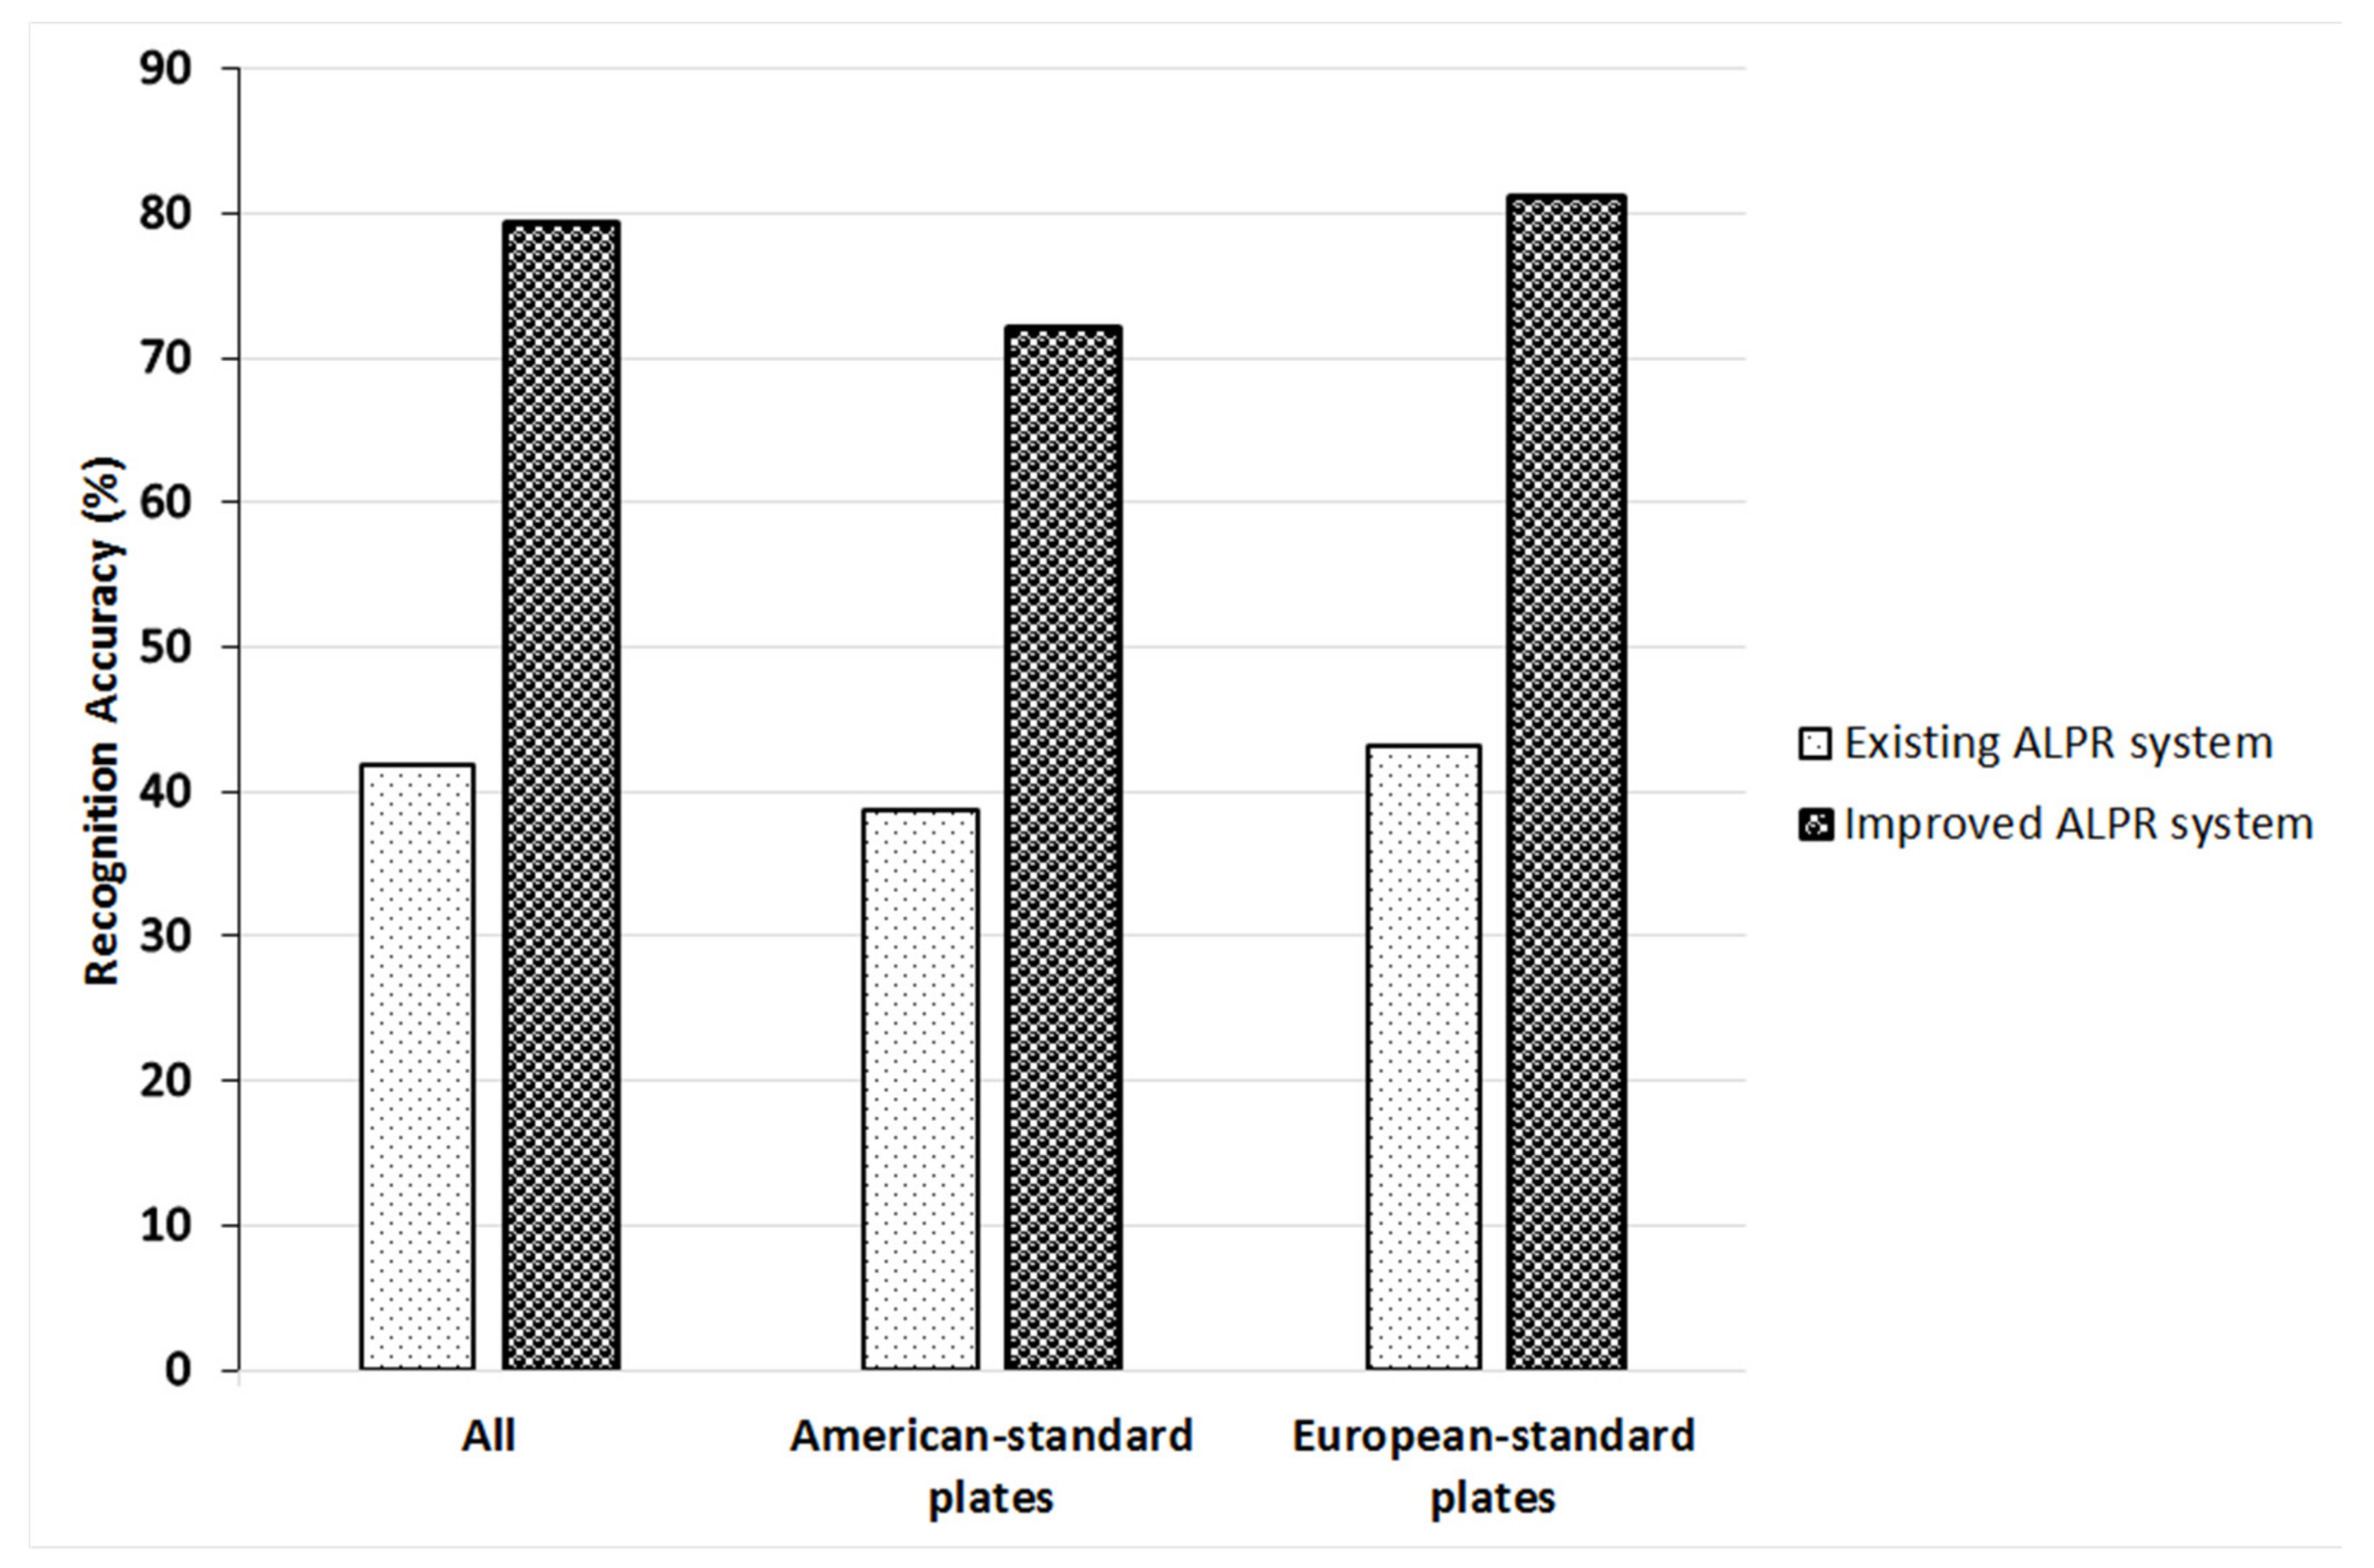
The overall plate’s recognition accuracy for both the old and improved ALPR system is calculated from:
A comparison between the accuracy of the old and improved ALPR systems is shown in Figure 8. As illustrated, the improved system demonstrated significant accuracy improvement when compared to the previously reported ALPR system [3]. For the entire dataset of images, the obtained results demonstrated a recognition accuracy of 79.5% for the improved system compared to 41.8% for the old system. Similarly, the recognition accuracy of American- and European-standard plates are respectively found to be 74.8% and 84% compared to 36.9% and 43.6% for the old ALPR system. The obtained results are also compared to other Jordanian plate-recognition systems reported in [5,6,20]. In [5] the authors used a dataset consisting of only 46 images and reported an overall system accuracy of 70%. In [6], the accuracy was 89% for a dataset of 100 images. In [20], an improved accuracy of 87% was reported for a dataset of 187,200 images that was used to train a deep neural network. It should be emphasized here that due to the lack of a publicly available dataset for the Jordanian plates; these investigations were conducted utilizing different datasets.
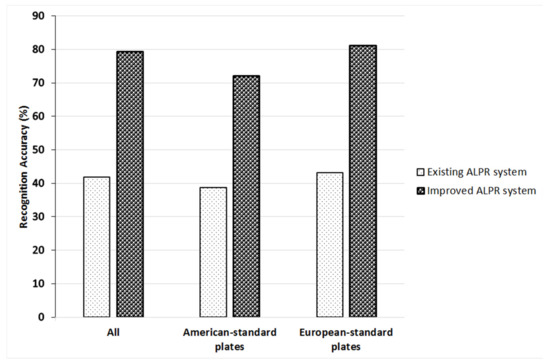
Figure 8.
Comparison between the accuracy of the Existing and Improved ALPR systems.
It should be noted here that the accuracy of each stage is highly dependent on the results of the preceding stage. Therefore, the entire system is established as an integrative or chain relationship. Based on the results of the final stage in recognition, the system may succeed or fail to recognize the correct characters of the license plate; the failure can occur when any character is incorrectly interpreted. Samples of input images and corresponding detection, segmentation and recognition results are shown in Table 2.
Table 2.
Sample input images, and corresponding detection, segmentation, and recognition results.
Table 3, Table 4 and Table 5 show the detailed findings at each component for the old and improved ALPR systems using full dataset, American-standard and European-standard plates, respectively.
Table 3.
A component-level performance comparison between the old and improved ALPR systems using the full dataset (500 images).
Table 4.
A component-level performance comparison between the old and improved ALPR systems using the American-standard plates (500 images).
Table 5.
A component-level performance comparison between the old and improved ALPR systems using the European-standard plates (500 images).
6.2. Time-Complexity Analysis
In this section, the time complexity of the improved license plate recognition algorithm is assessed experimentally, as suggested in [25]. The execution time of the algorithm is estimated by running the algorithm through a specific number of loop iterations. Timestamps of the start () and end () instants of the loop are initially recorded. The execution time () is then calculated from [26]:
where n is the number of loop iterations. In the present analysis, we repeat the code 10,000 times for each image in the database, which leads to a total number of n = 5,000,000. This is considered adequate to estimate the average with acceptable accuracy.
The algorithm was developed in MATLAB 2014b and tested on a PC with 4G RAM, an Intel Core I3 @3.0GHz CPU and the Windows x64 operating system, and the code was run on MATLAB with real-time priority mode. Further reduction in the is still possible by using a more time-efficient programming language such as C/C++ or assembly programming compared to MATLAB. A comparison between the execution time of the old [3] and improved ALPR algorithms is shown in Table 6. As shown, the total execution time is found to be close to that of the old system despite the inclusion of newly added stages. This is achieved by minimizing the number of candidate regions and improving the program’s structure in the improved algorithm.
Table 6.
Comparison between the execution time of the old and improved ALPR algorithms.
6.3. Discussion
As illustrated in Figure 8 and Table 3, Table 4 and Table 5, significant performance improvement in terms of recognition accuracy has been demonstrated. This is achieved by improving a previously reported algorithm by the authors through the utilization of new vertical-edge histogram analysis and candidate size calculation to minimize the number of candidate regions and remove the image background if it exists. A de-rotation stage is also added to the segmentation to correct the plate’s tilt angle before the recognition.
The vertical-edge histogram analysis has contributed to improving the overall success rate of detection from 82% to 94.4%. This improvement is found to be more effective in the European-standard plates as compared to the American-standard plates. This is mainly because the aspect-ratio classification showed more false results with European-standard plates. Many candidate regions demonstrated an aspect ratio similar to the real one, so the vertical-edges analysis is found to be more effective in the detection stage.
The suggested de-rotation stage also improved the overall success rate from 74.4% to 91.9%. The big difference here is caused by (i) the accumulated nature of the license plate recognition algorithm since an improvement in one stage affects the next stage and (ii) the segmentation improvement caused by the de-rotation. Unlike the vertical-edge histogram analysis impact, this improvement is found to be more effective in the American-standard plates as compared to the European-standard plates. The American-standard plates consist of two lines, so any segmentation error would have a larger impact on the results as compared to the European-standard plates. This causes the de-rotation to be more effective in the American-standard plates.
Minimizing the number of candidate regions in the detection and improving the program’s structure has contributed to maintaining the execution time of the improved algorithm approximately equal to that of the old one, despite the addition of the suggested vertical-edge histogram analysis and the de-rotation, as illustrated in Table 5.
7. Conclusions
In this paper, an enhanced ALPR system is proposed, constructed, and successfully evaluated utilizing a dataset of 500 license plate images for parked vehicles as well as vehicles in movement. To identify possible margins of improvement in each of the system components, a systematic ceiling analysis is first performed. Several enhancements to the detection and segmentation components are then suggested and implemented based on the obtained results. The main enhancements are (i) vertical-edge histogram analysis, (ii) size estimation of candidate regions and (iii) de-rotation of misaligned license plate photos. When compared to an existing similar ALPR system, these additions have resulted in significant performance gains. The detection accuracy has increased from 82% to 94.4%, the segmentation accuracy has increased from 74.4% to 91.9%, and the recognition accuracy has increased from 68.5% to 91.5%. In addition, the total execution time of the developed algorithm is determined to be comparable to that of the prior system despite the inclusion of additional processing stages. This is achieved by improving the programming structure of the algorithm and reducing the number of potential regions of interest. The overall performance of the developed ALPR system, however, is still open for further developments by utilizing more advanced machine learning approaches that can learn and make intelligent decisions on their own rather than making informed decisions based on what it has learnt. The authors are currently investigating such enhancements, as well as others.
Author Contributions
Author Contributions: Conceptualization, A.A. and M.A.-Y.; Data curation, S.H.; Formal analysis, M.A.-T. and M.A.-Y.; Investigation, H.A.M.; Methodology, H.A.M. and M.A.-Y.; Resources, S.H.; Software, H.A.M.; Supervision, M.A.-T.; Validation, A.A. and M.A.-Y.; Visualization, S.H. and H.A.M.; Writing—Original draft, H.A.M. and M.A.-Y.; Writing—Review & editing, A.A. and M.A.-Y. Supervision, M.A.-Y. Writing—review & editing, A.A.A. All authors have read and agreed to the published version of the manuscript.
Funding
This research received no external funding.
Institutional Review Board Statement
Not applicable.
Informed Consent Statement
Not applicable.
Conflicts of Interest
The authors declare no conflict of interest.
References
- Tang, J.; Zeng, J.; Wang, Y.; Yuan, H.; Liu, F.; Huang, H. Traffic Flow Prediction on Urban Road Network Based on License Plate Recognition Data: Combining Attention-LSTM with Genetic Algorithm. Transp. A Transp. Sci. 2021, 17, 1–27. [Google Scholar] [CrossRef]
- Zhu, L.; Yu, F.R.; Wang, Y.; Ning, B.; Tang, T. Big Data Analytics in Intelligent Transportation Systems: A Survey. IEEE Trans. Intell. Transp. Syst. 2019, 20, 383–398. [Google Scholar] [CrossRef]
- Mustafa, H.A.; Hassanin, S.; Al-Yaman, M. Automatic Jordanian License Plate Recognition System Using Multistage Detection. In Proceedings of the 2018 15th International Multi-Conference on Systems, Signals & Devices (SSD), online, 19–22 March 2018; pp. 1228–1233. [Google Scholar]
- Shashirangana, J.; Padmasiri, H.; Meedeniya, D.; Perera, C. Automated License Plate Recognition: A Survey on Methods and Techniques. IEEE Access 2021, 9, 11203–11225. [Google Scholar] [CrossRef]
- Yousef, K.M.A.; Al-Tabanjah, M.; Hudaib, E.; Ikrai, M. SIFT based automatic number plate recognition. In Proceedings of the 2015 6th International Conference on Information and Communication Systems (ICICS), Amman, Jordan, 7–9 April 2015; IEEE: Piscataway, NJ, USA, 2015; pp. 124–129. [Google Scholar]
- Yousef, K.M.A.; Mohd, B.J.; Al-Khalaileh, Y.A.; Al-Hmeadat, A.H.; El-Ziq, B.I. Automatic License Plate Detection and Recognition for Jordanian Vehicles. Adv. Sci. Technol. Eng. Syst. J. 2020, 5, 699–709. [Google Scholar] [CrossRef]
- Ashtari, A.H.; Nordin, M.J.; Fathy, M. An Iranian License Plate Recognition System Based on Color Features. IEEE Trans. Intell. Transp. Syst. 2014, 15, 1690–1705. [Google Scholar] [CrossRef]
- Menon, A.; Omman, B. Detection and Recognition of Multiple License Plate from Still Images. In Proceedings of the 2018 International Conference on Circuits and Systems in Digital Enterprise Technology (ICCSDET), Kottayam, India, 21–22 December 2018; pp. 1–5. [Google Scholar]
- Huo, M.; Li, J. The License Plate Recognition System Based on Improved Algorithm. IOP Conf. Ser. Mater. Sci. Eng. 2017, 231, 012055. [Google Scholar] [CrossRef]
- Huang, Z.; Tseng, H.; Chen, C. Application of Extreme Learning Machine to Automatic License Plate Recognition. In Proceedings of the 2019 14th IEEE Conference on Industrial Electronics and Applications (ICIEA), Xi’an, China, 19–21 June 2019; pp. 1447–1452. [Google Scholar]
- Chowdhury, D.; Mandal, S.; Das, D.; Banerjee, S.; Shome, S.; Choudhary, D. An Adaptive Technique for Computer Vision Based Vehicles License Plate Detection System. In Proceedings of the 2019 International Conference on Opto-Electronics and Applied Optics (Optronix), Kolkata, India, 18–20 March 2019; pp. 1–6. [Google Scholar]
- Ha, P.S.; Shakeri, M. License Plate Automatic Recognition Based on Edge Detection. In Proceedings of the 2016 Artificial Intelligence and Robotics (IRANOPEN), Quazvin, Iran, 9 April 2016; pp. 170–174. [Google Scholar]
- Hurtik, P.; Vajgl, M. Automatic License Plate Recognition in Difficult Conditions—Technical Report. In Proceedings of the 2017 Joint 17th World Congress of International Fuzzy Systems Association and 9th International Conference on Soft Computing and Intelligent Systems (IFSA-SCIS), Otsu, Japan, 27–30 June 2017; pp. 1–6. [Google Scholar]
- Barnouti, N.H.; Naser, M.A.S.; Al-Dabbagh, S.S.M. Automatic Iraqi License Plate Recognition System Using Back Propagation Neural Network (BPNN). In Proceedings of the 2017 Annual Conference on New Trends in Information & Communications Technology Applications (NTICT), Baghdad, Iraq, 7–9 March 2017; pp. 105–110. [Google Scholar]
- Qadri, M.T.; Asif, M. Automatic Number Plate Recognition System for Vehicle Identification Using Optical Character Recognition, 2009. In Proceedings of the International Conference on Education Technology and Computer, online, 1–3 March 2009; pp. 335–338. [Google Scholar]
- Nigussie, S.; Assabie, Y. Automatic Recognition of Ethiopian License Plates. In Proceedings of the AFRICON 2015, Addis Ababa, Ethiopia, 14–17 September 2015; pp. 1–5. [Google Scholar]
- Peng, C.-C.; Tsai, C.-J.; Chang, T.-Y.; Yeh, J.-Y.; Dai, H.; Tsai, M.-H. A Fast and Noise Tolerable Binarization Method for Automatic License Plate Recognition in the Open Environment in Taiwan. Symmetry 2020, 12, 1374. [Google Scholar] [CrossRef]
- Zou, L.; Zhao, M.; Gao, Z.; Cao, M.; Jia, H.; Pei, M. License plate detection with shallow and deep CNNs in complex environments. Complexity 2018, 6, 1–6. [Google Scholar] [CrossRef]
- Simonyan, K.; Zisserman, A. Very deep convolutional networks for large-scale image recognition. arXiv 2014, arXiv:1409.1556. [Google Scholar]
- Alghyaline, S. Real-time Jordanian license plate recognition using deep learning. J. King Saud Univ. Comput. Inf. Sci. 2020. [Google Scholar] [CrossRef]
- Huang, Q.; Cai, Z.; Lan, T. A Single Neural Network for Mixed Style License Plate Detection and Recognition. IEEE Access 2021, 9, 21777–21785. [Google Scholar] [CrossRef]
- Li, H.; Wang, P.; Shen, C. Toward End-to-End Car License Plate Detection and Recognition with Deep Neural Networks. IEEE Trans. Intell. Transp. Syst. 2019, 20, 1126–1136. [Google Scholar] [CrossRef]
- Vehicle Registration Plates of Jordan. Vehicles of Jordan. Available online: https://en.google-info.org/19980299/1/vehicle-registration-plates-of-jordan.html (accessed on 3 May 2021).
- Zhaoxia, T.; Ting, C. Image Segmentation Algorithm Based on Improved GA and OTSU. In Proceedings of the 2011 International Conference on Electronic & Mechanical Engineering and Information Technology, Kolkata, India, 8–10 March 2011; pp. 70–72. [Google Scholar]
- Alyaman, M.; Sobuh, M.; Zaid, A.A.; Kenney, L.; Galpin, A.J.; Al-Taee, M.A. Towards automation of dynamic-gaze video analysis taking functional upper-limb tasks as a case study. Comput. Methods Programs Biomed. 2021, 203, 2888. [Google Scholar] [CrossRef] [PubMed]
- Al-Jubouri, Q.; Al-Azawi, R.J.; Al-Taee, M.; Young, I. Efficient Individual Identification of Zebrafish Using Hue/Saturation/Value Color Model. Egypt. J. Aquat. Res. 2018, 44, 271–277. [Google Scholar] [CrossRef]


Publisher’s Note: MDPI stays neutral with regard to jurisdictional claims in published maps and institutional affiliations. |
© 2021 by the authors. Licensee MDPI, Basel, Switzerland. This article is an open access article distributed under the terms and conditions of the Creative Commons Attribution (CC BY) license (https://creativecommons.org/licenses/by/4.0/).