
Analyzing Determinants for Adoption of Intelligent Personal Assistant: An Empirical Study


Department of International Business, Tamkang University, New Taipei City 251301, Taiwan
Appl. Sci. 2021, 11(22), 10618; https://doi.org/10.3390/app112210618
Submission received: 16 October 2021
/
Revised: 5 November 2021
/
Accepted: 5 November 2021
/
Published: 11 November 2021
Abstract
:With the accelerating advances in artificial intelligence (AI) technologies, the rising demand for the intelligent personal assistant is expected to rapidly increase in the following decades. As customer loyalty has become a critical element in gaining a competitive advantage and many marketers pay great attention to it, this research aims to explore the factors that directly affect customer loyalty toward the intelligent personal assistant. The main motivation is to investigate and identify the direct effects that variables such as customer innovativeness and perceived value have on customer loyalty. Additionally, both product knowledge and corporate image will be examined as moderators. The results obtained demonstrate that perceived value has a positive influence on customer loyalty. Furthermore, product knowledge moderates the influence of functional and hedonic innovativeness on customer satisfaction. The study’s main contributions provide a better understanding of customer loyalty. This research aims to be viewed as a specific guide to provide effective practices that companies should implement to help them reallocate resources appropriately and enhance customer value creation. The results indicate that the higher the level of customer perceived value, the better the customer loyalty will be. The findings represent that corporate image has a positive moderating effect on the influence of customer innovativeness on perceived value. This study draws on the outcomes of administrative suggestions and recommends a few observational strategies to improve the monetary administration in the intelligent personal assistant industry.
1. Introduction
Once, it was just in our imagination as an ideal and ambition for our future life, but, today, artificial intelligence (AI) is now part of the real world and is steadily becoming embedded in our daily life [1,2]. Sixty years since the beginning of artificial intelligence (AI) technologies, they have been shown to have great practical benefits for human beings. Artificial intelligence’s power in processing and analyzing huge amounts of data have made AI systems attractive in various fields. More concretely, artificial intelligence (AI) systems are designed to resemble the human brain, leading to the ability of deep learning. As a result, the system is capable of tasks such as self-driving, medical diagnosis, program coding, financial problems, fraud detection, market prediction, product recommendations, image classification, and language translation [3,4,5]. In recent years, with the further development of artificial intelligence, we have also witnessed and been surprised at how AI has become part of our popular culture. Especially since 1997, when International Business Machine Corporation (IBM)’s Deep Blue defeated Garry Kasparov, the world chess champion, people have gained a deeper understanding of AI [6,7,8]. Nowadays, intelligent personal assistants (IPAs) have become popular and common among premium-tier smartphones. At present, there are around 43 million devices installed with IPA from leading vendors of Chinese origin, such as Baidu and iFlytek, and this number will rise to 1.2 billion in 2021 [9,10].
Today, when people think of IPAs, it is clear how much artificial intelligence (AI) can help human beings: by navigating the fastest route based on the current traffic conditions, providing the weather forecast for the following days, suggesting songs from KKBox or Spotify, recommending a shopping list based on the purchasing history, and even the next travel destination can be suggested [11,12]. All of these can be achieved by the powerful artificial intelligence (AI) system through the user experience of intelligent personal assistants (IPAs) around us: conversational, personalized, and contextual. Thanks to the technologies operated in the intelligent personal assistants (IPAs), such as natural language processing, search engines, classification, and machine learning, customer queries can be answered more accurately and efficiently anytime and anywhere via a connection with the Internet. However, it has taken a long time for people to apply the latest technology to build the tools for decision-making before using the intelligent personal assistants (IPAs) [13]. The competition in this industry will be more intense and varied. Therefore, the main motivation of this research is to investigate and identify the direct effects that variables such as customer innovativeness and perceived value have on customer loyalty. It proposes a new understanding of how customer innovativeness can generate the perceived value that generates satisfaction and additionally forms loyalty. This research aims to provide detailed strategic suggestions and identifies the key drivers of customer loyalty. Additionally, both product knowledge and corporate image will be examined as moderators [14].
From the innovation perspective, Rogers [15] proposed the “diffusion of innovations” theory and discussed the adopters of the new products or ideas, which appeared to have a normal distribution. Due to the dynamic and fast-developing situation, customer innovativeness can be used to represent individuals’ tendency to adopt the new innovations [16]. Moreover, it can be used to predict the customers’ future purchasing behaviors and can be treated as the interaction between the product and customer. In addition, Hauser, Tellis, and Griffin [17] claimed that customer innovativeness is one of the primary drivers for the adoption and diffusion of new products. Thus, it is useful to discover the relationships among customer innovativeness, perceived value, customer satisfaction, and loyalty toward IPAs [18]. According to Woodruff [19], customer value is one of the most important competitive advantages for companies in addition to focusing on quality. It is necessary to consider customers from various regions of the world as a vital indicator in this research given that their different product knowledge, customer innovativeness, corporate image, and perceived value might influence customer satisfaction and customer loyalty [20].
The objectives of this research are to identify: whether customer innovativeness and perceived value have a significant influence on customer loyalty, and whether either product knowledge or corporate image have a significant moderating effect on the relationship between the influence among customer innovativeness, perceived value, and customer loyalty. Furthermore, customer loyalty should be considered in relation to the artificial intelligent assistant by measuring the positive effects about the customer innovativeness, and perceived value. The next step is to collect, synthesize, and analyze the related literature and resources in order to establish the research framework. Thus, it is essential to design the items and measuring components in the questionnaire based on the discussion of the literature. Furthermore, the extracted data from the effective questionnaire will be synthesized and analyzed to test the hypotheses of this research, which are formulated in the following section.
2. What Is Artificial Intelligence (AI)?
Artificial intelligence (AI) is undoubtedly one of the most epoch-making innovations in contemporary history; it has probably contributed more than expected and accelerated the development of other industries and fields [6,7,21]. Artificial intelligence (AI) is intelligence that is performed by machines or software by thinking and behaving intelligently like humans [3,4,22]. Furthermore, when distinguishing between “humanity” and “rationality”, artificial intelligence is differentiated into human performance and idea performance [1,23].
Although the ways of classifying artificial intelligence (AI) have become various during the current situation, the most common distinction is between weak artificial intelligence and strong artificial intelligence [24]. Weak artificial intelligence (AI) is also termed narrow artificial intelligence, focusing on narrow tasks through technologies, such as machine learning, pattern recognition, natural language processing, and autonomous actions [22,25]. This kind of artificial intelligence simulates human cognition and consciousness by transferring big data into useful information through detecting patterns and making predictions in the specific field. However, many researchers doubt whether strong AI really exists. Moreover, some opinions suggest that strong artificial intelligence will eventually overtake human capacity and intelligence [26]. Humans are limited by slow biological evolution and thus will be unable to compete with artificial intelligence (AI) but will be replaced by it. As intelligence remains as a complex phenomenon in various aspects, artificial intelligence has deeply influenced the fields of economics, neuroscience, biology, psychology, and linguistics. Without doubt, AI has made continuous progress and strives to push forward the frontier of machine learning, which is bringing new technologies to lead society into the future [27,28].
Intelligent Personal Assistant
Generally, the intelligent personal assistant is considered to be a software agent that provides services and solutions for individuals. As the derived concept of software agent includes the intelligent agent, natural language processing and machine learning are applied in the intelligent personal assistant [9,28]. According to Hauswald et al. [29], the users input the contextual information, voices, and images as the specific conditions to raise the requests; this enables the IPAs to give answers in natural language, making recommendations and performing actions [30]. The intelligent personal assistants are designed to be personalized applications that gather the preferences and fulfill the responsibilities specified by users via the online resources [10,11].
The interaction between humans and agents commonly takes place through two methods: text and voice. What are the functionalities or the responsibilities fulfilled by intelligent personal assistants? The device-dialog means accessing a device’s functions through human voice commands using dialog-style interaction [14,31]. Web search is the last measure to respond to users’ requests if the IPA cannot understand the queries effectively. In the case of chat, the intelligent personal assistants are designed and programmed to make conversation with users, including talking for fun and informal content. In addition, the reminder is one of the main functions, which consists of setting alarms, checking calendars, and to-do lists [32]. Device control aims to launch downloaded applications, manage entertainment through streaming services, and do online shopping through specific platforms, such as eBay, Taobao, and Amazon. Communication with others is the function for making phone calls, sending individual texts, and delivering emails. Other requests cover taking notes, setting notifications, and controlling smart-home devices [13,33].
3. Literature Review and Hypothesis Development
3.1. Customer Innovativeness
Studying customers provides a deeper understanding of the diffusion of innovation, and it is essential to find the early innovative customers through whom companies can improve the marketing of their new products and reduce the risk of new product failure [16]. The concept of customer innovativeness is defined by the degree to which individuals are more eager and quicker in adopting the new ideas or products than others in their social community and circumstances [34]. Obviously, this definition is mainly discussed based on personal behaviors. Midgley and Dowling [35] defined customer innovativeness as the degree to which individuals are receptive and open-minded to new ideas and make the innovation decisions independently of the communicated experiences of others. According to the concept proposed by Venkatesan [36], customer innovativeness is the reflection of the relationship between the need for stimulation and innovative behaviors [37,38]. The research by Im, Bayus, and Mason [39] proposed that the concept of customer innovativeness should be broader to cover innate innovativeness and innovative customer behaviors. On the other hand, Ebbing and Lüthje [40] conceptualized customer innovativeness as the tendency to obtain new innovations in a specific category and earlier than other customers as new products appear in the market [41].
The functional type identified by Hirschman [42] and Montani etal. [43] implies the attraction of the utilitarian functions of new products. Customers who have functional innovativeness are more willing to take advantage of the purchased new products to improve the performance of their work and increase their accomplishment. Moreover, these customers like to avoid the threatening circumstances around them, which relates to the utilitarian aspect mentioned by Voss, Spangenberg, and Grohmann [44]. The second motivation is the hedonic, which refers to an exciting experience and the feeling of satisfaction after using the innovative products [45]. According to the research from Tuan [46], this innovativeness motivation would drive customers to adopt the new products because of the product attributes, such as newness and uniqueness. The last motivation is cognitive innovativeness. According to Villani et al. [47], cognitive innovativeness is more related to the epistemic value, which involves the desire for new experiences, mental stimulation, and intellectual skills. This was supported by Ebbing and Lüthje [40] through measuring and distinguishing different customer innovativeness: customers with higher cognitive motivation focus more on exploring knowledge, analytical thinking, and the ability to solve problems. Thus, the definition of customer innovativeness in this research is the tendency of customers with a higher motivation for innovativeness to purchase the latest products in the market earlier than others. Based on the previous discussion, customers’ innovativeness in the artificial intelligent assistant industry can be measured by their functional innovativeness, hedonic motivation, and cognitive motivation [48].
3.2. Perceived Value
The concept of perceived value was initially proposed by Dodds and Monroe in 1985 [49] using a relationship model of price, quality, and perceived value [50]. Dodds and Monroe [49] proposed the definition of perceived value as the cognitive trade-off between the perceived quality or benefits and the sacrifice in payment. Similarly, Day [51] defined it as the surplus or difference between the perceived benefits and perceived costs. On the other hand, Gale [52] argued that the value is the adjusted perceived quality based on the changes in product price. Woodruff [19] suggested that perceived value is the perceived preference of customers, which focuses on the evaluation of the product attributes and performances in order to improve and help customers fulfill their goals and purposes [53,54].
According to the definition by Zeithaml [55], perceived value is the overall evaluation of utility based on the comparison between the benefits received and the sacrifices made. When discussing the concept of perceived value, multidimensional approaches are commonly used to measure it. Sheth, Newman, and Gross [56] identified five dimensions of perceived value (social, emotional, functional, epistemic, and conditional) to explain why customers purchase a specific brand rather than others and to illustrate consumer choices of whether or not to buy. Consumption values also make different contributions to the customer behaviors. Functional value represents the perceived utility and performance of the provided product or service, formed through its functional, utilitarian, or physical attributes [12]. Social value is defined as the acceptability at the specific level where there is consistency among the perceived product or service, individual social status, and the social environment. Customers acquire social value through the connection with several related factors, such as demographic, social, economic, and cultural-ethnic groups. Emotional value includes the feelings and affections originating from the experience of consumption, especially when products are associated with or participating in those emotional responses. Epistemic value is based on a product or service that arouses freshness and curiosity; it also involves the customer’s satisfaction with their desire for knowledge [57,58,59,60]. Conditional value is related to the existing or conjectural situation or the specific circumstances in the presence of social issues, product functionality, or social contingencies. Therefore, perceived value in this research should be defined as the overall evaluation of the comparison between the multiple perceived benefits and the sacrifices made for these benefits [61,62,63]. The measurement of perceived value can be based on the perceived preference and general usage conditions of customers, especially by focusing on the dimensions of functional value, social value, and epistemic value in the artificial intelligent assistant industry [64,65,66,67,68].
3.3. Customer Loyalty
The concept of customer loyalty has been discussed for a long time in the field of business, and different researchers provide diverse definitions and operationalization for the concept [69,70,71,72]. In the early stage, customer loyalty was studied mainly based on either the behavioral or attitudinal approach [73,74,75,76,77,78]. According to Gao and Huang [79], customer loyalty is the behavioral model whereby customers insist on purchasing the same brand/service for a period of time. Thus, loyalty can be considered as a commitment by customers who focus on a particular brand, product, or service even though other alternatives can be chosen. As product knowledge is the information used in the cognitive process that occurs after being exposed to a stimulus or before the obvious behaviors resulting from the stimulus, it can be measured using the dimensions of subjective knowledge and objective knowledge for the usage experience, with familiarity and expertise representing subjective and objective knowledge, respectively. Neal [77] defined customer loyalty from the behavioral viewpoint. Compared to the total amount of purchases in a specific category, customer loyalty is their repeated patronage behavior in terms of the proportion of times customers decide to purchase the same product or service in that category [20,78]. From the attitudinal perspective, Gao and Huang [79] defined customer loyalty as “the strength of the relationship between an individual’s relative attitude and repeat patronage” and developed a framework for customer loyalty that combines both attitudinal and behavioral dimensions. However, in each perspective, the problem arises that the repeated patronage behaviors may not indicate customers’ purchasing intention and that intention may not cause the purchasing decisions [72,73,74]. This shortcoming has led to further discussion on the aspects of both approaches, which exist simultaneously. Moreover, customers with high loyalty are less motivated to look for alternatives and insist on the current brand; in addition, they are more willing to communicate with other customers via positive word-of-mouth [75,76]. There are four parts of the framework: true loyalty, latent loyalty, spurious loyalty, and no loyalty. True loyalty occurs when the high repeat purchase and alternative attitude coexist at the same time; this is based not only on the high level of repeated patronage behaviors but also on the relative attitudes toward the evaluation of the product or service [78,79,80]. Latent loyalty is the result of low repeat purchase and high relative attitude. As there is a strong relative attitude toward the brand but the repeat purchasing is not significantly exhibited, therefore, the situational and environmental variables affect the purchase decisions more than the attitudinal. Spurious loyalty exists where there is low alternative attitude with high repeat purchase [80]. In this category, the customers are not able to identify the differences among the brands, or their purchasing behaviors depend on their habits or past purchasing experience. No loyalty occurs when customers consider that there are few differences among the alternative competitors and have low repeat purchase as well. Some researchers suggest that companies should try to avoid targeting this segment as they will never become loyal customers. Gao and Huang [79] proposed a four-stage loyalty model, presenting the different aspects of customer loyalty that are consecutive and progressive rather than simultaneous. As this model is established based on the cognition–affect–conation pattern, the first stage is cognitive loyalty. Customers are loyal to the brand mainly based on the relative information for the offerings. This is the weakest type of loyalty as the customers might easily switch if the alternative perceived performance or the cost-benefit ratio is superior to the current one. The second stage is affective loyalty, which refers to the positive and admiring attitude toward a specific product or service and connects with the evaluation and feelings from the cognitive stage. The third stage is conative loyalty, which implies attitudinal loyalty: the customers are more likely to have the desire and intention to repurchase the specific brand. The last stage is action loyalty as the customers will transform the intentions into real actions. Though this kind of loyalty is ideal, the customers will experience action inertia, and they are willing to overcome obstacles to re-patronize the preferred product or service.
The definition of customer loyalty as the combination of the behavioral and attitudinal dimensions is also supported by other research [80,81,82]. Considering the above opinions and discussion, Gronholdt et al. [83] proposed four measurement dimensions, which are the intention to patronize the product or service, intention to purchase additional postal services, intention to recommend, and price tolerance. In addition, Butcher, Sparks, and O’Callaghan [84] identified four dimensions to measure customer loyalty as follows: advocacy and positive words about the preferred service provider, tendency to resist the offerings from competitors, identification with the service provider, and the relative preference towards the specific service provider [18]. In the research by Fraering and Minor [85], the measurement dimensions include satisfaction, cognitive, affective, conative, and action loyalty. On the other hand, Shi, Prentice, and He [86] noted that customer loyalty should be measured through repurchase intention, recommendation intention, positive word-of-mouth, and the preference for a specific brand.
Therefore, the concept of customer loyalty in this study is defined as the customer’s preference for and insistence on the specific product, including the combination of behavioral and attitudinal aspects, such as the psychological attachment to the particular service provider [87]. Furthermore, customer loyalty should be considered in relation to the artificial intelligent assistant by measuring the positive words about the preferred brand, repatronization intentions, fondness and favorable attitude, and the intention of cross-buying. According to the research by Kressmann et al. [88], self-congruence has a decisive role that leads customers to be loyal to the specific products that are congruent with their actual or ideal self-concept. Thus, it is reasonable to assume that customer innovativeness has a positive influence on loyalty, which will be tested in this study. Customer satisfaction and loyalty are distinctly connected, as shown by previous research. Satisfied customers are expected to practice the behaviors that match the measurement dimensions of loyalty. Hallowell [73] concluded that the higher the customer satisfaction, the higher the customer loyalty. As confirmed by Anderson and Sullivan [89], a high level of satisfaction not only decreases the possibility of switching behaviors but also increases the repatronizing intentions. In the research by Eggert and Ulaga [90], customer satisfaction was found to be the predictor of customer loyalty through conative post-purchasing behaviors, such as repurchasing intention and word-of-mouth, in the field of the German CD-ROM industry. Since the relationship between satisfaction and loyalty is validated in numerous studies and customer satisfaction index models, satisfaction leading to loyalty will be examined through both direct and indirect channels in this research [91].
Customer perceived value appears to be directly related to the customer behavior intentions. Ryu et al. [92] concluded that both the functional and hedonic value reflect the purchasing behaviors in the fast casual restaurant industry. In the research by Floh et al. [93], perceived value is evaluated by four dimensions: functional, economical, emotional, and social. Neal [77] concluded that customer innovativeness in this research is the tendency of customers with a higher motivation for innovativeness to purchase the latest products in the market earlier than others. Based on the previous discussion, customers’ innovativeness in the artificial intelligent assistant industry can be measured by their functional innovativeness, hedonic motivation, and cognitive motivation. Balci [78] noted that the first motivation is the functional innovativeness, which implies the attraction of the utilitarian functions of new products. The second motivation is the hedonic, which refers to an exciting experience and the feeling of satisfaction after using the innovative products. In order to create a unique social impression and express their superior differentiation, the adoption of innovative products is driven by this innovativeness motivation. The last motivation is cognitive innovativeness. Gronholdt et al. [83] proposed functional value represents the perceived utility and performance of the provided product or service, formed through its functional, utilitarian, or physical attributes, as indicated by Yang et al. [75]. Perceived value in this research should be defined as the overall evaluation of the comparison between the multiple perceived benefits and the sacrifices made for these benefits [76,77,78,79]. In the research by Li et al. [91], the measurement of perceived value can be based on the perceived preference and general usage conditions of customers, especially by focusing on the dimensions of functional value, social value, and epistemic value in the artificial intelligent assistant industry. Social value is derived from the ability to increase the social and symbolic self-concept. The last dimension is the perspective of reputation, which means the perceived status of the product or service based on the image of the company being respectful or reputable. In a study of two different services industries, wireless telecommunication and financial services, the perceived value was positively related to the customer loyalty in both fields. This assumption was adopted in the research by Kandampully et al. [94], where the customer perceived value was a potential determinant of the customer loyalty for Generation-Y members. Thus, the epistemic value will be considered as one of the factors that drives loyalty in this research. The hypotheses for the relationships among customer innovativeness, perceived value, customer satisfaction, and customer loyalty are presented below:
Hypothesis 1 (H1).
Customer innovativeness has a positive influence on customer loyalty.
Hypothesis 1a (H1a).
Customer functional innovativeness has a positive influence on customer loyalty.
Hypothesis 1b (H1b).
Customer hedonic innovativeness has a positive influence on customer loyalty.
Hypothesis 1c (H1c).
Customer cognitive innovativeness has a positive influence on customer loyalty.
Hypothesis 2 (H2).
Perceived value has a positive influence on customer loyalty.
Hypothesis 2a (H2a).
Perceived functional value has a positive influence on customer loyalty.
Hypothesis 2b (H2b).
Perceived social value has a positive influence on customer loyalty.
Hypothesis 2c (H2c).
Perceived epistemic value has a positive influence on customer loyalty.
3.4. Product Knowledge
In the early stage, the definition by Marks and Olson [95] applied the perspective of cognitive structure. Hwang et al. [96] noted that product knowledge means information in the cognitive process that occurs after the reaction to the stimulus or before the obvious behaviors performed because of the stimulus [97]. Lin and Zhen [98] found that the customer consciousness of products has a significant influence on the product knowledge, which implies that customers are not only equipped with basic product awareness but also have strong confidence in their knowledge and understanding of the products. According to Rezvani et al. [99], product knowledge comprises the general information the customers have gained about the functional characteristics of products and brands. Hwang et al. [96] categorized the measures of customer product knowledge into three dimensions: subjective knowledge, objective knowledge, and usage experience. Subjective knowledge concerns the perception of the information, how much the customers know about the products, and their self-belief about their own knowledge [100,101]. Objective knowledge focuses on the related information that is stored in customers’ memory. The usage experience is established through the inconsistencies between the information-processing approaches of both subjective and objective knowledge. The usage experiences would affect the knowledge in memory and cause the differences in behaviors; they can also be used as the indicators of objective knowledge [102].
Alba and Hutchinson [103] proposed two major components of measuring product knowledge: familiarity, and expertise. Familiarity means customers’ accumulation and gathering of product-related experiences. Product-related experience is the most inclusive level, including the customers’ exposure to advertising, the action of searching information, initiating communications with related persons, the process of making rules and decisions, purchasing, and the general product usage in various situations. The customers are required to be able to analyze and elaborate on the information. On the other hand, expertise represents the specific understanding of the products and the ability to perform the product-related tasks successfully in a broad sense with more than one type of knowledge. It is considered from two aspects: cognitive structure and cognitive processes [104]. Cognitive structure refers to the customers’ beliefs from emphasizing the product attributes and functions, which can be used to differentiate the various products. Cognitive processes are more concerned with behaviors, such as acting on the decisions and beliefs. Sometimes, simple repetition is useful to reduce the cognitive effort and leads to the automatic relevant performance without conscious control. Subsequently, Alba and Hutchinson [105] added the concept of knowledge calibration to the previous study. Customers sometimes are too confident in misidentifying that they have gained more knowledge about the products than they have in actuality. Thus, the calibration of customer knowledge forms a connection between subjective knowledge and objective knowledge based on the authenticity and validity of the information used in decision-making [106]. The subjective aspect refers to familiarity and experience, while the objective concerns expertise and related ability.
Product knowledge in this research is defined as the combination of objective and subjective knowledge, which is based on the level of familiarity and expertise, in order to gain a deeper understanding and confidence in product evaluation and purchasing. In the artificial intelligent assistant industry, product knowledge should be measured through aspects of familiarity, which can be seen as the subjective knowledge, and with objective knowledge as the expertise regarding the AI assistants. Hauser and Lund [107] found that, for remanufactured products, customers with more product knowledge learned more easily about the quality and features of products. Wang and Hazen [108,109] suggested that product knowledge positively affects perceived value.
Customer satisfaction is the overall evaluation of the perceived performance of a product or service compared with what was expected. Bian and Moutinho [110] supported that customers with more product knowledge make a deeper evaluation of the comparative alternatives and are less likely to have evaluation bias. Thus, customers with a higher level of knowledge are expected to be confident about their familiarity and expertise on the products, which leads to a lower preference for the specific products and selecting the desired products using their own knowledge. Moreover, the repurchasing intention will decrease, which exhibits a falling level of loyalty [69]. Based on the previous discussion on the relationships among customer innovativeness, perceived value, customer satisfaction, and customer loyalty, product knowledge will be considered as the moderating variable in this research. Thus, the related hypothesis is as follows:
Hypothesis 3 (H3).
Product knowledge has a negative moderating causal effect on the influence of customer innovativeness on customer loyalty.
3.5. Corporate Image
The definitions of corporate image are various, and, at present, there is no universally agreed-upon definition. Dowling [111] suggested that the corporate image is the total impression in the minds of customers that is connected with the personality or features of the corporation. The corporate image can be considered as the public’s overall impression of a company [112], which has the function of improving the consumers’ purchasing intention and improving the consumption experience gradually [113]. According to Ind [114], when consumers purchase either products or services, they also receive the values of the company, and the corporate image is the sum of all the values representing the company. In other words, corporate image can be considered as a type of brand image in which the brand name represents the entire activities of the company rather than the sole products and services provided [115,116].
Barich and Kotler [112] indicated that the corporate image depends on both particular offerings and particular individuals. For example, artificial intelligent assistant companies’ image will vary because of the offerings’ functions, ease of use, and user-friendliness. Sometimes, consumers are not able to gather enough information and knowledge about the company; however, they can access the company through different resources, such as advertising and word-of-mouth, which will influence the process of creating the corporate image [117,118,119,120,121,122,123,124]. There might also be negative effects on the corporate image due to incomplete or inaccurate information. Though the corporate image is generated by subjective judgment and perception, it is difficult to reach a conclusion on its definition [118].
Therefore, when considering the artificial intelligent assistant industry, corporate image is a subjective impression and provides a clear and accurate understanding of the company based on the perceived performance. When consumers receive impressive services from a company, the corporate image will be formed in their minds as a result of the evaluation process, which includes consumption experiences, feelings, and emotions. Through the subjective opinions and feelings of customers, the corporate image will be transformed into a long-term image of the company, and the customers will generate different attitudes and impressions toward the image according to their various emotions. In this research, corporate image will be measured by the dimensions from the overall corporate image: the perspectives of enterprise, competence, and agreeableness.
Fredericks and Salter [125] proposed that the corporate image is an important element in the value equation: the image can support or undermine the perceived value of customers and further affects their loyalty. As the influence of image requires a comprehensive validation using different dimensions, perceived value in this research will be tested through the aspects of functional, social, and epistemic. According to Kandampully and Hu [123], the corporate image functions as a filtering mechanism that determines the evaluation of a product or service, as well as the intention to maintain the overall satisfaction and loyalty to the company. Supported by the previously mentioned studies on the relationships among customer innovativeness, perceived value, customer satisfaction, and customer loyalty, corporate image will be considered as a moderating variable; the related hypothesis is proposed below:
Hypothesis 4 (H4).
Corporate image has a positive moderating causal effect on the influence of perceived value on customer loyalty.
4. Research Methodology
In this research, the problems are discussed in terms of various dimensions. First, the relationships among customer innovativeness, perceived value, customer satisfaction, and customer loyalty are examined. Moreover, product knowledge and corporate image are considered as the moderating variables to identify the influences in the early testing. Based on the research purpose and literature review, the research framework is shown as Figure 1.
The research purpose requires that the respondents are either using, have used, or have heard of the intelligent virtual assistant. In order to measure each variable effectively in this research, the operational definitions are formulated and shown below in Table 1.
The questionnaire begins with a brief introduction explaining the research purpose and the artificial intelligent assistant. The questionnaire consists of three parts: (1) the general usage condition of the respondents, including a range of options regarding the related devices and the functions provided by the artificial intelligent assistants; (2) the main survey part is provided, with items measuring the variables of perceived value, customer innovativeness, customer satisfaction, customer loyalty, product knowledge, and corporate image; (3) the demographic questions: age, gender, education, employment, monthly income, and current residential area. In addition, the measuring items have been adapted and summarized based on the previous literature and theories (as Appendix A).
The questionnaire was distributed by two methods: Internet-based and paper based. The Internet-based questionnaire was distributed through online social networks, such as Facebook, Forum, and Reddit. After 335 questionnaires were distributed, 304 were returned with valid responses. On the other hand, the paper-based questionnaires were distributed mostly in universities. In total, 341 questionnaires were delivered and 212 were correctly returned. Overall, 676 questionnaires were distributed and 516 were returned with valid responses, indicating an effective recovery ratio of 76%.
The moderation analysis consists of three testing steps. In the first step, regression analysis between the independent and dependent variables is conducted. In the second step, the regression analysis tests the relationship between the moderating and dependent variables. The last step is to compute the interaction term of the independent and moderating variables in the initial stage, which is followed by the regression analysis of the interaction term with the dependent variable. If the coefficient of the interaction term in the third model is significant, there is a moderating effect; otherwise, there is no moderating effect (as Figure 2).
5. Empirical Research
With the purpose of discussing the research problems and testing the hypotheses proposed, SPSS 22.0 was applied to analyze the data collected through the questionnaire. The process of the empirical research consists of nine sections. Section 1 provides descriptive statistics analysis based on the individuals’ usage conditions of the intelligent personal assistant. Section 2 presents the reliability analysis using the Cronbach’s alpha method. Then, in Section 3, the exploratory factor analysis is performed, which will enable the factor analysis in Section 4. In Section 5, Pearson’s correlation coefficient is applied to measure the linear correlation among the variables. In Section 5, regression and hierarchical regression analysis are used to analyze the variables and estimate their relationships, too. Typically, the purpose is to understand how the values of the dependent variables change with variations in the independent variables. Below is a summary of the demographic statistic results of the questionnaire:
- Gender: 215 male respondents (41.7%) and 301 female respondents (58.3%).
- Age: 307 respondents aged 21–29 years forms the largest percentage (59.5%), followed by 20 years old and below (90 respondents, 17.4%). There are 77 respondents aged 30–39 (14.9%).
- Education: 332 respondents have a bachelor-level education (64.3%), while 94 respondents have a master’s degree (18.2%).
- Occupation: There are 259 students (50.2%), and 84 respondents have business-related jobs (16.3%).
- Monthly Income: 220 respondents earn 331 USD or less (42.7%), and 105 respondents have 663–1325 USD monthly income (20.4%). Furthermore, 18.1% of respondents earn 332–662 USD per month.
There now follows the descriptive statistics analysis of the usage condition of the intelligent personal assistant according to the 516 effective responses. Based on the answer to Question 1, if the respondents had used the AI assistant before, they would continue with the questions in order. On the other hand, if they had never used an AI assistant, they would directly skip to Question 5, about which AI they had heard of. The last part in this section concerns the descriptive analysis of the variables of this research. From the 516 effective questionnaires, the average number is considered as the estimation, calculated for the observed value of 46 items in total. After synthesizing the data, the range of standard deviation is around one, and there are no extreme values, which means the data are reasonably unbiased. Consequently, these items are suitable for the further analysis.
5.1. Reliability Analysis
The reliability results are summarized in Table 2. The Cronbach’s alpha of each dimension is higher than 0.70, which indicates that there is high internal consistency in this research and the scale items in each dimension should be retained.
5.2. Exploratory Factor Analysis
The data for the exploratory factor analysis are presented in Table 3. In the Kaiser–Meyer–Olkin (KMO) test for sampling adequacy, the value of each dimension is greater than 0.6, which is adequate. As the p-value from Bartlett’s test of sphericity in each dimension is less than 0.001, the data have an acceptable significance level. Therefore, there is strong validity and correlation among the dimensions, which are all suitable for factor analysis.
5.3. Correlation Analysis
We can see a positive correlation among the components of perceived value, which are functional value, social value, and epistemic value. The data for the exploratory factor analysis are presented in Table 4. In addition, they have a positive correlation with customer satisfaction and customer loyalty. Therefore, there is a positive correlation among perceived value, customer satisfaction, and customer loyalty. The same situation is presented for customer innovativeness, with a positive correlation among its components: functional innovativeness, hedonic innovativeness, and cognitive innovativeness. These components also have a positive correlation with customer satisfaction and customer loyalty. Therefore, there is a positive correlation among customer innovativeness, customer satisfaction, and customer loyalty. In addition, the components of both perceived value and customer innovativeness have a positive correlation with corporate image and product knowledge, as do customer satisfaction and customer loyalty. Hence, there are positive correlations among the moderators (corporate image, product knowledge) and the independent and dependent variables (perceived value, customer innovativeness, and customer loyalty).
5.4. Regression Analysis
A regression analysis is used to analyze the variables and estimate their relationships. Typically, the purpose is to understand how the values of the dependent variables change with variations in the independent variables.
The independent variables of Model I are customer innovativeness and perceived value; the dependent variable is customer loyalty. The results of the multi-regression are shown below. As the adjusted R-squared is 0.628, the independent variable is able to explain 62.8% of the variation of the dependent variable, customer loyalty. Moreover, the F-value is 125.247 with significance, which represents that this model has high explanatory power, and, with a VIF of less than 10, there is no multi-collinearity. From the β-value of functional innovativeness (0.173) and the t-value (5.028, with a high level of significance), functional innovativeness has a strongly positive influence on customer loyalty. Based on the β-value of hedonic innovativeness (0.096) and the t-value (2.84, with moderate significance), there is a moderately positive influence of hedonic innovativeness on customer loyalty. From the β-value of cognitive innovativeness (–0.004) and the t-value (–0.109, with no significance), cognitive innovativeness has a non-significant negative influence on customer loyalty. According to the β-value of functional value (0.133) and the t-value (4.011, with high significance), there is a strongly positive influence of functional value on customer loyalty. The β-value of social value (0.153) and the t-value (4.544, with high significance) indicate a strongly positive influence of social value on customer loyalty. From the β-value of epistemic value (0.067) and the t-value (2.025, with low significance), there is a weakly positive influence of epistemic value on customer loyalty (see Table 5).
In Table 6, there are the results of the analysis for H3: product knowledge has a negative moderating effect on the influence of customer innovativeness on customer loyalty. Firstly, the β-value of customer innovativeness is 0.507 and t-value is 13.344 with a high level of significance, which means there is a significant influence of customer innovativeness on perceived value. Then, the moderator, product knowledge, is added into the model. The β-values of both customer innovativeness and product knowledge are positive with a high level of significance.
The interaction term of customer innovativeness and product knowledge is added into the model. The β-values of customer innovativeness and product knowledge are still positive with significance. What is more, the β-value of the interaction term is −0.003 and t-value is −0.087 with no significance. Thus, H3 is invalid in that product knowledge has no negative moderating effect on the influence of customer innovativeness on customer loyalty.
In Model III, in Table 7, there are the results of the analysis for H4: corporate image has a positive moderating effect on the influence of perceived value on customer loyalty. Firstly, the β-value of perceived value is 0.656 and t-value is 19.715 with a high level of significance, which means there is a significant influence of perceived value on loyalty. Then, the moderator, corporate image, is added into the model. The β-values of both perceived value and corporate image are positive with a high level of significance. The interaction term of perceived value and corporate image is added into the model. The β-values of perceived value and corporate image are still positive with significance. What is more, the β-value of the interaction term is 0.006 and t-value is 0.191 with no significance. Thus, H6 is not valid in that corporate image has no positive moderating effect on the influence of perceived value on customer loyalty.
5.5. Discussion
As the intelligent personal assistant sector is the specific industry studied in this research, the main purpose is to identify and test several variables that may affect customer loyalty toward IPAs. From the previous data analysis and hypothesis testing, the findings are revealed. As customer innovativeness is composed of three dimensions, which are functional, hedonic, and cognitive innovativeness, each of them is highlighted as one of the important factors that influence perceived value. As a result, it is found that the higher the level of customer innovativeness, the better the perceived value that customers will obtain. The findings represent that customers with either functional or hedonic innovativeness are more likely to become loyal ones. Moreover, two moderators are applied in this research: product knowledge and corporate image. Product knowledge has a positive moderating effect on the influence of customer innovativeness on perceived value. Moreover, it has a positive moderating effect on the influences of both cognitive innovativeness and functional innovativeness on customer satisfaction. Corporate image is also tested as a moderator; this has a positive moderating effect on the influence of customer innovativeness on perceived value.
6. Conclusions and Implications
As intelligent personal assistants are becoming popular and the market will be fiercely competitive, the global market provides great potential benefits for all developers. The main purpose of this research is to identify the direct effects that variables such as customer innovativeness and perceived value have on customer loyalty. This research provides detailed strategic suggestions and identifies the key drivers of customer loyalty. In conclusion, this study can be considered as a useful resource for existing marketers to strengthen their market position and make strategic decisions in the global intelligent personal assistant industry.
In this study, the results of statistical analysis are revealed. We attempt to discuss consumers’ perceptions of various variables and the path to obtain customer loyalty, supported by empirical results in the field of the intelligent personal assistant.
In the context of the influence of customer innovativeness on perceived value, Hong et al. [126] proposed a strong and positive relationship among the innovativeness motivation, functional value, social value, and epistemic value. In this regard, the significant impact of customer innovativeness on all three dimensions of perceived value indicates that customers with higher innovative motivation can obtain greater perceived value.
Previous research by Midgley and Dowling [35] found that customer innovativeness, or their motivations for innovation, has the opposite effect on loyalty and makes customers become switchers more frequently. However, the results of this research accord with those of Cowart et al. [127] and Kressmann et al. [88], who found that the innovativeness motivation partially affects the loyalty toward intelligent personal assistants. Regarding functional innovativeness and hedonic innovativeness, the more the customers are motivated by either of these two types, the more loyal they will be. However, for another dimension of innovativeness, it seems that cognitive innovativeness is not positively correlated with loyalty. The findings of this research confirm that customer satisfaction has a positive influence on customer loyalty, which confirms the results of Gronholdt et al. [83] and Cassel and Eklöf [128]. Additionally, the influence of perceived value on customer loyalty is tested using three dimensions: functional, social, and epistemic value. As the three relevant hypotheses are significantly validated, this supports the statement that the more perceived values are gained by customers, the more loyal they will be; this corresponds to the empirical research results from Ryu et al. [92] and Floh et al. [93].
The empirical testing of the moderation hypothesis was conducted in this research using two moderators: product knowledge and corporate image. The findings reveal that product knowledge positively moderates the relationship between innovativeness and perceived value, which indicates that a higher level of product knowledge will give customer innovativeness a greater influence on perceived value. Similarly, both functional and cognitive innovativeness have more positive effects on satisfaction when product knowledge acts as the enhancing moderator. However, the moderating effect of product knowledge is not significant for hedonic innovativeness and satisfaction; this is also the case for the influence of innovativeness motivation on customer loyalty. Additionally, corporate image is used as another moderator in this research, which is tested in three hypotheses. When customer innovativeness positively affects the perceived value, the higher level of corporate image generated by customers is able to greatly enhance this effect. However, when corporate image is measured in the other two hypotheses, it does not significantly moderate the influence of perceived value on either satisfaction or loyalty.
First, it is suggested that marketers should realize the impact of functional, hedonic, and cognitive innovativeness on innovation adoption. This also implies that marketers need to appropriately manage the marketing mix so that customers with different innovativeness traits are targeted. For example, if customers with functional innovativeness are the target groups, the introduction of the IPA should focus on how it could make life easier and assist the daily work in different industrial backgrounds. Moreover, the promotional information needs to emphasize advancement and improvement compared to other similar products. However, this may not greatly affect customers with hedonic or cognitive innovativeness. From the perspective of hedonic innovativeness, the promotional content should address the attributes of the intelligent personal assistant, such as customers being able to gain pleasure and enjoyment, especially emphasizing how it makes life more exciting and stimulating. Moreover, it is more appealing to customers with cognitive innovativeness if the promotional information contains logical, objective, and verifiable descriptions. These customers are more concerned about whether the IPA usage can challenge their intellectual skills and satisfy their analytical thinking. Therefore, for the marketers of intelligent personal assistants, the integration of these three kinds of customer innovativeness can create a more positive perception of product value.
Another finding reveals that the three dimensions of perceived value have a positive influence in the intelligent personal assistant market: these are functional, social, and epistemic value. Functional value is the evaluation of the user experience based on the ease of use and economic factors, whereas social value concerns the publicity and trends among society. The customers with social value are aware of their own social approval and impression. The perspective of epistemic value represents arousing the feelings of curiosity and forming an authentic experience after using the IPA. The managerial implication is that marketers should adopt a promotional strategy on social media, and deeply impressive advertising to stimulate social discussion, in order to make a specific impression on others. From another point of view, the users’ experience of perceived value can be enhanced through experiential trials. For the marketers of IPAs, this method is effective and has several advantages, especially when the quality of the product or service is positively guaranteed. Initially, this creates the deep impression that the marketers can be trusted and enables the users to compare the current product with alternative ones.
Supported by the finding that product knowledge and corporate image have a positive moderating effect, the management should also consider how to improve both of these variables. From the perspective of product knowledge, marketers should focus on the strategies for educating the current and potential customers. For example, customers will be familiar with the attributes of the products through different marketing channels and activities, such as trade fairs, exhibitions, and communication media. The product knowledge includes not only the information on functions and services but also the solutions and reviews. Another advantage of this strategy is to form a proper cognition and positive evaluation of the intelligent personal assistant. On the other hand, the strategy to improve the corporate image should consider an active social media presence as most companies in the modern world need social media, which is useful for communication and interaction. The self-promoting contents need to be educational and aligned with the company itself; thus, telling the company’s own story can be an excellent way to promote a corporate image that shows the human side of the company and arouses interest. Among the implications proposed above, it is vital for all marketers of IPAs to treat the customers with kindness, full attention, and provide effective solutions in order to improve the corporate image and gain the most positive publicity.
Although the research objectives were considered in advance, a limitation also appears in the collected data sample as students occupied the highest proportion of the respondents. Consequently, there might be bias in the research. Thus, future research should focus on the specific statistical population, which can be taken as the target group for generalized information on different intelligent personal assistants. Furthermore, as the main survey instrument of this research is based on quantitative data, qualitative approaches and interviews could be applied for future research in similar fields. The last suggestion for future research is to employ a longitudinal study rather than the cross-sectional study used in the current research. A longitudinal study would be able to examine the changes and effects over a period of time. For instance, either discrete-time or successive-time data can be analyzed to predict whether the influences among variables become significant for different groups of customers over a period of time in order to more deeply understand customer loyalty toward intelligent personal assistants.
Funding
This research received no external funding.
Institutional Review Board Statement
Not applicable.
Informed Consent Statement
Not applicable.
Data Availability Statement
The data presented in this study are available on request from the corresponding author.
Conflicts of Interest
The authors declare no conflict of interest.
Appendix A
Questionnaire for Participants of Survey
Dear sir/madam,
This is the questionnaire for the academic research in Taiwan Tamkang University. In this research, it’s mainly about the
“Empirical Study on Customer Loyalty with Intelligent Personal Assistant”
The data collected will only be used for this research work so the questionnaire will be treated confidential and anonymously. Your participation will be appreciated.
Please, fill in this questionnaire by indicating the most appropriate option from your point of view. Very appreciate for your help!
Best regards,
Yih-hsuan Wang
There are 8 Parts in total which would not take longer than 15 min
Please give your own opinion on the following sections which depending on
(1) If you used the AI Assistant before,
please take the most current experience as evidence;
(2) If you did NOT use the AI Assistant before,
please take the most often heard of one as evidence.
| Part I |
| The usage condition of AI Assistant |
| 1. Have you ever used the Intelligent Personal Assistant (AI assistant) before? |
| Yes No |
| |
| 2. Which AI Assistant(s) did you use before? (Multiple) |
| Amazon Alexa/Echo Apple Siri Baidu Duer |
| Microsoft Cortana Facebook M Google Assistant/ Now |
| Samsung Bixby/Viv Nuance Nina SoundHound Hound |
| Others |
| |
| 3. Which AI Assistant(s) are you currently using? (Multiple) |
| Amazon Alexa/Echo Apple Siri Baidu Duer |
| Microsoft Cortana Facebook M Google Assistant/ Now |
| Samsung Bixby/Viv Nuance Nina SoundHound Hound |
| Others |
| |
| 4. Which kinds of services are most commonly used? (Multiple) |
| Provide information (e.g. weather, maps, navigator, news, knowledge) |
| Reminder (e.g. setting alarm, making to-do lists, shopping lists) |
| Play music through playlist or streaming services (e.g. Spotify, KKBox) |
| Play videos, TV shows or movies through playlist or streaming services (e.g. Netflix, Youtube) |
| Online shopping (e.g. Amazon, Ebay, Taobao) |
| Communicate with others (e.g. phone calling, email sending, instant messaging) |
| Others |
| |
| 5. Which AI Assistant(s) have you heard of before? (Multiple) |
| Amazon Alexa/Echo Apple Siri Baidu Duer |
| Microsoft Cortana Facebook M Google Assistant/ Now |
| Samsung Bixby/Viv Nuance Nina SoundHound Hound |
| Others |
| Part II |
| Perceived value |
| 1. The experience of using this AI Assistant maintains a consistent level of quality |
| Strongly Disagree Disagree Neutral Agree Strongly Agree |
| |
| 2. The experience of using this AI Assistant maintains an acceptable standard of quality |
| Strongly Disagree Disagree Neutral Agree Strongly Agree |
| |
| 3. The experience of using this AI Assistant is well formed |
| Strongly Disagree Disagree Neutral Agree Strongly Agree |
| |
| 4. Using AI Assistant would be economical |
| Strongly Disagree Disagree Neutral Agree Strongly Agree |
| |
| 5. Using AI Assistant offers value for money |
| Strongly Disagree Disagree Neutral Agree Strongly Agree |
| |
| 6. Using this AI Assistant would give me the social approval |
| Strongly Disagree Disagree Neutral Agree Strongly Agree |
| |
| 7. Using this AI Assistant would make a positive impression on other people |
| Strongly Disagree Disagree Neutral Agree Strongly Agree |
| |
| 8. Using this AI Assistant would give me more opportunities to communicate with other people |
| Strongly Disagree Disagree Neutral Agree Strongly Agree |
| |
| 9. The experience of using this AI Assistant is unique |
| Strongly Disagree Disagree Neutral Agree Strongly Agree |
| |
| 10. The experience of using this AI Assistant satisfy my curiosity |
| Strongly Disagree Disagree Neutral Agree Strongly Agree |
| |
| 11. Using this AI Assistant provides me an authentic experience |
| Strongly Disagree Disagree Neutral Agree Strongly Agree |
| Part III |
| Customer Innovativeness |
| 1. I am usually the first one to use the latest innovative products |
| Strongly Disagree Disagree Neutral Agree Strongly Agree |
| |
| 2. I usually use the new innovative products right away if it makes my work easier |
| Strongly Disagree Disagree Neutral Agree Strongly Agree |
| |
| 3. I usually use the new innovative products right away if it gives me more convenience |
| Strongly Disagree Disagree Neutral Agree Strongly Agree |
| |
| 4. I usually use the new innovative products if it is more functional |
| Strongly Disagree Disagree Neutral Agree Strongly Agree |
| |
| 5. I love to use new innovative products that impress others |
| Strongly Disagree Disagree Neutral Agree Strongly Agree |
| |
| 6. Innovation makes my life exciting and stimulating |
| Strongly Disagree Disagree Neutral Agree Strongly Agree |
| |
| 7. Acquiring new innovative products makes me happier |
| Strongly Disagree Disagree Neutral Agree Strongly Agree |
| |
| 8. Using the innovative products gives me a sense of enjoyment |
| Strongly Disagree Disagree Neutral Agree Strongly Agree |
| |
| 9. I mostly use the innovative products to satisfy my analytical thinking |
| Strongly Disagree Disagree Neutral Agree Strongly Agree |
| |
| 10. I often use the new innovative products that make me think logically |
| Strongly Disagree Disagree Neutral Agree Strongly Agree |
| |
| 11. I often use the new innovative products that challenge my intellectual skills |
| Strongly Disagree Disagree Neutral Agree Strongly Agree |
| Part IV |
| Customer Satisfaction |
| 1. I am satisfied with functions and services provided by AI Assistant |
| Strongly Disagree Disagree Neutral Agree Strongly Agree |
| |
| 2. The performance of this AI Assistant comes up to my expectation |
| Strongly Disagree Disagree Neutral Agree Strongly Agree |
| |
| 3. The performance of this AI Assistant is beyond my ideal |
| Strongly Disagree Disagree Neutral Agree Strongly Agree |
| |
| 4. In general, I am satisfied and pleased with this AI Assistant |
| Strongly Disagree Disagree Neutral Agree Strongly Agree |
| Part V |
| Customer Loyalty |
| 1. I would like to tell positive words about this AI Assistant to others |
| Strongly Disagree Disagree Neutral Agree Strongly Agree |
| |
| 2. I would recommend this AI Assistant to those who seek my advice |
| Strongly Disagree Disagree Neutral Agree Strongly Agree |
| |
| 3. I would encourage my friends and relatives to use this AI Assistant |
| Strongly Disagree Disagree Neutral Agree Strongly Agree |
| |
| 4. I always patronize this AI Assistant because it is the best choice for me |
| Strongly Disagree Disagree Neutral Agree Strongly Agree |
| |
| 5. I am willing to use the additional services provided by this AI Assistant |
| Strongly Disagree Disagree Neutral Agree Strongly Agree |
| |
| 6. I am willing to patronize this AI Assistant next time |
| Strongly Disagree Disagree Neutral Agree Strongly Agree |
| |
| 7. I will still patronize this AI Assistant though other AI Assistants provide the similar services |
| Strongly Disagree Disagree Neutral Agree Strongly Agree |
| |
| 8. I will still patronize this AI Assistant though the prices of some specific services are rising |
| Strongly Disagree Disagree Neutral Agree Strongly Agree |
| |
| 9. Overall, I have positive feelings on this AI Assistant |
| Strongly Disagree Disagree Neutral Agree Strongly Agree |
| Part VI |
| Product Knowledge |
| 1. Compare to other people, I have more knowledge of AI Assistant |
| Strongly Disagree Disagree Neutral Agree Strongly Agree |
| |
| 2. I am quite familiar with AI Assistant |
| Strongly Disagree Disagree Neutral Agree Strongly Agree |
| |
| 3. I have a good understanding of attributes of AI Assistant |
| Strongly Disagree Disagree Neutral Agree Strongly Agree |
| |
| 4. I feel confident about my ability to use the knowledge of AI Assistant choices |
| Strongly Disagree Disagree Neutral Agree Strongly Agree |
| |
| 5. In general, I consider myself knowledgeable about the AI Assistant Industry |
| Strongly Disagree Disagree Neutral Agree Strongly Agree |
| Part VII |
| Corporate Image |
| 1. The developer of this AI Assistant is innovative and pioneering |
| Strongly Disagree Disagree Neutral Agree Strongly Agree |
| |
| 2. The developer of this AI Assistant is sincere and responsive to consumers |
| Strongly Disagree Disagree Neutral Agree Strongly Agree |
| |
| 3. The developer of this AI Assistant is persuasive and reliable |
| Strongly Disagree Disagree Neutral Agree Strongly Agree |
| |
| 4. The developer of this AI Assistant makes the contribution to the society |
| Strongly Disagree Disagree Neutral Agree Strongly Agree |
| |
| 5. The developer of this AI Assistant is successful |
| Strongly Disagree Disagree Neutral Agree Strongly Agree |
| |
| 6. The developer of this AI Assistant is the leading firm in the AI Assistant Industry |
| Strongly Disagree Disagree Neutral Agree Strongly Agree |
| Part VIII |
| Basic Information |
| 1. Gender |
| Male Female |
| |
| 2. Age |
| 20 years old or below 21~29 years old 30~39 years old |
| 40~49 years old 50~59 years old 60 years old or above |
| |
| 3. Education |
| Middle school or below High school Bachelor |
| Master Ph.D. Others |
| |
| 4. Occupation |
| Business |
| Finance and Insurance |
| Education |
| Public Administration and Defense |
| Retails/ Wholesales |
| Service Industry |
| Student |
| Retired/Self-employed |
| IT Industry |
| Manufacturing |
| Others |
| |
| 5. Monthly income (NTD, USD, EURO) |
| 10,000 NTD or below 10,001~20,000 NTD 20,001~40,000 NTD |
| 40,001~60,000 NTD 60,001~80,000 NTD 80,001~100,000 NTD |
| 100,000 NTD or above |
| 1 USD = 30 NTD |
| 331 USD or below 332~662 USD 663~1325 USD |
| 1326~1988 USD 1989~2650 USD 2651~3313 USD |
| 3314 USD or above |
| 1 EURO =35 NTD |
| 286 EURO or below 287~572 EURO 573~1144 EURO |
| 1145~1716 EURO 1717~2288 EURO 2289~2860 EURO |
| 2861 EURO or above |
| 6. Current residential area: |
| East Asia Southeast Asia Other Asia areas |
| North America South America Europe |
| Africa Oceania Others |
| The End of Questionnaire |
References
- Ouyang, F.; Jiao, P. Artificial intelligence in education: The three paradigms. Computers and Education: Artif. Intell. 2021, 2, 1–6. [Google Scholar]
- Zhang, Y.; Wu, M.; Tian, G.Y.; Zhang, G.; Lu, J. Ethics and privacy of artificial intelligence: Understandings from bibliometrics. Knowl. Based Syst. 2021, 21, 106994. [Google Scholar] [CrossRef]
- Dubey, R.; Bryde, D.J.; Blome, C.; Roubaud, D.; Giannakis, M. Facilitating artificial intelligence powered supply chain analytics through alliance management during the pandemic crises in the B2B context. Ind. Mark. Manag. 2021, 96, 135–146. [Google Scholar] [CrossRef]
- Aguilar, J.; Garces-Jimenez, A.; R-Moreno, M.D.; García, R. A systematic literature review on the use of artificial intelligence in energy self-management in smart buildings. Renew. Sust. Energy Rev. 2021, 151, 1–16. [Google Scholar] [CrossRef]
- Pelau, C.; Pop, M.I.; Ene, I.; Lazar, L. Clusters of Skeptical Consumers Based on Technology and AI Acceptance, Perception of Social Media Information and Celebrity Trend Setter. J. Theor. Appl. Electron. Commer. Res. 2021, 16, 69. [Google Scholar] [CrossRef]
- Allal-Chérif, O.; Aránega, A.Y.; Sánchez, R.C. Intelligent recruitment: How to identify, select, and retain talents from around the world using artificial intelligence. Technol. Forecast. Soc. Chang. 2021, 169, 1–11. [Google Scholar] [CrossRef]
- Khana, M.; Mehran, M.T.; Haq, Z.U.; Ullaha, Z.; Naqvi, S.R.; Ihsan, M.; Abbass, H. Applications of artificial intelligence in COVID-19 pandemic: A comprehensive review. Expert Syst. Appl. 2021, 185, 1–17. [Google Scholar]
- Lee, J.; Jung, O.; Lee, Y.; Kim, O.; Park, C. A Comparison and Interpretation of Machine Learning Algorithm for the Prediction of Online Purchase Conversion. J. Theor. Appl. Electron. Commer. Res. 2021, 16, 83. [Google Scholar] [CrossRef]
- Hu, Q.; Lu, Y.; Pan, Z.; Gong, Y.; Yang, Z. Can AI artifacts influence human cognition? The effects of artificial autonomy in intelligent personal assistants. Int. J. Inf. Manag. 2021, 56, 1–15. [Google Scholar] [CrossRef]
- Ki, C.W.; Cho, E.; Lee, J.E. Can an intelligent personal assistant (IPA) be your friend? Para-friendship development mechanism between IPAs and their users. Comput. Hum. Behav. 2020, 111, 1–10. [Google Scholar] [CrossRef]
- Paraiso, E.C.; Barthès, J.P.A. An intelligent speech interface for personal assistants in R&D projects. Expert Syst. Appl. 2006, 31, 673–683. [Google Scholar]
- Yoon, N.; Lee, H.K. AI Recommendation Service Acceptance: Assessing the Effects of Perceived Empathy and Need for Cognition. J. Theor. Appl. Electron. Commer. Res. 2021, 16, 107. [Google Scholar] [CrossRef]
- Fernandes, T.; Oliveira, E. Understanding consumers’ acceptance of automated technologies in service encounters: Drivers of digital voice assistants adoption. J Bus Res 2021, 122, 180–191. [Google Scholar] [CrossRef]
- Sánchez-Franco, M.J.; Arenas-Márquez, F.J.; Alonso-Dos-Santos, M. Using structural topic modelling to predict users’ sentiment towards intelligent personal agents. An application for Amazon’s echo and Google Home. J. Retail. Consum. Serv. 2021, 63, 102658. [Google Scholar] [CrossRef]
- Rogers, E.M. Diffusion of Innovations; Macmillan Publishing Co.: New York, NY, USA, 1995. [Google Scholar]
- Yen, C.H.; Teng, H.Y.; Tzeng, J.C. Innovativeness and customer value co-creation behaviors: Mediating role of customer engagement. Int. J. Hosp. Manag. 2020, 88, 1–11. [Google Scholar] [CrossRef]
- Hauser, J.; Tellis, G.J.; Griffin, A. Research on Innovation: A Review and Agenda for Marketing Science. Mark. Sci. Mark. Sci. 2006, 25, 687–717. [Google Scholar] [CrossRef] [Green Version]
- Woo, H.; Kim, S.J.; Wang, H. Understanding the role of service innovation behavior on business customer performance and loyalty. Ind. Mark. Manag. 2021, 93, 1–51. [Google Scholar] [CrossRef]
- Woodruff, R.B. Customer value: The next source for competitive advantage. J. Acad. Mark. Sci. 1997, 25, 139–153. [Google Scholar] [CrossRef]
- Chaker, N.N.; Beeler, L.L.; Delpechitre, D. Can customer loyalty to a salesperson be harmful? Examining customer perceptions of salesperson emotional labor strategies post ethical transgressions. Ind. Mark. Manag. 2021, 96, 238–253. [Google Scholar] [CrossRef]
- Zeba, G.; Dabićbc, M.; Čičak, M.; Daim, T.; Yalcing, H. Technology mining: Artificial intelligence in manufacturing. Technol. Forecast. Soc. Chang. 2021, 171, 1–18. [Google Scholar] [CrossRef]
- Zhang, W.; Zuo, N.; He, W.; Li, S.; Yu, L. Factors influencing the use of artificial intelligence in government: Evidence from China. Technol. Soc. 2021, 66, 101675. [Google Scholar] [CrossRef]
- Xin, Y.; Man, W.; Yi, Z. The development trend of artificial intelligence in medical: A patentometric analysis. Artif. Intell. Life Sci. 2021, 1, 1–10. [Google Scholar]
- Neubauer, A.C. The future of intelligence research in the coming age of artificial intelligence–With a special consideration of the philosophical movements of trans- and posthumanism. Intelligence 2021, 87, 1–12. [Google Scholar] [CrossRef]
- Russoa, P.A.; Duradoni, M.; Guazzini, A. How self-perceived reputation affects fairness towards humans and artificial intelligence. Comput. Hum. Behav. 2021, 124, 1–8. [Google Scholar]
- Alhasan, M.; Hasaneen, M. Digital imaging, technologies and artificial intelligence applications during COVID-19 pandemic. Comput. Med. Imaging Graph. 2021, 91, 101933. [Google Scholar] [CrossRef] [PubMed]
- Li, M.; Wang, W.; Zhou, K. Exploring the technology emergence related to artificial intelligence: A perspective of coupling analyses. Technol. Forecast. Soc. Chang. 2021, 172, 1–13. [Google Scholar] [CrossRef]
- Silva, A.B.; Gomes, M.M.; Costa, C.A.; Righi, R.R.; Barbosa, J.L.V.; Pessin, G.; Doncker, G.D.; Federizzi, G. Intelligent personal assistants: A systematic literature review. Expert Syst. Appl. 2020, 147, 113193. [Google Scholar] [CrossRef]
- Hauswald, J.; Laurenzano, M.A.; Zhang, Y.; Yang, H.; Kang, Y.; Li, C.; Petrucci, V. Designing future warehouse-scale computers for sirius, an end-to-end voice and vision personal assistant. ACM Trans. Comput. Syst. (TOCS) 2016, 34, 1–32. [Google Scholar] [CrossRef]
- Kim, S.; Choudhury, A. Exploring older adults’ perception and use of smart speaker-based voice assistants: A longitudinal study. Comput. Hum. Behav. 2021, 124, 1–11. [Google Scholar] [CrossRef]
- Belkadi, F.; Dhuie, M.A.; Aguado, J.V.; Laroche, F.; Bernard, A.; Chinesta, F. Intelligent assistant system as a context-aware decision-making support for the workers of the future. Comput. Ind. Eng. 2020, 139, 1–13. [Google Scholar] [CrossRef]
- Lee, S.K.; Kavya, P.; Lasser, S.C. Social interactions and relationships with an intelligent virtual agent. Int. J. Hum. Comput. Stud. 2021, 150, 1–12. [Google Scholar] [CrossRef]
- McLean, G.; Osei-Frimpong, K.; Barhorst, J. Alexa, do voice assistants influence consumer brand engagement?–Examining the role of AI powered voice assistants in influencing consumer brand engagement. J. Bus. Res. 2021, 124, 312–328. [Google Scholar] [CrossRef]
- Getnet, H.; O’Cass, A.; Ahmadi, H.; Siahtiri, V. Supporting product innovativeness and customer value at the bottom of the pyramid through context-specific capabilities and social ties. Ind. Mark. Manag. 2019, 83, 70–80. [Google Scholar] [CrossRef]
- Midgley, D.F.; Dowling, G.R. The Innovativeness: The Concept and Its Concept Measurement. J. Consum. Res. 1978, 4, 229–242. [Google Scholar] [CrossRef]
- Venkatesan, M. Cognitive Consistency and Novelty Seeking, in Consumer Behavior: Theoretical Sources; Ward, S., Roberson, T.S., Eds.; Prentice-Hall: Englewood Cliffs, NJ, USA, 1973; pp. 354–384. [Google Scholar]
- Heirati, N.; Siahtiri, V. Driving service innovativeness via collaboration with customers and suppliers: Evidence from business-to-business services. Ind. Mark. Manag. 2019, 78, 6–16. [Google Scholar] [CrossRef]
- Albors-Garrigos, J. Barriers and enablers for innovation in the retail sector: Co-innovating with the customer. A case study in grocery retailing. J. Retail. Consum. Serv. 2020, 55, 102077. [Google Scholar] [CrossRef]
- Im, S.; Bayus, B.L.; Mason, C.H. An empirical study of innate consumer innovativeness, personal characteristics, and new-product adoption behavior. J. Acad. Mark. Sci. 2003, 31, 61–73. [Google Scholar] [CrossRef]
- Ebbing, T.; Lüthje, C. Pricing decisions of consumer innovators. Res. Policy 2021, 50, 104169. [Google Scholar] [CrossRef]
- Gualandris, J.; Kalchschmidt, M. Customer pressure and innovativeness: Their role in sustainable supply chain management. J. Purch. Supply Manag. 2014, 20, 92–103. [Google Scholar] [CrossRef]
- Hirschman, E.C. Experience seeking: A subjectivist perspective of consumption. J. Bus. Res. 1984, 12, 115–136. [Google Scholar] [CrossRef]
- Montani, F.; Torres, C.; Ferreira, M.C.; Mendonça, H.; Silva, A.J.; Courcy, F.; Dagenais-Desmaraisg, V. Self-image goals, compassionate goals and innovative work behavior: The role of organizational support for innovation across countries. J. Bus. Res. 2021, 137, 588–600. [Google Scholar] [CrossRef]
- Voss, K.E.; Spangenberg, E.R.; Grohmann, B. Measuring the Hedonic and Utilitarian Dimensions of Consumer Attitude. J. Mark. Res. 2003, 40, 310–320. [Google Scholar] [CrossRef]
- Theoharakis, V.; Hooley, G. Customer orientation and innovativeness: Differing roles in New and Old Europe. Int. J. Res. Mark. 2008, 25, 69–79. [Google Scholar] [CrossRef] [Green Version]
- Tuan, L.T. Disentangling green service innovative behavior among hospitality employees: The role of customer green involvement. Int. J. Hosp. Manag. 2021, 99, 103045. [Google Scholar] [CrossRef]
- Villani, E.; Linder, C.; Lechner, C.; Muller, L. How do non-innovative firms start innovation and build legitimacy? The case of professional service firms. J. Bus. Res. 2021, 137, 614–625. [Google Scholar] [CrossRef]
- Fidel, P.; Schlesinger, W.; Cervera, A. Collaborating to innovate: Effects on customer knowledge management and performance. J. Bus. Res. 2015, 68, 1426–1428. [Google Scholar] [CrossRef] [Green Version]
- Dodds, W.; Monroe, K. The effect of brand and price information on subjective product evaluations. Adv. Consum. Res. 1985, 12, 85–90. [Google Scholar]
- Jiang, X.; Deng, N.; Fan, X.; Jia, H. Examining the role of perceived value and consumer innovativeness on consumers’ intention to watch intellectual property films. Entertain. Comput. 2021, 40, 100453. [Google Scholar] [CrossRef]
- Day, G.S. Market Driven Strategy. Processes for Creating Value; The Free Press: New York, NY, USA, 1999. [Google Scholar]
- Gale, B.T. Managing Customer Value: Creating Quality and Service That Customers Can See; Free Press: New York, NY, USA, 1994. [Google Scholar]
- Zhao, Y.; Chau, K.Y.; Shen, H.; Duan, X.; Huang, S. The influence of tourists’ perceived value and demographic characteristics on the homestay industry: A study based on social stratification theory. J. Hosp. Tour. Manag. 2020, 45, 479–485. [Google Scholar] [CrossRef]
- Pang, H. Identifying associations between mobile social media users’ perceived values, attitude, satisfaction, and eWOM engagement: The moderating role of affective factors. Telemat. Inform. 2021, 59, 1–10. [Google Scholar] [CrossRef]
- Zeithaml, V.A. Consumer Perceptions of Price, Quality, and Value: A Means-End Model and Synthesis of Evidence. J. Mark. 1988, 52, 2–22. [Google Scholar] [CrossRef]
- Sheth, J.N.; Newman, B.I.; Gross, B.L. Why we buy what we buy: A theory of consumption values. J. Bus. Res. 1991, 22, 159–170. [Google Scholar] [CrossRef]
- Liu, S.; Gao, B.; Gallivan, M.; Gong, Y. Free add-on services and perceived value in competitive environments: Evidence from online hotel reviews. Int. J. Hosp. Manag. 2020, 90, 1–10. [Google Scholar] [CrossRef]
- Confente, I.; Scarpi, D.; Russo, I. Marketing a new generation of bio-plastics products for a circular economy: The role of green self-identity, self-congruity, and perceived value. J. Bus. Res. 2020, 112, 431–439. [Google Scholar] [CrossRef]
- Cardozo, R.N. An Experimental Study of Customer Effort, Expectation, and Satisfaction. J. Mark. Res. 1965, 2, 244–249. [Google Scholar] [CrossRef]
- Wang, B.; Wang, P.; Tu, Y. Customer satisfaction service match and service quality-based blockchain cloud manufacturing. Int. J. Prod. Econ. 2021, 240, 1–13. [Google Scholar] [CrossRef]
- Oliver, R.L. A Cognitive Model of the Antecedents and Consequences of Satisfaction Decisions. J. Mark. Res. 1980, 17, 460–469. [Google Scholar] [CrossRef]
- Yi, Y. A critical review of consumer satisfaction. In Review of Marketing; Emerald Publishing Limited: Chicago, IL, USA, 1990. [Google Scholar]
- Howard, J.A.; Sheth, J.N. The Theory of Buyer Behavior; Wiley: New York, NY, USA, 1969. [Google Scholar]
- Oliver, R.L.; Gerald, L. Effect of satisfaction and its antecedents on consumer preference and intention. Adv. Consum. Res. 1981, 8, 88–93. [Google Scholar]
- Lia, F.; Lu, H.; Hou, M.; Cui, K.; Darbandi, M. Customer satisfaction with bank services: The role of cloud services, security, e-learning and service quality. Technol. Soc. 2021, 64, 101487. [Google Scholar] [CrossRef]
- Oliver, R.L. Satisfaction: A Behavioral Perspective on the Consumer; McGraw-Hill series: New York, NY, USA, 1997. [Google Scholar]
- Kotler, P.; Keller, K.L. A Framework for Marketing Management. Marketing Management; Pearson: Boston, MA, USA, 2016. [Google Scholar]
- Krom, I. Global Online Entrepreneurship and the Impact of Innovation on Brands. EMAJ Emerg. Mark. J. 2015, 5, 90–101. [Google Scholar] [CrossRef] [Green Version]
- Xu, J.D.; Benbasat, I.; Cenfetelli, R. The Effects of Service and Consumer Product Knowledge on Online Customer Loyalty. J. Assoc. Inf. Syst. 2011, 12, 741–766. [Google Scholar] [CrossRef]
- Liang, D.; Dai, Z.; Wang, M. Assessing customer satisfaction of O2O takeaway based on online reviews by integrating fuzzy comprehensive evaluation with AHP and probabilistic linguistic term sets. Appl. Soft Comput. 2021, 98, 106847. [Google Scholar] [CrossRef]
- Vandecasteele, B.; Geuens, M. Motivated consumer innovativeness: Concept, measurement, and validation. Int. J. Res. Mark. 2010, 27, 308–318. [Google Scholar] [CrossRef]
- Goić, M.; Levenier, C.; Montoya, R. Drivers of customer satisfaction in the grocery retail industry: A longitudinal analysis across store formats. J. Retail. Consum. Serv. 2021, 60, 102505. [Google Scholar] [CrossRef]
- Hallowell, R. The relationships of customer satisfaction, customer loyalty, and profitability: An empirical study. Int. J. Serv. Ind. Manag. 1996, 7, 27–42. [Google Scholar] [CrossRef] [Green Version]
- Fornell, C.; Johnson, M.D.; Anderson, E.W.; Cha, J.; Bryant, B.E. The American Customer Satisfaction Index: Nature, Purpose, and Findings. J. Mark. 1996, 60, 7–18. [Google Scholar] [CrossRef] [Green Version]
- Yang, Z.; Peterson, R.T. Customer perceived value, satisfaction, and loyalty: The role of switching costs. Psychol. Mark. 2004, 21, 799–822. [Google Scholar] [CrossRef] [Green Version]
- Wang, Y.; Lo, H.P.; Yang, Y. An integrated framework for service quality, customer value, satisfaction: Evidence from China’s telecommunication industry. Inf. Syst. Front. 2004, 6, 325–340. [Google Scholar] [CrossRef]
- Neal, W.D. Satisfaction is nice, but value drives loyalty. Mark. Res. 1999, 11, 20–23. [Google Scholar]
- Balci, G. Digitalization in container shipping: Do perception and satisfaction regarding digital products in a non-technology industry affect overall customer loyalty? Technol. Forecast. Soc. Chang. 2021, 172, 1–11. [Google Scholar] [CrossRef]
- Gao, M.; Huang, L. Quality of channel integration and customer loyalty in omnichannel retailing: The mediating role of customer engagement and relationship program receptiveness. J. Retail. Consum. Serv. 2021, 63, 102688. [Google Scholar] [CrossRef]
- Zhang, M.; Hartley, J.L.; AL-Husan, F.B.; ALHussan, F.B. Informal interorganizational business relationships and customer loyalty: Comparing Guanxi, Yongo, and Wasta. Int. Bus. Rev. 2021, 30, 1–13. [Google Scholar] [CrossRef]
- Bloemer, J.; Ruyter, K. On the relationship between store image, store satisfaction and store loyalty. Eur. J. Mark. 1998, 32, 499–513. [Google Scholar] [CrossRef]
- Wong, A.; Sohal, A. Service quality and customer loyalty perspectives on two levels of retail relationships. J. Serv. Mark. 2003, 17, 495–513. [Google Scholar] [CrossRef]
- Gronholdt, L.; Martensen, A.; Kristensen, K. The relationship between customer satisfaction and loyalty: Cross-industry differences. Total Qual. Manag. 2000, 11, 509–514. [Google Scholar] [CrossRef]
- Butcher, K.; Sparks, B.; O’Callaghan, F. Evaluative and relational influences on service loyalty. Int. J. Serv. Ind. Manag. 2001, 12, 310–327. [Google Scholar] [CrossRef]
- Fraering, M.; Minor, M.S. Beyond loyalty: Customer satisfaction, loyalty, and fortitude. J. Serv. Mark. 2013, 27, 334–344. [Google Scholar] [CrossRef]
- Shi, Y.; Prentice, C.; He, W. Linking service quality, customer satisfaction and loyalty in casinos, does membership matter? Int. J. Hosp. Manag. 2014, 40, 81–91. [Google Scholar] [CrossRef]
- Ji, C.; Prentice, C. Linking transaction-specific satisfaction and customer loyalty–The case of casino resorts. J. Retail. Consum. Serv. 2021, 58, 102319. [Google Scholar] [CrossRef]
- Kressmann, F.; Sirgy, M.J.; Herrmann, A.; Huber, F.; Huber, S.; Lee, D.J. Direct and indirect effects of self-image congruence on brand loyalty. J. Bus. Res. 2006, 59, 955–964. [Google Scholar] [CrossRef]
- Anderson, E.W.; Sullivan, M.W. The Antecedents and Consequences of Customer Satisfaction for Firms. Mark. Sci. 1993, 12, 125–143. [Google Scholar] [CrossRef]
- Eggert, A.; Ulaga, W. Customer perceived value: A substitute for satisfaction in business markets. J. Bus. Ind. Mark. 2002, 17, 107–118. [Google Scholar] [CrossRef]
- Li, M.W.; Teng, H.Y.; Chen, C.Y. Unlocking the customer engagement-brand loyalty relationship in tourism social media: The roles of brand attachment and customer trust. J. Hosp. Tour. Manag. 2020, 44, 184–192. [Google Scholar] [CrossRef]
- Ryu, K.; Han, H.; Jang, S. (Shawn). Relationships among hedonic and utilitarian values, satisfaction and behavioral intentions in the fast-casual restaurant industry. Int. J. Contemp. Hosp. Manag. 2010, 22, 416–432. [Google Scholar] [CrossRef]
- Floh, A.; Zauner, A.; Koller, M.; Rusch, T. Customer segmentation using unobserved heterogeneity in the perceived-value-loyalty-intentions link. J. Bus. Res. 2014, 67, 974–982. [Google Scholar] [CrossRef] [Green Version]
- Kandampully, J.; Zhang, T.C.; Bilgihan, A. Customer loyalty: A review and future directions with a special focus on the hospitality industry. Int. J. Contemp. Hosp. Manag. 2015, 27, 379–414. [Google Scholar] [CrossRef]
- Marks, L.J.; Olson, J.C. Toward a Cognitive Structure Concenptualization of Product Familiarity. Adv. Consum. Res. 1981, 8, 145–150. [Google Scholar]
- Hwang, J.; Park, S.; Kim, I. Understanding motivated consumer innovativeness in the context of a robotic restaurant: The moderating role of product knowledge. J. Hosp. and Tour. Manag. 2020, 44, 272–282. [Google Scholar] [CrossRef]
- Liu, H.; Li, W.; Li, Y. A new computational method for acquiring effect knowledge to support product innovation. Knowl. Based Syst. 2021, 21, 107410. [Google Scholar] [CrossRef]
- Lin, L.; Zhen, J. Extrinsic product performance signaling, product knowledge and customer satisfaction: An integrated analysis-an example of notebook consumer behavior in Taipei city. Fu Jen Manag. Rev. 2005, 12, 65–91. [Google Scholar]
- Rezvani, S.; Dehkordi, G.J.; Rahman, M.S.; Fouladivanda, F.; Habibi, M.; Eghtebasi, S. A conceptual study on the country of origin effect on consumer purchase intention. Asian Soc. Sci. 2012, 8, 205–215. [Google Scholar] [CrossRef] [Green Version]
- Dahlquist, S.H. How green product demands influence industrial buyer/seller relationships, knowledge, and marketing dynamic capabilities. J. Bus. Res. 2021, 136, 402–413. [Google Scholar] [CrossRef]
- Long, X.; Li, H.; Du, Y.; Mao, E.; Tai, J. A knowledge-based automated design system for mechanical products based on a general knowledge framework. Expert Syst. Appl. 2021, 178, 114960. [Google Scholar] [CrossRef]
- Kim, J.J.; Hwang, J. Merging the norm activation model and the theory of planned behavior in the context of drone food delivery services: Does the level of product knowledge really matter? J. Hosp. Tour. Manag. 2020, 42, 1–11. [Google Scholar] [CrossRef]
- Alba, J.W.; Hutchinson, J.W. Dimensions of Consumer Expertise. J. Consum. Res. 1987, 13, 411–454. [Google Scholar] [CrossRef]
- Li, X.; Lyu, M.; Wang, Z.; Chen, C.H.; Zheng, P. Exploiting knowledge graphs in industrial products and services: A survey of key aspects, challenges, and future perspectives. Comput. Ind. 2021, 129, 103449. [Google Scholar] [CrossRef]
- Alba, J.W.; Hutchinson, J.W. Knowledge Calibration: What Consumers Know and What They Think They Know. J. Consum. Res. 2000 27, 123–156. [CrossRef] [Green Version]
- Wang, Y.; Zhu, Q.; Krikke, H.; Hazen, B. How product and process knowledge enable consumer switching to remanufactured laptop computers in circular economy. Technol. Forecast. Soc. Chang. 2020, 161, 1–13. [Google Scholar] [CrossRef]
- Hauser, W.M.; Lund, R.T. The Remanufacturing Industry: Anatomy of a Giant Report; Boston University: Boston, MA, USA, 2003. [Google Scholar]
- Wang, Y.; Hazen, B.T. Consumer product knowledge and intention to purchase remanufactured products. Int. J. Prod. Econ. 2016, 181, 460–469. [Google Scholar] [CrossRef]
- Kempf, D.S.; Smith, R.E. Consumer Processing of Product Trial and the Influence of Prior Advertising: A Structural Modeling Approach. J. Mark. Res. 1998, 35, 325–338. [Google Scholar] [CrossRef]
- Bian, X.; Moutinho, L. The role of brand Image, product involvement, and knowledge in explaining consumer purchase behaviour of counterfeits: Direct and indirect effects. Eur. J. Mark. 2011, 45, 191–216. [Google Scholar] [CrossRef]
- Dowling, G.R. Measuring corporate images: A review of alternative approaches. J. Bus. Res. 1988, 17, 27–34. [Google Scholar] [CrossRef]
- Barich, H.; Kotler, P. A framework for marketing image management. MIT Sloan Manag. Rev. 1991, 32, 94–104. [Google Scholar]
- Andreassen, T.W.; Lindestad, B. The effect of corporate image in the formation of customer loyalty. J. Serv. Res. 1998, 1, 82–92. [Google Scholar] [CrossRef]
- Ind, N. The Corporate Brand. In The Corporate Brand; Palgrave Macmillan: London, UK, 1997. [Google Scholar]
- Balmer, J.M.T.; Podnar, K. Corporate brand orientation: Identity, internal images, and corporate identification matters. J. Bus. Res. 2021, 134, 729–737. [Google Scholar] [CrossRef]
- Yu, W.; Han, X.; Ding, L.; He, M. Organic food corporate image and customer co-developing behavior: The mediating role of consumer trust and purchase intention. J. Retail. Consum. Serv. 2021, 59, 102377. [Google Scholar] [CrossRef]
- Aydin, S.; Özer, G. The analysis of antecedents of customer loyalty in the Turkish mobile telecommunication market. Eur. J. Mark. 2005, 39, 910–925. [Google Scholar] [CrossRef]
- Balmer, J.M.T.; Lin, Z.; Chen, W.; He, X. The role of corporate brand image for B2B relationships of logistics service providers in China. J. Bus. Res. 2020, 117, 850–861. [Google Scholar] [CrossRef]
- Chun, R.; Davies, G. The influence of corporate character on customers and employees: Exploring similarities and differences. J. Acad. Mark. Sci. 2006, 34, 138–146. [Google Scholar] [CrossRef]
- Kim, M.; Yin, X.; Lee, G. The effect of CSR on corporate image, customer citizenship behaviors, and customers’ long-term relationship orientation. Int. J. Hosp. Manag. 2020, 88, 1–8. [Google Scholar] [CrossRef]
- Spyropoulou, S.; Skarmeas, D.; Katsikeas, C.S. The role of corporate image in business-to-business export ventures: A resource-based approach. Ind. Mark. Manag. 2010, 39, 752–760. [Google Scholar] [CrossRef]
- Kim, J.H.; Hyun, Y.J. A model to investigate the influence of marketing-mix efforts and corporate image on brand equity in the IT software sector. Ind. Mark. Manag. 2011, 40, 424–438. [Google Scholar] [CrossRef]
- Kandampully, J.; Hu, H. Do hoteliers need to manage image to retain loyal customers? Int. J. Contemp. Hosp. Manag. 2007, 19, 435–443. [Google Scholar] [CrossRef]
- Lemmink, J.; Schuijf, A.; Streukens, S. The role of corporate image and company employment image in explaining application intentions. J. Econ. Psychol. 2003, 24, 1–15. [Google Scholar] [CrossRef]
- Fredericks, J.O.; Salter, J.M. What does your customer really want? Qual. Prog. 1998, 31, 63–65. [Google Scholar]
- Hong, J.C.; Lin, P.H.; Hsieh, P.C. The effect of consumer innovativeness on perceived value and continuance intention to use smartwatch. Comput. Hum. Behav. 2017, 67, 264–272. [Google Scholar] [CrossRef]
- Cowart, K.O.; Fox, G.L.; Wilson, A.E. A structural look at consumer innovativeness and self-congruence in new product purchases. Psychol. Mark. 2008, 25, 1111–1130. [Google Scholar] [CrossRef]
- Cassel, C.; Eklöf, J.A. Modelling customer satisfaction and loyalty on aggregate levels: Experience from the ECSI pilot study. Total Qual. Manag. 2001, 12, 834–841. [Google Scholar] [CrossRef]
Figure 1.
Research framework.
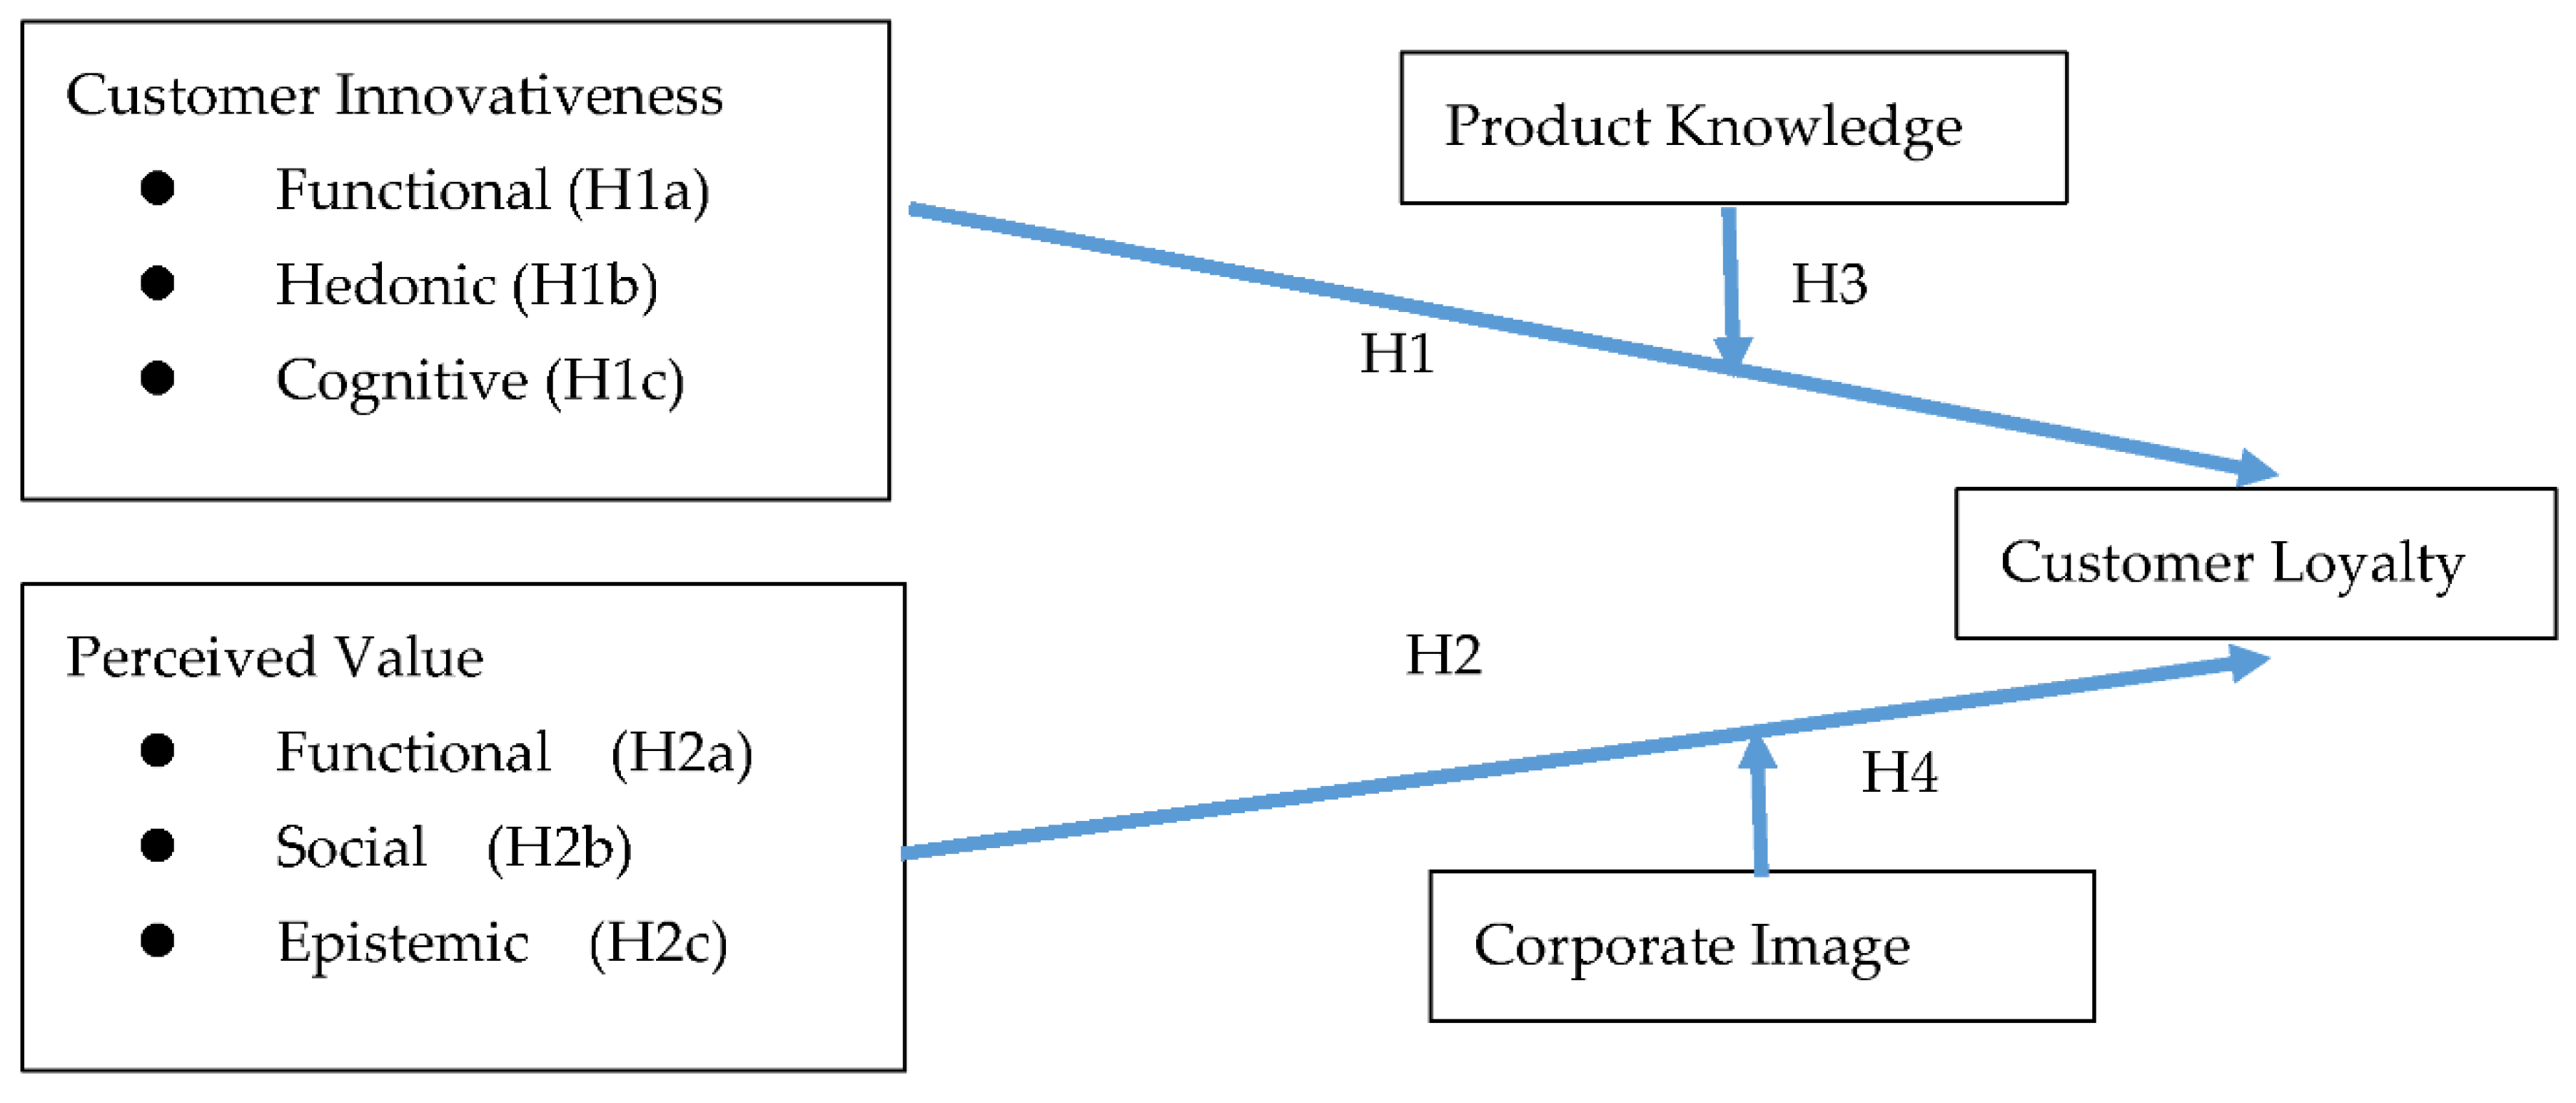
Figure 2.
Research flowchart.
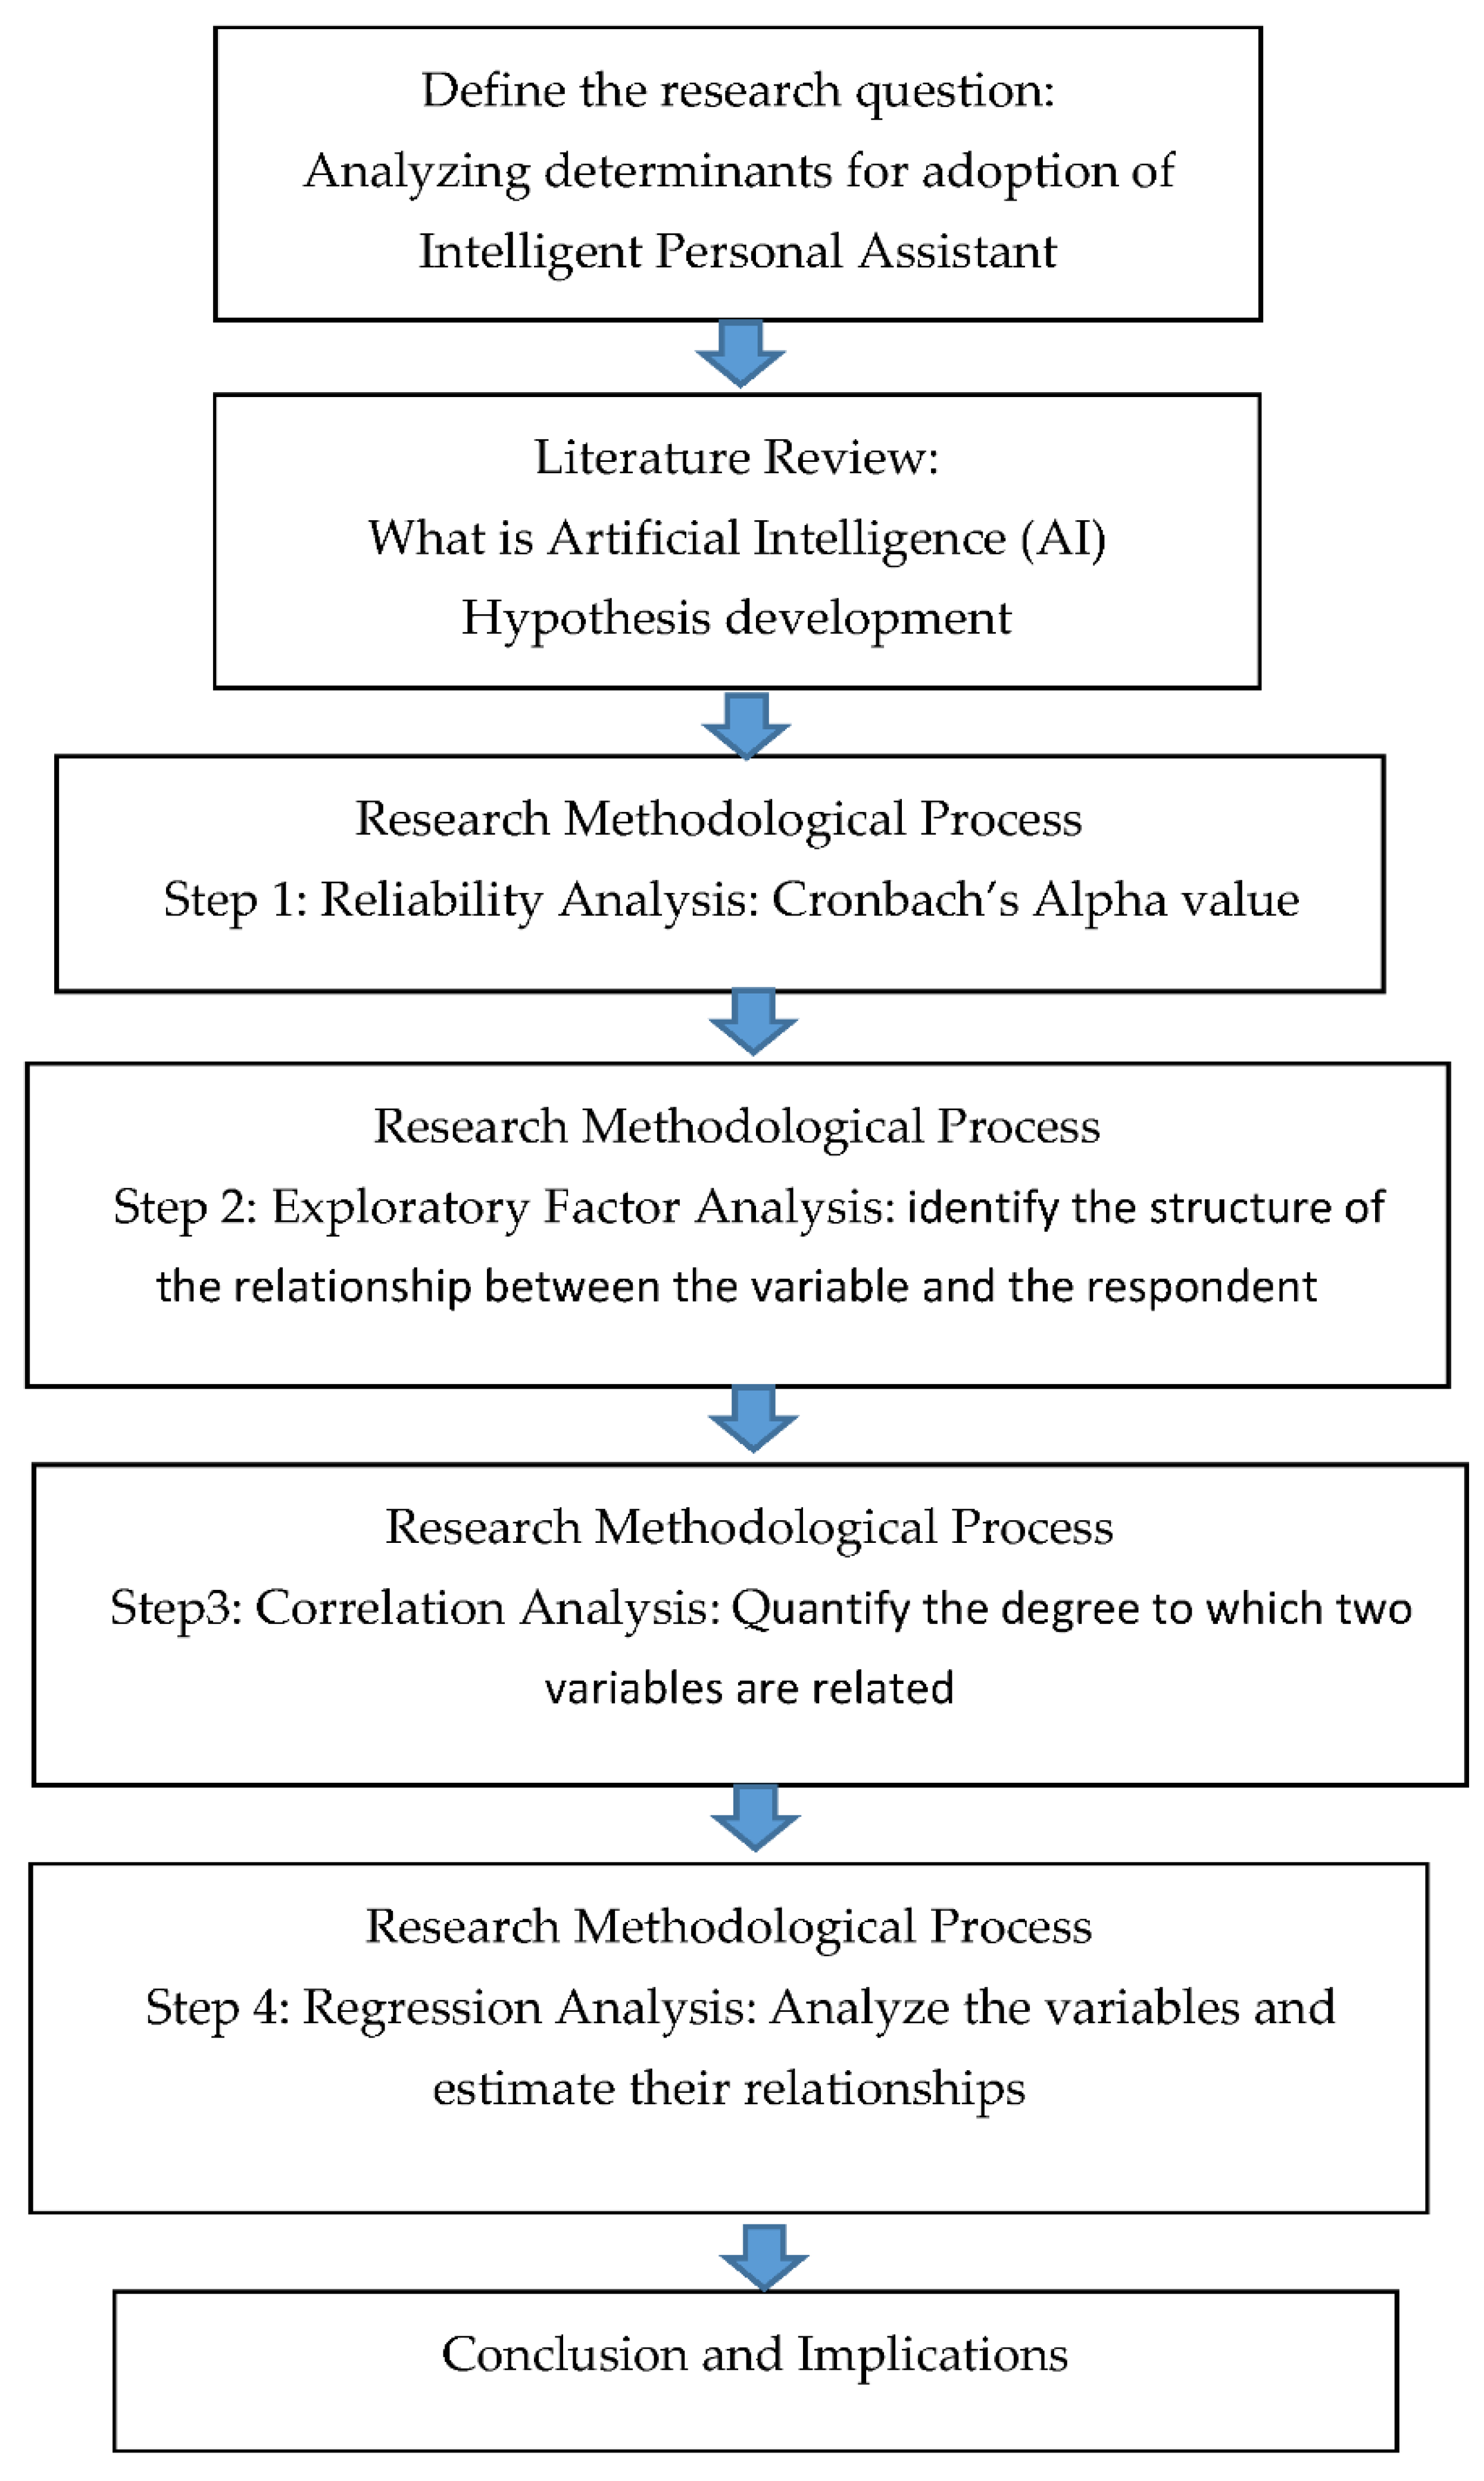

Table 1.
Operational definitions of each dimension.
| Variable | Operational Definition | Number of Questions | References | |
|---|---|---|---|---|
| Customer Innovativeness | Functional Innovativeness | The motivation to use the intelligent virtual assistant is based on the ability to solve problems and help customers work more efficiently | 11 | Montani et al. [43]; Ebbing and Lüthje [40]; Villani et al. [47]; Getnet et al. [34]; Yen et al. [16] |
| Hedonic Innovativeness | The motivation to use the intelligent virtual assistant is based on its ability to make life enjoyable and exciting | Tuan [46]; Ebbing and Lüthje [40]; Vandecasteele and Geuens [71]; Albors-Garrigos [38] | ||
| Cognitive Innovativeness | The motivation to use the intelligent virtual assistant is based on its ability to satisfy curiosity and give the customers mental stimulation | Montani et al. [43]; Ebbing and Lüthje [40]; Heirati and Siahtiri [37]; Theoharakis and Hoole [45] | ||
| Perceived Value | Functional Value | The evaluation of the intelligent virtual assistant is based on its functions and utilities | 11 | Zeithaml [55]; Sheth et al. [56]; Jiang et al. [50] |
| Social Value | The evaluation of the intelligent virtual assistant is based on the social approval and impression made on others | Zeithaml [55]; Sheth et al. [56]; Zhao et al. [53]; Pang [54] | ||
| Epistemic Value | The evaluation of the intelligent virtual assistant is based on the provided novelty and desired knowledge | Zeithaml [55]; Sheth et al. [56]; Confente et al. [58]; Liu et al. [57] | ||
| Customer Loyalty | Customers prefer and insist on using the specific intelligent virtual assistant consistently for a long time | 9 | Gao and Huang [79]; Oliver [66]; Gronholdt et al. [83]; Balci [78]; Chaker et al. [20] | |
| Product Knowledge | Customers’ confidence in their familiarity and expertise with the intelligent virtual assistant | 5 | Alba and Hutchinson [103]; Lin and Zhen [98]; Dahlquist, [100]; Kim and Hwang, [96] | |
| Corporate Image | Customers’ subjective impression and opinion of the intelligent virtual assistant | 6 | Barich and Kotler [112]; Kim and Hyun, [122]; Kim et al. [120]; Balmer and Podnar, [115] | |
Table 2.
Cronbach’s alpha of each variable.
| Variables | Cronbach’s Alpha of Each Variable |
|---|---|
| Perceived Value | 0.832 |
| Customer Innovativeness | 0.886 |
| Customer Loyalty | 0.902 |
| Corporate Image | 0.822 |
| Product Knowledge | 0.892 |
Table 3.
Values of KMO and Bartlett’s test of sphericity.
| Testing Method | Test Statistics of Variables | |||||
|---|---|---|---|---|---|---|
| Perceived Value | Customer Inno. | Customer Loyalty | Corp. Image | Product Know. | ||
| KMO Measure of sampling adequacy | 0.825 | 0.867 | 0.917 | 0.848 | 0.866 | |
| Bartlett’s Test of Sphericity | Chi-square | 1798.575 | 2834.166 | 2276.480 | 936.568 | 1423.751 |
| df | 55 | 55 | 36 | 15 | 10 | |
| Sig. | 0.000 *** | 0.000 *** | 0.000 *** | 0.000 *** | 0.000 *** | |
*** p < 0.001.
Table 4.
Correlation matrix.
| FV | SV | EV | FInn | HInn | CoInn | CL | CIm | PK | |
|---|---|---|---|---|---|---|---|---|---|
| PV | |||||||||
| FV | 1 | ||||||||
| SV | 0.402 ** | 1 | |||||||
| EV | 0.389 ** | 0.502 ** | 1 | ||||||
| CInn | |||||||||
| FInn | 0.270 ** | 0.314 ** | 0.201 ** | 1 | |||||
| HInn | 0.349 ** | 0.244 ** | 0.308 ** | 0.485 ** | 1 | ||||
| CoInn | 0.256 ** | 0.319 ** | 0.291 ** | 0.554 ** | 0.505 ** | 1 | |||
| CL | 0.543 ** | 0.529 ** | 0.468 ** | 0.452 ** | 0.417 ** | 0.372 ** | 1 | ||
| CIm | 0.580 ** | 0.419 ** | 0.517 ** | 0.328 ** | 0.352 ** | 0.324 ** | 0.578 ** | 1 | |
| PK | 0.230 ** | 0.345 ** | 0.267 ** | 0.465 ** | 0.316 ** | 0.486 ** | 0.470 ** | 0.291 ** | 1 |
** p < 0.01. EV = Epistemic Value, CInn = Customer Innovativeness, FInn = Functional Innovativeness, HInn = Hedonic Innovativeness, CoInn = Cognitive Innovativeness, CL = Customer Loyalty, CSat = Customer Satisfaction, CIm = Corporate Image, PK = Product Knowledge).
Table 5.
Structural model I path analysis.
| Dependent Variable: Customer Loyalty | |||
|---|---|---|---|
| Decision | |||
| Finn → CL | 0.173 *** | 5.028 *** | Accept |
| Hinn → CL | 0.096 ** | 2.84 ** | Accept |
| CoInn → CL | −0.004 | −0.109 | negative influence |
| FV → CL | 0.133 *** | 4.011 *** | Accept |
| SV → CL | 0.153 *** | 4.544 *** | Accept |
| EV → CL | 0.067 * | 2.025 * | Accept |
| = 125.247 | |||
* p < 0.05 ** p < 0.01 *** p < 0.001.
Table 6.
Structural model II of the moderating effect from product knowledge.
| Variables | Dependent Variable: Customer Loyalty | |||||
|---|---|---|---|---|---|---|
| β | β | β | ||||
| Customer Innovativeness | 0.507 | 13.344 *** | 0.362 | 8.521 *** | 0.362 | 8.509 *** |
| Product Knowledge | / | / | 0.285 | 6.712 *** | 0.285 | 6.669 *** |
| Customer Innovativeness * Product Knowledge | / | / | −0.003 | −0.087 | ||
| R² | 0.257 | 0.317 | 0.317 | |||
| Adjusted R² | 0.256 | 0.315 | 0.313 | |||
| F value | 178.055 *** | 119.187 *** | 79.307 *** | |||
* p < 0.05; *** p < 0.001.
Table 7.
Structural model II of the moderating effect from corporate image.
| Variables | Dependent Variable: Customer Loyalty | |||||
|---|---|---|---|---|---|---|
| β | β | β | ||||
| Perceived Value | 0.656 | 19.715 *** | 0.485 | 11.534 *** | 0.485 | 11.513 *** |
| Corporate Image | / | / | 0.264 | 6.272 *** | 0.264 | 6.269 *** |
| Perceived Value * Corporate Image | / | / | 0.006 | 0.191 | ||
| R2 | 0.431 | 0.471 | 0.471 | |||
| Adjusted R2 | 0.429 | 0.469 | 0.468 | |||
| F value | 388.696 *** | 228.517 *** | 152.07 *** | |||
* p < 0.05; *** p < 0.001.
Publisher’s Note: MDPI stays neutral with regard to jurisdictional claims in published maps and institutional affiliations. |
© 2021 by the author. Licensee MDPI, Basel, Switzerland. This article is an open access article distributed under the terms and conditions of the Creative Commons Attribution (CC BY) license (https://creativecommons.org/licenses/by/4.0/).
Share and Cite
MDPI and ACS Style
Sun, C.-C. Analyzing Determinants for Adoption of Intelligent Personal Assistant: An Empirical Study. Appl. Sci. 2021, 11, 10618. https://doi.org/10.3390/app112210618
AMA Style
Sun C-C. Analyzing Determinants for Adoption of Intelligent Personal Assistant: An Empirical Study. Applied Sciences. 2021; 11(22):10618. https://doi.org/10.3390/app112210618
Chicago/Turabian StyleSun, Chia-Chi. 2021. "Analyzing Determinants for Adoption of Intelligent Personal Assistant: An Empirical Study" Applied Sciences 11, no. 22: 10618. https://doi.org/10.3390/app112210618
Note that from the first issue of 2016, this journal uses article numbers instead of page numbers. See further details here.