Abstract
This study proposes a new damage identification method for hangers of arch bridges using the static deflection difference at the anchorage point of the hanger and the tie-beam. The relationship between the ratio of cable tension loss and the deflection difference at the anchorage point is studied. For the first time, the deflection difference influence matrix for hanger damage identification is defined. The static deflection change parameter is formulated as a function of the deflection difference influence matrix and the ratio of cable tension loss. The study shows that the percentage of cable tension loss can be obtained from the changes in static deflection at the anchorage point and the deflection difference influence matrix. Therefore, by observing a plot of the ratio of cable tension loss, the damage locations can be identified conveniently. Numerical and laboratory studies show that this method can accurately locate the damaged hanger of through-arch bridges under various scenarios. The proposed damage detection method has a clear theoretical base and is simple to operate, and it is suitable for practical engineering.
1. Introduction
The arch bridge has become a widely used bridge-type because of its large span, short construction period, and beautiful appearance. As the most critical force transfer component of a cable structure, the designer will stiffen the hangers during the design process [1]. Approximately 25% of the construction cost is spent on the cables [2,3,4]. In addition, the cable is subjected to the cyclic action of service and environmental loads and is influenced by the vortex-induced vibration and wind-rain-induced vibration. Hence, it is easy to damage and even cause the bridge to collapse in severe cases [5,6,7]. Therefore, the identification of cable damage is of great significance to ensure the safe operation of this kind of bridge [7].
The damage of cable is often detected by local detection methods. These tests are mainly aimed at the cable’s free length and anchorage zone, usually using visual inspection, ultrasonic inspection, magnetic flux leakage method, and so on [3]. Visual inspection is the most commonly used method in the annual inspection of bridges. This method is time-consuming and laborious, often exposing the inspectors to risks, and the results are highly dependent on the inspectors’ experience [8]. The ultrasonic wave needs to arrange the acoustic emission probe in advance, and the equipment required by the magnetic flux leakage method is complex. The detection signal for the hanger with protective measures is weak [7].
In the field of structural damage identification and health monitoring, vibration-based monitoring provides a relatively low-cost method of inspection. Many researchers identify the damage of cable based on the vibration method, e.g., Xiang Yiqiang et al. [9] proposed using the discrete wavelet transform to calculate the acceleration dynamic response signal’s total wavelet energy of the measuring point to identify the damage of the hanger. Curvature mode is one of the sensitive dynamic identification indexes. Many researchers have studied the damage identification of the hanger based on the curvature mode [10,11,12]. However, the modal parameters of the structure are affected mainly by operational and environmental conditions, such as traffic, wind, and temperature [5]. Sometimes the changes caused by the damage may be completely masked by the regular changes caused by the environment, which may lead to misjudgment [10,13]. Therefore, when using the vibration-based method for damage identification, the effects of environment and operating conditions must be separated from the damage. Many researchers are devoted to exploring the relationship between dynamic characteristics and environmental loads, which is undoubtedly difficult [14].
In addition, the change of cable force often indicates the damage of cable. The cable force is one of the most critical parameters of cable-stayed bridges for safety evaluation [15]. The cable damage includes surface damage and structural damage [16,17,18]. The surface damage consists of the aging and cracking of the cable protective layer, which can be detected by visual inspection; the structural damage includes broken wire, corrosion, anchor head shedding failure, etc. No matter what kind of structural damage it is, it will reduce the stiffness of the cable [19].
When the stiffness of the hanger decreases, according to the principle of structural mechanics, its tension force will be reduced. When the external load is constant, the reduced force will be shared by the tie-beam and other hangers, increasing the cable force of the adjacent hanger, thus resulting in the redistribution of the cable force. Therefore, the cable damage can be evaluated by measuring the change of cable force or cable stress [5,20,21,22]. A structure’s frequency is usually used to measure the cable force in engineering [23], but this method is not accurate in measuring the force of a short cable. The frequency change resulting from slight damage in cables is difficult to identify for long-span bridges [24]. The magnetic flux method can also be used to measure the cable force, but this method requires on-site checking of the relationship between the magnetic flux and the cable force and on-site calibration with the same cable to determine the relationship between permeability and strain of the cable [2]. Some researchers use optical fiber Bragg grating (OFBG) embedded inside the cable to detect the cable force, but it is only suitable for the cable of the newly built bridge [25].
In fact, the damage of the hanger causes the redistribution of the tension force and the changes of loads on the tie-beam. Thus, the deterioration of the hanger can be identified from the changes in the loads on the tie-beam and the deflection change of the tie-beam. In fact, static deflection has been a fundamental parameter in the SHM of many important structures including bridges [26]. Many scholars have studied cable damage identification based on deflection, e.g., Chen et al. [7] identified the damage of the hanger by the measuring point deflection difference. NAZARIAN.E et al. [2] detected the tension loss in cables by distributed deck strains. The bridge displacement testing technology is relatively mature, so using displacement to identify the damage of the hanger has certain advantages. Motivated from recent advances in deflection measurement technology, a new method that does not rely on an optimization algorithm is proposed to locate damaged hangers in through-arch bridges using the static deflection changes of the tie-beam. The purpose of this method is to solve the early damage, so it belongs to the linear damage category, in which the state of the structure before and after the hanger’s damage is assumed to be linear. A two-dimensional FEM verifies the correctness of this method. Twenty-four hypothetical damage cases are designated in the model. Then, based on a test model of through-arch bridge, the hanger’s damage is simulated to verify the method’s effectiveness. Numerical and laboratory investigations demonstrate that the proposed method can always reliably detect the damaged hangers regardless of damage locations. This method can locate the damaged hanger only based on the FEM under the completed status of the bridge and the deflection difference of the tie-beam in the damaged condition and is suitable for real bridges.
2. Damage Identification Method of Hangers
The redistribution of cable force caused by the hanger’s damage will lead to the deflection change of the tie-beam before and after the hanger’s damage. If the loads that cause the deflection change of the tie-beam can be identified, then the change of the cable force can be inferred, and the damage identification of the hanger can be carried out. According to the theory of elastic foundation beam, the main girder of the bridge of load-bearing cable system can be regarded as a continuous beam with elastic supports, and the through-tied arch bridge can be simplified to a continuous beam with elastic supports [27,28]. In the theoretical derivation of this paper, the elastically supported continuous beam is used as the mechanical model of the through-arch bridge.
As shown in Figure 1, it is a through-tied arch bridge with n hangers that bears uniformly distributed loads. In Figure 1a,b, the damaged hangers are hanger Ni and hanger Nj, respectively, as they are supposed to be completely damaged, so the corresponding mechanical model removes the damaged hanger.
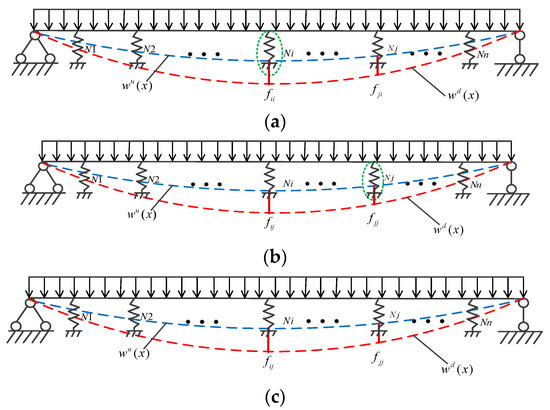
Figure 1.
Mechanical model: (a) the hanger Ni is completely damaged; (b) the hanger Nj is completely damaged; (c) unknown damaged state of the hanger.
In Figure 1, and are the deflection curve before and after the hanger’s damage. When the hanger is wholly damaged (the change of cable force of the damaged hanger is 100%), the difference of the deflection obtained from the healthy state and the wholly damaged conditions are expressed using Equation (1).
where is the deflection change at the anchorage point of the hanger and the tie-beam.
When the damaged state of the hanger is unknown (see Figure 1c), the deflection difference at the anchorage point of hanger Ni and the tie-beam can be expressed as Equation (2).
where is the deflection change at the anchorage point of the hanger Ni and the tie-beam, and are the deflection difference at the anchorage point of the tie-beam and the completely damaged hanger Ni and Nj (see Figure 1a,b), respectively, is the deflection difference at the anchorage point of the tie-beam and the hanger Ni when the hanger Nj is completely damaged (see Figure 1b), and is a column vector composed of the reduction ratio of cable force of each hanger. When a hanger is damaged alone, it is a column vector with only one non-zero element, and when the number of the damaged hangers is m, it is a column vector with m non-zero elements. is caused by the deflection difference of multiple hangers damaged at the same time and is not equal to the sum of the deflection differences corresponding to the separate damage of each damaged hanger.
To illustrate the existence of , we take the simultaneous damage of two hangers as an example, to prove that the deflection difference of simultaneous damage is not equal to the sum of the deflection difference of two hangers damaged separately. The cable loss occurs separately at hanger Ni and Nj in Figure 2a,b. The damage degree is 10% and 20%, respectively, while the hangers Ni and Nj are simultaneously damaged in Figure 2c, and the damage degree is 10% and 20%, respectively. It can be seen that the corresponding structures of the three cases are different after the hanger is damaged. Therefore, these damage conditions do not conform to the superposition principle, as the premise of the superposition principle requires that the structure does not change. Therefore, the sum of the deflection difference corresponding to Figure 2a,b is not equal to the deflection difference corresponding to Figure 2c, then Equation (3) can be obtained.
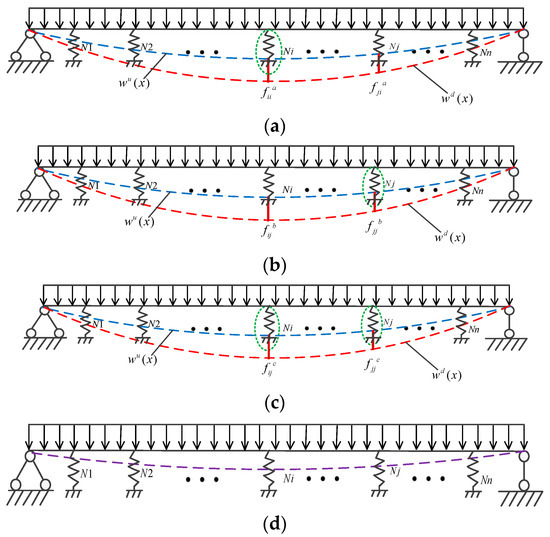
Figure 2.
The difference of deflection changes between the simultaneous damage of two hangers and the two hangers damaged separately: (a) the damaged hanger is Ni; (b) the damaged hanger is Nj; (c) the damaged hangers are Ni and Nj;(d) the result of superposing the three deflections of (a–c).
If superposing the three deflections, using the deflection difference caused by the simultaneous damage of two cables to subtract the deflection difference corresponding to the individual damage of each cable, the result will not be zero, shown in Figure 2d.
This process shows that the deflection difference caused by two hangers damaged simultaneously is not equal to the sum of the deflection difference caused by the two hangers damaged separately. Furthermore, the difference of deflection caused by simultaneous damage of multiple hangers is not equal to the sum of the deflection difference of multiple hangers damaged separately. Therefore, the difference between them at the anchorage point of hanger Ni and the tie-beam is defined as . Thus, Equation (3) can be rewritten into Equation (4). It is easy to find that when a single hanger is damaged, is equal to zero. Otherwise, it is not equal to zero.
Based on this, n displacement equations can be established as Equation (5).
Write Equation (5) in the form of a matrix as Equation (6).
Or rewrite it to Equation (7).
where is the deflection difference influence matrix for hanger damage identification, is the deflection difference series vector at the anchorage point of each hanger and tie-beam under arbitrary damage state, and is the difference vector between the deflection change caused by simultaneous damage of multiple hangers and multiple hangers damaged separately. Equation (8) can be obtained from Equation (7).
Solve Equation (8) to get Equation (9).
When a single hanger is damaged, is a zero vector . Otherwise, .
3. Verification by a Two-Dimensional Finite Element Model
3.1. Finite Element Modeling
A two-dimensional finite element model illustrated in Figure 3 is used to verify the correctness of the previous theoretical derivation. The arch height (H) ratio to length (L) is 1:4, the span is 50 m, and the arch height is 12.5 m. The cross-section of the arch rib and the tie-beam is a 2000 mm × 2000 mm square tube with a wall thickness of 40 mm. The hanger adopts a circular section with a diameter of 120 mm, and the bridge deck is subjected to a uniformly distributed load of 9.8 KN/m.
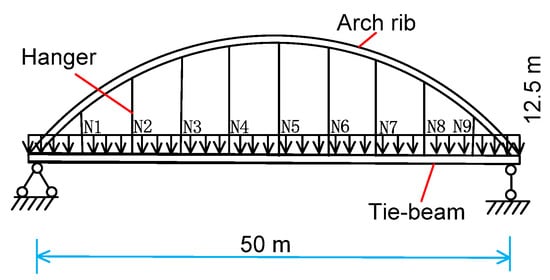
Figure 3.
Diagram of the two-dimensional FEM.
3.2. Extreme Damage Cases and Identification Results
Eighteen extreme damage scenarios are designated in the FEM, and all damage cases are attributed to cable failure. Table 1 lists all the damage conditions investigated in the FEM.

Table 1.
Eighteen damage conditions simulated by FEM.
The damage of one single hanger and the simultaneous damage of two hangers were simulated. The damage condition can be divided into two categories. DC1–DC12 is the first category, which belongs to the one single hanger damaged at a time; DC13–DC18 is the second category, considering the damage of two hangers simultaneously.
In the finite element model, the complete damage of each hanger (that is, the cable force reduction ratio is 100%) is simulated by deleting the damaged hanger. The deflection difference between the complete damage of each hanger and the healthy state can be obtained from the model. As a result, the deflection difference influence matrix can be obtained, and the result is plotted in Figure 4. It can be seen from Figure 4 that when each hanger is completely damaged separately, the deflection difference vector will reach a clear peak at the damaged hanger. When the damage occurs in the symmetrical position, the deflection difference vector is also symmetrical.
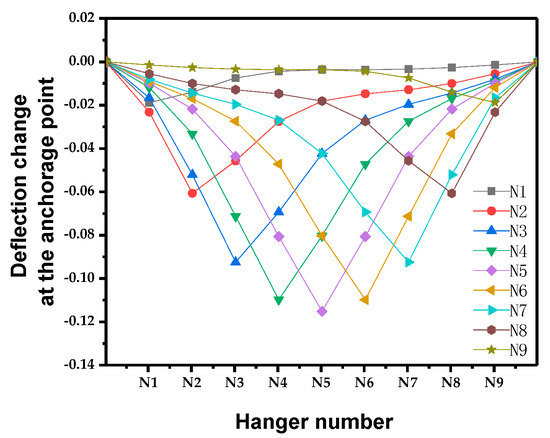
Figure 4.
Deflection change of each anchorage point when N1–N9 is wholly damaged.
In the FEM, the damage degree of the hanger is simulated by changing the cross-sectional area of the hanger. The deflection difference vector at the anchorage point between the hanger and the tie-beam under each damage condition is put forward. Then, the deflection difference vector and the influence matrix of the deflection difference are brought into Equation (9). Under each damage condition, the proportion vector of cable force reduction of each hanger can be obtained. The results are plotted in Figure 5 and Figure 6.
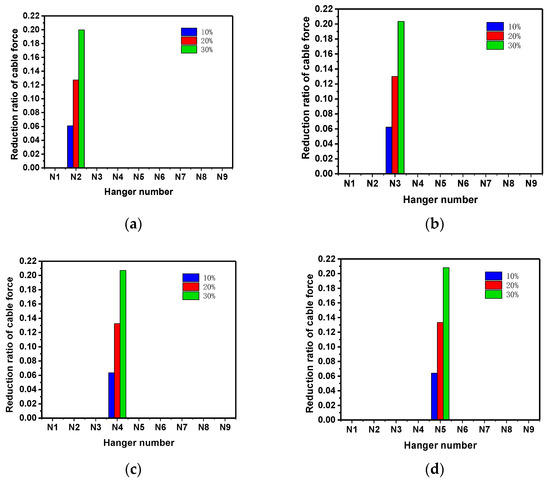
Figure 5.
Identification results for DC1–DC12: (a) the preset damage hanger is N2; (b) the preset damage hanger is N3; (c) the preset damage hanger is N4; (d) the preset damage hanger is N5.
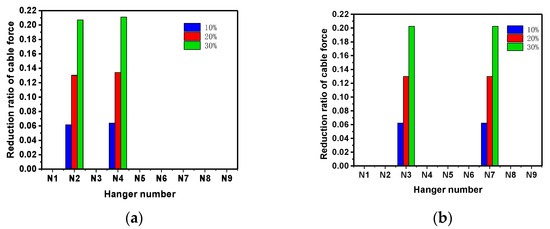
Figure 6.
Identification results for DC13–DC18. Identification results for DC1–DC12: (a) the preset damage hangers are N2 and N4; (b) the preset damage hangers are N3and N7.
From Figure 5, it can be seen that when a single hanger is damaged, the recognition result is perfect. As can be seen from the figure, the reduction ratio of cable force of the damaged hanger is proportional to the degree of damage. The reduction of cable force only occurs in the damaged hanger. Therefore, the damaged hanger of Figure 5a–d can be quickly and easily located, which is N2, N3, S4N4, and N5, respectively. The ratio of cable force reduction and quantitative identification results are shown in Table 2. From Table 2, it can be seen that when a single hanger is damaged, the identification result of the cable force reduction ratio is completely consistent with the actual reduction ratio. However, the reduction ratio of cable force is less than the degree of damage, so this method can only relatively quantify the degree of damage.
Table 2.
Actual cable force reduction ratio and identification results (one hanger damaged alone).
The identification results of simultaneous damage of two hangers are shown in Figure 6. As can be seen from Figure 6a,b, the hangers with reduced cable force are N2 and N4, and N3 and N7, respectively. Therefore, the damaged hangers can be identified as N2 and N4, and N3 and N7, respectively.
It can be concluded from Figure 6 that when two hangers are damaged simultaneously, the damaged hanger’s location can still be located reliably, and it can be observed that the cable force decreases only at the damaged hanger. However, the quantitative identification results are not accurate. The real ratio of cable force reduction and quantitative identification results of two hangers damaged simultaneously is shown in Table 3. As shown in Table 3, the identification result is not equal to the actual reduction ratio of cable force. Because the identification result is the sum of the deflection difference caused by the two hangers damaged separately, it is not equal to the deflection difference caused by two hangers damaged simultaneously, which is consistent with the results derived above.
Table 3.
Actual cable force reduction ratio and identification results (two hangers damaged simultaneously).
The finite element example verifies the correctness of the above formula derivation. When a single hanger is damaged alone, the proportional column vector of cable force reduction is a column vector with only one non-zero element. The identified cable force reduction ratio is completely consistent with the actual cable force reduction ratio. When two or more hangers are damaged simultaneously, the identification result is the superposition result of two hangers damaged separately, which is not equal to the actual cable force reduction ratio and is consistent with the previous derivation results.
3.3. Influence of Material Creep and Structural Stiffness Degradation
Because creep and the degradation of the stiffness of the bridge will cause the deflection change, it is necessary to discuss their influence on the identification results. The creep can be simulated by the effective modulus method. That is, the effect of creep can be considered by reducing the elastic modulus. The stiffness degradation of the bridge can also be simulated by reducing the elastic modulus. Therefore, the creep and structural stiffness degradation are simulated by decreasing the modulus of elasticity. Four typical damage conditions are preset for verification, as shown in Table 4. The identification results are shown in Figure 7.
Table 4.
Four damage conditions that considering the creep and stiffness degradation.
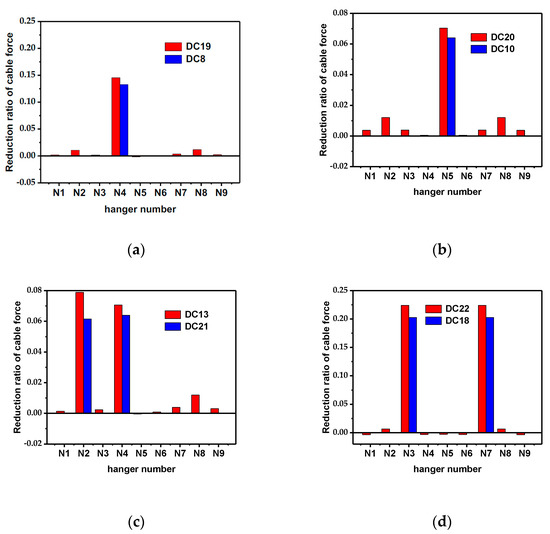
Figure 7.
Identification results for considering creep and stiffness degradation. (a) results for DC8&DC19; (b) results for DC10&DC20; (c) results for DC13&DC21; (d) results for DC18&DC22.
It can be clearly seen from Figure 7 that regardless of the location of the failure, the damaged hanger can be accurately located. Another observation that can be drawn from this figure is that when creep and stiffness degradation are considered, the ratio change of tension force of the damaged hanger is increased. This may be because the influence matrix for identifying the damage of the hanger is obtained from the benchmark model. From the figure, it can be seen that the recognition result is ideal, and for the actual bridge, the specific values of creep and stiffness degradation cannot be obtained, so the damage recognition can only be performed based on the influence matrix under the benchmark state.
4. Experimental Verification
4.1. Introduction of the Test Model
The test model is not according to a specific bridge but mainly references to a concrete-filled steel tubular arch bridge with a span of 90 m, and the size of the model was designed and determined according to the structural layout of the general through-arch bridge and laboratory conditions. The model bridge is illustrated in Figure 8. The total length of the model bridge is 3.6 m, the width is 0.6 m, the height is 0.8 m, and the linear shape is a quadratic parabola. The arch axis equation is: . The cross-section of the arch rib is 60 mm × 5 mm circular steel pipe. To study the influence of different rib-beam stiffness ratios, a set of arch ribs with a small cross-section was also prepared. The thickness of the bridge deck is 4 mm. The cross-section of the crossbeam and the tie-beam is L-shaped. Three wind braces are arranged in the whole bridge, and its cross-section is a circular steel pipe with a cross-section of 50 mm × 5mm.
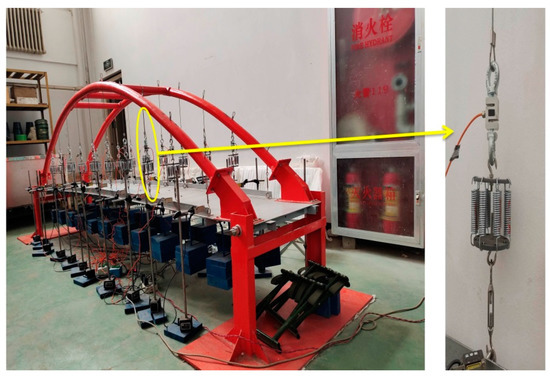
Figure 8.
Test model diagram of the through-arch bridge.
The test model is intended to research the damage in its early stages and therefore falls into the linear damage category in which the structure is assumed linear in the pre-and post-damaged states. Because its primary purpose is to identify the hanger damage according to the deflection change of the tie-beam, it is not entirely scaled according to the raw materials. Steel was used instead of concrete-filled steel tubes. To accurately control the preset degree of damage, the hanger was specially designed in this model. The hanger is mainly composed of four parts in series including, a wire rope segment with a diameter of 3 mm, load cell for cable force, spring segment (consisting of 8 springs with the same stiffness in parallel), and small flanges for adjusting cable force (see Figure 8).
The test bridge was instrumented with a dense array of sensors, including eighteen displacement sensors with an accuracy of 0.01 mm, and eighteen load cell sensors for cable force. The diagram of the sensors is shown in Figure 9 and Figure 10, illustrating the locations of the deflection sensors. The measurement point of the south side is S1–S9, and the north side is N1–N9.
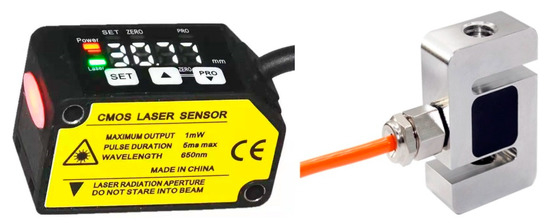
Figure 9.
Digital display laser displacement sensor and load cell sensor of cable force.
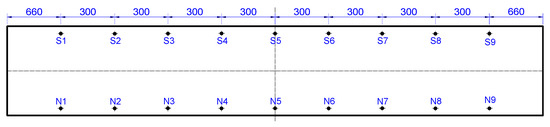
Figure 10.
Illustration of the deflection sensor locations (S1:S9, N1:N9) on the bridge deck.
4.2. Damage Cases
Twenty-four damage cases were simulated by the laboratory test model. All damage conditions can be divided into two categories. EDC1–EDC16 belongs to the first category, which simulates one single hanger damaged at a time, and the hangers S2–S5 on the south side of the model bridge were preset as the damaged hanger separately. The degree of damage was set to 12.5%, 25%, 37.5% and 50%, respectively. EDC17–EDC24 belongs to the second category, in which damage occurred in two hangers simultaneously. The degree of damage was also set to 12.5%, 25%, 37.5%, and 50%, respectively. Table 5 lists all the damage conditions investigated in the test model.
Table 5.
Twenty-four damage conditions considered by the test model.
4.3. Damage Identification Results
The model cable force was adjusted to about 350 N, and the south hanger cable force is shown in Figure 11. The cable force is uniform, and this state can be regarded as the completed state of the bridge.
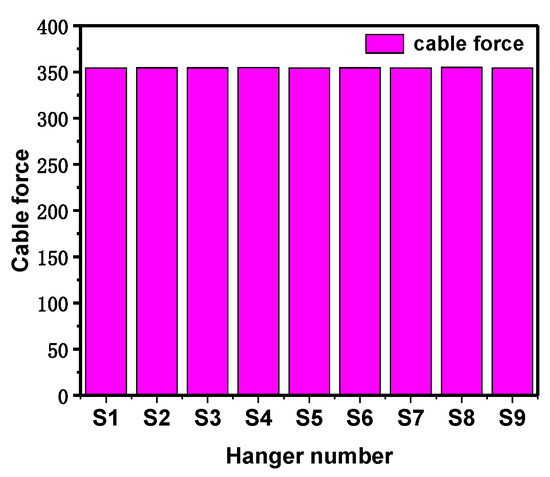
Figure 11.
Cable force of south hangers.
The complete damage (the cable force is reduced by 100%) of each hanger on the south side was simulated by removing the damaged hanger itself. The difference of deflection at the anchorage point of hanger and tie-beam under healthy state and various damage conditions was obtained, and the results are plotted in Figure 12. Then, the deflection difference influence matrix of the model bridge in this state was also obtained.
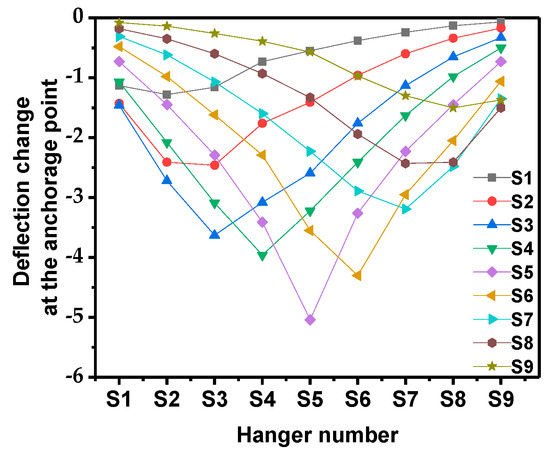
Figure 12.
Deflection difference at each anchorage point when the hanger on the south side of the model bridge is wholly damaged.
It can be seen from Figure 12 that the influence matrix obtained by the model bridge has the same characteristics as that obtained by the numerical example, and there is a peak in the deflection difference at the location of the damaged hanger. When simulating each damage condition, the model test is realized by removing the corresponding number of springs. When the damage degree of the simulated hanger is 12.5%, 25%, 37.5%, and 50%, 1–4 springs need to be removed accordingly. This method is also the essence of this model, making it can accurately control the preset degree of damage and repeatedly simulate various damage scenarios.
The damage condition EDC1–EDC16 simulates the damage of a single hanger, and the identification result is shown in Figure 13. Figure 13a shows that the hanger S2 is damaged by 12.5%, 25%, 37.5% and 50%, respectively. In the test, the damage is simulated by removing the spring at the lower end of hanger S2. By making a difference in the static deflection of the healthy state and damaged states, the deflection difference vectors at each anchorage point under different damage degrees are obtained.
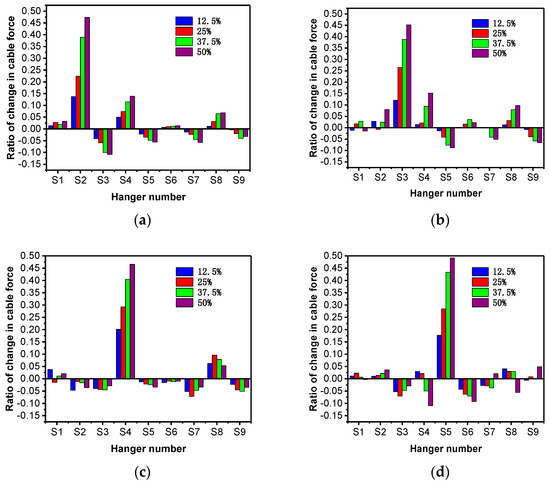
Figure 13.
Damage identification results for EDC1–EDC16: (a) the preset damage hanger is S2; (b) the preset damage hanger is S3; (c) the preset damage hanger is S4; (d) the preset damage hanger is S5.
The deflection difference vector and the influence matrix are brought into Equation (9), and the change vector of the cable force of the damaged hangers is obtained, and the result is plotted in Figure 13a. As shown in Figure 13a, the ratio change of cable force at the damaged hanger is much larger than that at the undamaged, and the identification result is not a vector with only one non-zero element, which is slightly different from the numerical results because there are inevitable measurement errors in the test process. However, it is easy to locate the damaged hanger from the figure.
It can be seen from Figure 13b–d that the damaged hanger is S3, S4, and S5, respectively. Therefore, when a single hanger is damaged, this method can well locate the damage. Another observation can be made that the identified results increase with the increase of the degree of damage, so the proposed method can also relatively quantify the degree of damage.
The damage condition DC17–DC24 simulates the damage of two hangers simultaneously, and the identification result is shown in Figure 13. It can be seen from Figure 14a that the change of cable force at the damaged hanger is also much larger than that at the undamaged place. Through this feature, it is easy to locate the damaged hanger, S4 and S5. Another observation that can be made is when the damage degree increases, the identification result also increases. This method can also be relatively quantitative when two hangers are damaged simultaneously, but the quantitative damage is more complicated. It needs further study of the mutual influence among the simultaneously damaged hangers.
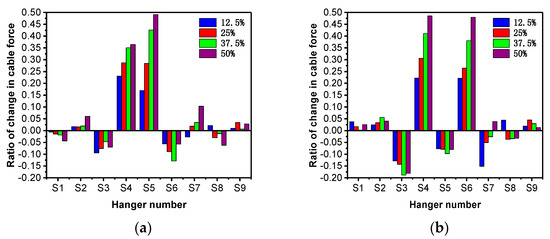
Figure 14.
Damage identification results for EDC17–EDC24: (a) the preset damage hangers are S4and S5; (b) the preset damage hangers are S4 and S6.
From Figure 14b, the recognition results show that the cable force of hangers S4 and S6 decreases, and the reduced value is obviously larger than that of other hangers. It can be inferred that the damaged hangers should be S4 and S6 which corresponds to the preset damage. In addition, it is found that when the damaged hanger is in a symmetrical position, the damage results are not completely symmetrical, which should be due to the fact that it is impossible to ensure that the initial state of each damage condition is completely consistent during the test. It can be seen from the test results that regardless of the location of the damage and the number of the damaged hangers, the proposed method can always reliably locate the damaged hangers.
4.4. Experimental Verification of Hanger Damage Identification Considering Creep and Bridge Stiffness Degradation
As analyzed above, both creep and overall stiffness degradation can be performed by reducing the modulus of elasticity in the numerical simulation. The preset damage cable for single cable damage conditions was S3, and the damage degree was 12.5%, 25%, 37.5, and 50%, respectively; the preset damage cable for double cable damage conditions was S3 and S7, and the damage degree was also set to 12.5%, 25%, 37.5 and 50%, and the recognition results are shown in Figure 15.
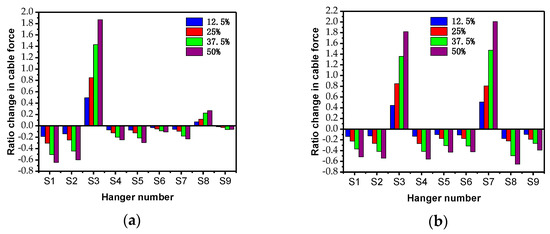
Figure 15.
Model test identification results for considering creep and stiffness degradation: (a) the preset damage hanger is S3; (b) the preset damage hangers are S3 and S7.
It can be seen from Figure 15 that the method proposed in this paper can accurately locate the damaged hanger when considering creep and overall stiffness degradation. Another observation drawn from this figure is that the reduction ratio of tension of the damaged cable has exceeded one. This is mainly because the cable damage occurs after the creep and stiffness degradation of the structure, and the corresponding deflection difference of the tie-beam is bound to be larger than that when only cable damage occurs, so the identification results will also become larger. The results show that the method is robust to creep and stiffness degradation.
5. Discussions on Practical Applications
For a real bridge, the vector can be obtained from the deflection difference influence matrix of the completion stage of the bridge and the deflection difference at the anchorage point of each hanger and tie-beam under the damage state. Then, the location of the damaged hanger can be located. If a single hanger is damaged, the reduction ratio of cable force of the damaged hanger can also be obtained.
After the successes of numerical and experimental studies, further verification on large-scale and full-scale structures will help to learn more about the method’s capabilities under different field conditions. Given the application on the actual bridge, the following aspects are worth discussing.
This paper presents a method to identify the damage of the hanger by using the influence matrix of static deflection difference of tie-beam. Static deflection difference influence matrix of the tie-beam for hanger damage identification can be obtained using the FEM of the bridge under completion state. The difference of static deflection of each anchorage point in any damage state can be obtained from the line shape difference measured under non-traffic conditions (such as at night) and in the completed state. This method can detect bridges regularly or after extreme events such as earthquakes, floods, and hurricanes. When the deflection of the bridge needs to be obtained, it can be measured with a level gauge.
6. Conclusions
The identification formula of the change ratio of tension was obtained by defining the deflection difference influence matrix of the through-arch bridge. Then, this was verified by a two-dimensional finite element model and a test model. The results are as follows.
The deflection difference between the anchoring point of each hanger and the tie-beam caused by simultaneous damage of multiple hangers is not equal to the sum of the deflection difference of the corresponding point caused by the same degree of damage of each hanger.
The position of the damaged hanger can be located by using the deflection difference influence matrix defined in this paper. The reduction ratio of the cable force of the damaged hanger can be roughly identified when a single hanger is damaged. When two hangers are damaged at the same time, the damage location also can reliably be identified. However, the identification of damage degree is not ideal.
This method only needs the influence matrix in the completed bridge state when identifying the real bridge damage. It does not need to be based on the modified FEM when identifying the location of the damaged hanger but only needs the deflection change of each anchorage point in the damaged state. The method is simple and suitable for on-site engineering. In addition, the method is robust to creep and stiffness degradation of the whole bridge.
Author Contributions
Conceptualization, W.W.; investigation, W.W.; validation, M.S., W.W.; writing—original draft preparation, W.W.; writing—review and editing, M.S., W.W. All authors have read and agreed to the published version of the manuscript.
Funding
This work was funded by the National Natural Science Foundations of China (Grant No.51278315).
Institutional Review Board Statement
Not applicable.
Informed Consent Statement
Not applicable.
Data Availability Statement
The current study data are publicly available online (https://figshare.com/s/f619669f77dabebe18d2 accessed on 1 November 2021) for research purposes. No participants’ personal information (e.g., name or address) was included in this study.
Acknowledgments
This paper is a part of the research content of the National Natural Science Foundation of China. The authors extend their appreciation to the government for its financial support.
Conflicts of Interest
The authors declare no conflict of interest.
References
- García-Guerrero, J.M.; Jorquera-Lucerga, J.J. Effect of Stiff Hangers on the Longitudinal Structural Behavior of Tied-Arch Bridges. Appl. Sci. 2018, 8, 258. [Google Scholar] [CrossRef] [Green Version]
- Nazarian, E.; Ansari, F.; Zhang, X.; Taylor, T. Detection of Tension Loss in Cables of Cable-Stayed Bridges by Distributed Monitoring of Bridge Deck Strains. J. Struct. Eng. 2016, 142, 04016018. [Google Scholar] [CrossRef]
- Mehrabi, A.B. In-Service Evaluation of Cable-Stayed Bridges, Overview of Available Methods and Findings. J. Bridge Eng. 2006, 11, 716–724. [Google Scholar] [CrossRef]
- Bao, Y.; Shi, Z.; Beck, J.L.; Li, H.; Hou, T.Y. Identification of time-varying cable tension forces based on adaptive sparse time-frequency analysis of cable vibrations. Struct. Control. Health Monit. 2016, 24, e1889. [Google Scholar] [CrossRef]
- Alamdari, M.M.; Dang Khoa, N.L.; Wang, Y.; Samali, B.; Zhu, X. A multi-way data analysis approach for structural health monitoring of a cable-stayed bridge. Struct. Health Monit. 2019, 18, 35–48. [Google Scholar] [CrossRef]
- Li, H.; Ou, J.P. The state of the art in structural health monitoring of cable-stayed bridges. J. Civil Struct. Health Monit. 2016, 6, 43–67. [Google Scholar] [CrossRef]
- Chen, H.; He, W.; He, R. Damage identification for suspender of through and half-through arch bridges based on displacement differences of monitoring points. China J. Highw. Transp. 2012, 25, 83–88. [Google Scholar]
- Ho, H.-N.; Kim, K.-D.; Park, Y.-S.; Lee, J.-J. An efficient image-based damage detection for cable surface in cable-stayed bridges. NDT E Int. 2013, 58, 18–23. [Google Scholar] [CrossRef]
- Xiang, Y.Q.; Jia, Y.K. Damage detection of hangers in arch bridges based on relative variation of wavelet total energy. J. Zhejiang Univ. (Eng. Sci.) 2017, 51, 870–878. [Google Scholar]
- Peeters, B.; De Roeck, G. One-year monitoring of the Z24-Bridge: Environmental effects versus damage events. Earthq. Eng. Struct. Dyn. 2001, 30, 149–171. [Google Scholar] [CrossRef]
- Wang, S.J. Design and Damage Static & Dynamic Analysis of a Concrete-Filled Steel Tube Arch Bridge Model. Master′s Thesis, Shantou University, Shantou, China, 2004. [Google Scholar]
- Huang, C.; Luo, R.; Han, X.J. Damage detection of tied-arch bridge based on curvature modal method. J. Nanjing Tech Univ. Nat. Sci. Ed. 2015, 37, 88–93. [Google Scholar]
- Farrar, C.R.; Doebling, S.W.; Cornwell, P.J.; Straser, E.G. Variability of modal parameters measured on the Alamosa Canyon bridge. In Proceedings of the International Modal Analysis Conference, Orlando, FL, USA, 3–6 February 1997. [Google Scholar]
- Soo Lon Wah, W.; Chen, Y.-T.; Roberts, G.W.; Elamin, A. Separating damage from environmental effects affecting civil structures for near real-time damage detection. Struct. Health Monit. 2018, 17, 850–868. [Google Scholar] [CrossRef]
- Zhao, X.; Yu, Y.; Hu, W.; Jiao, D.; Han, R.; Mao, X.; Li, M.; Ou, L. Cable Force Monitoring System of Cable Stayed Bridges Using Accelerometers Inside Mobile Smart Phone. Proc. SPIE—Int. Soc. Opt. Eng. 2015, 9435, 94351H. [Google Scholar]
- Shen, P.; Yan, X.R. Analysis of cable replacement method for stay cables of Yonghe Bridge in Tianjin. J. Highw. Transp. Res. Dev. 2011, 4, 47–51. [Google Scholar]
- Zhou, P.; Huang, L.G. Construction control and monitoring of cable replacement project of Huxi bridge in Liuzhou. Urban Roads Bridges Flood Control 2007, 3, 70–74. [Google Scholar]
- Mehrabi, A.B.; Ligozio, C.A.; Ciolko, A.T.; Wyatt, S.T. Evaluation, Rehabilitation Planning, and Stay-Cable Replacement Design for the Hale Boggs Bridge in Luling, Louisiana. J. Bridge Eng. 2010, 15, 364–372. [Google Scholar] [CrossRef]
- Zhong, J.T. Study on Relative Slip between Wires and Damage Identification of Stayed Cables. Ph.D. Thesis, South China University of Technology, Guangzhou, China, 2019. [Google Scholar]
- Zhang, L.; Qiu, G.; Chen, Z. Structural health monitoring methods of cables in cable-stayed bridge: A review. Measurement 2021, 168, 108343. [Google Scholar] [CrossRef]
- Lin, S.-W.; Yi, T.-H.; Li, H.-N.; Ren, L. Damage Detection in the Cable Structures of a Bridge Using the Virtual Distortion Method. J. Bridge Eng. 2017, 22, 04017039. [Google Scholar] [CrossRef]
- Mohammad Zarbaf, S.E.H.A.; Norouzi, M.; Allemang, R.J.; Hunt, V.J.; Helmicki, A.; Nims, D.K. Stay Force Estimation in Cable-Stayed Bridges Using Stochastic Subspace Identification Methods. J. Bridge Eng. 2017, 22, 4017055. [Google Scholar] [CrossRef]
- Kim, B.H.; Park, T. Estimation of cable tension force using the frequency-based system identification method. J. Sound Vib. 2007, 304, 660–676. [Google Scholar] [CrossRef]
- Tan, Y.; An, Y.; Zhong, Y.; Ou, J. Experimental and numerical studies on a test method for damage diagnosis of stay cables. Adv. Struct. Eng. 2017, 20, 245–256. [Google Scholar]
- Li, H.; Ou, J.; Zhou, Z. Applications of optical fiber Bragg gratings sensing technology-based smart stay cables. Opt. Lasers Eng. 2009, 47, 1077–1084. [Google Scholar] [CrossRef]
- Le, N.; Thambiratnam, D.; Nguyen, A.; Chan, T. A new method for locating and quantifying damage in beams from static deflection changes. Eng. Struct. 2018, 180, 779–792. [Google Scholar] [CrossRef]
- Huang, Z.K. Damage Identification of the Main Girder of Cable-Stayed Bridge and Arch Bridge Based on the Cable Force Influence Line. Master′s Thesis, Guangzhou University, Guangzhou, China, 2016. [Google Scholar]
- Huang, Y.; Wang, Y.; Fu, J.; Liu, A.; Gao, W. Measurement of the real-time deflection of cable-stayed bridge based on cable tension variations. Measurement 2018, 119, 218–228. [Google Scholar] [CrossRef]


Publisher’s Note: MDPI stays neutral with regard to jurisdictional claims in published maps and institutional affiliations. |
© 2021 by the authors. Licensee MDPI, Basel, Switzerland. This article is an open access article distributed under the terms and conditions of the Creative Commons Attribution (CC BY) license (https://creativecommons.org/licenses/by/4.0/).