1. Introduction
The COVID-19 pandemic has shown how easily the virus can spread, and how it can affect the health of communities and the global economy. The probability of a new pandemic has not decreased, and the spread of new mutations of the SARS-CoV-2 virus remains a threat. Therefore, it is worth drawing conclusions from the current situation in order to be prepared for future threats. The procedures and tools developed now have the potential to significantly support the fight against future pathogens.
The initial phase of the COVID-19 pandemic showed that symptom-based screening and diagnostics may be a challenge, especially when there are few obvious and unambiguous symptoms differentiating the disease from other infections. The list of symptoms associated with COVID-19 in the spring of 2020 did not allow for an easy and unequivocal distinction of COVID-19 from other influenza-like illnesses. In this case, the experience of doctors plays an important role in the diagnosis of the disease, the acquisition of which takes time and relies on the number of cases of the disease encountered.
The diagnosis of the patient’s condition requires experience supported by reliable and unambiguous, straightforward diagnostic methods. Limited testing capacity is one of the most significant problems faced by healthcare systems. The problem of the lack of efficient and widespread testing may result from both the lack of infrastructure and the cost of a single test.
Table 1 illustrates the costs of the RT-PCR test in Poland during the pandemic.
The lack of widespread experience of healthcare professionals in the early phase of the epidemic and the cost of widespread testing, which could be significant and prohibitive in some countries, motivated research to apply machine learning methods to initial screening. Literature studies show that machine learning methods were verified and gave good results for a number of diagnostic tasks [
1]. Various types of classification models were studied in the past for the diagnosis of patients with diseases such as Ebola virus disease [
2], AIDS [
3], heart disease [
4], cancer [
5], or diabetes [
6]. Referring to the listed applications of machine learning in diagnostics, it can be concluded that prognostic models can provide a valuable summary of clinical knowledge and can be useful when such expertise is unavailable [
2].
The aim of this study is to show that, based on machine learning (ML) methods, it is possible to create a system that allows for effective symptom-based screening, even for diseases with ambiguous symptoms, as in the case of COVID-19. By creating such a system, it can be demonstrated that, at an early stage of the epidemic, when knowledge about the course of the disease is not common, the experiences available in major medical units can be encapsulated in ML models and disseminated by means of a web application. Additionally, the goal of this research is to present how such a system can be designed. Therefore, this work provides the system architecture and workflow, as well as the description of the analytical method generation process. In this way, this paper shows what components and activities are required to create a screening solution allowing savings in testing and ensuring acceptable quality from a medical point of view.
In this work, the assumptions for the proposed system are presented, as well as a case study in which the method of generating, assessing, and explaining the created classifier is shown in detail. Moreover, the performed analysis resulted in an online service (
https://decode.polsl.pl, accessed on 25 October 2021) available for anyone who needed support in COVID-19 screening in the early stages of the pandemic. Due to the mutations of the SARS-CoV-2 virus, the developed screening models, which are presented in this paper and implemented on the online service, are no longer valid. However, if there was such a need, new models could be generated according to the procedure presented in the following sections.
The contribution of this work is manifold and it consists of the following elements:
the presentation of the architecture and workflow of the screening support system, which, at a time when little is known about the disease, can, with a high degree of certainty, screen out patients and identify those who most probably do not have the disease, and redirect the rest for further costly diagnostic tests;
the case study presenting the method for the generation of classifiers, where the models are tuned to an assumed acceptable threshold of negative predictive values so that the results allow for the effective screening of patients for COVID-19;
an explanation of the obtained classification models, enabling the users to understand the basis of the decision made by the model;
a new data set based on questionnaires collected in a hospital in Poland and the data set preparation, processing, characterisation, and visualisation, leading to the identification of COVID-19 characteristics.
The structure of this paper is as follows.
Section 2 presents an overview of previous research related to the topic of this work. The proposed workflow and system architecture are presented in
Section 3.
Section 4 outlines the characteristics of the shared data set being the basis for classification models.
Section 5 presents an automatic machine learning approach and advanced approach to produce a classifier. The latter consists of advanced data preparation steps and the generation and tuning of two models.
Section 6 focuses on the evaluation of the created models.
Section 7 is devoted to the issue of model explanation, and, additionally, it addresses the issue of model adaptation and the cost reduction that can be realised by the presented system.
Section 8 outlines the developed web application, which is able to make an initial diagnosis (screening) based on the given symptoms.
Section 9 concludes the paper.
2. Related Work
The involvement of analysts in research related to the SARS-CoV-2 virus pandemic is very broad, ranging from the analysis of genetic data [
7] to predicting the development of the epidemic [
8,
9,
10]. This state-of-the-art review focuses on how data science was involved in preventing and understanding the COVID-19 pandemic. Due to the great involvement of the scientific community, many studies have been published dealing with this issue from different perspectives. Many works on the use of machine learning methods to diagnose COVID-19 have been covered in review articles such as [
11,
12,
13,
14,
15].
The work [
11] presents the analysis of the research dynamics in the field between January and May 2020. In this work, based on the frequency of occurrence of various methods, the following classes of solutions were distinguished: deep learning approaches (CNN, LSTM, and others), mathematical and statistical methods, random forest, SVM, and others (e.g., linear regression, XGBoost). The described approaches were applied to various data types with a predominance of X-ray images and achieved good results. However, the lack of real data was explicitly highlighted in the work.
An extensive meta-analysis (107 studies with 145 models) of the works published between January and April 2020 is presented in [
12]. In this study, three classes of predictive models are distinguished, and these are models for use in the general population, for COVID-19 diagnosis and prognosis. Among 91 diagnostic models, 60 focus on image analysis, while nine predict the disease severity. Out of the remaining 22 works presenting diagnostic models not based on imaging, only two studies were based on data sets containing more than 1000 examples.
The reviews [
13,
14,
15] discuss the possibility of using machine learning in various aspects related to COVID-19, such as epidemiology, spreading, diagnosis, treatment, or psychological health impact. The examples of approaches presented in these works are focused on diagnostics based on image and clinical data (e.g., blood test results).
Among the studies presenting diagnostic machine learning-based models, the works presented below can be distinguished as the most interesting due to the size of data set, questionnaire-based data features, and utilised analytical approaches.
The work [
16] presents a statistical analysis of data attributes and the generation of a multivariate logistic regression model on a data set consisting of 1702 individuals (579 were SARS-CoV-2-positive and 1123 -negative), whose data were collected through an online application. The attributes describing each example included personal characteristics (sex, age, BMI) and flu-like symptoms (e.g., fever, persistent cough, loss of taste and smell, etc.).
The study [
17] presents an approach where, based on routinely collected surveillance data, a multiple model using logistic regression was generated. The data set that was the basis of the analysis consisted of 5739 patient records (1468 were SARS-CoV-2-positive and 4271 -negative) collected in Brazil.
The analysis presented in [
18] is based on the same data set as in this work. However, the aim of the research presented in these two studies is different. The work [
18] presents how the screening model optimisation towards the selected classification quality measure (e.g., combining sensitivity and specificity) can impact the final model results. This kind of knowledge can support an expert in adjusting the methods to the goal of the analysis.
There are numerous reported data sets related to COVID-19 [
19]. Such data sets include information on COVID-19 diagnosis, case reporting, transmission estimation, sentiment analysis from social media, and semantic analysis from the collection of scholarly articles. Most of the COVID-19 diagnosis data are based on image (CT scans, X-ray images) analysis [
20,
21,
22,
23].
A data set that can be referred to due to the subset of similar features was collected by Carbon Health, a healthcare provider in the US [
24]. The anonymised data of Carbon Health patients were collected between March and June 2020. The data include the clinical characteristics (epifactors, comorbidities, vitals, clinician-assessed symptoms, patient-reported symptoms) and laboratory results of patients at the date of service.
Another data set [
25] comes from the Hospital Israelita Albert Einstein, in Sao Paulo, Brazil. The created set consists of data collected from hospital patients and it contains 5644 cases, of which 10% are SARS-CoV-2-positive. The attributes consist of virus, blood, and urine test results, and internal assignment to a hospital ward. This data set was analysed in [
26] and partially analysed in [
27]. The study [
26] presents the results of several different classification methods (logistic regression, neural network (multi-layer perceptron), random forest, support vector machine, and gradient boosting) in terms of their quality. Three directions of analysis were chosen in this study, covering the identification of: patients that are likely to receive a positive SARS-CoV-2 test result, COVID-19 patients that are likely to require hospitalisation, and COVID-19 patients that are likely to require intensive care. Additionally, within each direction, the feature importance was identified.
In response to the growing demand for information on modern IT services developed in the healthcare sector, and in order to coordinate activities undertaken in this regard in Europe, the mHealth Innovation and Knowledge Hub was created on the initiative of the WHO ITU/Andalusian Regional Ministry of Health [
28]. It was established to collect and share experiences on modern e-medicine solutions and to support countries and regions in implementing large-scale activities in this regard.
mHealth initiatives are especially important nowadays, when the world is facing SARS-CoV-2. Many governments, companies, and citizens’ movements have developed various mHealth solutions to keep the population informed and help to manage the crisis situation. A repository of such solutions developed in Europe can be found in [
29]. This is a dynamic resource that is updated as additional tools are reported.
Among many services created around the world, there can be found those that, in order to reduce the spread of the virus, help to identify whether someone may have been exposed to the coronavirus [
30,
31,
32]. Others provide patients with a better understanding of the mechanisms of COVID-19 or offer channels of updated information on regional regulations, including territory-specific restrictions [
33,
34]. Some of the solutions provide the most up-to-date research findings and information, including all the latest data on COVID-19 diagnosis and treatment, thereby helping medical personnel to make informed clinical decisions [
35].
There are also applications that, similarly to the service presented in this study, support the diagnosis of patients with a SARS-CoV-2 infection based on the symptoms of the disease. For example, the solutions presented in [
36,
37,
38,
39,
40,
41,
42] allow for the self-assessment of the possible symptoms of this infectious disease and for learning about the recommendations to be followed. Some of the applications give the estimated risk of SARS-CoV-2 infection as a result; however, they do not disclose the methods used in these estimates. In addition, some mentioned applications are available only in one language version (e.g., in Italian [
41]) or are intended for use in a given region or country, and they require selection of the name of a specific locality/province when completing the questionnaire [
42]. Others are not publicly available and need a special social security number assigned by the local health service to activate the application [
43]. Some, in turn, are targeted only towards medical staff [
44].
A relatively small group of applications [
45,
46] are those developed as a result of published research [
47,
48]. The corresponding works concerned COVID-19 diagnostics using various machine learning methods. The common features of the data analysed by them were attributes describing blood indices [
49,
50].
The state-of-the-art survey presented above shows that there exist numerous approaches proving the usability of classification models in COVID-19 diagnostics. However, no studies report a comprehensive approach that can serve as a template, an approach including data collection and transformation, system architecture, model generation, optimisation, and explanation. Moreover, to the best of the authors’ knowledge, there are no approaches reported as a research paper taking into consideration solely questionnaire data, which can be valuable when the healthcare system is overloaded or clinical tests are not available. Numerous online applications perform symptom-based diagnosis; however, no information on the applied methodology is given.
Another conclusion is that there are freely available patient data sets on the internet; however, it is still important to enrich the available data representation. To the best of the authors’ knowledge, there were no questionnaire-based data sets collected in Poland reported and it is worth filling this gap.
4. Data Set
The data set used within the presented case study was collected at Specialised Hospital No. 1 in Bytom, Poland, between 21 February 2020 and 30 September 2020, thanks to the cooperation of hospital staff and data scientists involved in the project.
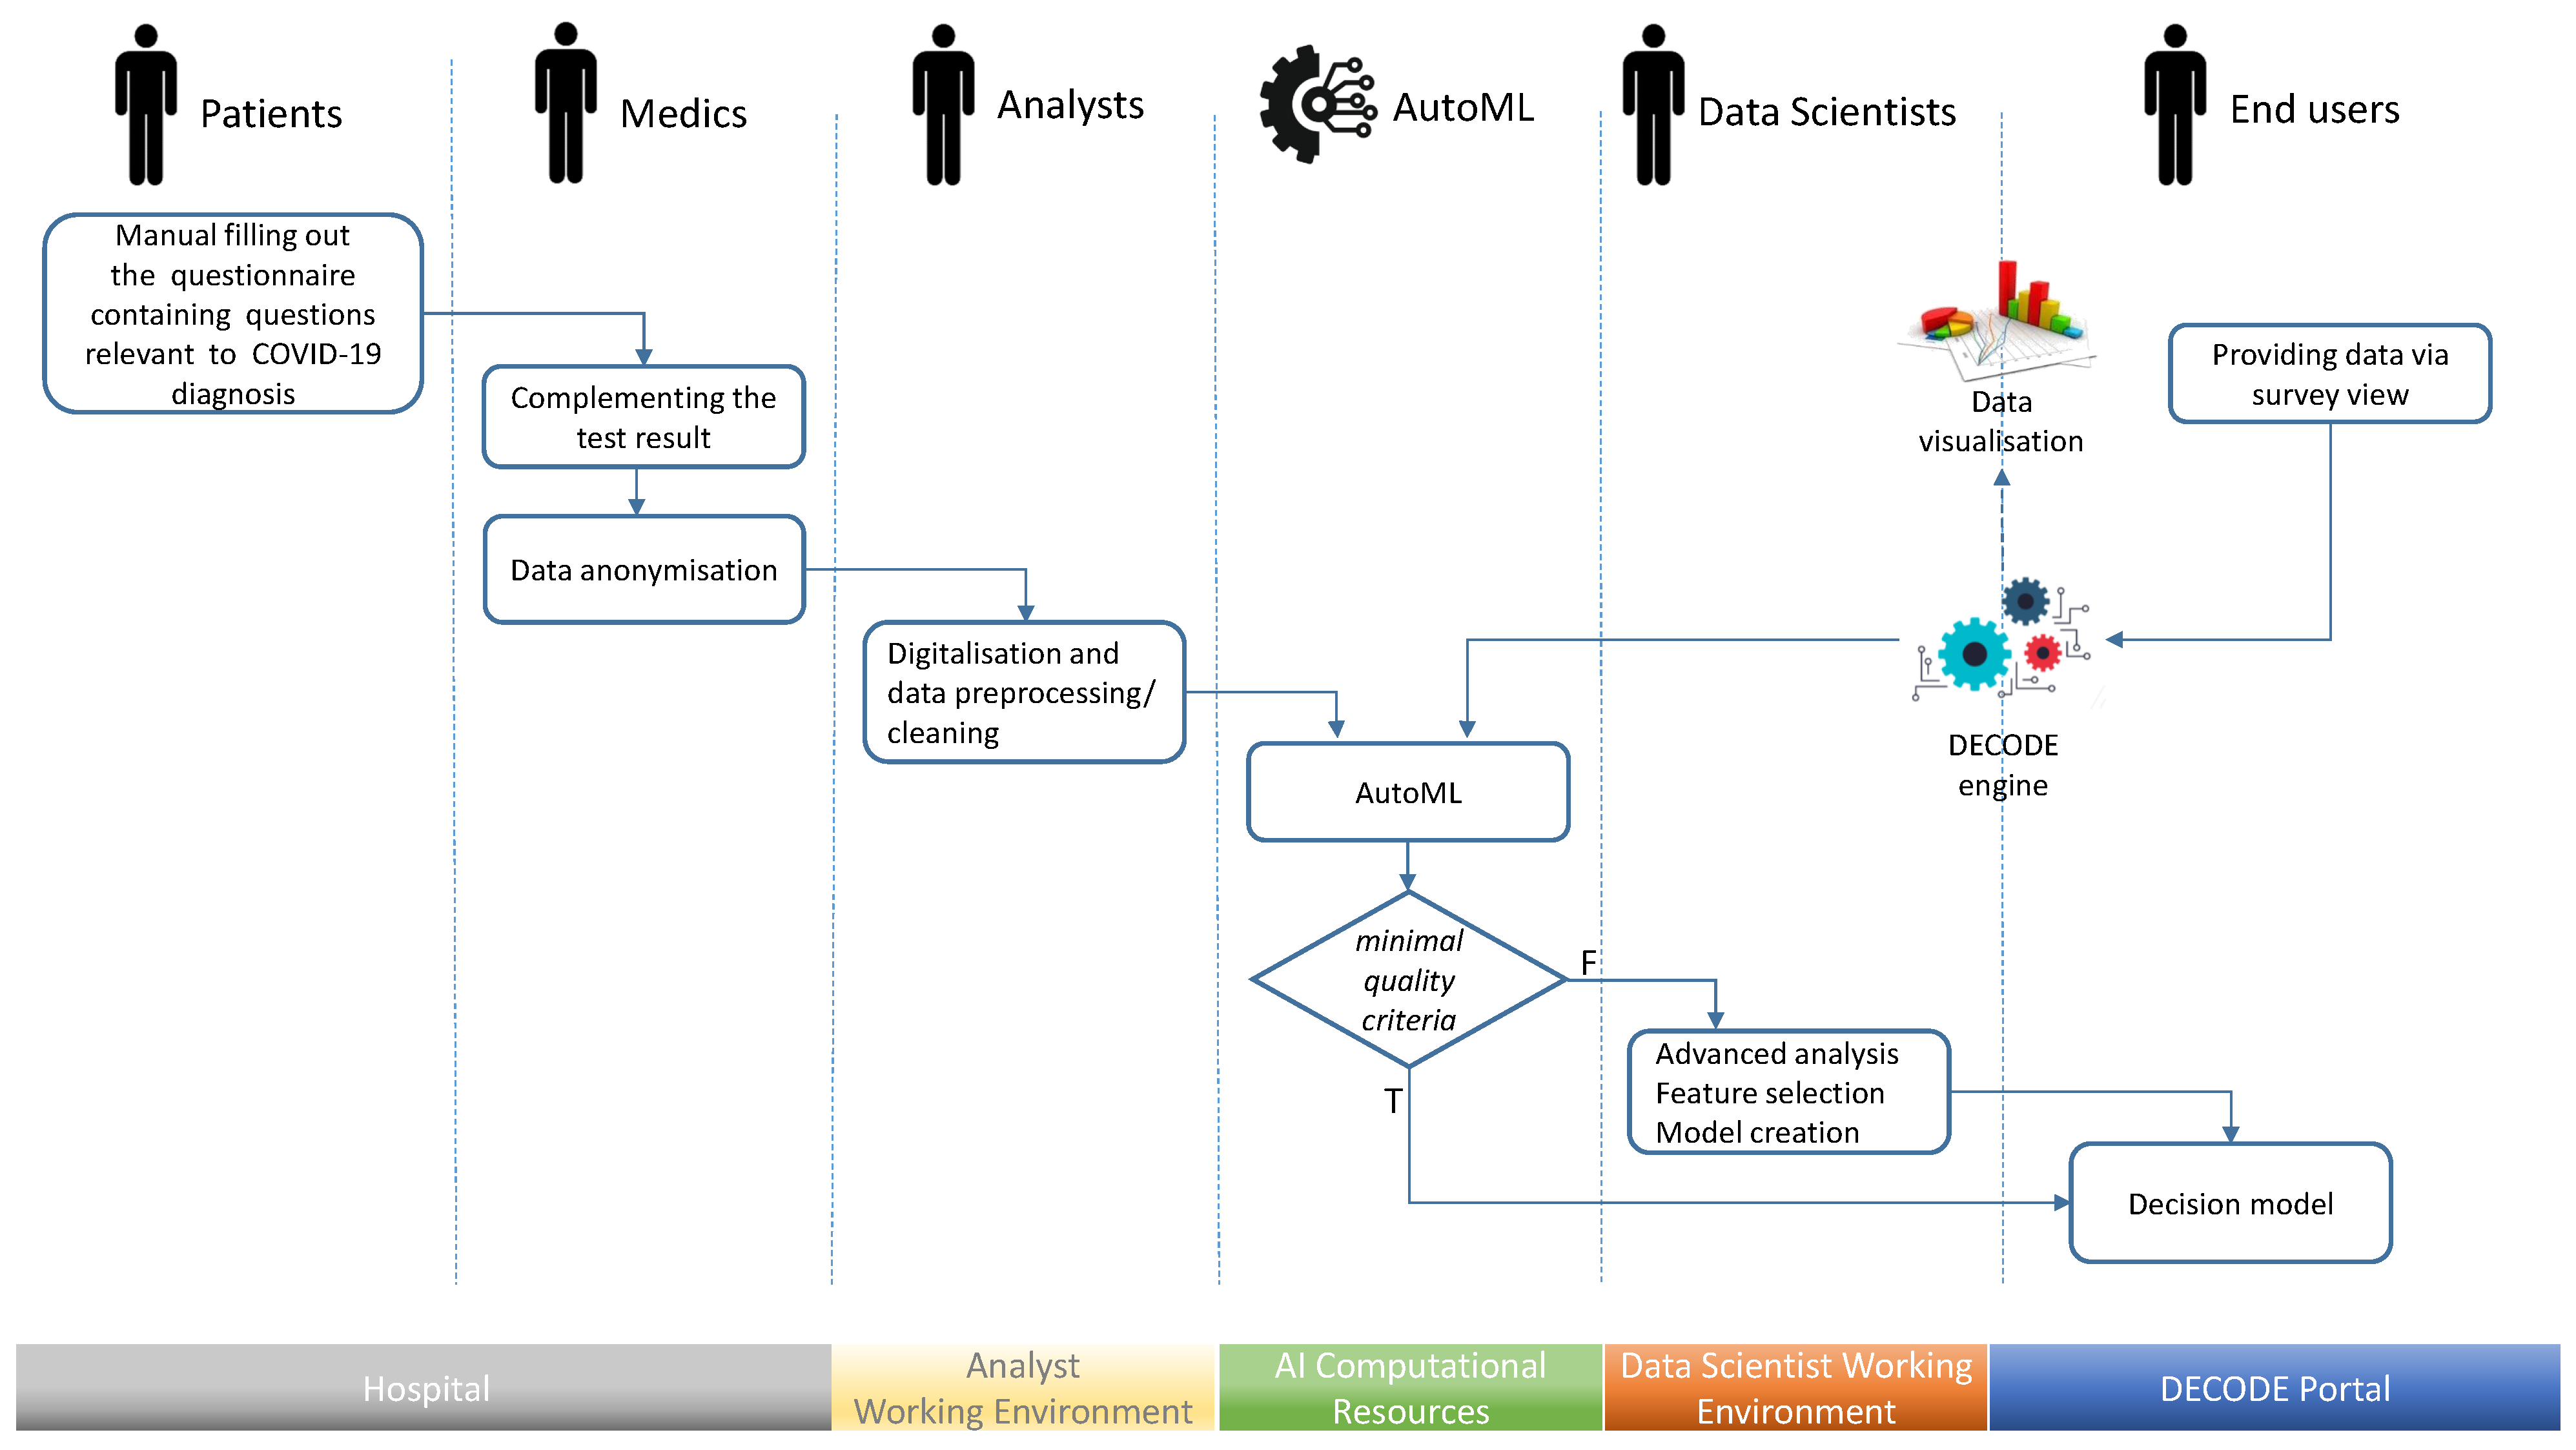
Data acquisition was a process starting at the hospital where people arrived in order to be diagnosed. Before any examination or testing, each person was asked to fill in the questionnaire containing questions relevant to COVID-19 diagnosis. Initially, the survey contained a few questions about the basic symptoms, consisting of the occurrence of temperatures exceeding 38 °C, cough, and dyspnoea. With time and increasing knowledge about the COVID-19 characteristics, the survey was enriched with further questions and options. When the final diagnosis resulting from the SARS-CoV-2 test, was known, the survey was anonymised, scanned, tagged with the SARS-CoV-2 test result, and sent to the database of survey images. Next, the information encapsulated in each survey was transformed into a feature vector, i.e., an example in our data set.
The questionnaires were filled in by patients themselves. People waiting to be admitted to the hospital for further tests may feel unwell and anxious, which affects the consistency and quality of completed questionnaires. Therefore, a synthetic and unambiguous form of the survey was developed, which is now utilised within the web application presented in
Section 8, which is one of the results of this research. Nevertheless, due to the manual nature of data collection, the data were subject to additional inspection to remove errors introduced while completing the survey.
The collected data set consisted of 3114 patient records. Each patient was described by 32 attributes. Within these attributes, the following classes of patient characteristics can be identified:
18 attributes describing symptoms;
7 attributes listing comorbidities;
3 attributes representing the patient’s condition.
The other attributes include epidemiological information, such as age, sex, blood group, and contact with infection. Each patient was classified by two conditions:
The quantitative characteristics of the collected sample from the population on the basis of the classification listed above are presented in
Table 2.
In the presented study, patients who experienced disease symptoms (Sick) were taken into consideration, i.e., 1941 people, as reported in
Table 2. From this group, 577 patients, surveyed mainly in August and September, were extracted for final classification evaluation (test set). The characteristics of the test set taking into account SARS-CoV-2 diagnosis are presented in
Table 3.
5. Decision Model Generation
As indicated in the workflow description, the final decision model can be generated automatically using an AutoML environment, or it can be created within the two-step procedure where AutoML is applied first and data science experts are involved later to generate a more sophisticated solution. This section presents the second approach, where both steps are used to develop a symptom-based screening support system for COVID-19.
As a part of the undertaken task, it was assumed that the positive examples denoted as COVID-19(+) were SARS-CoV-2-infected patients who had symptoms of COVID-19 disease. Negative examples, denoted as COVID-19(−), were patients who were not infected by SARS-CoV-2 and suffered from a disease other than COVID-19.
The goal of the analysis was to derive a classification tool that is able to support the filtration of COVID-19(−) patients within the population of sick patients in order to narrow down the number of patients who need further molecular testing. Therefore, it can be said that false negative examples are more costly in this analysis than false positive ones and, using classification quality measures, it is more important to achieve a high sensitivity value than high specificity.
5.1. Automated Approach
The analysis using the automatic machine learning environment was carried out in the RapidMiner Auto Model [
51]. This environment performs semi-automatic feature selection, suggesting which attributes are valuable. It is recommended to remove attributes that contain too many missing values, have too little (Stability) or too much (ID-ness) variety, and are characterised by too strong or too weak correlation with a decision attribute. Auto Model recommended the following attributes as the basis of the analysis: age, sore throat, headache, muscle aches, dyspnoea, blood group, cough, contact with infected person, hypertension, days of symptoms, sex, saturation, temp. > 38 °C, temp. max, temperature in hospital, loss of smell or taste, dizziness.
Auto Model enables a user to define the costs of the classification mistakes. In this way, it is possible to define the false negative error, which is the prediction that someone does not have COVID-19 while they have the disease, as being more undesirable than a false negative error. In the analysis performed, several values of the cost were verified—the cost value set to means that there were no additional costs, and the lower values mean larger costs.
Finally, Auto Model allows a user to verify the quality of several optimised classifiers. The classifiers are not evaluated by means of a well-known and typically recommended cross-validation procedure, but by a proprietary solution. The reported performance is the average of the scores over 5 out of 7 subsets on a hold-out data set consisting of 40% of data that were not used for model optimisation. The performance (in terms of sensitivity and specificity) of the models automatically generated on training data is presented in
Table 4. Moreover, the models generated for the larger cost values
(distinguished by better quality) were applied to the test data set to additionally verify their quality—the results of this analysis are presented in
Table 5.
The obtained results presented in
Table 4 and
Table 5 show that the undertaken task is non-trivial, and it is challenging for the automatically generated classifiers. This motivated further research conducted by data science experts. Moreover, the adopted value of the cost for false negative errors has a significant impact on the obtained quality of the results—only higher cost values enabled the classifiers to obtain acceptable sensitivity (see
Table 4); however, the specificity then drastically decreased. Finally, treating the obtained results as a starting point for more advanced analyses carried out by data science experts, it can be noticed that the highest sensitivity with non-zero specificity is achieved by two models: logistic regression and gradient boosted trees.
5.2. Data Preparation
Work on the model defined by the data scientists (not created automatically) began with an additional stage of data processing. Since there were many missing values in the collected data, it was necessary to filter the attributes and cases to generate the best possible classification model. In order to perform data selection, the data set was transformed into a binary representation where missing records were marked with the value of 1, while complete records with the value of 0. For the “contact with infected person” variable, missing values were treated as a negative answer due to the survey construction: patients were asked to tick the “Yes” option only if they knew that they had been exposed to SARS-CoV-2. Next, hierarchical clustering with the Hamming distance [
52] and McQuitty agglomeration [
53] was performed for features and patients separately. Finally, the cluster of patients with the highest level of missing information was removed from the data set and the cluster of features with the highest level of missing data was not considered in further analysis. The data subjected to the selection are illustrated in
Figure 3, with missing and complete information marked with red and bright green colours, respectively. The dendrograms serving for the selection are at the sides of the figure. Branches highlighted in red correspond to patients or features excluded from the further analysis due to high missing data levels.
The list of data features was reduced to 16, and it contained: sex, contact with infected person, number of days of symptoms, temperature > 38 °C, maximal temperature, cough, dyspnoea, muscle aches, loss of smell or taste, sore throat, headache, dizziness, skin reactions, temperature (measured at the hospital), saturation, and age. Characteristics for exemplary attributes commonly referred to as related to SARS-CoV-2 infection are presented in
Figure 4.
5.3. Proposed Classification Approaches
Initial work with AutoML showed the promising use of two models in further, more advanced research: logistic regression and gradient boosting. Therefore, within the conducted research, two classifiers developed by two separate research groups were verified. The first model was logistic regression [
54], representing statistical approaches valued by the medical community, while the second was the XGBoost method [
55], implementing the gradient boosting model, which is a leading data-driven machine learning approach. The R implementation of generalised linear model fitting for logistic regression and the
xgboost package implementing the XGBoost method in the R [
56] environment were used in the analysis.
The initial data set was common to each of the approaches; however, the models were generated in separate processes. Therefore, different data preparation and feature selection steps could be applied and hence different splits into training and test data within the model generation process were possible. However, both generated models were evaluated on a common test data set and additional collection of data available online [
24].
To evaluate classifiers in the conducted research, sensitivity and specificity can be used, bearing in mind that, as stated earlier, false negative classification errors are more costly, and it is more important to achieve a high sensitivity value than high specificity. Moreover, when presenting the public health solutions and the results of medical analysis, the positive predictive values (PPV) and negative predictive values (NPV) are applied as they are commonly used to describe the performance of a screening and diagnostic test [
57,
58]. Therefore, as part of the research, the Weighted Harmonic Mean (
WHM) of NPV and PPV was used in the classifier optimisation process:
In a diagnostic test, the weight can be equally distributed between NPV and PPV. However, here, the screening test is applied; thus, the importance of NPV should be higher than that of PPV to maximally reduce the number of undetected COVID-19(+) patients (false negatives). This should be reflected in a value of the weight .
5.3.1. Logistic Regression-Based Approach
For the features remaining after the initial data selection, the effect size was calculated (Cramér’s V and an estimate for Mann–Whitney non-parametric test for discrete and continuous features, respectively) [
59,
60]. Only features with at least a small effect were preserved for further analysis. Hence, during the logistic regression model generation, five attributes were considered: contact with infected person, number of days of symptoms, temperature > 38 °C, loss of taste/smell, and dyspnoea. Additionally, for these attributes, all possible pair interactions were constructed (intersections ∩; logical AND), e.g., occurrence of temp. > 38 °C and dyspnoea simultaneously will logically result in 1 for the interaction variable. When at least one of the attributes is 0, the interaction value will numerically be 0.
Finally, the logistic regression approach does not handle missing values, so patients with incomplete information regarding five considered features were rejected. As a result, the training data set consisted of 572 examples, 185 of which were positive (COVID-19(+)) and 387 were negative (COVID-19(−)).
The steps of the analysis presented in the consecutive paragraphs were repeated 100 times within the Multiple Random Cross-Validation (MRCV) process. Patients remaining after filtration were randomly divided into training and validation sets in equal proportions (50:50). The division was balanced in terms of COVID-19 diagnosis, as well as with regard to the considered set of features, so that, for instance, patients with a particular symptom were not underrepresented in the training or test set.
Next, the logistic regression model was built with the forward feature selection method. Therefore, in each step, a new attribute was added to the model based on the selection criterion, which, in this case, was the Bayes Factor. New attributes were added until the Bayes Factor value decreased below 1, which is described as “barely worth mentioning evidence” [
61,
62]. The attributes were either five previously selected features or their pairs’ interactions.
As the logistic regression model provides the probability that an observation belongs to a particular category (in this case, COVID-19(+)), the cut-off value of the probability must be determined to classify each patient. The cut-off probability was identified in such a way as to maximise the
WHM (
1) with weight
w equal to 0.85. The enhanced importance of NPV reduces the risk of false negative observations’ occurrence for screening test purposes. Moreover, the applied weight reflecting standards in the designed medical screening test were NPV > 90 and PPV > 30 is expected. For medical reasons, it is crucial to avoid COVID-19(+) patients’ exclusion from further diagnosis procedures, while molecular testing for SARS-CoV-2 infection of some COVID-19(−) patients is both acceptable and inevitable. The cut-off value could only be selected from the interval 0.1–0.9. Finally, the quality of prediction for the training and validation sets was calculated.
After the MRCV procedure, feature ranking was prepared based on the feature significance in the model and the model’s quality as characterised by the
WHM (
1) with a weight
w equal to 0.85. The forward feature selection was again applied for the final model building. However, this time, the feature ranking determined the order in which attributes were added to the model. During each step, the data set was divided into training and validation parts in a 50:50 proportion 100 times, and quality was estimated for each division. The model with the highest average
WHM value for validation sets was selected as the final one. The cut-off probability was identified in such a way as to maximise the
WHM value. The parameters of the final model are presented in
Table 6 and its performance calculated on the whole train data set is presented in
Table 7.
5.3.2. Gradient Boosting-Based Approach
This approach was designed to use all available attributes and binary interactions between binary features. If two features a and b were binary ones, then a new binary feature was created, and its value was calculated by applying a logical OR operation.
The next steps of the analysis aimed at limiting the number of features involved in the classification in order to better explain the decisions made by the model. For this purpose, all information related to the measurement of body temperature was removed from the set of features, except for the binary feature indicating whether the patient had a temperature greater than 38 °C. This step was motivated by no significant differences between the values of temperature and maximum temperature in both studied classes. Moreover, the numerical variables that the XGBoost algorithm prefers to construct the tree were removed in this way.
Moreover, further feature selection based on 100 draws of a subset of the available data was performed. Each draw selected at least 60% of the examples and 60% of the attributes. On such a limited data set, the XGBoost algorithm was run in the 10-times five-fold cross-validation mode and the ranking of the importance of features in the trained classifier was recorded. Then, the average position of a feature in the ranking was calculated. This average ranking consisted of only those features that occurred at least 60 times in the selected subsets. In this way, the set
A consisting of all features presented in
Table 8 and their interactions (OR) between binary features was obtained. The value of the
sum_of_symptoms feature was calculated on the basis of 11 disease symptoms included in the training set.
The steps of the analysis presented in the consecutive paragraphs were repeated 100 times within the MRCV process. Patients left after filtration were randomly divided into training and validation sets in 60:40 proportions. Within this procedure, the optimisation process based on forward feature selection was performed. The
(
1) evaluation measure was used in the optimisation process, and the weight value was set to
to enhance the importance of NPV and reduce in this way the risk of false negative observations’ occurrence, as the method was developed for the purposes of the screening test.
In order to present the complete process of building the classifier, we denote by the average value of evaluation measure m calculated on the basis of the results of the MRCV procedure of the XGBoost algorithm, built based on the set of features A. If , this means that the average value of m is given on the training sets; if , this means that the average value of m is given on the test sets. In each of the 100 experiments based on which the mean value of m is calculated, an internal optimisation of the classification threshold to the COVID-19(+) class is carried out.
Initially, the ability to classify each individual basic feature from the A set is verified. This means that, for each feature, the scoring is calculated. The feature with the highest score is selected as the best one. This feature is the first one in the set of selected features denoted as B. Next, further features are added to B.
The process of adding features to the set of selected features
B is carried out as long as:
or
After the stage of expanding the set of features, the stage of pruning redundant features can be performed. Feature
b is removed from set
B if its removal does not decrease (or it increases) the value of
; more precisely,
The resulting set of features used further for classifier training consisted of the following seven features: Contact with infected person OR Loss of smell or taste, Loss of smell or taste OR Temp. > 38 °C, Days of symptoms, Cough OR Loss of smell or taste, Dyspnoea OR Contact with infected person, Temp. > 38 °C, Cough OR Contact with infected person.
After selecting the features, the next step in the analysis was the optimisation of the XGBoost algorithm parameters. This was carried out using the autoxgboost [
63] R package. This time, the F1 measure was used as the optimisation criterion in order to increase the sensitivity and PPV value of the final classifier.
The performance of the model obtained in this way, which was calculated on the whole training data set, is presented in
Table 9.
6. Evaluation of Created Models
Both created classification models presented in
Section 5.3 were finally evaluated (with respect to Formula (
1)) on additional data sets. The characteristics of the first test data set were presented in
Section 4. This data set was created as a result of splitting data into training and test parts (
Table 3) and it consists of 577 examples. This data set will be referred to further as
PL.
The second data set was presented in
Section 2 as the data set available online [
24]. It required an initial transformation, which involved removing all patients who did not show any diagnostic symptoms used by the generated models and available in this collection (contact with infected person, number of days of symptoms, temperature > 38 °C, cough, dyspnoea, muscle aches, loss of smell or taste, sore throat, headache). The characteristics of the obtained data set are presented in
Table 10. This data set will be referred to further as
US.
The results of applying the XGBoost classifier to the
PL test data set are presented in
Table 11 and
Table 12.
The final logistic regression model, presented in
Table 6, was tested on the reduced
PL data set. In this set, 538 examples had full information for model features, which is required by the logistic regression classifier. The logistic regression model performance on this data set is presented in
Table 11 and
Table 12.
Additionally, the XGBoost classifier was applied to the reduced
PL test data set, in which there were no missing values. In this way, it was possible to compare the quality of both models. The results of XGBoost are presented in
Table 11 and
Table 12.
A second evaluation of both generated classifiers was performed on the
US data set. The XGBoost model performance on this data set is presented in
Table 13 and
Table 14. Again, the logistic regression model was tested on the reduced
US data set, from which examples with missing values were removed, and it consisted of 337 cases. The logistic regression performance on this data set is presented in
Table 13 and
Table 14. The results of XGBoost tested on the reduced
US data set are presented in
Table 13 and
Table 14.
The obtained classification results show that the NPV of both methods is acceptable for the screening test; in particular, the NPV of the logistic regression model is above 0.90 on the
PL and
US sets. Both models have similar PPV values. The logistic regression model is characterised by higher values of NPV and sensitivity, and XGBoost is characterised by higher values of specificity. This is partly due to the model optimisation method. Furthermore, this confirms the thesis that, depending on the user’s preferences expressed in this article by the weight value in Formula (
1), it is possible to obtain classifiers with different levels of PPV and NPV.
7. Discussion
In this section, various issues related to the presented case study are discussed. The first part of this section is devoted to explaining the models obtained in the case study in line with the idea of explainable artificial intelligence (XAI). The second part is about how the proposed system, or, more specifically, its analytical heart, is maintained over time as the epidemic progresses and moves to its new phases. The last part of the discussion is related to an exemplary estimate of how such systems can contribute to the reduction of epidemic management costs.
7.1. Explanation of the Models Obtained
The relation between parameter values and the decision represented by the XGBoost models is difficult to interpret by a human. Logistic regression gives the possibility to estimate the adjusted odds ratio (
Table 6), which gives a direct and intuitive interpretation of obtained classifier parameters. However, to give a unified comparison of both approaches, the RPART decision trees [
64] were created to provide an explanation of the relationship between symptoms and the outcome predicted by the models.
Having two sets of basic features selected for each model, decision trees were generated to explain the behaviour of their representative models. First, two training sets were prepared. The data sets consisted of patients with symptoms (Sick) representing the attributes that were used by the models, and each patient was assigned the decision given by the model. Then, based on these two separate training sets, two RPART decision trees were generated. Finally, it was evaluated how well the decision trees approximate the decisions made by the considered models. For each patient, the decision given by the model was compared with the decision given by its RPART approximation. For the decision tree generated for the logistic regression model approximation, the resulting Balanced Accuracy (BAcc) value was 0.967, and, for the decision tree generated for the XGBoost model approximation, the resulting BAcc value was 0.937. Based on the very high BAcc values, it was possible to use the trees to explain the relationship between symptoms and model outcomes.
Furthermore, similar decision trees using training sets based on selected feature interactions were generated. However, since the representation of a tree based on simple (basic) features can be better understood, it was decided to include a simpler version in the manuscript.
The generated decision trees are presented in
Figure 5 and
Figure 6. The colours in the figures represent the classes—COVID-19(+) is represented by red and COVID-19(−) by blue. The more saturated the colour of a node is, the greater the dominance of examples from a given class in this node. The first row of the RPART tree node provides information about the majority class of examples covered by that node; the second provides the percentage of the cases from the node that are classified by the approximated model into the majority class, and the third row provides the percentage of all cases covered by that node. The branches of the tree represent symptoms and their presence or lack thereof (
yes means that the patient has a symptom and
no means that a symptom is not observed). Please note that since the trees were built to approximate the models, their leaves do not represent the patient outcome, but the decision provided by the model based on the particular set of symptoms. Decision trees can be used to explain which combinations of symptoms and their values are taken into account while predicting diagnosis. For example, it can be noted that, in the case of both models, a long symptom duration
no_of_days_of_symptoms ≥ 13 will result in a negative decision (COVID-19(−)), unless the patient observes the
loss_of_taste_smell.
In general, the decision tree approximating the logistic regression model is less complex and allows for an easy interpretation of the model’s decision-making. The decision-making model can be expressed in terms of seven rules containing 2 to 4 conditions (nodes). The tree approximating the XGBoost model is more complex. In this case, the decision model consists of 12 rules with 2 to 7 conditions.
The knowledge represented by the created trees explaining how the decisions are made by the generated classifiers can be analysed in more detail. However, it is related to the current type of virus and the current epidemiological situation at the time of data collection. Therefore, the conclusions of such an analysis do not fall within the scope of the presented work.
7.2. Adaptation of the Proposed System
According to what was presented in the description of the workflow, a selected model from among the created ones was transferred to the DECODE system for operation. The generated classifiers are of sufficiently good quality in the conducted analyses. However, the presented case study concerns a data set describing COVID-19 disease symptoms for the SARS-CoV-2 virus from the early stage of the pandemic. Later, new mutations of the virus began to appear, for which the set of characteristic symptoms changed. The new class definitions related to the new disease characteristics require adaptation of the created models, because the lack of representation of new mutations in the training data will lead to a decrease in the quality of the classifier. The concept of the system presented in
Section 3 means that users who enter their symptoms into the form may add the laboratory test result to them. Therefore, it is possible to verify the quality of the model on an ongoing basis and react in the event of a quality decrease. Thus, the classifier’s efficiency is checked from time to time, and, if it does not meet the minimum PPV and NPV requirements, a new model has to be defined using automatic machine learning and data science experts.
7.3. Impact of the Proposed System
The qualitative analysis and interpretability of the models may be supplemented with an estimate of the savings that may result from the application of the proposed system. The cost reduction can be associated with the genetic testing of individuals showing symptoms of the disease. According to
Table 1, the mean value of the daily number of tests performed was 23,178 in July 2020. Most of the tested people had symptoms of the disease because, in accordance with the policy of the Polish government, doctors directed only such persons for tests. The percentage of positive tests at that time in Poland (
https://ourworldindata.org/grapher/covid19-positive-rate-since-5th-death?tab=table&time=2020-07-01..2020-07-31, accessed on 10 September 2021) was a maximum of 2.5%, which leads to the conclusion that, everyday, 22,599 people uninfected with SARS-CoV-2 were tested. According to the pessimistically rounded results of the generated classifiers, their specificity (
Table 7,
Table 9,
Table 12 and
Table 14) was 0.3 and 0.1 for XGBoost and the logistic regression model, respectively. This means that, at that time, these models would not recommend testing for 6779 and 2259 people daily, respectively, if applied to the screening of the patients directed to testing. Thus, the XGBoost and logistic regression models would save, in this way, over USD 13 million and over USD 4 million in July 2020, respectively (assuming USD 63 per test, as stated in
Table 1).
8. DECODE Service
DECODE is a symptom checker tool used to assist patients and family doctors in the preliminary screening and early detection of COVID-19.
In the DECODE service, a patient has the opportunity to fill out a questionnaire regarding his/her health condition and obtain a preliminary assessment of their possibility carrying COVID-19 and, consequently, the need to be tested for SARS-CoV-2.
The questions (
Figure 7) cover many problem areas related to possible COVID-19 disease. In addition to the year of birth, sex, the occurrence of signs that are typical for coronavirus, such as fever over 38 degrees of Celsius, cough, dyspnoea, loss of smell or taste, etc., the patient may add other disturbing symptoms and state how long they last. Moreover, the person completing the questionnaire has the option of providing the names of any chronic diseases—if any—and the names of the medications that are constantly taken. Blood type is also taken into account. To avoid possible inconsistencies, the questionnaire fields are validated. For example, if a patient checks any symptoms, the length of their presence must be greater than 0.
After completing and sending the questionnaire, the patient receives suggestions in the form of a Negative/Positive statement, a quantitative score, and an illustration of how the obtained score compares with the distribution of other results stored in the system. An example of such an illustration is presented in
Figure 8. It contains two distribution charts presenting the frequency of scores for patients who are positive or negative for SARS-CoV-2 infection. The system informs users that the obtained results are only a prediction and only a medical test can fully confirm the presence of SARS-CoV-2. The link that allows the patient to return to the survey is active for 14 days. Using this link, the patient can, for example, report new symptoms, if they occur. In particular, when the patient knows their PCR test results, they can share this information and help to improve the service.
DECODE is available in two language versions (Polish and English) and is integrated with the CIRCA diagnostic service, which was also developed at the Silesian University of Technology to support and accelerate COVID-19 imaging diagnostics.
9. Conclusions
The paper presents the assumptions, analytical background, and evaluation of a COVID-19 screening support system that uses machine learning methods to classify patients on the basis of their symptoms.
The workflow and architecture included in the work present the general concept of the system. The use case based on the collected data adopts both steps proposed in the workflow to generate the final classification model. The first step, based on automatic machine learning, did not provide a final solution of adequate quality, but it allowed us to obtain valuable suggestions used at the second stage of work on classifiers. In this way, based on the feature set describing the disease symptoms, it was possible to obtain classifiers that met the expectations concerning the detection of patients with COVID-19 disease. This was achieved at the expense of a relatively low Positive Predictive Value. The classifiers’ efficiency was verified on the data set obtained as part of the presented research, in the last period of collecting the questionnaires, and on the data set available online. Thanks to an approximation of the obtained classification models by a decision tree, it was possible to explain—using the set of basic features—what features and their values were the basis of the decisions taken by the classifiers. The obtained classification models provided the basis for the development of the DECODE service (
decode.polsl.pl, accessed on 25 October 2021), aiding doctors in preselection for further diagnostics in the event of an overwhelming increase in disease transmission. The presented solutions can be used as a template in the event of a threat of new pathogens in the future.
An important aspect of the paper is the data set describing over 3100 patients with verified (positive or negative) SARS-CoV-2 infection. The set includes: asymptomatic patients with SARS-CoV-2 infection, patients with COVID-19 disease (referred to in the paper as COVID-19(+)), as well as symptomatic patients but without SARS-CoV-2 infection (suffering from other diseases, e.g., influenza, denoted as COVID-19(−)). In addition to information about symptoms, the data set includes information on comorbidities (e.g., hypertension, diabetes, etc.). However, comorbidities were not analysed in the studies described in this paper. The data set is available to a wide group of researchers, and it is a significant data repository describing COVID-19 symptoms in the Slavic population.
Further work will focus on developing an automatic adaptation procedure as the generated classification models have to be periodically verified on newly emerging data and tuned. Such a procedure may support the identification of new virus mutations and their spread among the population. This type of research requires a larger set of data obtained from the DECODE web service users and through cooperation with a greater number of hospitals. Such a data set will additionally enable improvement of the classifiers to increase their specificity (PPV and Specificity).


 ,
, 


