Article

Modeling the Process of Thawing of Tailings Dam Base Soils by Technological Waters

1
Laboratory of the Geo-Electrochemistry, Laboratory of the Ecological-Economical Modelling of the Technogenic Systems, Trofimuk Institute of Petroleum Geology and Geophysics SB RAS, 630090 Novosibirsk, Russia
2
Department of Geophysics, Faculty of Geology and Geophysics, Novosibirsk State University, 630090 Novosibirsk, Russia
3
Laboratory for Predictive Metallogenic Research, Sobolev Institute of Geology and Mineralogy of SB RAS, 630090 Novosibirsk, Russia
4
Laboratory of Mining and Geological Problems of Field Development, Yakutniproalmaz Research and Design Institute, 678174 Mirny, Russia
*
Author to whom correspondence should be addressed.
Appl. Sci. 2021, 11(23), 11089; https://doi.org/10.3390/app112311089
Submission received: 18 October 2021 / Revised: 12 November 2021 / Accepted: 16 November 2021 / Published: 23 November 2021

Abstract

:
The storage of wastes from mining and mineral processing plants in the tailing dumps in regions with cold climates has a number of environmental consequences. Interactions of water with tailings in cold climates often lead to the thawing of permafrost soils, formation of technogenic thawing zones, and leakage of drainage waters. In the case of fault zones development in these areas, technogenic solutions are often filtered outside the tailing dump, promoting further development of filtration channels. In order to prevent leakage of solution from tailing dumps over time, it is necessary to determine the thawing zones and prevent the formation of filtration channels. In the case of the formation of a filtration channel, it is necessary to know what rate of rock thawing occurred near the formed filtration channel. In this study, for the tailing dump of a diamond mining factory, we calculated two exothermic effects: (1) due to physical heating of dump rock by filtering industrial water with temperatures from 2 to 15 °C through the rock; and (2) due to the chemical interaction of industrial water with the dam base rock. The amount of energy transferred by the water to the frozen and thawed rock over 10 years was calculated using thermophysical modeling and was 207.8 GJ and 8.39 GJ respectively. The amount of energy that the rock received during the ten-year period due to dissolution of the limestones and equilibration of solutions was calculated using thermodynamic modeling and was 0.37 GJ, which is 4.4% of the average amount of energy, expended on heating the thawed rock (8.39 GJ).

1. Introduction

The study of the consequences of the exploitation of mineral deposits in permafrost conditions is especially important for countries with large polar and highly mountainous regions. The majority of active research is carried out in Russia, Canada, the USA, Italy, and the countries of northern Europe [1,2,3], as well as China and the countries of Central Asia containing high mountain regions with low-temperature conditions and permafrost similar to those in Russia [4].
In all climates, mine reclamation is a major challenge for mining companies, especially when mine tailings can lead to the formation of acidic drainage solutions. Previous studies [5,6] have reviewed the principal parameters and processes that influence the quality of mine drainage, in addition to the performance of passive treatment of mine drainage in cold climates. Review [7] discusses the significant knowledge gaps currently associated with the release of toxic rare earth elements (REEs) from mining waste to the environment, as well as developing waste management strategies.
However, traditional methods of mine reclamation are challenging to apply to areas located in the arctic conditions due to their remoteness, severe climatic conditions, the degradation of permafrost, and the effects of climate change. It is, therefore, necessary to design and develop new approaches for effective mine reclamation in Arctic climate conditions. Such approaches are of particular importance, as mining operations should be optimized so that their profitability is maintained in changing market conditions and to meet increasing societal and environmental demands. Study [8] presents an overview of the interplay between mining and the surrounding socio-ecological systems in the Arctic region and investigated the mining activities from four perspectives, examining (1) environmental, (2) economic, (3) social, and (4) legal dimensions, covering three life-cycle stages: (1) pre-mining, (2) mining, and (3) post-mining.
The degradation of permafrost, melting, and reduction of rocky glaciers all have impacts on the quality of surface waters. Recent studies have shown that climate change is impacting the inorganic chemical characteristics of surface fresh water in permafrost areas and affecting aquatic ecosystems. In addition, thickening of the active layer and melting of near-surface ground ice can influence inorganic chemical fluxes from permafrost into surface water. Permafrost degradation may also modify trace element contents in surface water [9]. However, information on the dominant geochemical reactions occurring in various cryospheric conditions and how these reactions change during the ice-free period is currently extremely limited. Chemical weathering under cryospheric conditions is typically more intense, with a strong seasonal increase in water mineralization [10].
Tailing dumps from mining and mineral processing enterprises have a number of environmental consequences. These include the oxidation of finely crushed tailings, enrichment of ore with atmospheric oxygen, and formation of mineralized drainage waters, which migrate outside the tailing dumps, leading to the pollution of surface and ground waters of the surrounding area [11,12,13,14]. When tailings containing sulfides are thawed, a highly mineralized acidic drainage solution is formed [15], which interacts with rock in an exothermic reaction. Interactions of water with tailings in areas in the Far North often lead to the thawing of permafrost soils, formation of man-made taliks, and leakage of man-made waters. In the case of the development of fault zones in these areas, acidic solutions are often filtered outside the tailing dump, promoting further development of filtration channels and more intense leakage of acidic solutions. Temperatures below freezing will slow down this process but will not eliminate oxygen consumption. To remedy this issue, thermal covers have been widely adopted for freeze encapsulation of potentially reactive mine waste rock and tailings. The covers are constructed over potentially acid-generating waste to limit the depth of seasonal thaw to non-acid-generating cover material and to promote ground cooling that ensures the waste remains frozen throughout the year [16,17]. Freezing of the waste can also limit the geochemical and biochemical oxidation of sulfides by reducing surface water infiltration and the availability of in situ pore water within the waste material. Previous studies have also suggested that freezeback may limit the oxygen supply and biological activity that contribute to sulfide oxidation [18]. Thus, thermal covers must be designed to keep the tailings temperature well below freezing point.
In order to effectively assess the interactions between tailings and wastewater, all physical and chemical factors leading to the destruction of the dam and the formation of filtration channels must be considered. The composition of the tailings and dam rocks, as well as the composition of technological wastewater, have a significant impact on the physicochemical processes occurring near phase equilibria.
This study focuses on an area containing the results of processing the Udachnaya and Yubileinaya diamond kimberlite pipes [19]. In the tailing dump, high concentrations of metals arise because of the dissolution of Mg-containing minerals in the host rocks. In all conditions, pH neutralization occurs due to the presence of secondary carbonates and ultrabasic rocks. This work aims to assess the thawing effect of the technogenic system on the base dam rock (limestone) of a hydraulic structure (HTS). To do so, a model of the thawed zone developing and its change in time and space is calculated; this model allows the rate of rock thawing near the formed filtration channel with a solution filtering through it to be understood. This approach allows determination of the time required to detect and eliminate filtration channels to prevent the leakage of technogenic solutions into the environment. The following factors play an important role in this process: dynamics of air temperature, thickness of snow cover, structure and granulometric composition of the dam rocks, size and shape of the tailing dump, and properties of adjacent rocks [20]. Overall, this research has important implications for all engineers and technologists of the mining industry, and specialists in the fields of earth sciences, mining, and ecology, especially those working in areas containing permafrost.

2. Materials and Methods
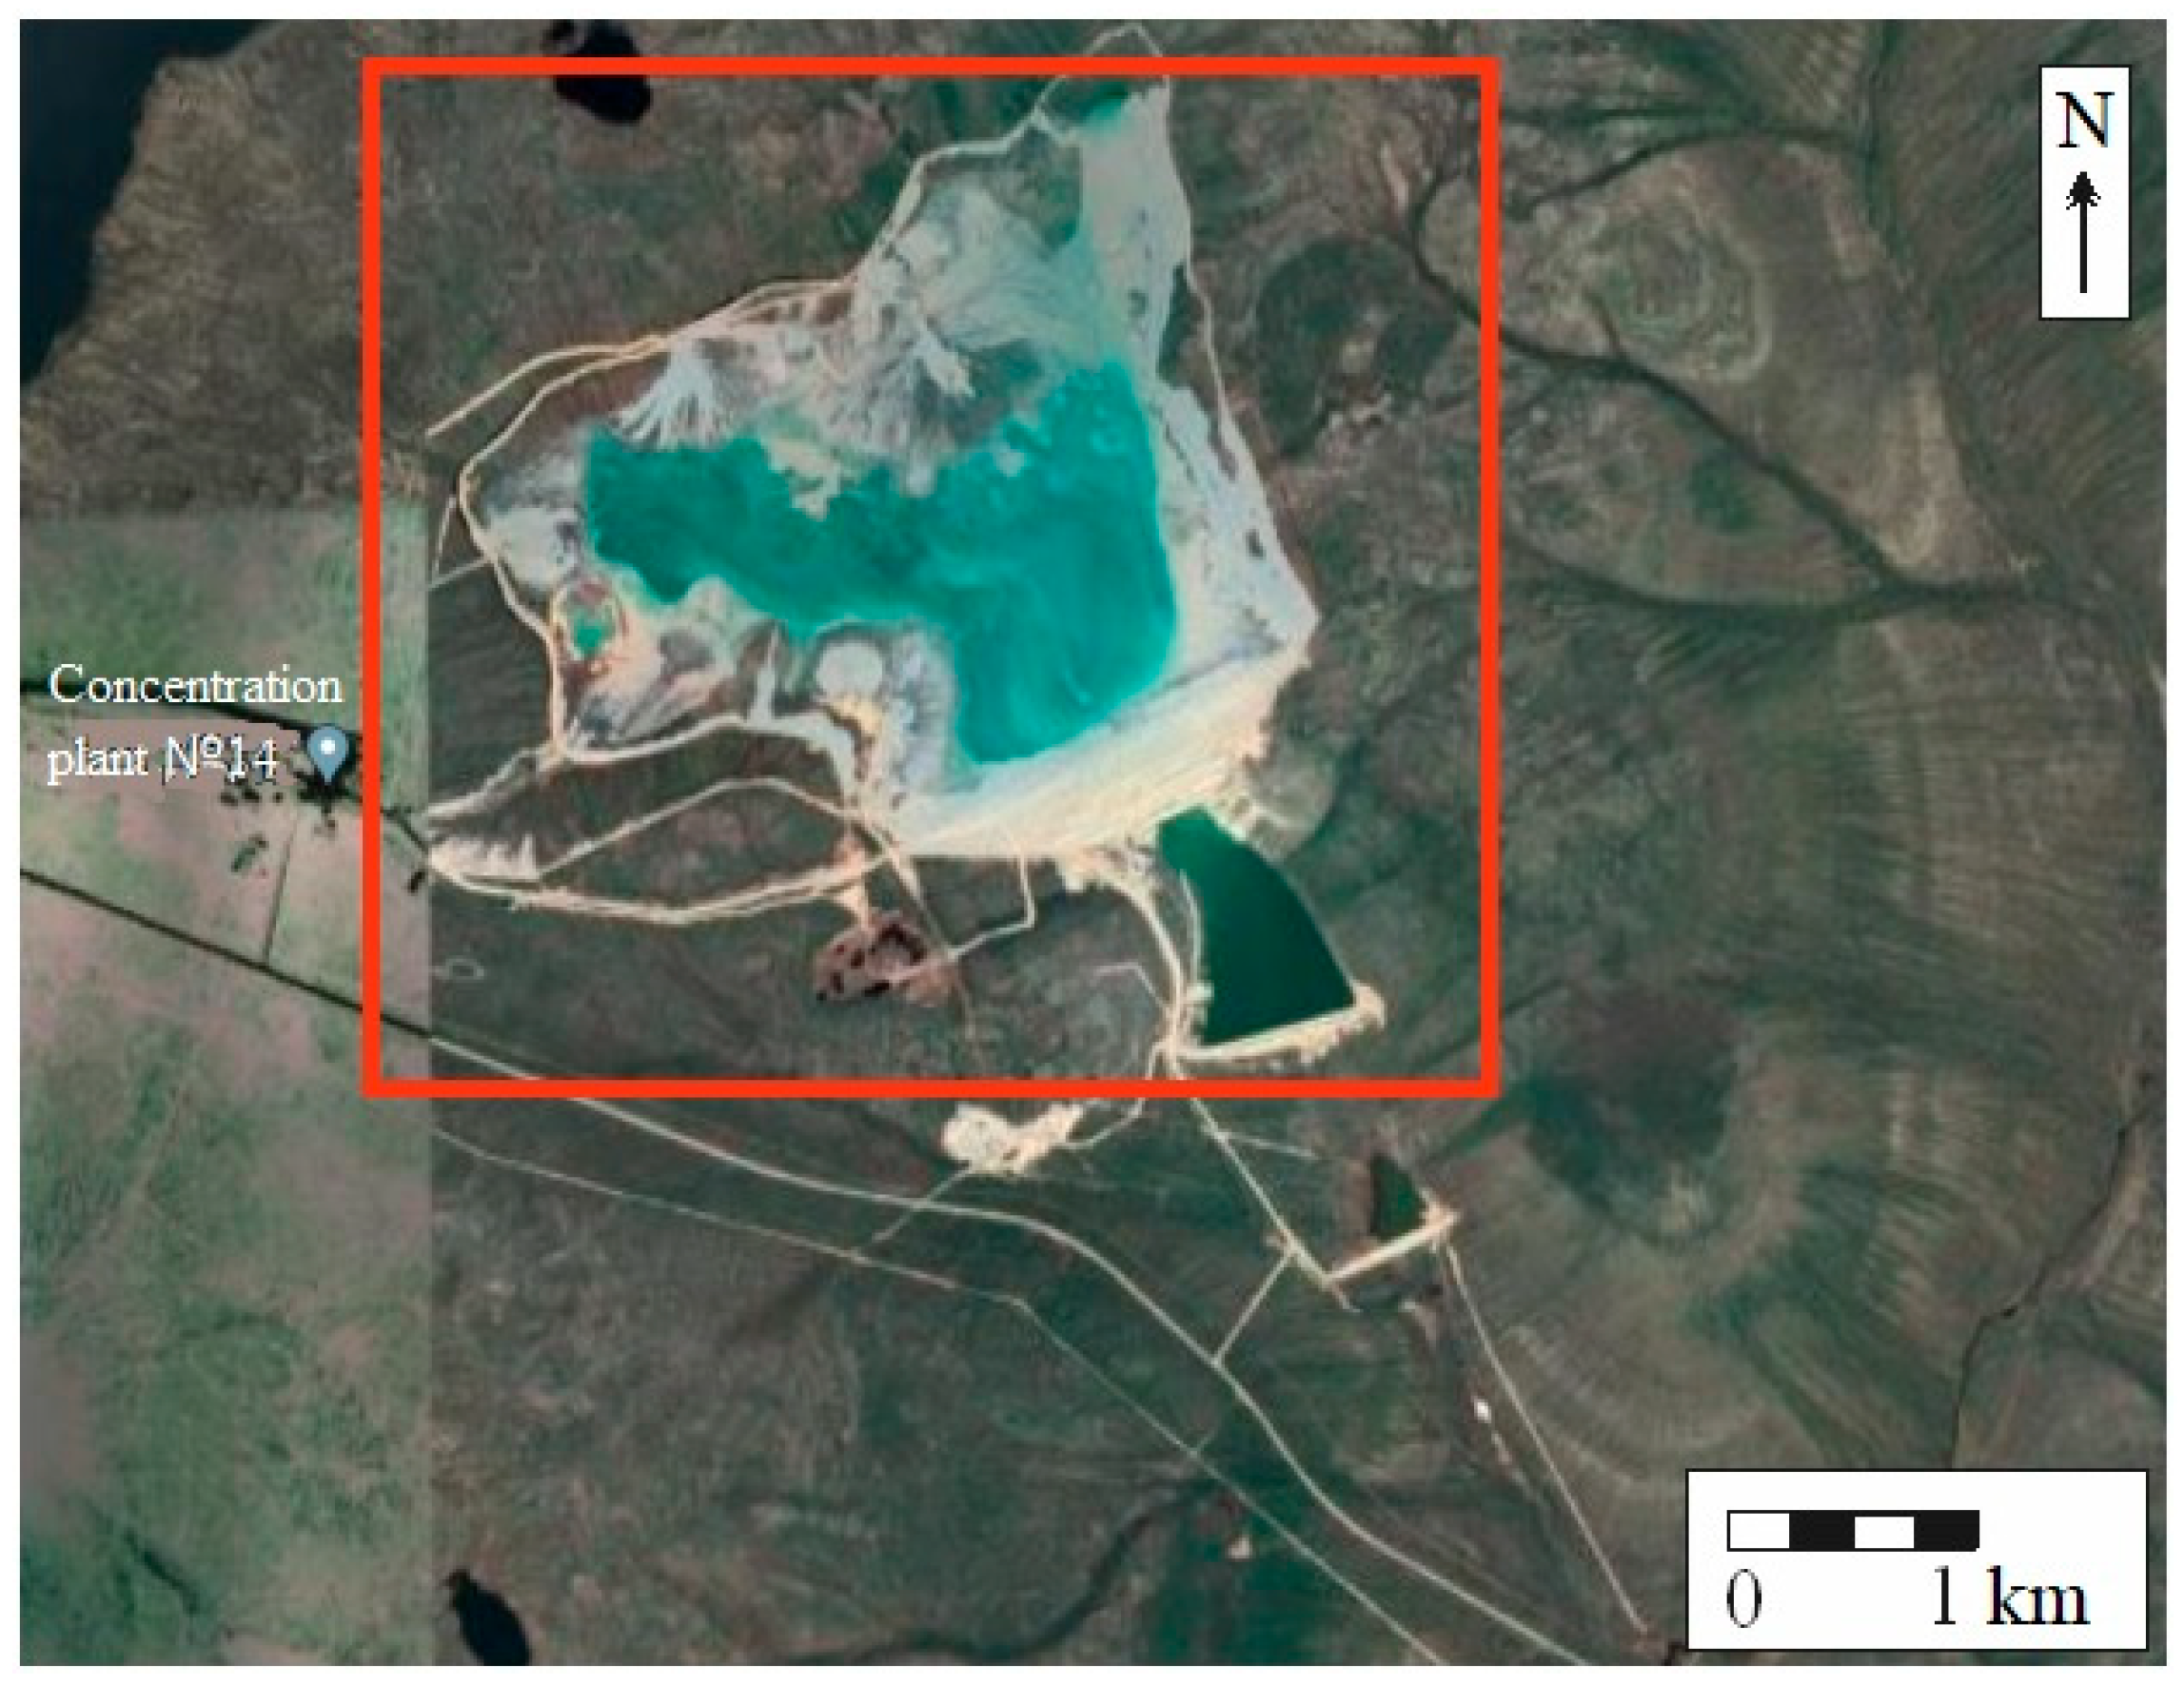
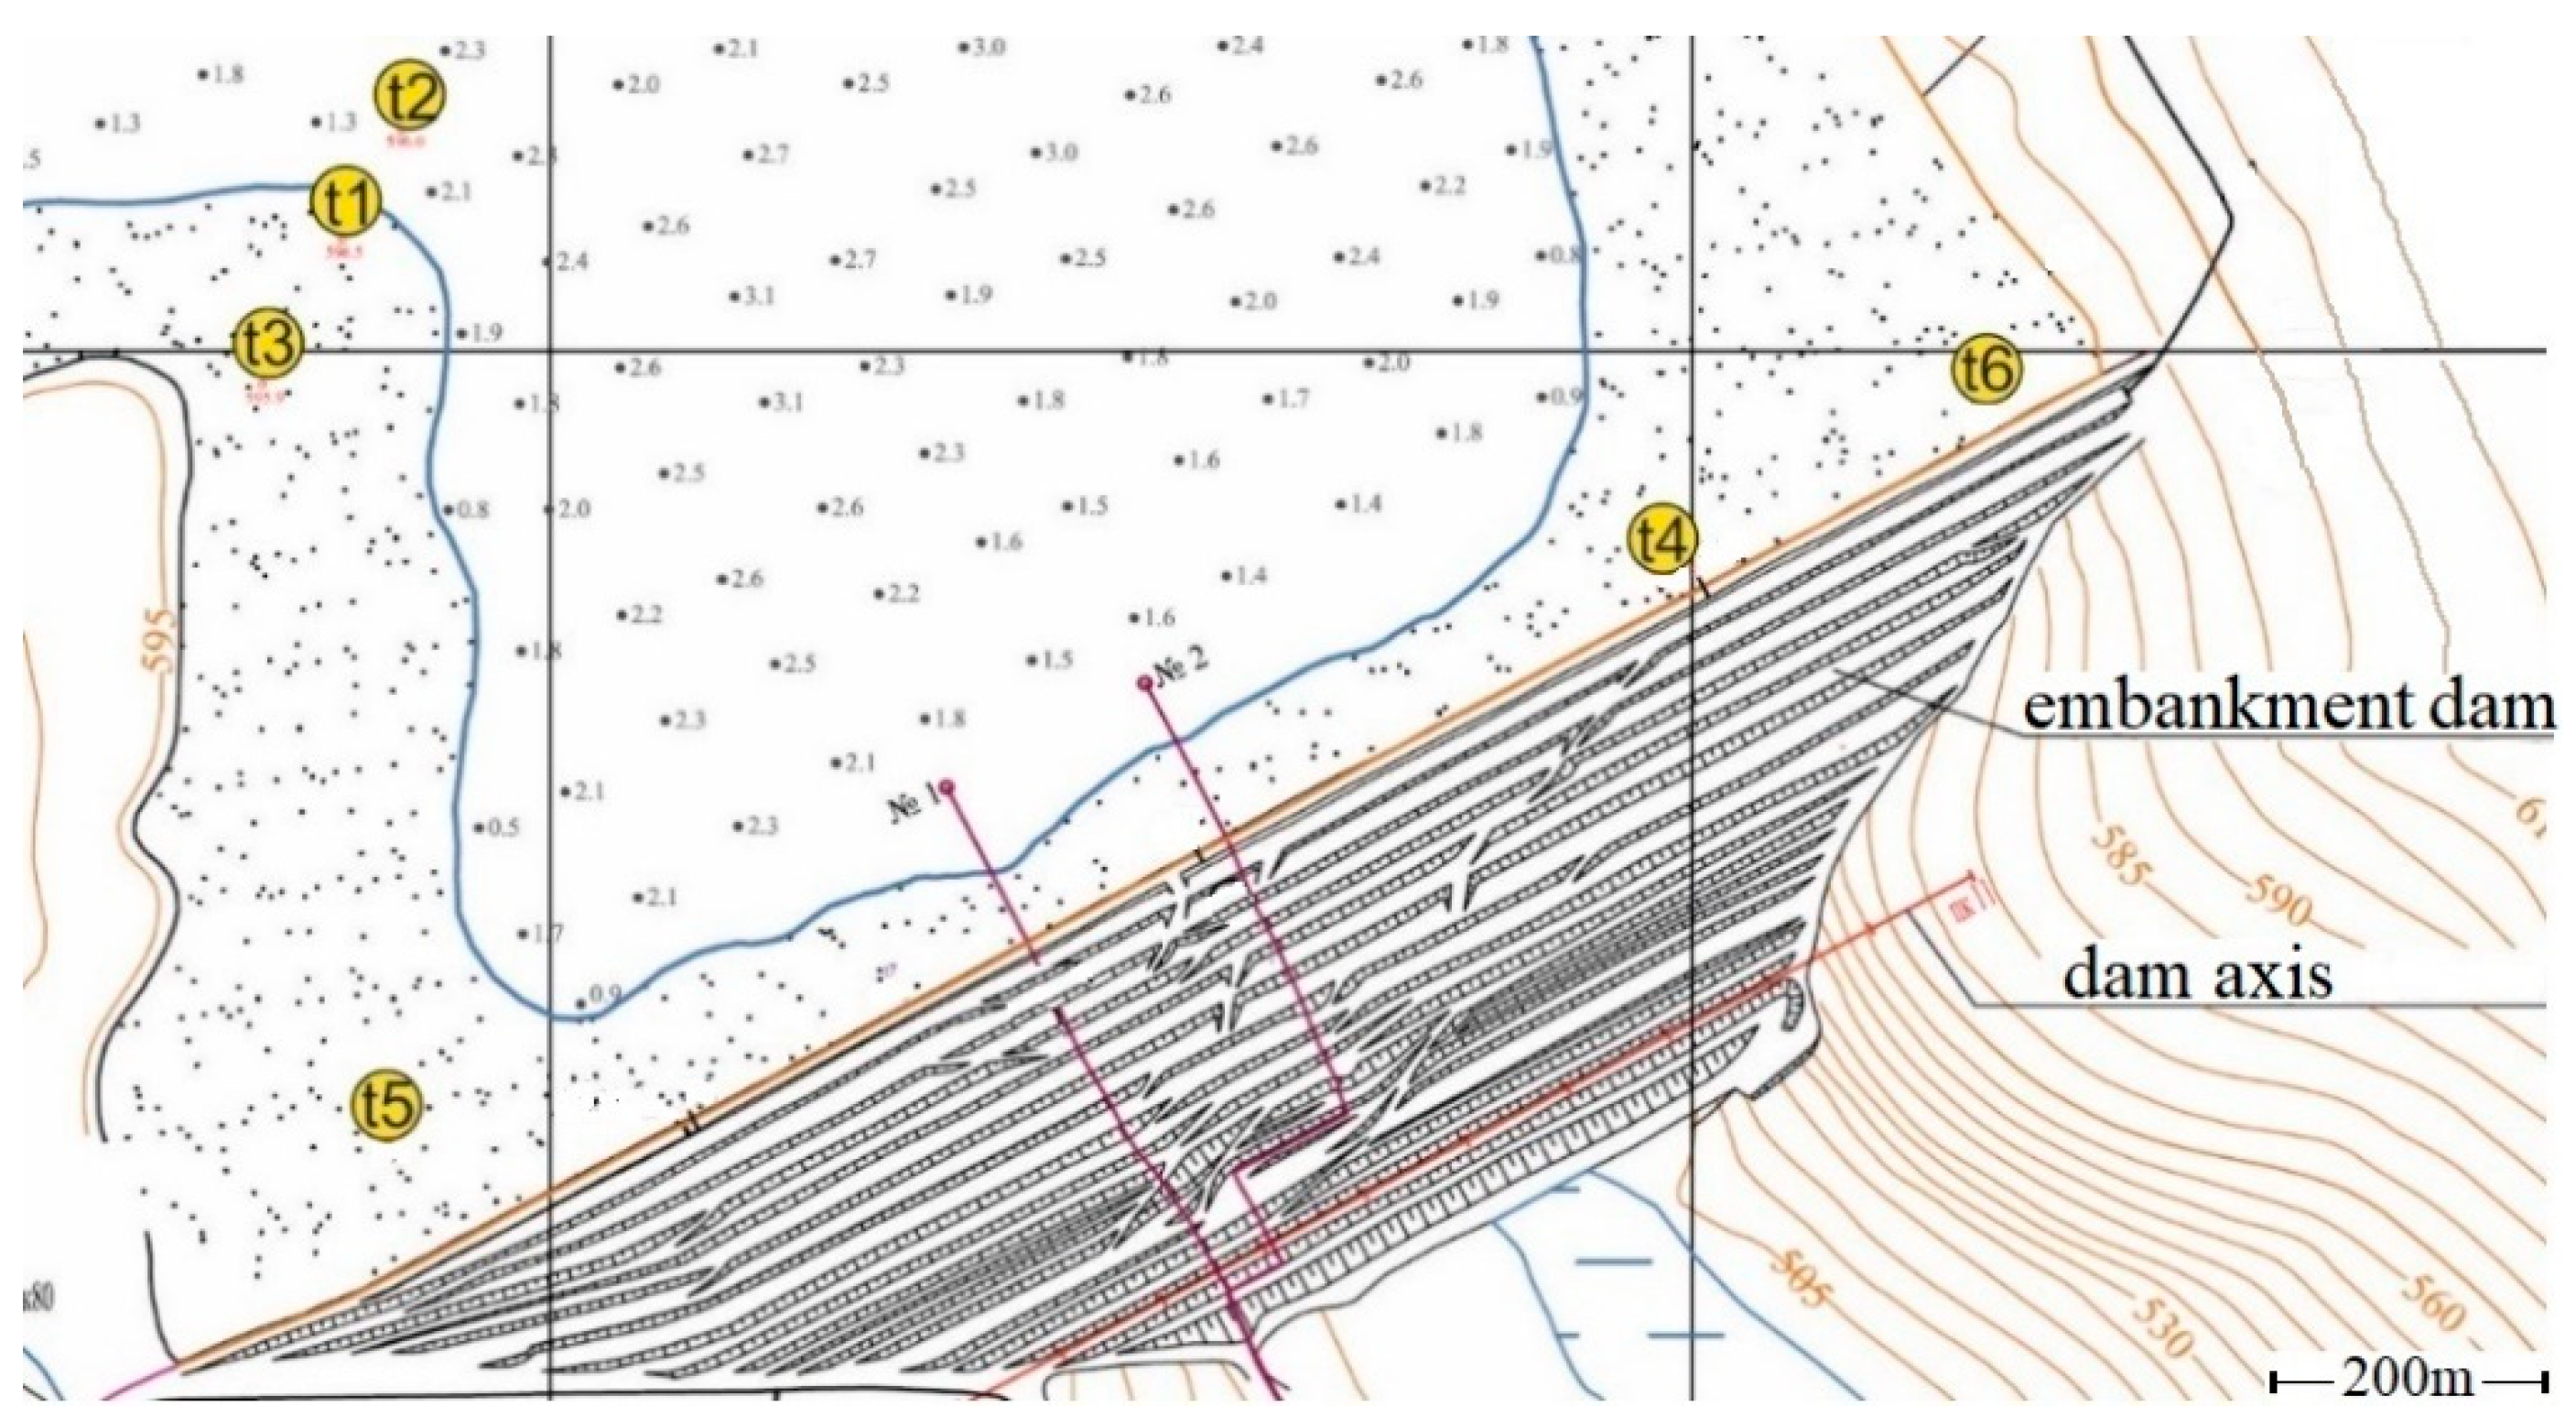
2.1. Study Object

The tailing dump of the concentration plant in this study was commissioned in 1996. The enclosing dam is a thawed filling dam—at its final filling level, the length of the enclosing dam is up to 2500 m and its height is 105 m (Figure 1). The tailings storage pond is closed, full-turn, with the accumulation of circulating water for the entire period of operation for the site. The estimated completion date for the current project is 2030.
The territory of the tailing dump is located in the basin of the Markha river, within the Alakit-Markhinsky kimberlite field, Yakutia.
Geomorphologically, the area is a structurally denudation plateau dissected by river valleys. The area is located in a zone of permafrost rocks with a thickness of up to 750 m, the depth of seasonal thawing varies from 0.2–0.4 to 2–3 m. The soils in the region are podzolic, peaty-boggy. The soil layer is poorly developed, has insignificant thickness (up to 0.1–0.3 m). The soil is largely enriched with stone material (grass, gravel, and crushed stone of local rocks). The climate of the region is sharply continental with a long winter period and short moderately warm, sometimes hot summers. The absolute maximum temperature (+35 °C) is recorded in July, the absolute minimum in January (−65 °C). Average annual temperature −11 °C.
Studying the HTS in connection with its long-term operation and the presence of tectonic disturbances within the tailing dumpsite is of particular importance. As noted earlier, such disturbances may cause bypass filtration and significant thawing of the dam rocks. Thus, studies were carried out to determine the potential influence of this system on the surrounding permafrost.

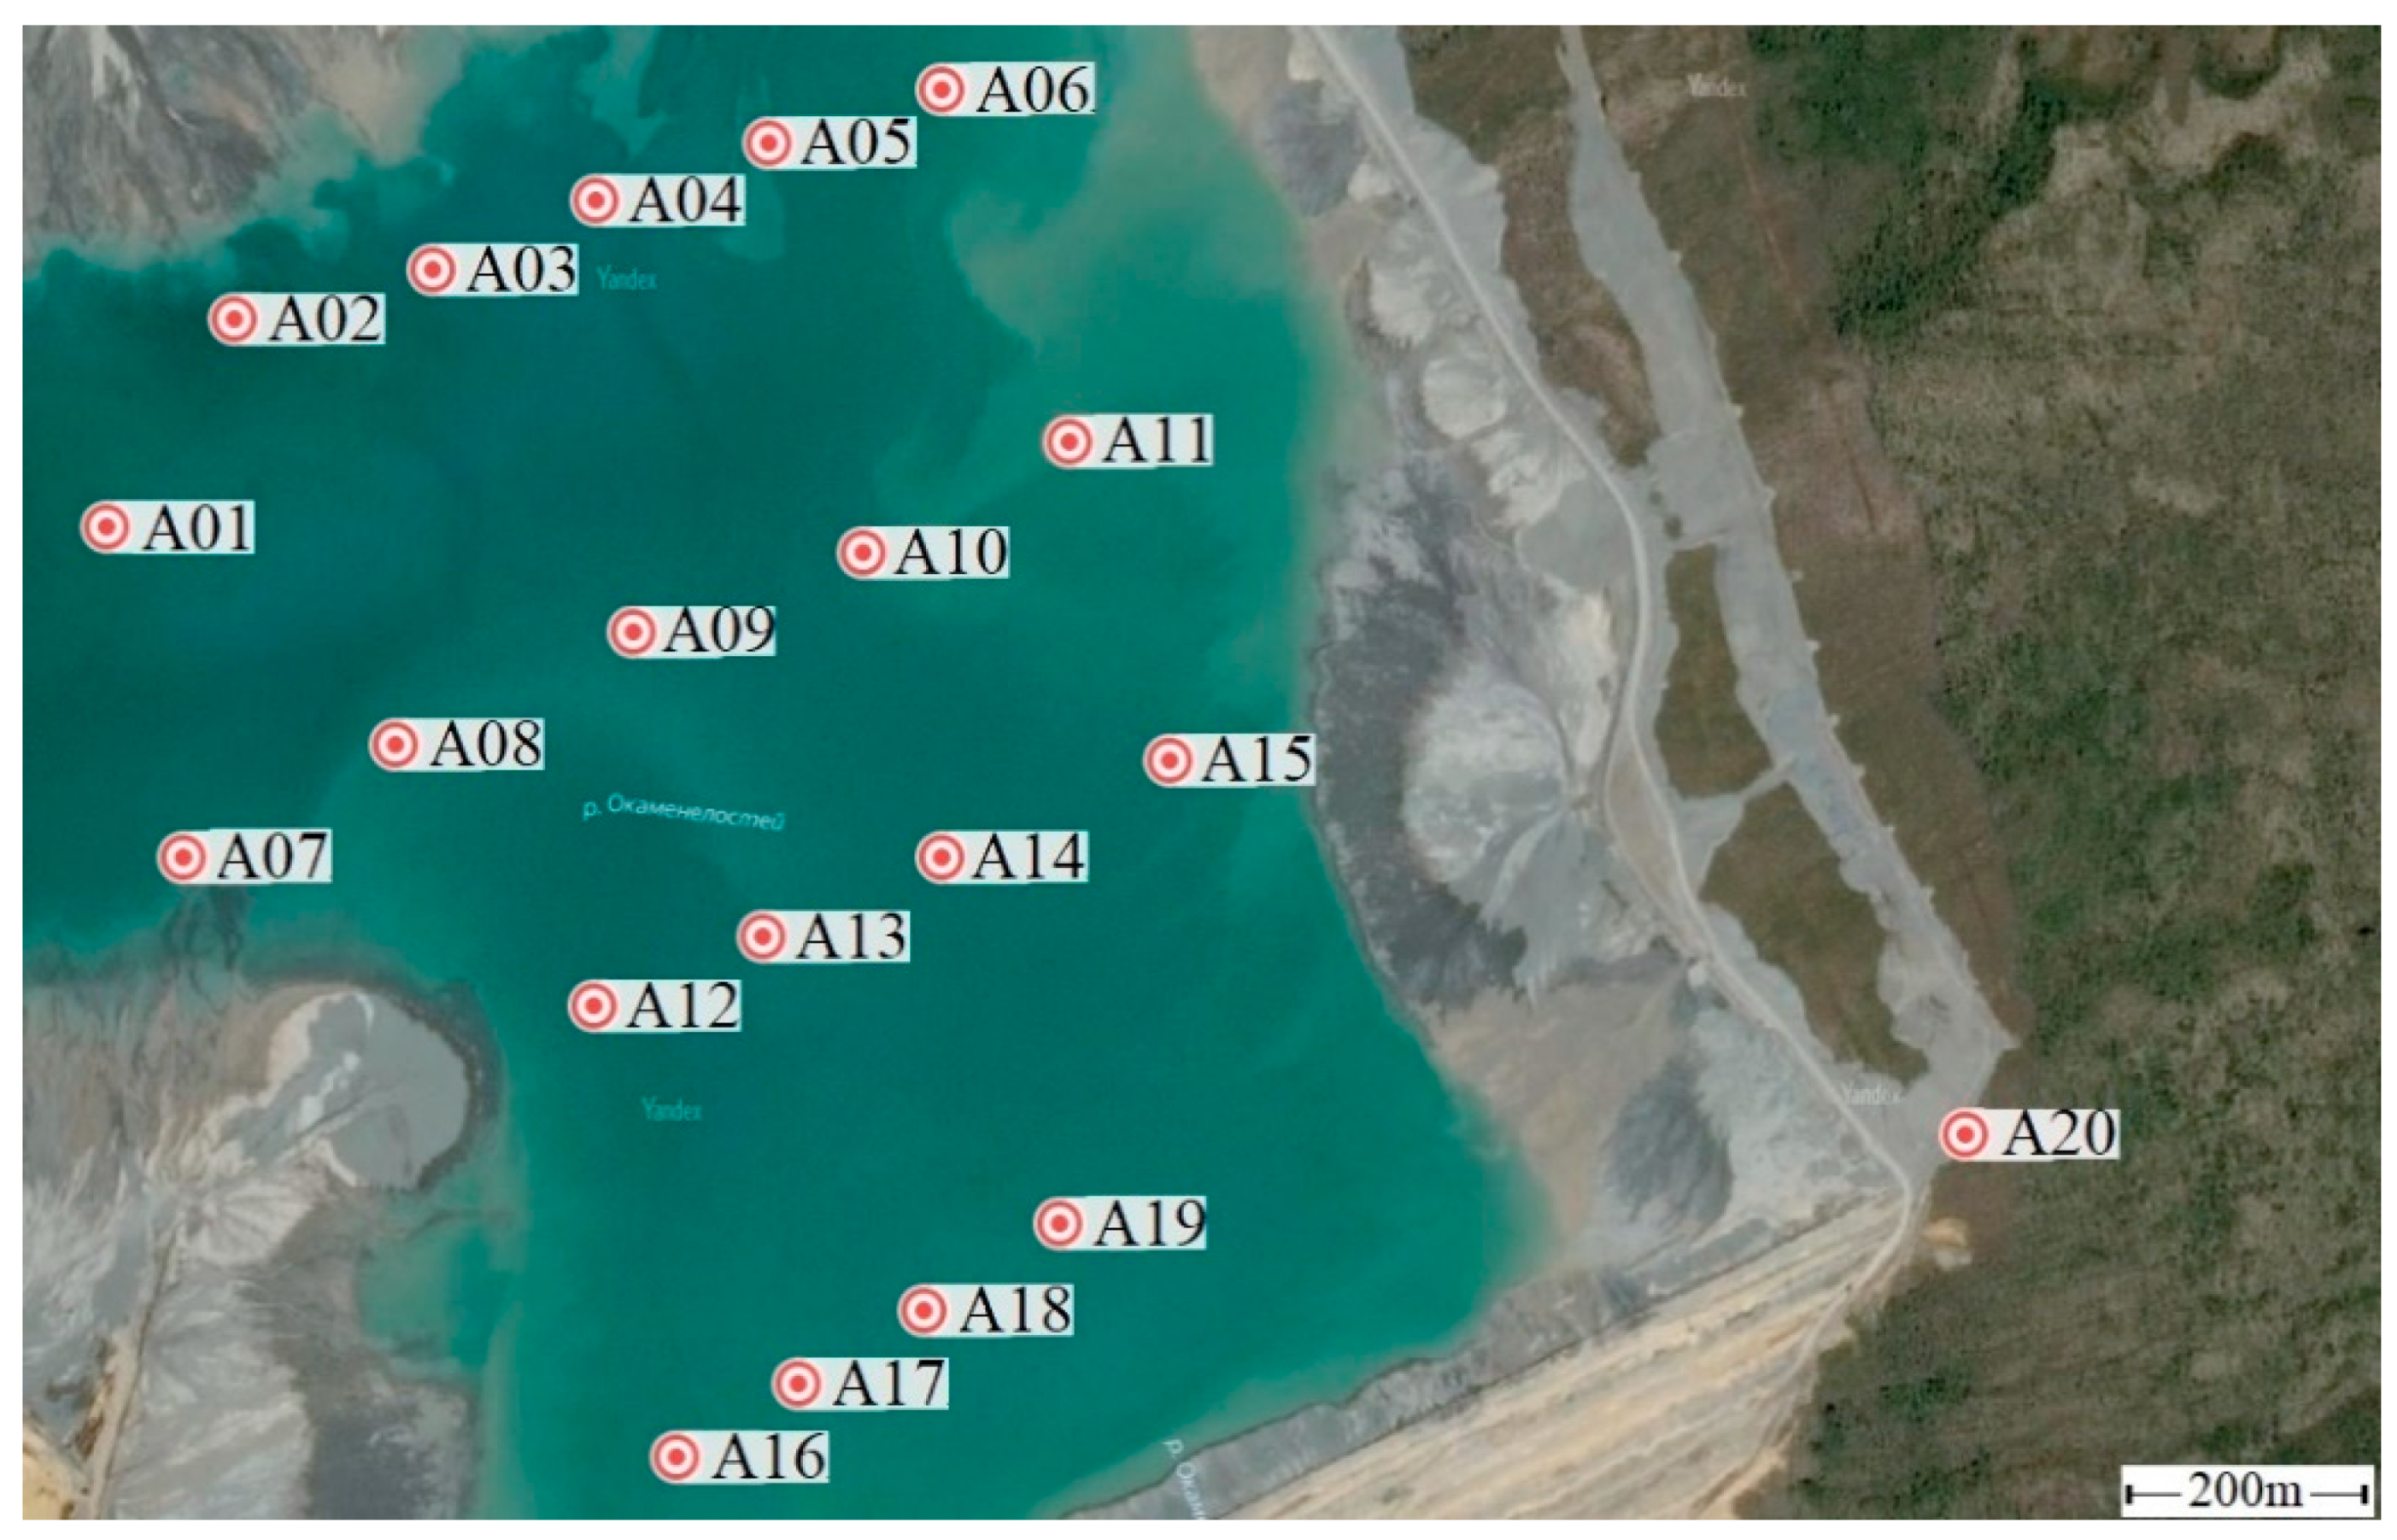
2.2. Sampling and Sample Preparation

Rock samples were collected from six wells, t1–t6, shown in Figure 2. Specifically, 47 cores were used, including carbonate-marly deposits of the Ordovician Kylakh Formation, carbonate deposits of the Silurian Landover Formation, sandy siltstone, eluvial-deluvial, eluvial, and technogenic deposits. Sample preparation stages comprised crushing, quartering, screening to a ≤0.25 mm fraction, preparation of the 0.5–0.25 mm crushed fraction, and mineralogical analysis, including separation of heavy and light fractions.
Surface water samples of 1 L volume were taken at 20 points in the settling pond (Figure 3) from surface, near-surface (0.2 m depth), and bottom (2 m depth) horizons. In situ, a portion of the sample (50 mL) was filtered using a membrane filter with a pore size of 0.25 μm and acidified with concentrated distilled nitric acid (500 μL per 50 mL sample) to preserve the sample and further determine its trace element composition. In addition, the trace element composition of another portion of the filtered but unacidified sample was also determined.

2.3. Analytical Work

The basement rock samples were analyzed at the analytical center in the Sobolev Institute of Geology and Mineralogy of Siberian Branch of Russian Academy of Science. (SB RAS), to determine the content of the petrogenic components (i.e., SiO2, Al2O3, TiO2, etc.) using X-ray fluorescence (XRF) analysis. The samples for analysis were dried at 105 °C for 1 h, heated to 1000 °C for 2.5 h, and then mixed with a flux (66.67% lithium tetraborate, 32.83% lithium metaborate, and 0.5% lithium bromide) in a ratio of 1:9; the total weight of the mixture was 5 g. The mixture was then melted in platinum crucibles in a Lifumat-2,0-Ox induction furnace (Linn High Therm Gmbh, Eschenfelden, Germany). The glasses obtained in this way were analyzed using an ARL-9900-XP XRF spectrometer (Thermo Fisher Scientific, Waltham, MA, USA). The determination error does not exceed that specified for the second category of accuracy according to the OST 41-08-212-82 standard.
Mass fractions of the microelements in the samples were determined by inductively coupled plasma mass spectrometry (ICP-MS) at the Plasma Chemical Analytical Center (Tomsk) according to the method for measuring the mass fractions of elements in rocks by ICP-MS № 002-KhMS-2009, FR.1.31.2010.06997. The determination error did not exceed 7%.
The mineral compositions of the heavy and light fractions of the 47 rock samples were determined in the analytical center in the Sobolev Institute of Geology and Mineralogy of SB RAS using X-ray diffraction analysis (XRD) on a DRON-3 X-ray diffractometer. A 10 g weighed portion of the 0.1–0.25 mm fraction was separated from the dust fraction in water; the heavy fraction was then isolated in bromoform for each sample. X-ray phase analysis was then carried out on the prepared heavy fraction.
In addition, vibrational infrared (IR) spectra were recorded for the heavy fraction of eight samples. This technique records the short-range order of the structural organization of substances. IR spectra were recorded in the range 400–4000 cm−1 on a Brucker VERTEX 70 FT IR spectrometer. Samples were prepared for this procedure by mixing with KBr and pressing into tablets.
For the water samples collected from the tailings pond, the pH, redox potential (Eh), and electrical conductivity were determined in situ using potentiometric and conductometric methods. The pH and Eh values were measured using an Expert-001-3.0.1 ionomer. The limits of the basic absolute error of the analyzer are ±0.03 units for pH and ±10 mV for Eh. The specific electrical conductivity (EC) was measured using the conductometric method on a Cond 315i device with a tetraco325-3 sensor. The measurement range was 0–500 mS/cm and the measurement error was ±1%.
Under laboratory conditions, 500 mL of each sample were filtered through a “blue ribbon” filter and the concentrations of Cl, SO42−, NO3, NO2, and NH4+ were determined in the filtrate via capillary electrophoresis. The cation contents (i.e., Ca2+, Mg2+, K+, and Na+) and trace elements were determined using the ICP-MS method at the Plasma Chemical Analytical Center (Tomsk). The determination error did not exceed 5%.

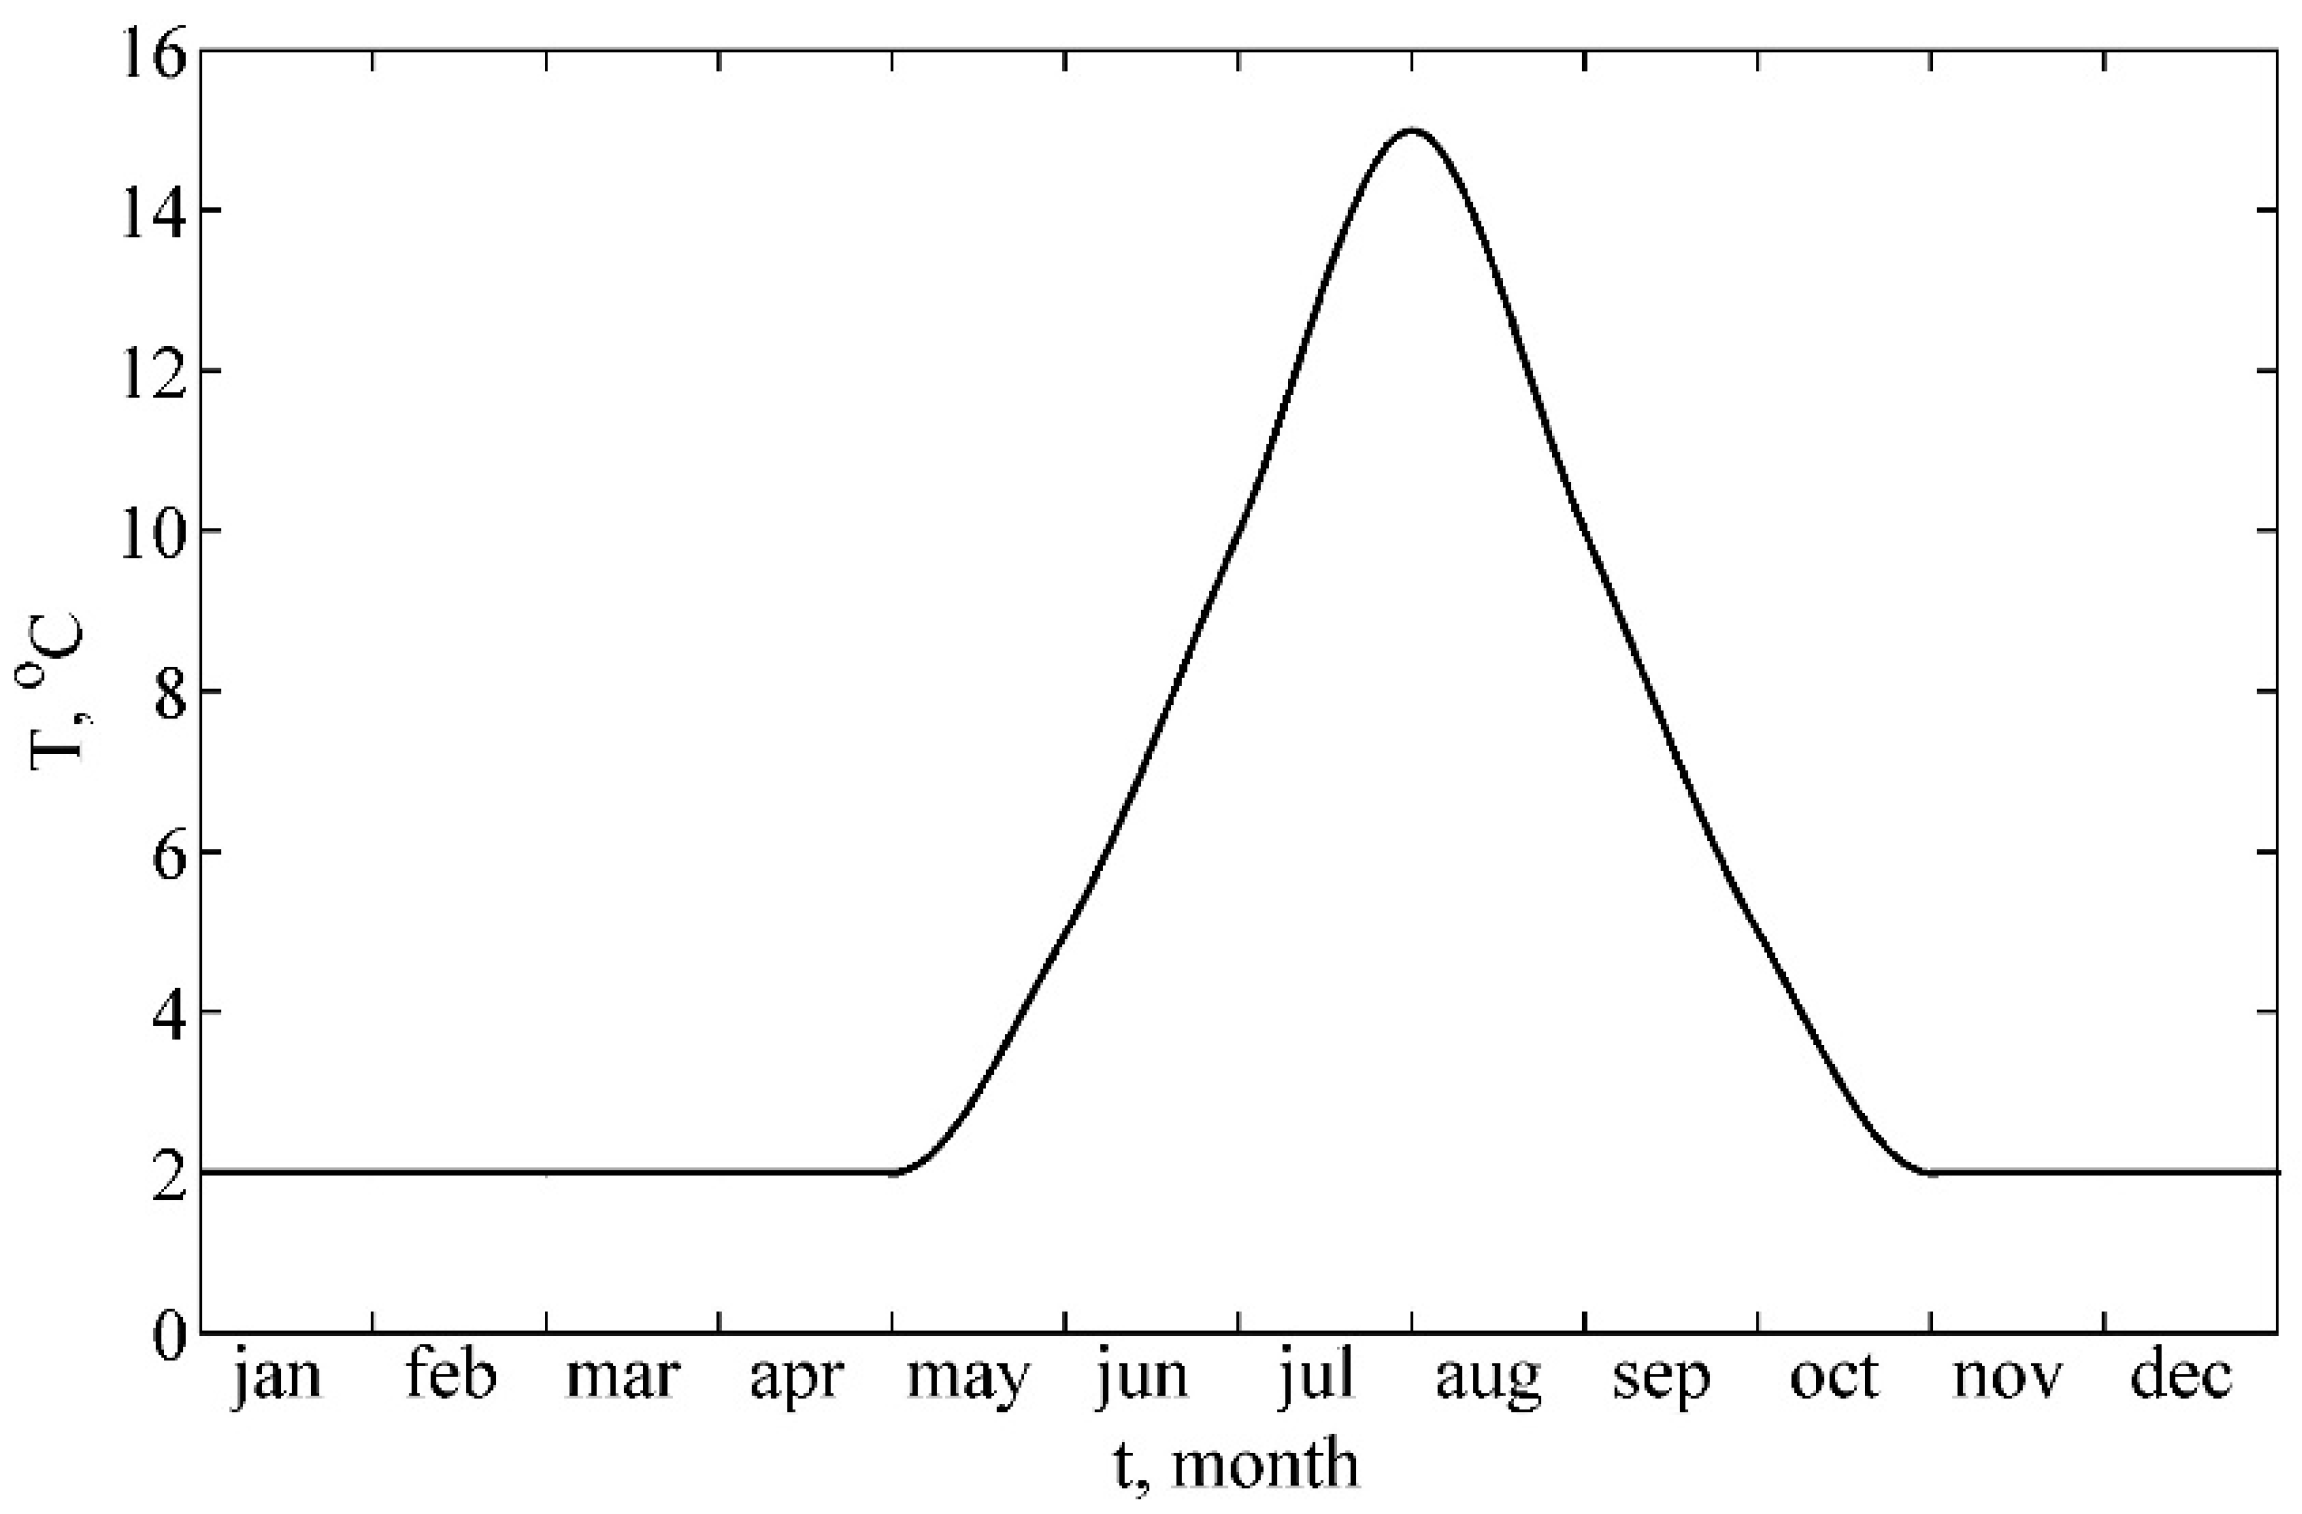
2.4. Thermophysical Modeling

Heat transfer and rock thawing due to physical heating by filtering circulating water with positive temperatures (from 2 to 15 °C, see Figure 4) through the rock were calculated. The circulating water moves along sub-vertical cracks in the rock, which were, therefore, modeled as sub-vertical cylindrical channels.

Model Description

The thawing of two geological columns of rocks was simulated, one in the thawed zone (well t1, Figure 2) and one in the frozen zone (well t3, Figure 2). Filtering circulating water through sub-vertical cracks in the rock was modeled as water flowing through a cylindrical channel with a 15 cm diameter and 66 m length. Water was modeled as entering the channel at a speed of 100 m/day. The outlet of the channel is at atmospheric pressure. The average temperature of circulating water at the surface of the rock and entering into the channel changes throughout the year according to the graph shown in Figure 4. At an initial time and at a large distance from the channel, the temperature is assumed to be a constant, Ti (Table 1).
Geological columns in thawed and frozen zones:
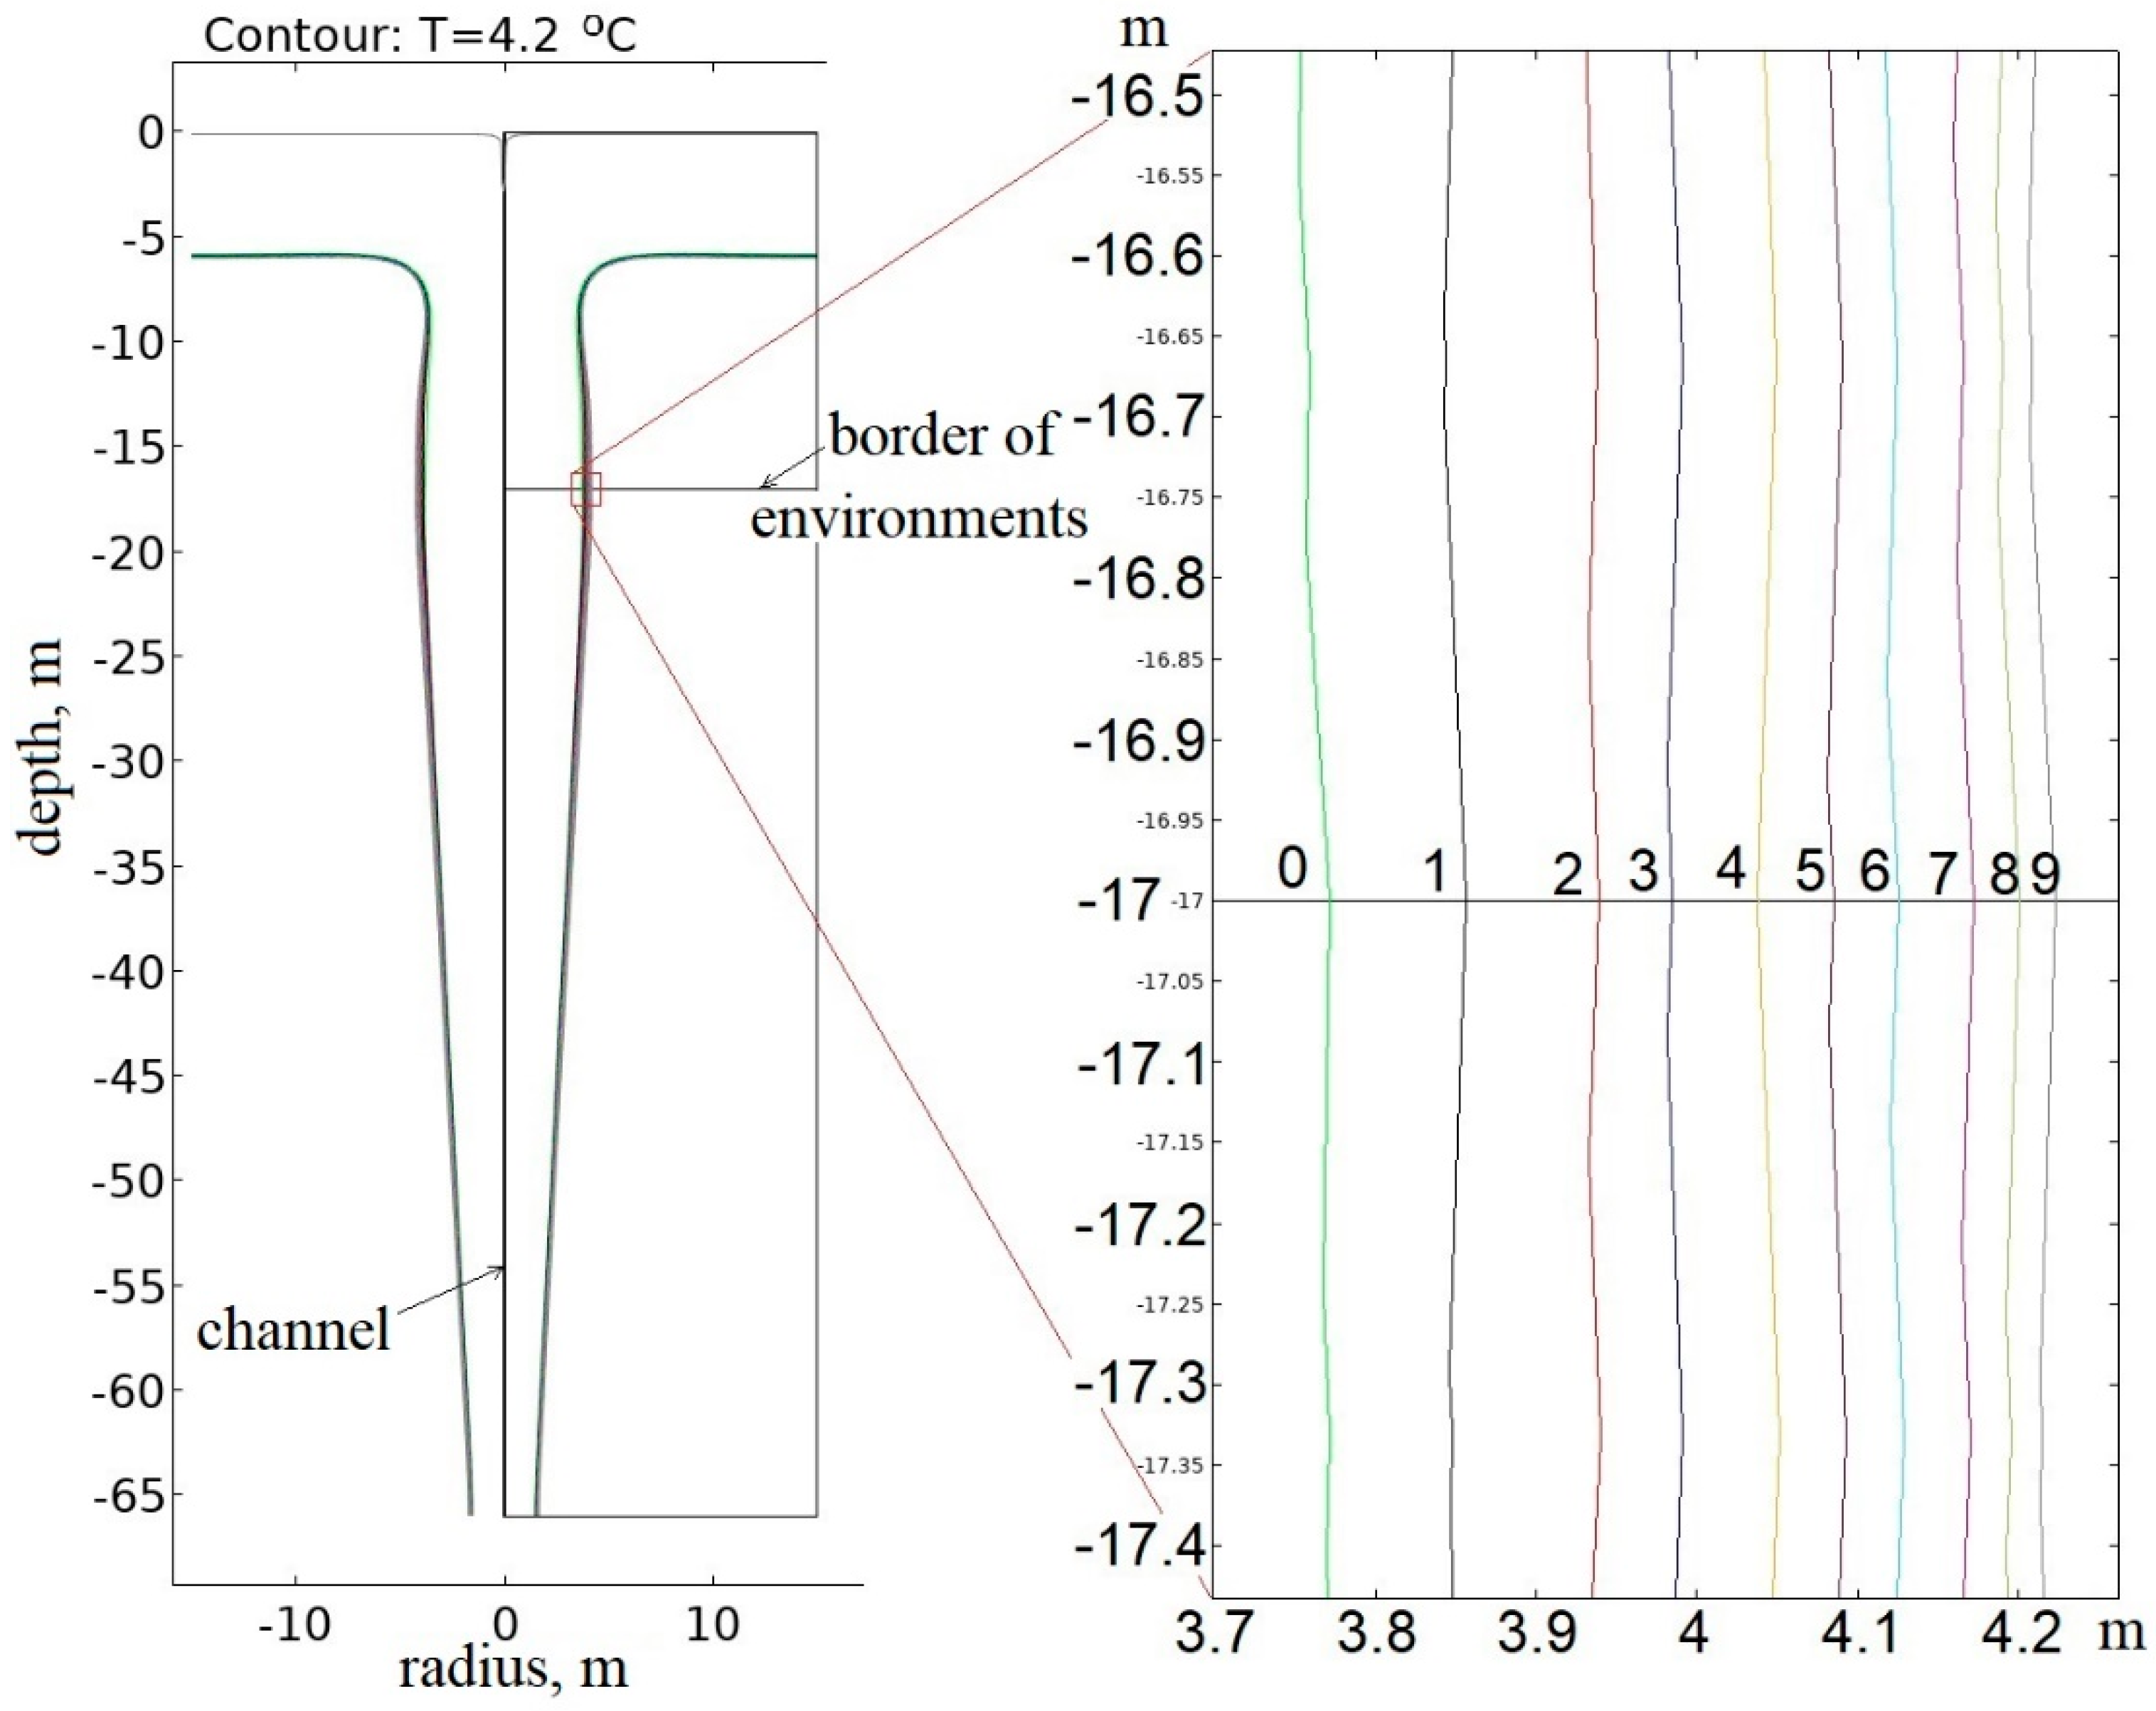
  • Well t1: total depth 75 m. Structure according to Figure 5: 0–17 m—technogenic deposits with known properties (t 1/1, Table 1); 17–66 m—fractured limestones (t 1/2, Table 1); 66–75 m—weakly fractured marl (impermeable, not modeled). The initial temperature of the well t1 rocks and the temperature at large distances from the filtration channel are assumed to be constant and time-invariant (Ti = 4 °C, Table 1).
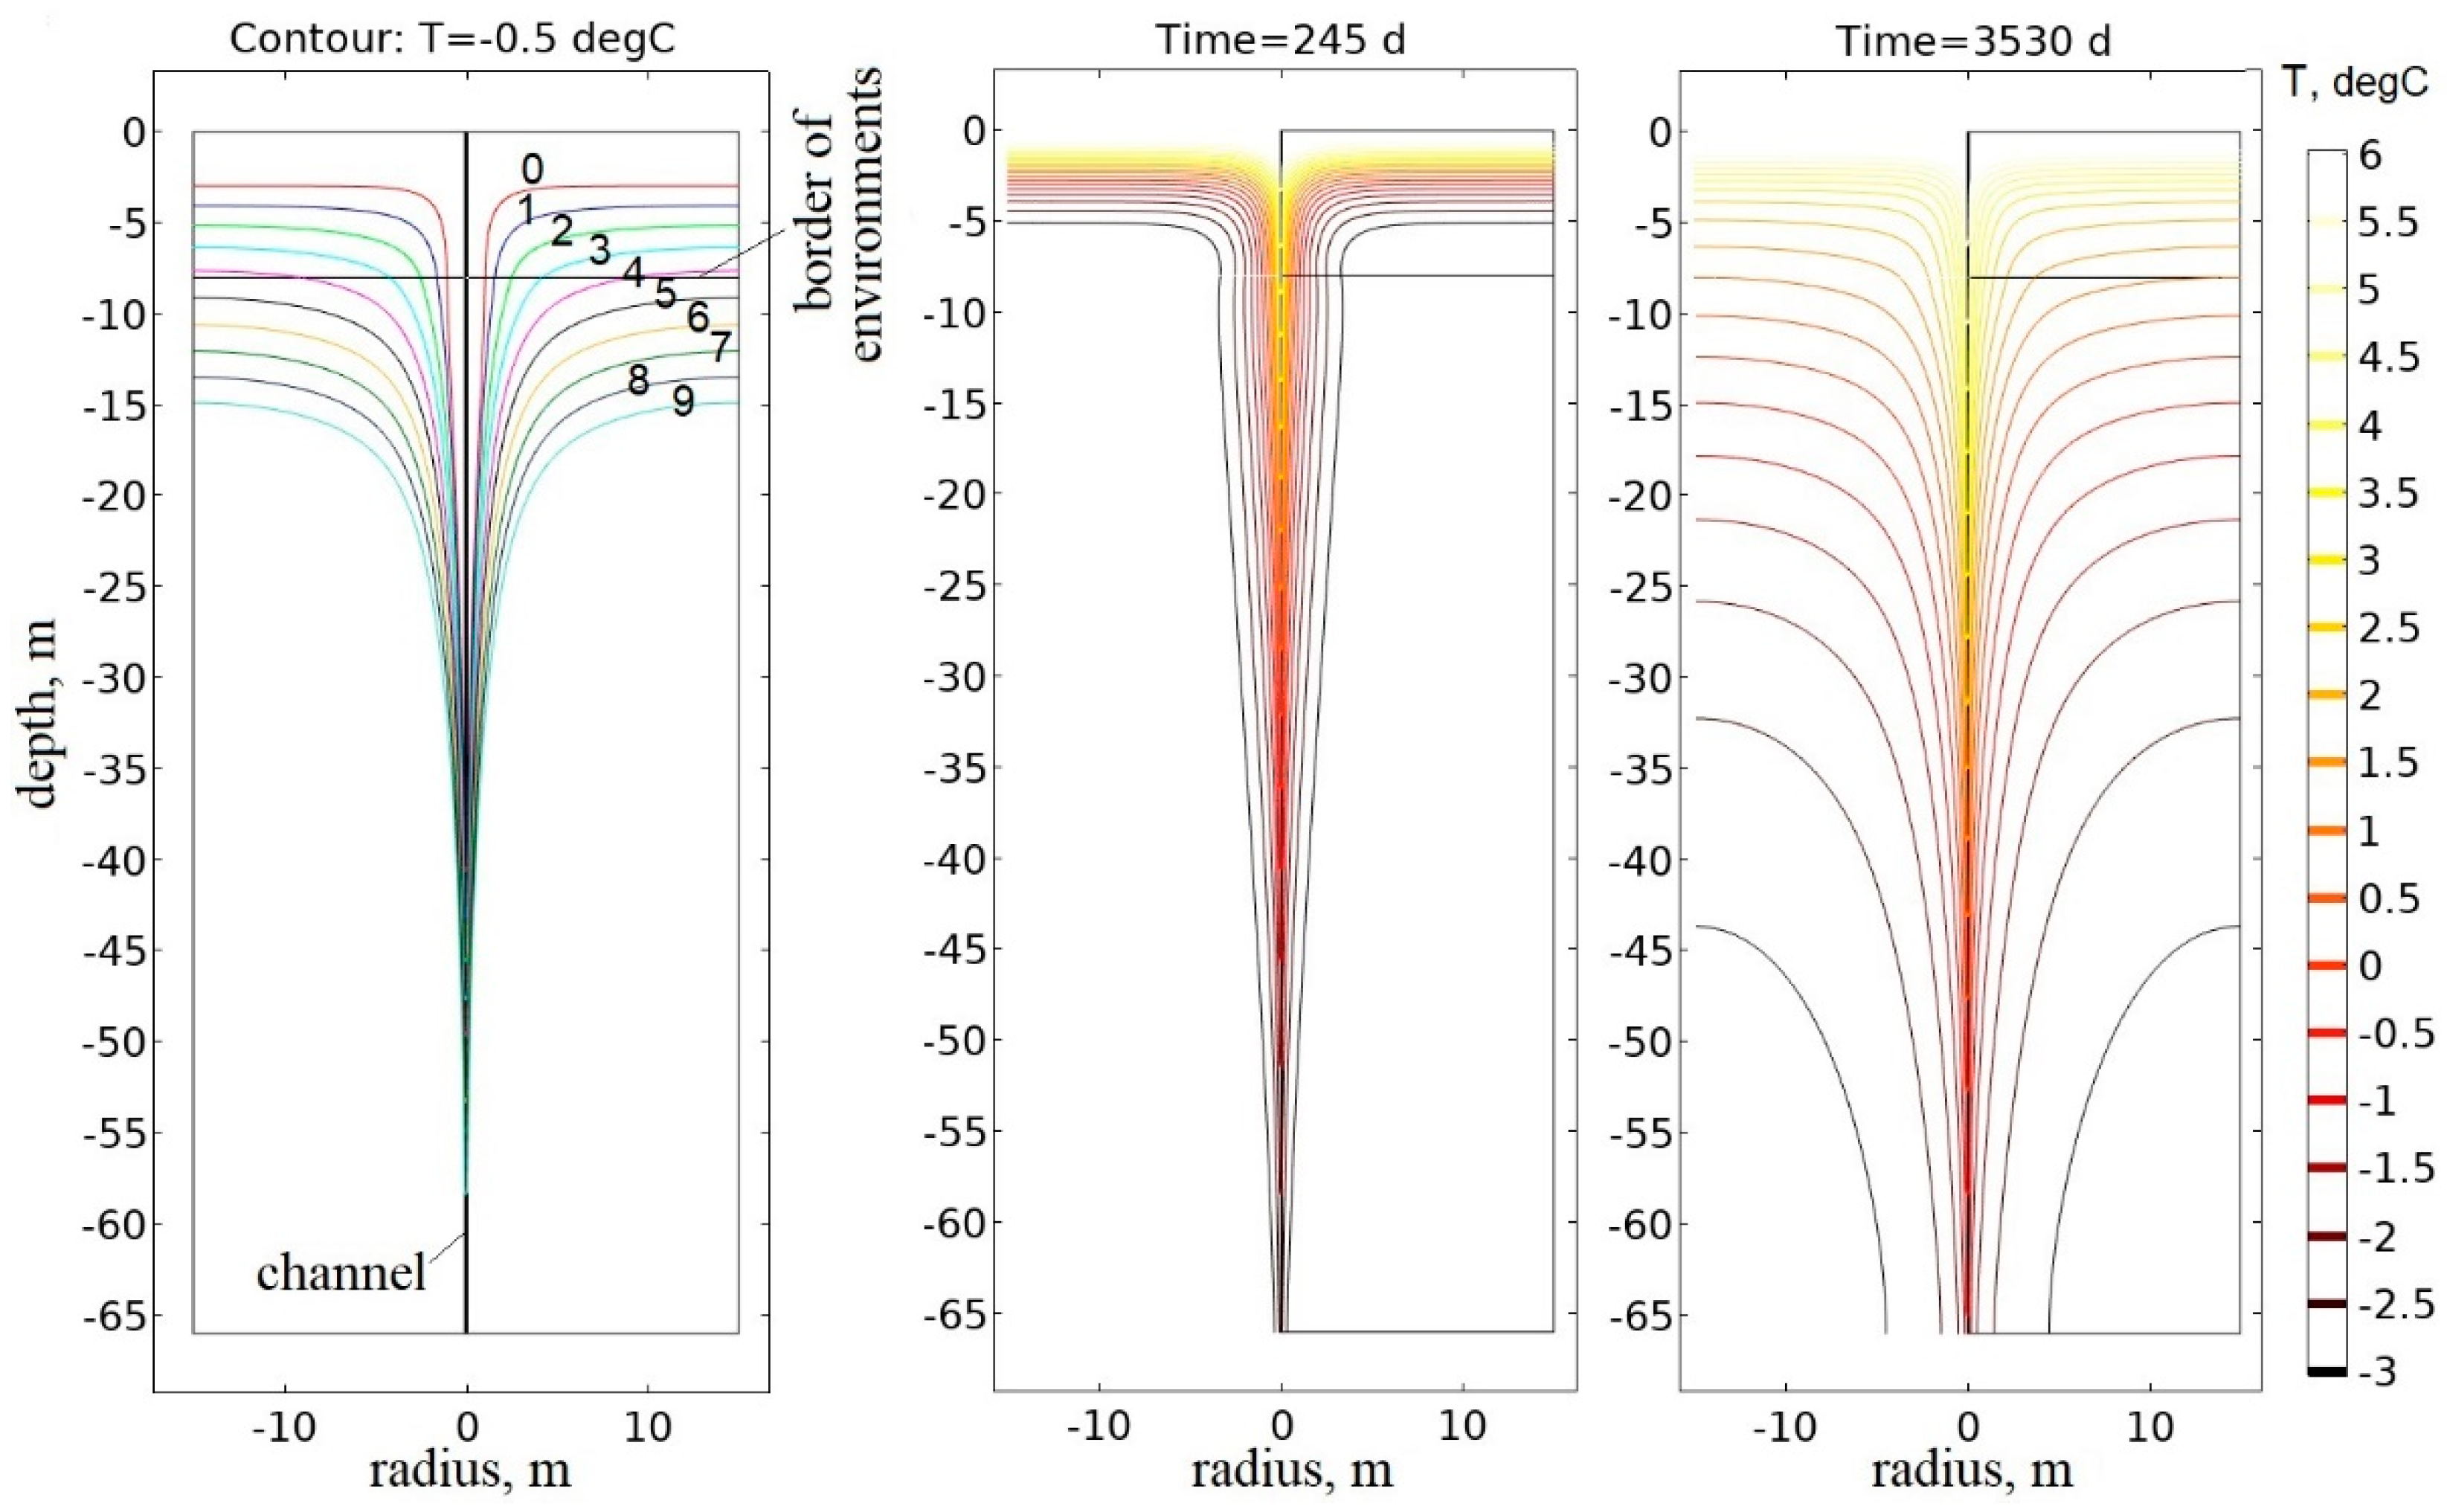
  • Well t3: total depth 70 m. Structure according to Figure 5: 0–8 m—technogenic deposits with known properties (t 3/1, Table 1); 8–68 m—fractured limestones (t 3/2, Table 1); 68 m and below—marl (impermeable, not modeled). The initial temperature of the well t3 rocks (units 3/1 and 3/2) and the temperature at large distances from the filtration channel are assumed to be constant (Ti = −4 °C, Table 1).
Table 1 shows the thermal conductivity (λ), volumetric heat capacity (C), specific heat capacity (c = C/ρ), density (ρ), permeability (k), initial temperature (Ti), and composition of the rock units in wells t1 and t3.
The distribution of water velocity in the channel was calculated for the motion of an incompressible flow in a free channel by solving the Navier–Stokes equations in a stationary setting:
ρ ( u · ) u = · [ p I + μ ( u + ( u ) T ) ] , · u = 0 .
The distribution of water velocity in the rock adjacent to the channel is calculated in a stationary setting by solving the Brinkman equation with a Forchheimer correction [21].
ρ ε p 2 ( u · ) u = · [ p I + μ ε p ( u + ( u ) T ) ] μ k u ρ ε p C f k u | u |
where u is the water velocity in the channel and adjacent rock (m/s), ρ is the water density (kg/m3), p is the pressure (Pa), εp is the porosity of the medium (1/1), μ is the dynamic viscosity (Pa·s), k is the permeability of the porous medium (m2), and C f = 1.75 150 ε p 3 is the dimensionless coefficient of friction [22].
At the start of the model, the water is considered to be motionless (u = 0) at atmospheric pressure (relative pressure is zero). At the entrance to the channel, the speed of water inflow is 100 m/day and the exit from the channel is at atmospheric pressure. At large distances from the channel, there is no water flow and a constant temperature, Ti.
It is assumed that the physical properties of the water and rock media are not temperature-dependent; the values assigned are water density of 1000 kg/m3, water dynamic viscosity of 10−3 Pa·s, medium porosity of 0.4, and medium permeability of 10−12 m2 (k). The thermal properties of media are given in Table 1.
The resulting distribution of velocities (u) is substituted into the heat conduction equation with a convective term describing the water flow and is solved in temporary settings with water temperature (both at the rock surface and the channel inlet) changing during the year, according to the graph shown in Figure 4.
( ρ c ) e f f T t + ρ f c f u · T = · ( λ e f f T )
where ( ρ c ) e f f = ( 1 ε p ) ρ s c s + ε p ρ f c f and λ e f f = ( 1 ε p ) λ s + ε p λ f are the effective volumetric heat capacity and thermal conductivity of the medium, respectively; ρ, c, λ—density, specific heat capacity, and thermal conductivity of the medium, respectively. Index s is a solid matrix of the medium and f is the fluid (water).
The temperature of the medium at the start of the simulation and at large distances from the filtration channel (Ti) are assumed to be −4 °C for frozen rock and 4 °C for thawed rock. We assume that there is no heat flux at large distances from the channel. The thermal properties of the rock are presented in Table 1. Calculations were performed using the COMSOL Multiphysics software package [23].
In addition to calculating the change in the temperature distribution in thawed and frozen rock heating by filtration channel with warm water, the change over time in heat flow through the wall of such a cylindrical channel in thawed and frozen rock, respectively, was calculated. By integrating these heat flows over time, the amount of heat transferred by warm water to the thawed and frozen rock, respectively, was calculated. Additionally, the average amount of heat transferred by the channel to the rock per year, the average power of the channel, and the average specific power of the channel were calculated.

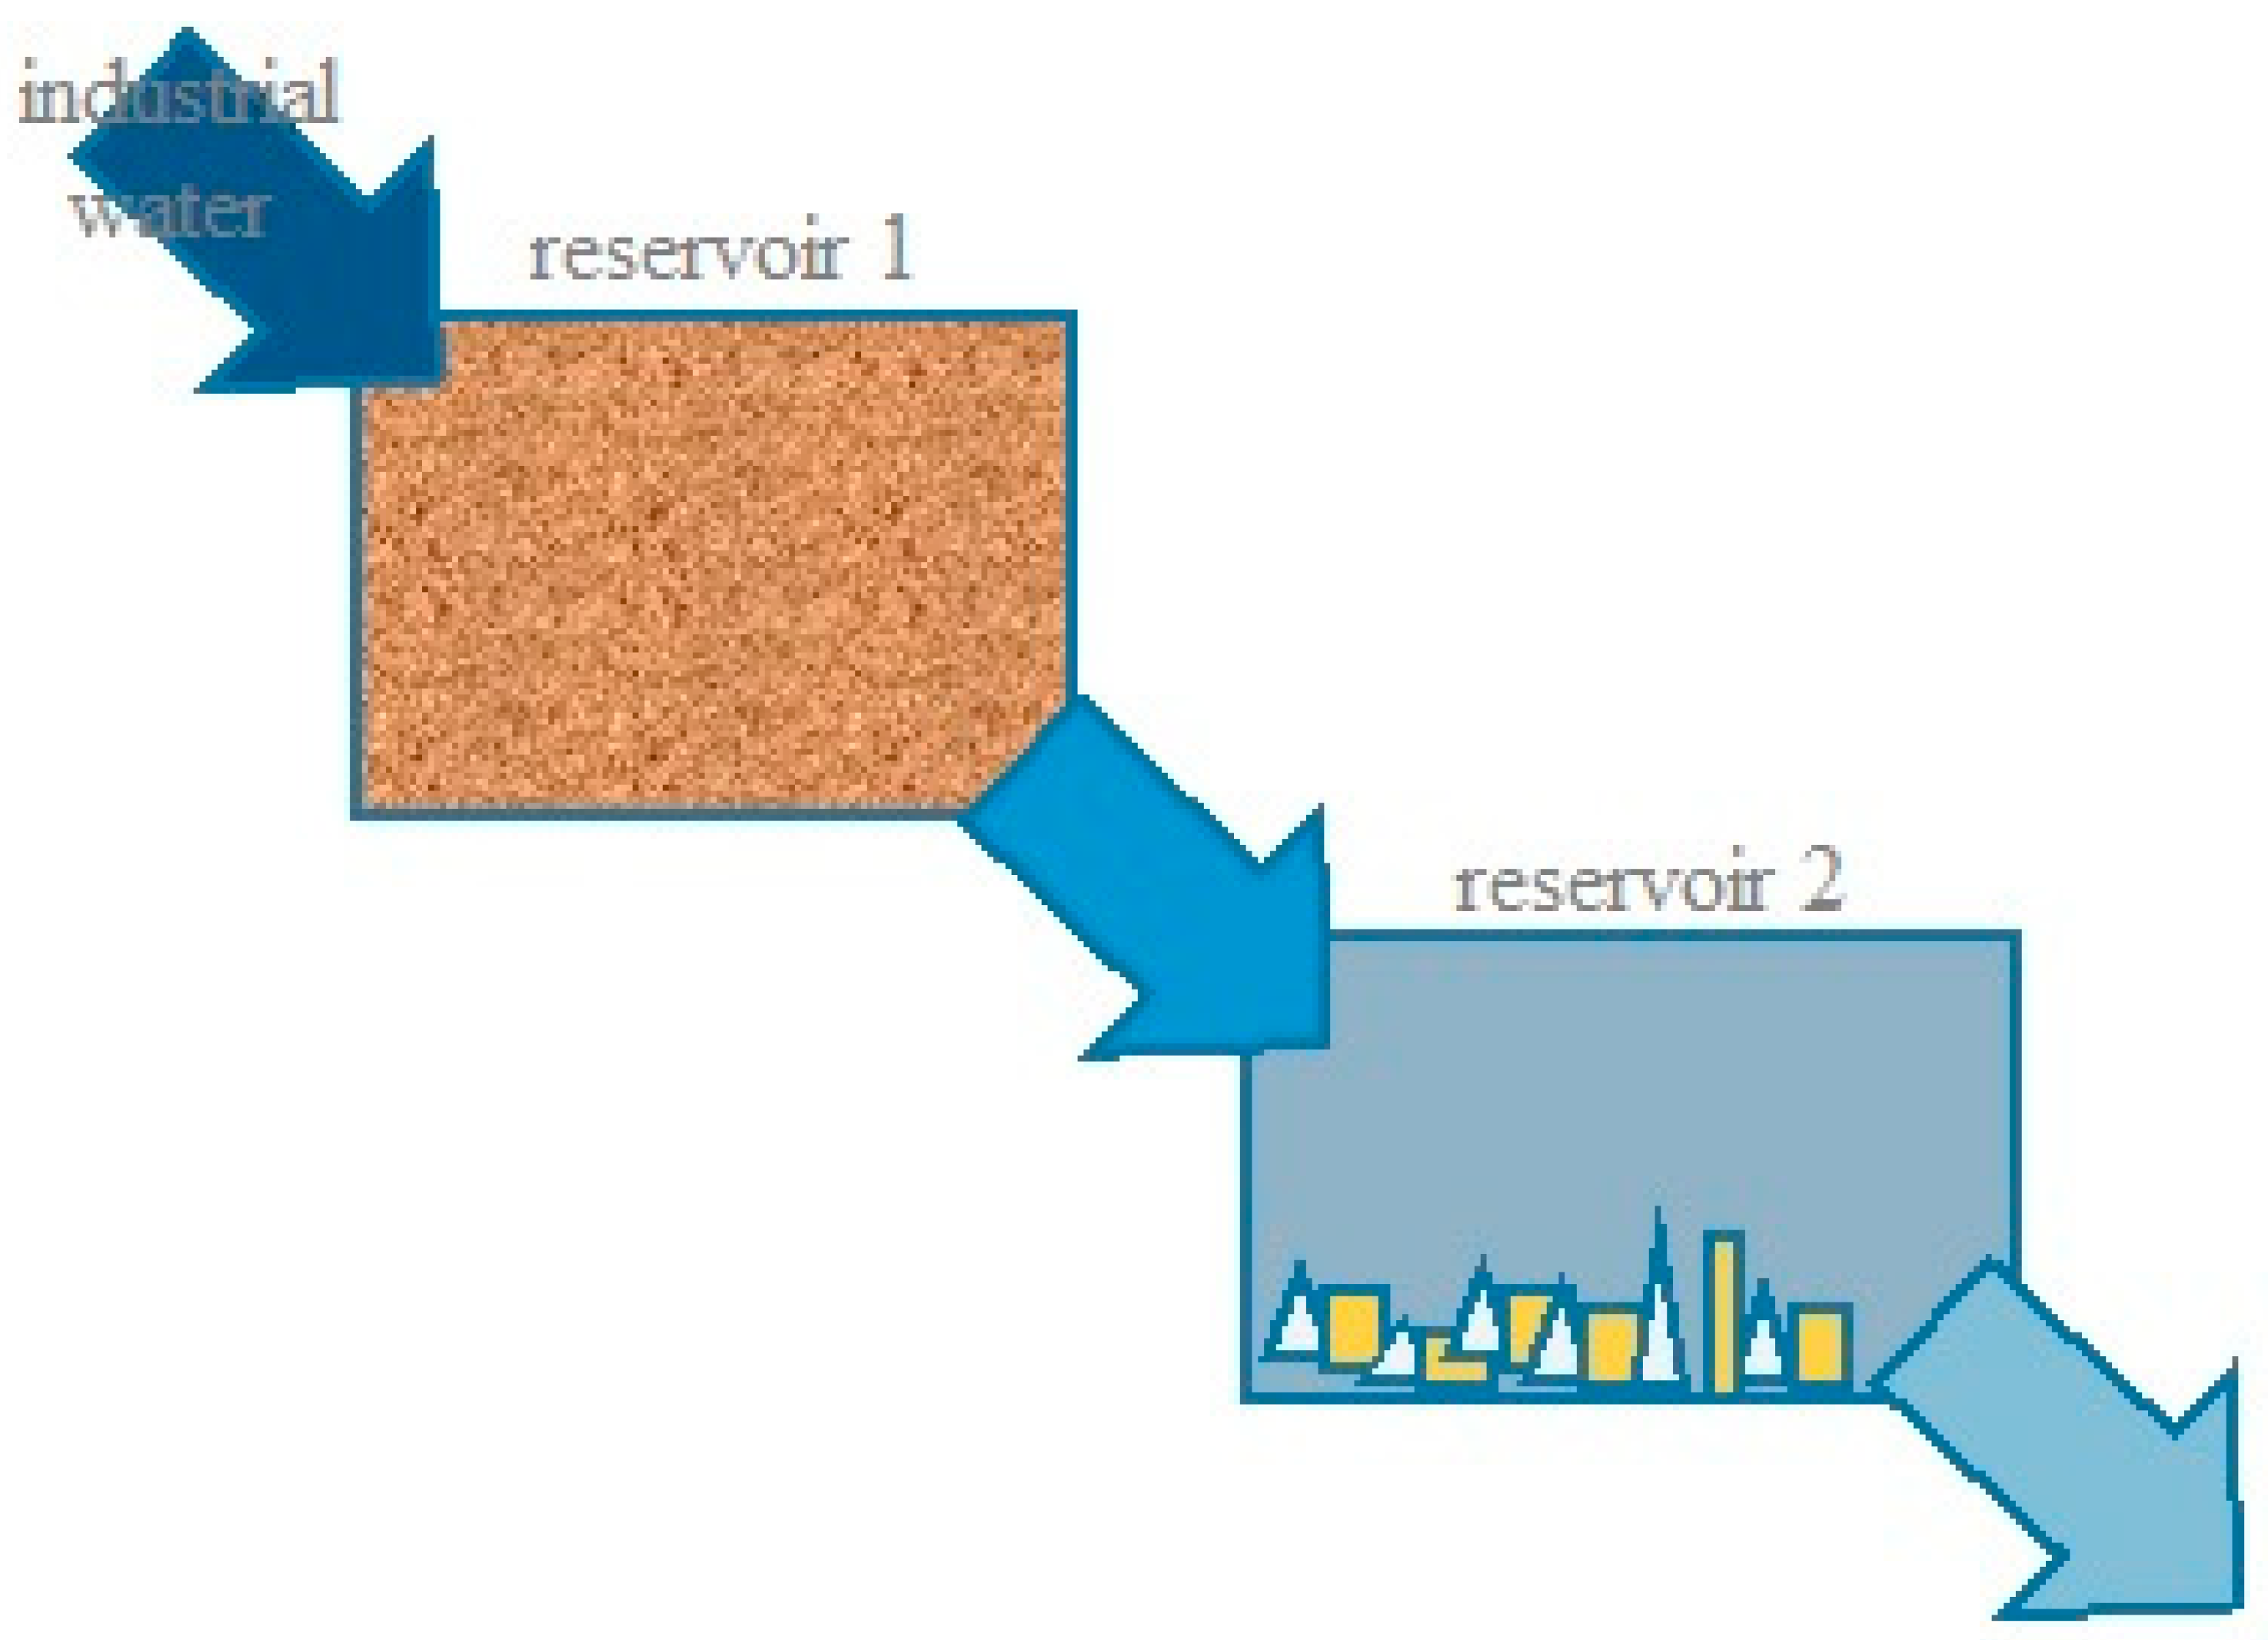
2.5. Thermodynamic Modeling

Physico-chemical modeling was carried out using the PC Selector software, developed at the Vinogradov Institute of Geochemistry SB RAS, Irkutsk [24,25,26]. To study the possibility of dam “thawing” due to equilibrium chemical reactions, two types of problems were used: minimization of the Gibbs free energy and maximization of the entropy (i.e., minimization with a minus sign) under isobaric conditions.

2.5.1. Model Description

The physicochemical model assumed that industrial waters (external environment) penetrate through the dam rocks (i.e., reservoir 1), interact with them, are changed by the interaction and change the rock, and then are removed from reservoir 1 to the empty reservoir 2 (storage pond), where the secondary minerals are precipitated (Figure 6). The process proceeds in stages, that is, at each step of the calculation, a fixed portion of the fresh solution enters reservoir 1. Of particular importance in this process is the ratio of water to rock that has entered into the reaction.

2.5.2. Initial Conditions

The compositions of three material types were selected for the calculations—marls, limestones, tailings, and solutions from the settling pond (Table 2 and Table 3).
The calculation was carried out for the 21 chemical elements. Equilibrium was calculated for 480 possible ions in solution and 860 minerals based on the thermodynamic data. In the model, the pressure and oxygen content were assumed to be atmospheric and the tested temperature values ranged from 2 to 8 °C. In this temperature range, the equilibrium composition of solutions and the mineral composition were found to be unchanged; therefore, T = 2 °C was selected, as this most closely corresponds to field observations in the study area.
In the first stage, equilibria in solutions were calculated using the example of sample A01 (Table 3). It was assumed that the oxygen content in the system corresponds to atmospheric oxidizing conditions. Under these conditions, the calculated pH value of the system is fully consistent with the measured one. This allows us to verify the simulation results with field observations.
The degree of dissolution and transformation of the rock is determined by the ratio of water–rock interaction. To estimate the amount of rock that reacts and dissolves, field observations are necessary. We applied a method of evaluating the ratio of changes in bicarbonate ions in the solutions of the settling pond and the storage pond, which indirectly indicates the dissolution of carbonate minerals in the filtering dam of the tailing dump.

3. Results

3.1. Thermophysical Modeling Results

3.1.1. Thermophysical Modeling Results for the Frozen Rock Mass

Figure 7 shows contour plots constructed in the plane secant to the channel, including the axis of this channel (radius = 0), to visualize changes over a period of 10 years in the temperature distribution in the channel. The physical conditions of the filtering water and frozen rock are given by the previously described initial and boundary conditions for well t3 (see Section 2.4).
The leftmost plot in Figure 7 shows contour lines corresponding to a temperature value of −0.5 °C over time. The values correspond to time points in the simulation; for example: 0 corresponds to 0 years and 245 days (i.e., 2 September of the 1st year); 1 corresponds to 1 year and 245 days (i.e., 2 September of the 2nd year), and so on until the value of 9, which corresponds to 9 years and 245 days (i.e., 2 September of the 10th year) after the start of the simulation.
The middle and right plots (Figure 7) show the modeled temperature distribution in the frozen rock at two points in time: 245 days (2 September of the 1st year) for the middle plot and 3530 days (2 September, 10th year) for the right plot. The temperature values in the plots are shown by the color bar on the right-hand side in Figure 7. There is a noticeable thawing of the rock from the surface and the upper part of the filtration channel (15 m downward movement of the 0 °C contour over 10 years).
The amount of heat transferred by warm water to the frozen rock over 10 years is found to be 207.8 GJ, i.e., an average of 20.78 GJ per year. Calculating the corresponding average channel power yields a value of 659.01 W, with an average specific heat flux of 21.26 W/m2.

3.1.2. Thermophysical Modeling Results for the Thawed Rock Mass

Figure 8 shows a contour plot constructed in the plane secant to the channel, including the channel axis (radius = 0) to visualize modeled changes in the temperature distribution over 10 years. The thawed rock is under the previously described initial and boundary conditions for well t1 (see Section 2.4).
Figure 8 shows contour lines of the temperature distribution in thawed rock (well t1) at different points in time. The contour lines correspond to a temperature value of 4.2 °C at different times; the numbers correspond to the same simulation times as those in the leftmost plot in Figure 7. The overall simulation period is 10 years. The ambient rock temperature is 4 °C and the velocity of water flowing into the cylindrical channel is 100 m/day. Far from the channel, the temperature is 4.0 °C and near the channel, is higher than 4.2 °C. A slight movement of the temperature isotherm (+4.2 °C) from the channel over time is observed (~0.5 m lateral movement over the duration of the simulation).
The amount of heat transferred by warm water to the thawed rock over 10 years is calculated to be 8.39 GJ or an average of ~0.84 GJ per year. The average channel power was calculated as 26.62 W, with an average specific heat flux of 0.86 W/m2. If the thermal power of the channel drops to zero, then the thawing effect of the channel on the rock will end and only seasonal temperature fluctuations will be observed.

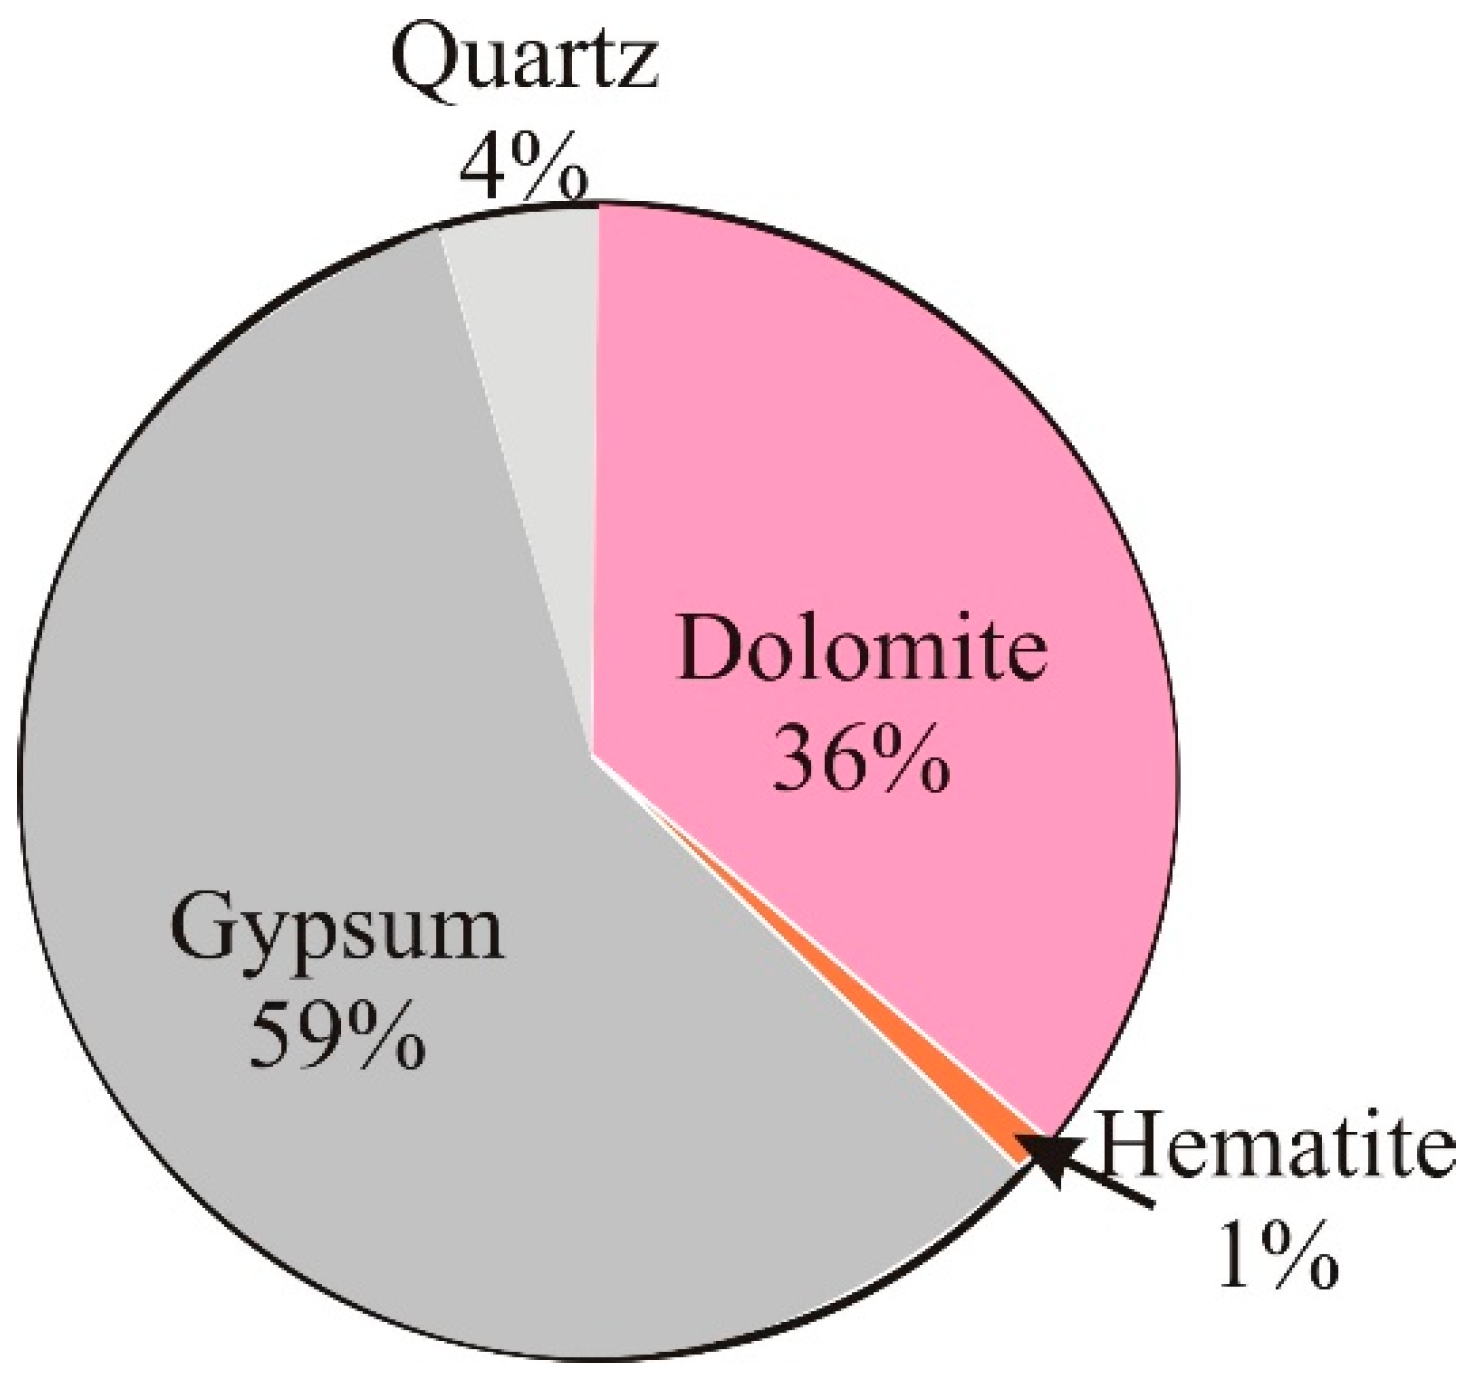
3.2. Thermodynamic Modeling Results

As shown in Figure 9, when equilibrium at 2 °C is reached, a small amount of gypsum, dolomite, quartz, and hematite is precipitated from the solutions.
A slightly modified chemical composition will enter the storage pond. With the temperature increase in the shunting tank storage pond only from the equilibration solution, i.e., without interaction with the sides of the tailing dump, only dolomite deposition is possible. The reactions are exothermic and when the solution is equilibrated, the temperature rises by 4.2 °C, irrespective of the initial temperature (initial values from 2 to 8 °C were estimated).
Two scenarios mineral equilibria for limestones, tailings (psephites), and marls are shown in Figure 10, namely, “dry rocks” and equilibria after the addition of a 10% solution (A01).
As shown, when reacting with a solution, the composition of the rocks changes, and the proportion of water-bearing minerals increases. The most significant changes occur in limestones; marls are also subject to a noticeable change in mineral composition. In addition, the reactions of the replacement minerals under exogenous conditions are much slower than primary minerals. Due to the increase in volume, the permeability of the rock decreases and natural seals are formed. In addition, minerals containing a hydroxyl group (i.e., OH−) have higher sorption capabilities as an example—the formation of illite, chlorite due to the transformation of primary silicates, gypsum instead of anhydrite, an increase in the proportion of dolomite due to the destruction of Mg-containing minerals.
Notably, there is no specific formula for calculating the degree of rock transformation; this phenomenon instead depends on many factors including temperature, pressure, fluid flow, interaction surface, etc. According to changes in bicarbonate ions in the solutions, we estimated that 0.0001% of limestone would react if the rock composition of the entire dam massif is taken into account. If we consider the reactions of water–rock interaction in the predicted bypass filtration zones, then, according to our estimates, 0.01% of limestone would undergo the dissolution processes.
First, we considered the possibility of exogenous reactions increasing the temperature due to chemical reactions during the equilibration of solutions. The temperature changes (ΔT °C) were calculated for the rocks, assuming that 0.01% of the rock mass entered into reactions with a solution. When comparing the heat released during the interaction of solutions with tailings, marls, and limestones, we calculated that the maximum heat release occurs with limestone. In addition, based on field observations in the study area, limestones are the most susceptible lithology to weathering by the modern anthropogenic processes occurring in the tailing dump.
The temperature changes during the dissolution reactions of 0.00001–0.12% limestone were also calculated. In the range from 0.00001% to 0.001% limestone dissolution, the temperature change is determined only by the solution equilibration reaction and reaches a value of 4.2 °C. If 0.01% of the mass of limestone dissolves, the contribution from changes in the limestone reaches 2.6 °C. Based on the field observations, it can be assumed with a high degree of certainty that between 0.01 and 0.1% of the rocks are currently reacting, therefore, more detailed calculations were carried out for this interval of the solution/rock ratio. Based on these calculations, the temperature will rise until the solution/rock ratio reaches 0.06%. Furthermore, due to the formation of a stable mineral association, the temperature remains level at 2.6 °C. The next temperature rise will occur in the case of strong chemical weathering of rocks when the solution/rock ratio reaches 0.1% (note that this was the scenario modeled using kinetic laboratory experiments).
The amount of energy received by the rock due to a dissolution of 0.01% of the limestone and equilibration of the solutions was 0.37 GJ for a 10-year period. This calculation is based on the known volume, density, and heat capacity of the rock (see Table 1), and the change in temperature (10 °C) of the rock as the results of limestone dissolution and equilibration of the solutions. This is equivalent to 4.4% of the estimated energy received by rocks in the thawed massif due to heating by circulating waters.

4. Conclusions

In cold climates, mine reclamation is a major challenge for mining companies. Traditional methods of mine reclamation are challenging due to their remoteness, severe climatic conditions, and the effects of climate change. Tailing dumps from mining and mineral processing enterprises have a number of environmental consequences. In cases when tailings contain sulfides these include the formation of a highly mineralized acidic drainage solution, which can migrate outside the tailing dumps, leading to the pollution of surface and ground waters of the surrounding area. Interactions of water with tailings in cold climates often lead to the thawing of permafrost soils, formation of man-made taliks, and leakage of man-made waters. In the case of the development of fault zones in these areas, acidic solutions are often filtered outside the tailing dump, promoting further development of filtration channels and more intense leakage of acidic solutions. In order to prevent leakage of acidic solution from tailing dumps in time, it is necessary to determine the thawing zones and prevent the formation of filtration channels. In the case of the formation of a filtration channel, it is necessary to know the rate of rock thawing near the formed filtration channel.
In this study, for the tailing dump of the concentration plant №14 a complete analysis of the silicate group oxides in the composition of rocks and water in the settling pond and storage pond indicates the possibility of limestone dissolution processes with Ca leaching, destruction of the carbonate matrix, and the transition of hydrocarbonate anions into solution.
The water in the settling pond and storage pond is brackish, with a sulfate-chloride composition; the reaction of the medium is neutral.
The rocks of the dam foundation have the potential to dissolve under chemical action from aggressive sulfate-chloride solutions (simulating the effects of process waters). In limestones, the proportion of water-soluble forms of calcium varies from 0.003 to 0.01%, in marls the range is 0.008–0.14%, and in tailings, the range is 0.013–0.017%. Mobility in aqueous solutions of magnesium is similar to calcium.
The heating effect of industrial water filtering through a channel in the thawed and frozen rock of the dam base of a hydraulic structure for a 10-year period was calculated. According to the results of physical modeling, the permafrost thawing zone is located radially from the axis of the crack, along which the water is filtered. The radius of the thawing zone in frozen rocks was determined to be 1.5 m in the first year and the average amount of energy expended on thawing is 20.78 GJ per year. For thawed rock, the average amount of energy expended on heating is 0.84 GJ per year. The amount of energy transferred by the water to the frozen and thawed rock over 10 years was calculated using thermophysical modeling and was 207.8 GJ and 8.39 GJ respectively.
According to the known volume of thawed rock, density and volumetric heat capaci-ty of the rock, mass fraction of the reacted rock (0.01%), and temperature rise during reac-tions calculated using thermodynamic modeling, the amount of energy received by the rock during a 10-year period as a result of rock dissolution and equilibration solutions was calculated (0.37 GJ). This is equivalent to 4.4% of the energy received by the thawed rocks due to heating from circulating water.

Author Contributions

Conceptualization, N.Y., I.F. and E.S.; methodology, N.Y., I.F., E.S.; software, I.F., E.S.; validation, A.Y., S.B.; formal analysis, N.Y.; investigation, N.Y., I.F., E.S., A.Y., S.B.; resources, N.Y., A.Y.; data curation, N.Y., I.F.; writing—original draft preparation, N.Y., I.F., E.S., A.Y.; writing—review and editing, N.Y., I.F.; visualization, A.Y., I.F., E.S.; supervision, N.Y., S.B.; project administration, N.Y.; funding acquisition, N.Y. All authors have read and agreed to the published version of the manuscript.

Funding

This research was funded by Ministry of Education and Science of Russian Federation, grants number 0266-2019-0008, 0331-2019-0031. The APC was funded by Russian Foundation of Basic Research (20-05-00336).

Institutional Review Board Statement

Not applicable.

Informed Consent Statement

Informed consent was obtained from all subjects involved in the study.

Data Availability Statement

Data are available upon request to the corresponding author.

Conflicts of Interest

The authors declare no conflict of interest.

References

  1. Lessard, F.; Bussière, B.; Côté, J.; Benzaazoua, M.; Boulanger-Martel, V.; Marcoux, L. Integrated environmental management of pyrrhotite tailings at Raglan Mine: Part 2 desulphurized tailings as cover material. J. Clean. Prod. 2018, 186, 883–893. [Google Scholar] [CrossRef]
  2. Knutsson, R.; Viklander, P.; Knutsson, S.; Laue, J. How to avoid permafrost while depositing tailings in cold climate. Cold Reg. Sci. Technol. 2018, 153, 86–96. [Google Scholar] [CrossRef]
  3. Hollesen, J.; Elberling, B.; Jansson, P. Modelling temperature-dependent heat production over decades in High Arctic coal waste rock piles. Cold Reg. Sci. Technol. 2011, 65, 258–268. [Google Scholar] [CrossRef]
  4. Nazarova, L.A.; Nazarov, L.A.; Dzhamanbaev, M.D.; Chynybaev, M.K. Evolution of thermohydrodynamic fields at tailings dam at Kumtor mine (Kyrgyz Republic). J. Min. Sci. 2015, 51, 17–22. [Google Scholar] [CrossRef]
  5. Ben Ali, H.E.; Neculita, C.M.; Molson, J.W.; Maqsoud, A.; Zagury, G.J. Performance of passive systems for mine drainage treatment at low temperature and high salinity: A review. Miner. Eng. 2019, 134, 325–344. [Google Scholar] [CrossRef]
  6. Ali, H.E.B.; Neculita, C.M.; Molson, J.W.; Maqsoud, A.; Zagury, G.J. Salinity and low temperature effects on the performance of column biochemical reactors for the treatment of acidic and neutral mine drainage. Chemosphere 2019, 243, 125303. [Google Scholar] [CrossRef] [PubMed]
  7. Edahbi, M.; Plante, B.; Benzaazoua, M. Environmental challenges and identification of the knowledge gaps associated with REE mine wastes management. J. Clean. Prod. 2019, 212, 1232–1241. [Google Scholar] [CrossRef]
  8. Tolvanen, A.; Eilu, P.; Juutinen, A.; Kangas, K.; Kivinen, M.; Markovaara-Koivisto, M.; Naskali, A.; Salokannel, V.; Tuulentie, S.; Similä, J. Mining in the Arctic environment—A review from ecological, socioeconomic and legal perspectives. J. Environ. Manag. 2019, 233, 832–844. [Google Scholar] [CrossRef] [PubMed]
  9. Colombo, N.; Salerno, F.; Gruber, S.; Freppaz, M.; Williams, M.; Fratianni, S.; Giardino, M. Review: Impacts of permafrost degradation on inorganic chemistry of surface fresh water. Glob. Planet. Chang. 2018, 162, 69–83. [Google Scholar] [CrossRef]
  10. Colombo, N.; Salerno, F.; Martin, M.; Malandrino, M.; Giardino, M.; Serra, E.; Godone, D.; Said-Pullicino, D.; Fratianni, S.; Paro, L.; et al. Influence of permafrost, rock and ice glaciers on chemistry of high-elevation ponds (NW Italian Alps). Sci. Total Environ. 2019, 685, 886–901. [Google Scholar] [CrossRef] [PubMed]
  11. Bortnikova, S.B.; Silantyeva, N.V.; Zapolsky, A.N.; Yurkevich, N.V.; Saeva, O.P.; Shevko, A.Y.; Shuvaeva, O.V.; Edelev, A.V. Assessment of acid base accounting of mine waste rocks and mobility of potentially toxic elements of the Razdolinsky ore field (Krasnoyarsk Territory). Bull. Tomsk. Polytech. Univ. Geo Assets Eng. 2018, 329, 55–72. (In Russian) [Google Scholar]
  12. Korneeva, T.V.; Yurkevich, N.V.; Aminov, P.G. Geochemical features of migration flows in the impact zone of mining technogenesis (Mednogorsk). Bull. Tomsk. Polytech. Univ. Geo Assets Eng. 2017, 328, 85–94. (In Russian) [Google Scholar]
  13. Korneeva, T.V.; Yurkevich, N.V.; Saeva, O.P. Geochemical modeling of heavy metals behavior in technogenic systems. Bull. Tomsk. Polytech. Univ. Geo Assets Eng. 2018, 329, 89–101. (In Russian) [Google Scholar]
  14. Yurkevich, N.V.; Abrosimova, N.A.; Bortnikova, S.B.; Karin, Y.G.; Saeva, O.P. Geophysical investigations for evaluation of environmental pollution in a mine tailings area. Toxicol. Environ. Chem. 2017, 99, 1328–1345. [Google Scholar] [CrossRef]
  15. Elberling, B. Temperature and oxygen control on pyrite oxidation in frozen mine tailings. Cold Reg. Sci. Technol. 2005, 41, 121–133. [Google Scholar] [CrossRef]
  16. MEND Project 1.61.2. Acid Mine Drainage in Permafrost Regions: Issues, Control Strategies and Research Requirements; Technical Report; Department of Indian and Northern Affairs Canada: Calgary, AB, Canada, 1996; 103p. Available online: http://mend-nedem.org/mend-report/acid-mine-drainage-in-permafrost-regions-issues-control-strategies-and-research-requirements/ (accessed on 1 November 2021).
  17. Pham, H.N. Heat Transfer in Waste Rock Piles Construted in a Contiuous Permafrost Region. Ph.D. Dissertation, Department of Civil and Environmental Engineering, University of Alberta, Edmonton, AB, Canada, 2013; 363p. [Google Scholar] [CrossRef]
  18. Stevens, C.W.; Shapka-Fels, T.; Rykaart, M. Thermal Cover Design for Mine Waste Facilities in Cold Regions. Conference: Thermal Cover Design for Mine Waste Facilities in Cold Regions at: Tailings and Mine Waste 2018, Keystone, Colorado. Available online: https://www.srk.com/en/publications/thermal-cover-design-for-mine-waste-facilities-in-cold-regions (accessed on 1 November 2021).
  19. Kilizhekov, O.K. Regularities of Localization and Features of Exploration of Buried Diamond Placers in the Sredne-Markhinsky Region (Yakutsk Diamond-Bearing Province). Dissertation of the Candidate of Geological and Mineralogical Sciences. 2017. Available online: https://www.igm.nsc.ru/images/diss/kilizhekov/ref_kilizhekov.pdf (accessed on 19 September 2021).
  20. Buiskikh, A.A.; Zamoshch, M.N. Prediction of thermal regime within a tailing dump under permafrost. J. Min. Sci. 2010, 46, 28–33. [Google Scholar] [CrossRef]
  21. Vafai, K.; Kim, J. On the limitations of the Brinkman-Forchheimerextended Darcy equation. Int. J. Heat Fluid Flow 1995, 16, 11–15. [Google Scholar] [CrossRef]
  22. Amiri, A.; Vafai, K. Transient analysis of incompressible flow through a packed bed. Int. J. Heat Mass Transf. 1998, 41, 4259–4279. [Google Scholar] [CrossRef]
  23. The COMSOL Multiphysics Reference Guide. Available online: http://www.lmn.pub.ro/~daniel/ElectromagneticModelingDoctoral/Books/COMSOL4.3/mph/COMSOLMultiphysicsReferenceGuide.pdf (accessed on 19 September 2021).
  24. Karpov, I.K. Physicochemical Modeling on a Computer in Geochemistry; Nauka: Novosibirsk, Russia, 1981; 247p. [Google Scholar]
  25. Karpov, I.K.; Chudnenko, K.V.; Kulik, D.A. Modeling chemical mass transfer in gheochemical processes: Thermodynamic relations, conditions of equilibria, and numerical algorithms. Am. J. Sci. 1997, 297, 767–806. [Google Scholar] [CrossRef]
  26. Chudnenko, K.V. Thermodynamic Modeling in Geochemistry: Theory, Algorithms, Software, Applications; Academic Publishing House “Geo”: Novosibirsk, Russia, 2010; 287p. [Google Scholar]
Figure 1. Satellite image of the research area.
Applsci 11 11089 g001
Figure 2. Schematic diagram showing locations of wells t1–t6 on the dam plan.
Applsci 11 11089 g002
Figure 3. Schematic of water sampling locations within the settling pond.
Applsci 11 11089 g003
Figure 4. Annual changes in average temperature of water entering the crack.
Applsci 11 11089 g004
Figure 5. The structure of wells t1 and t3, adopted for numerical modeling of thawing by circulating water.
Applsci 11 11089 g005
Figure 6. Scheme of thermodynamic modeling of the interaction of dam rocks with industrial water.
Applsci 11 11089 g006
Figure 7. Contour plots of temperature distribution in the frozen rock (well t3) at different points of time. The simulation period is 10 years. The ambient rock temperature is −4 °C and the velocity of water flowing into the cylindrical channel is 100 m/day.
Applsci 11 11089 g007
Figure 8. Contour plots of temperature distribution in thawed rock (well t1) at different times. The simulation period is 10 years. The ambient rock temperature is +4 °C and the velocity of water flowing into the cylindrical channel is 100 m/day.
Applsci 11 11089 g008
Figure 9. Estimated mineral composition of sediments from the solution of the settling pond (A01).
Applsci 11 11089 g009
Figure 10. Equilibrium composition of the discussed rocks.
Applsci 11 11089 g010
Table 1. Thermophysical characteristics of the wells’ units adopted for physical modeling.
Characteristict 1/1t 1/2t 3/1t 3/2
Mineralogical Composition:Technogenic Psephite, Magnetite, PyriteLimestone with an Admixture of Pyrite and GypsumTechnogenic Psephite, Magnetite, PyriteLimestone with an Admixture of Pyrite and Gypsum
λ, W/m/K1.942.102.372.91
C, kJ/(m3·K)2490238119961946
c = C/ρ, J/kg/K14069721018828
ρ, g/cm31.772.451.962.35
k, m210−1210−1210−1210−12
Ti, °C+4+4−4−4
Table 2. Composition of dam rocks taken for thermodynamic modeling of the “water–rock” interaction.
Sample2/553/604/114/255/656/38
Rock TypeLimestoneMarlTailsTailsMarlLimestone
Wellt2t3t4t4t5t6
Depth, m556011256538
Component concentration, wt.%
SiO243.2115.8024.7721.9033.485.81
TiO20.390.110.610.720.540.06
Al2O39.112.182.602.549.781.34
Fe2O33.421.206.174.725.180.60
MnO0.030.020.090.090.100.01
MgO5.453.1821.8720.286.005.08
CaO14.3640.3019.2021.1517.6745.72
Na2O0.150.120.080.090.350.11
K2O3.890.820.430.443.450.29
P2O50.050.040.250.280.130.03
BaO0.02<0.010.050.070.02<0.01
SO31.971.591.481.343.440.20
V2O50.01<0.010.010.010.01<0.01
Cr2O3<0.01<0.010.090.08<0.01<0.01
NiO<0.01<0.010.080.06<0.01<0.01
LOI18.1534.5222.2626.2919.6840.99
SUM100.2199.86100.05100.0699.84100.23
The main phases of the mineral compositionQuartz calcite dolomite ankeriteCalcite ankerite anorthite quartz beaverite hematite pyriteMagnetite quartz pyrite witherite calciteMagnetite pyrite, calcite, quartzPyrite impurities calcite quartz dolomiteCalcite dolomite ankerite
Table 3. Composition of solutions from the settling pond and storage pond for thermodynamic modeling.
Settling PondStorage Pond
ParameterUnitsA01A20A14A25HA27B
pHunits pH7.36.35.37.77.7
HCO3mg/dm3472724160170
SO4mg/dm319001700180016001700
NO3mg/dm3230180190130130
NO2mg/dm31520270.040.003
PO43−mg/dm31616116.58.1
Clmg/dm3520400440200210
NH4+mg/dm38.67.05.20.50.5
Camg/dm3400400370220210
Mgmg/dm3390400370300290
Kmg/dm33631331617
Namg/dm35961622322
Publisher’s Note: MDPI stays neutral with regard to jurisdictional claims in published maps and institutional affiliations.

