1. Introduction
The cold pilger rolling process is an incremental method for manufacturing metal tubes with uniform cross-sections using initial tubes, such as semi-seamless and seamless pipes. This pilger rolling process is called roto-rolling and in which a pipe is passed between the rocking set of the outer die and the hardened mandrel on the inside of the pipe. Accordingly, the tube cross-section is reduced while the length and strength are increased. In this respect, this process is similar to the drawing technique.
The cold pilger rolling process can produce pipes with good surface quality, precise dimensional tolerance, and satisfactory mechanical properties owing to the involved high compressive stress. In addition, the process increases the elongation of the workpiece material due to the compressive stress applied by the axial force and forming being incremental. A very high cross-sectional reduction rate can be achieved in a single process step without causing a fracture in the material. Compared to manufacturing the same hollow-type product by a cold drawing process, the cold pilger rolling process can achieve a cross-sectional reduction of approximately 90% in a single working cycle. The advantages of this process include a short working time, increased material utilization efficiency by reduced material use, and the rationalized spatial layout of the equipment [
1,
2].
With the recent trend of industrial development, the number of products in which welded pipes cannot be used has also gradually increased. Thus, applications of the cold pilger rolling process to produce seamless pipe products have proliferated.
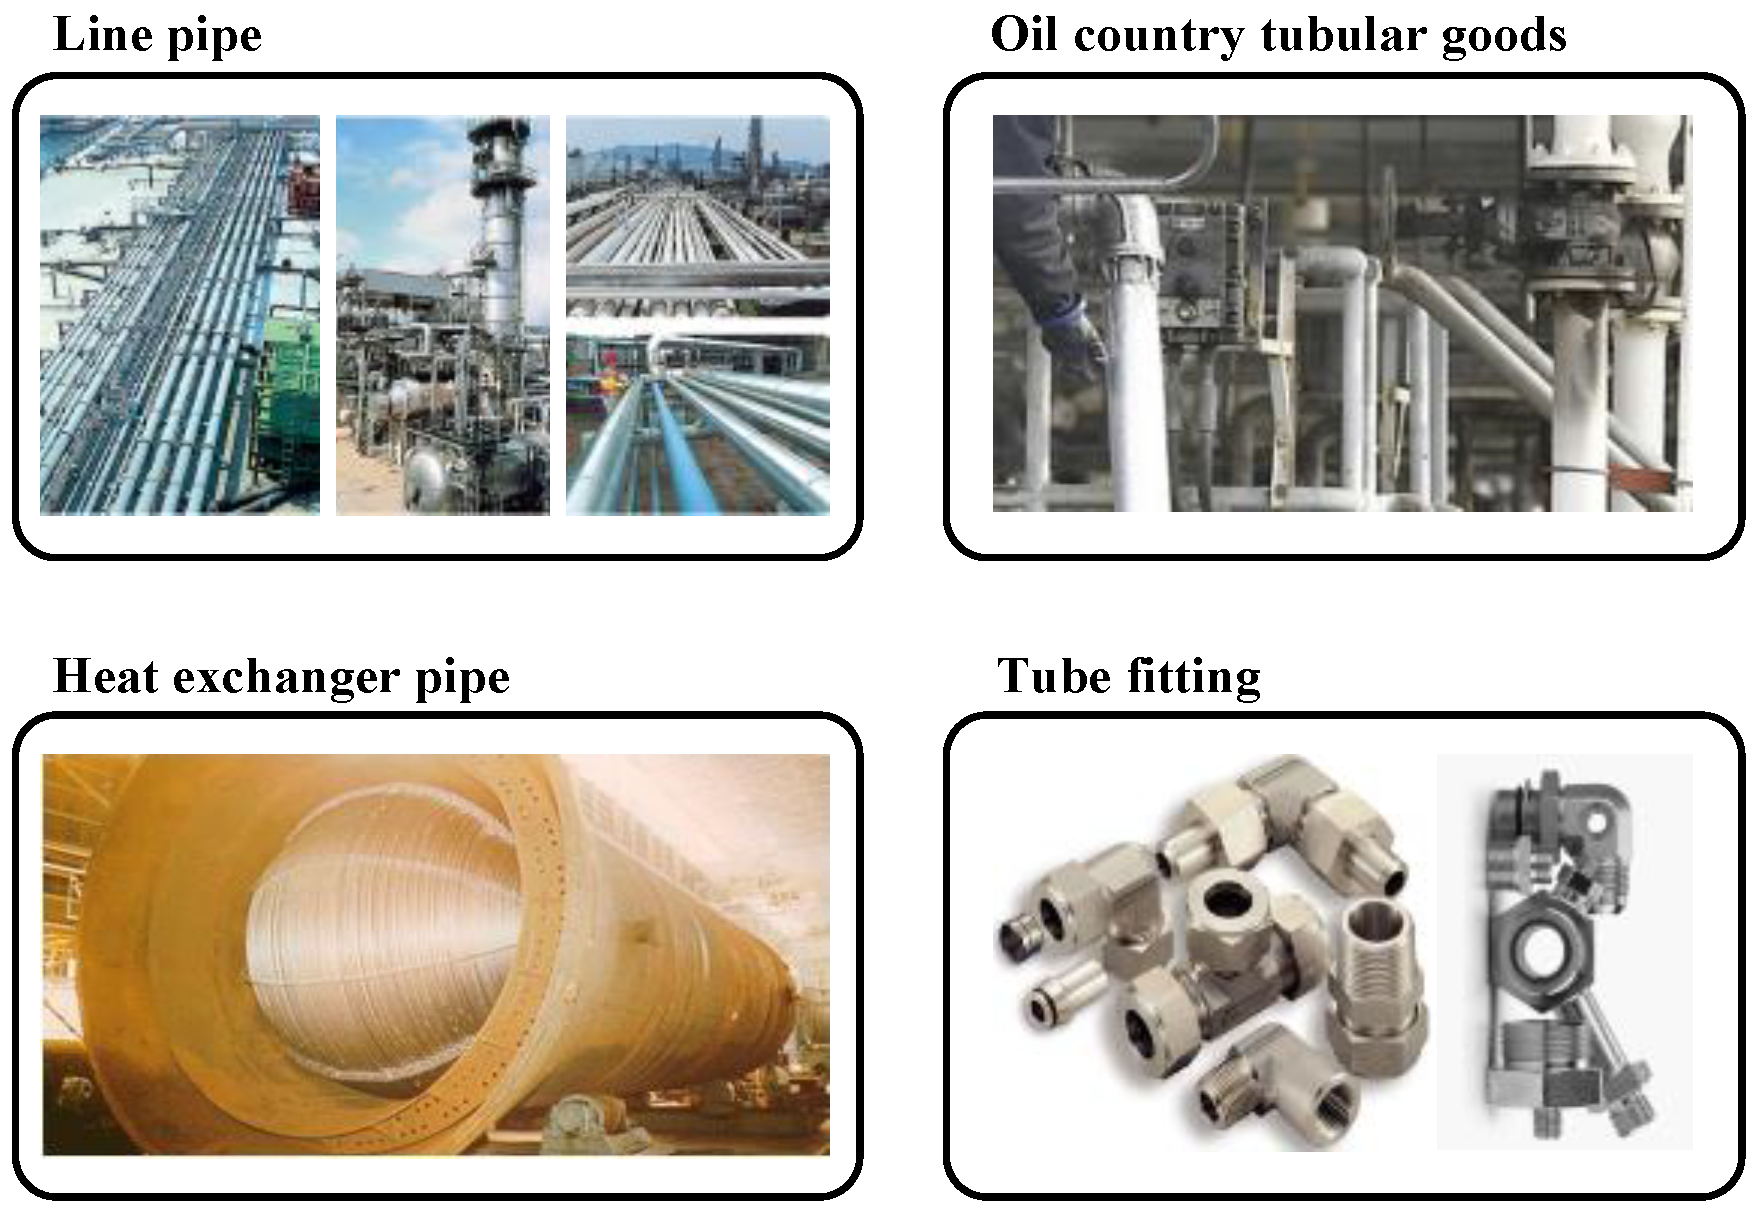
Table 1 presents various fields in which the cold pilger rolling process is applied for each material. As shown in
Figure 1, this process is mainly used to manufacture fittings for high-pressure vessels in various industries in which high pressure, high/low temperature and corrosion resistance are required. Some examples of these industries include special piping, power plant, chemical, shipbuilding, and nuclear power industries.
However, to date, considerable time and costs are required for the cold pilger rolling process since a systematic design method of pilger rolling process has not been established. Currently, the process is mainly based on the experience and subjective judgment of experienced technicians. Moreover, most pilgering companies are small- or medium-sized and thus tend to have limitations in terms of systematic research and development of pilger rolling process, knowledgebase construction, and related areas.
To overcome the above problem, the development of a pilgering die groove shape design method, which is the core design technology of the cold pilger rolling process, is required. In addition, a Q factor evaluation method for the final product, as well as a rolling force prediction method according to the die shape, are needed [
3,
4,
5]. The Q factor represents the ratio of wall thickness reduction to diameter reduction. This factor should always be above 1.0 to prevent any pilgering defects and obtain the necessary tubing properties. The die shape of the cold pilger rolling process is mainly designed to reduce the pipe diameter at a constant rate from the initial stage of forming. Owing to the nature of the mandrel shape, the forming inlet can exhibit large cross-section reduction. However, if the cross-section reduction rate is large at the forming outlet, the risk exists that the mandrel will break and wear [
6].
The groove shape in the cold pilger rolling process has been designed in several ways and can be classified into three categories [
7,
8]. (1) The shape in which the radius of the surface semicircle between two angles is linear (linear profile); (2) the shape that has a cosine curve with small cross-section reduction in the inlet and outlet parts, while sudden cross-section reduction occurs in the middle part (cosine profile); and (3) the shape that has a quadratic curve with large cross-section reduction in the inlet and small cross-section reduction in the outlet (quadratic profile). For these three types, variable rolls and a mandrel were generally designed.
Figure 2 depicts a comparison of the distribution of the radius and the movement distance of the rolling roll for the die shape. Unlike other shapes, when the pilger die shape is linear (
Figure 2a), it has a linearly increased distribution of deformation from the inlet to the outlet without being subjected to sudden deformation in a certain section. In this case, the pipe slowly reaches a steady state. Because of the large forming load at the outlet, there is a risk of mandrel breakage and low shape precision.
When the pilger die shape has a cosine profile (
Figure 2b), the forming load change rate is low at the inlet and outlet; however, the forming load suddenly increases in the middle part. The time to reach the steady state is relatively longer than that when the pilger die shape is linear. Nevertheless, the load can be predicted to be lower than that of the linear profile because it is formed at almost the same rate of forming load change from the middle part to the outlet. When the pilger die shape has a quadratic profile (
Figure 2c), the load increases sharply at the inlet part and then slowly decreases from the middle part. To summarize the results of the three shapes presented above, the shape of the quadratic profile shows the best outcome when considering the forming load distribution, the time required to reach a steady state, and the shape change in shape in the pilger rolling process [
8].
Along with die groove shape design, another important aspect of the cold pilger rolling process is the prediction of the rolling force according to the groove shape. Numerical analysis and finite element methods have been used to predict the rolling force in this process. However, in the conventional numerical method, the rolling force prediction range is constrained because the force is predicted for a limited die shape [
9,
10]. To resolve this problem, a predictive model was developed using the finite element method for precise prediction of the rolling force over a wider range. However, because the analysis time is too long in this approach, it is difficult to predict various shapes [
11,
12,
13,
14]. Therefore, for cold pilger rolling process design, a die shape design technique that includes various process variables, as well as rolling force prediction techniques that consider these process variables, should be simultaneously investigated.
In this study, we, therefore, developed a die groove shape design method, along with a rolling force prediction model according to die groove shape, to design the cold pilger rolling process of a SUS304 seamless pipe. A rolling force prediction model is herein proposed that considers the main variables (cross-section reduction rate, principal deformation zone, roll die radius, and die groove angle) that affect the rolling force. The die groove shape was designed based on the dimensions of the initial tube and the final product, as well as on the working zone and roller specifications. A pilger rolling experiment was performed to validate the proposed die groove shape design method and the rolling force prediction model. They were verified by comparing the predicted and experimental values for the forming load and product dimensions.
2. Rolling Force Prediction in the Cold Pilger Rolling Process
2.1. Cold Pilger Rolling Process Overview
The cold pilger rolling process incrementally reduces the outer diameter and wall thickness of a hollow metal pipe. This method was first designed by the Mannesmann brothers. It is mainly used for the manufacturing of pipes by cold working. In the pilger rolling process, forming of the pipe is performed by a pair of roll dies (top/bottom dies) with elliptical grooves in the circumferential direction. The pair of roll rotate forward and backward approximately half a turn each in opposite directions, with the workpiece intermittently moving forward and backward (
Figure 3). At this time, the workpiece is subjected to the axial force in the opposite direction to the feed direction by the rotation of the roll and the compressive stress is generated inside the workpiece. In addition, once the rolling is progressed, the workpiece is formed by rotating at a constant angle. These incremental forming characteristics and compressive stress due to axial force contribute to increase the elongation of the workpiece. In a single process, a typical pipe can achieve up to 90% cross-section reduction without process annealing.
Figure 4 shows a schematic diagram of rollers currently used by companies throughout the world. The equipment composition is the following: roll (
a, b) installed by a pair of roll shafts (
c, d) are assembled in the saddle (
f) to move back and forth by the crank mechanism (
e). The mandrel (
l) in the center of the tube (
g) is reinforced by the support (
m), and its axial position is adjustable with screws (
n). The tube has a clamping device (
k) that drives the tube forward by the screw mechanism (
i, h).
The shape of the mandrel tip is conical and gradually tapers. The shape of the inner surface of the roll coincides with the diameter profile of the mandrel and the tube wall thickness. The dimensions of the working tube are determined by the mandrel shape, the position of the mandrel relative to the roll, and the shape of the roll groove. The conical part of the mandrel and each cross-sectional shape of the roll groove are almost circular.
As shown in
Figure 5, the diameter of the groove decreases from the inlet to the outlet, as in the cross-sections
A-A,
B-B, and
C-C. The cross-section of the groove close to the inlet (
A) is slightly elliptical. The roll and material are not in contact at the left and right fillet portions of the roll horizontal axis. Meanwhile, the cross-section of the groove close to the outlet (
C) is circular, and the inner dimension of the roll of the forming part is the same as the outer diameter of the worked tube.
2.2. Main Process Variables in Rolling Force Prediction
The cold pilger rolling method employs a pair of rolls to reduce the outer diameter of the tube while proceeding back and forth in the working zone. The rolls are also employed to control the inner diameter of the tube using the mandrel. At this stage, it is important to select the main process variables to predict the rolling force [
15,
16]. The main process variables are listed in
Table 2.
The feed amount (
m) of the tube is an important process variable that affects the material production speed and the rolling force during the pilger rolling process.
Figure 6 shows the tube feed in this process. To calculate the feed amount of the tube, the number of times (
u = 10–12 times) that a point contacts the roll on the conical surface of the deforming tube and turn angles (
θ = 30–36°) are used, as shown in
Figure 7. Otherwise, the surface status of the tube is unclear. In addition, the tube is set to rotate at least ten times in the working zone. The principal deformation zone in the cold pilger rolling is the conical shape part of the tube with a diameter that increases during rolling. At the end of each stroke, the mandrel is moved forward by a constant feed amount. The tube feed amount, which is the first process variable, was set to 2 to 6 mm, which is the practically applicable range based on the roller specifications and field conditions.
The second process variable is the reduction area (
R.A.). The
R.A. is calculated by Equation (1) using the difference of the cross-sectional area of the material before and after the pilgering.
Here, Ao1 and Ao2 are the material cross-sectional areas before and after the pilgering. In the pilgering process, the R.A. has a significant impact on the pilger die shape, forming load, and final product quality. In general, if the R.A. is large at the forming end with respect to the center of the working zone, it may cause mandrel breakage or deterioration of the dimensional accuracy of the pilgered product. Therefore, the appropriate setting of the R.A. is a critical task.
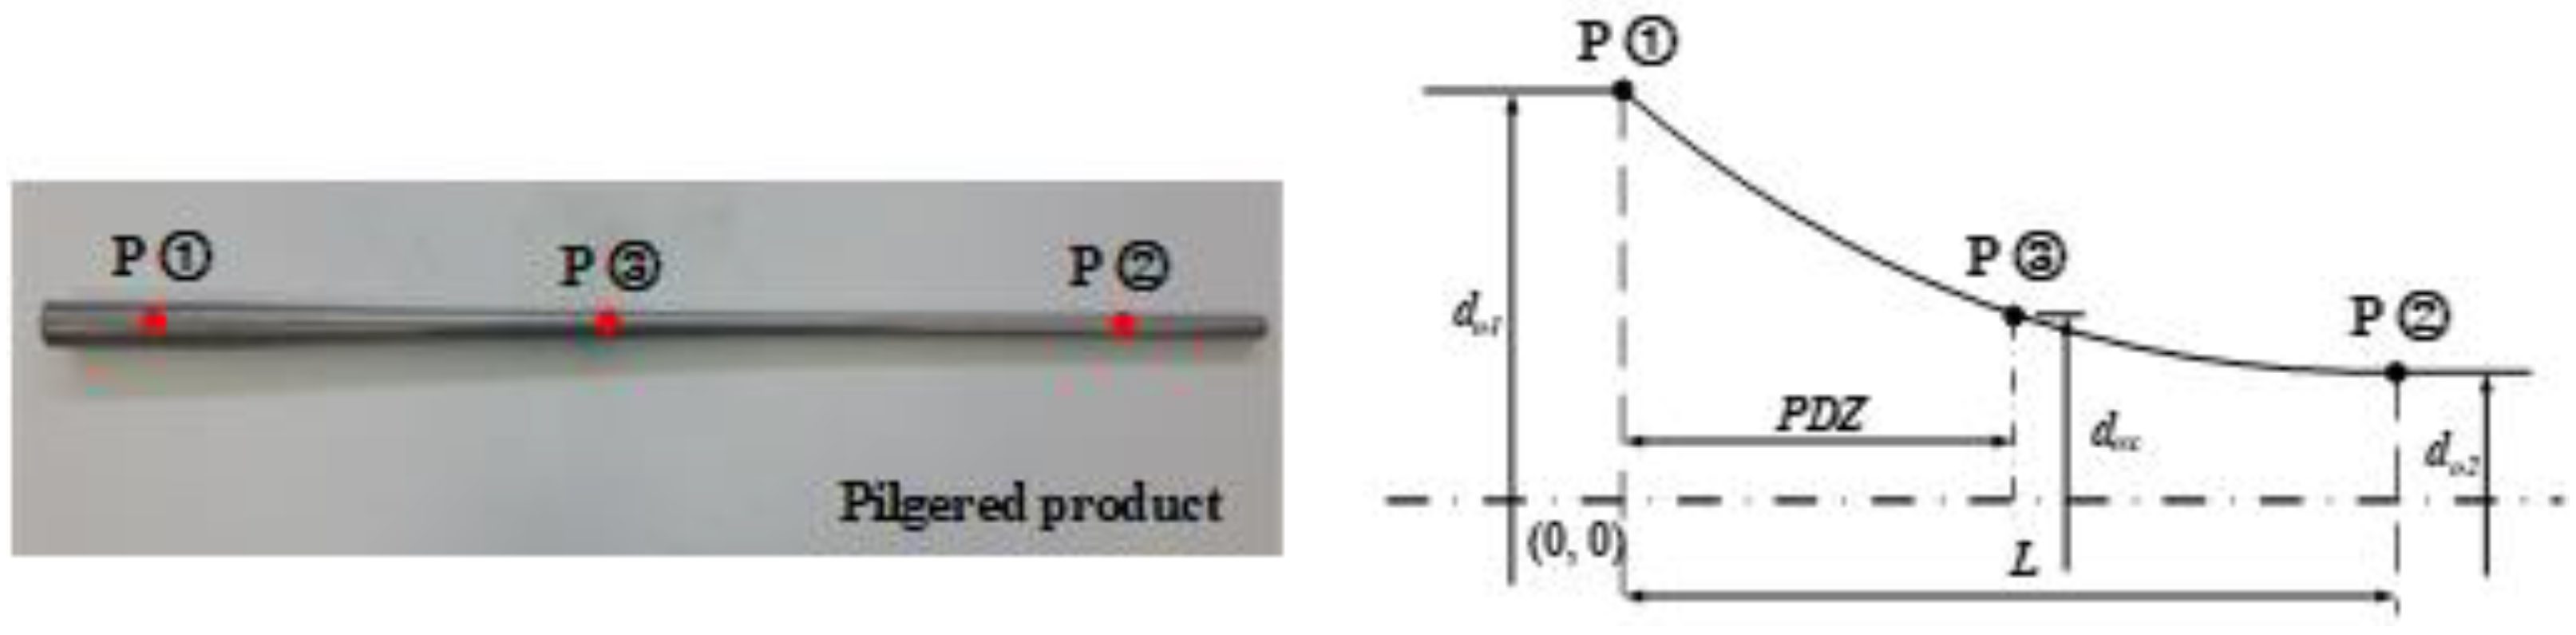
In this study, the die groove was designed to situate most of the
R.A. in the principal deformation zone (
PDZ), as shown in
Figure 8. In the
PDZ, the
R.A. range was set to 50–80% with consideration of the pilger rolling characteristics [
1]. The third process variable is the roll-die radius
R and die-groove angle
φ, as shown in
Figure 9. Both variables are highly dependent on the die groove shape, and the roll radius is determined by the roller specifications.
2.3. Rolling Force Prediction According to the Die Groove Shape
To date, theoretical analyses of the pilgering process have not been comprehensively conducted. Obtaining information on the involved rolling forces is important for setting stress levels, necking and fracturing of materials, and establishing optimal process conditions. Although the finite element method has been widely used for analysis in this area, it is not easily applied in actual fields owing to the difficulty of constructing the finite element model and the long computation time it requires.
In this study, we, therefore, propose a rolling force prediction model for the cold pilger rolling process using the Geleji equation [
17]. The main variables of the predictive model are the product dimensions of the initial tube and the final product, the shape and dimension of the roll and mandrel, the pipe feed amount, and the pipe turn angle. The proposed method is relatively simple and enables easy identification of the influence of the main variables on the rolling forces. To simplify the problem of rolling force prediction, the following assumptions are made:
Assumption 1. The elastic deformation of the material is ignored. Large deformation occurs during the forming process, and the proportion of the elastic deformation is insignificant in this process; thus, it can be ignored.
Assumption 2. In cold pilger rolling, when the roll moves forward and then backward, the tube is fed in a forward direction by a certain feed amount and is simultaneously turned by approximately 30°. The feed rate and rotation speed of the roll are independent of the tube deformation.
Assumption 3. As shown in Figure 10, the file-up amount caused by rolling during the cold pilger rolling process is assumed to bedox≒d o(x+ld).
In this study, the Geleji equation was applied to predict the forming load during the cold pilger rolling process. The steps of the calculation procedure are outlined below.
1. Enter the dimensions, working zone distance (mm), and the tube feed amount (mm) of the initial tube and final product as initial values: outer diameter of the initial tube (do1), inner diameter(di1), wall thickness(δ1); outer diameter of the pilger rolled product (do2), inner diameter(di2), wall thickness(δ2); instantaneous outer diameter of the pilger rolling product(dox), wall thickness(δx); working zone(L); tube feed amount (m); tube outer diameter angle (, inner diameter angle (ψ); tube turn angle (θ).
2. Change the tube inner diameter/outer diameter angles during the pilger rolling process.
3. Calculate the feed amount,
m. Assume the number of times a point is in contact with the roll on the conical surface of the deforming tube (
u = 10~12).
In this case, represents the minimum straight length of the initial tube required for the whole one revolution of the tube and is set as 40 mm consideration of the on-site roller specification.
4. Calculate the rolling force by using the surface pressure and contact area (
Figure 10).
Here,
is the mean rolling surface pressure,
denotes the contact length, and
and
represents the outer diameter of the tube before and after the contact point with the roll during the pilger rolling. In addition, rolling surface pressure
is given as follows:
Moreover, mean yield strength
is given as follows:
The material properties that were used to obtain the mean yield strength were identified through a tensile test (
Figure 11). These properties are summarized in
Table 3. And the contact arc length
is given as follows:
Accordingly, in the cold pilger rolling method, the rolling force is given by
3. Die Groove Shape Design in the Cold Pilger Rolling Process
3.1. Design Procedures
The steps for designing the pilger die groove shape are outlined below.
1. The roll and mandrel groove shapes, which are the essence of pilger die shape design, shall always have a parabolic shape, as shown in
Figure 12.
2. Determine the dimensions of the initial material and the final product. The outer diameter of the initial tube, the outer diameter of the pilger rolled product, R.A., and principal deformation zone were set at 30 mm, 15.88 mm, 70%, and L/2, respectively. The roll size and working zone intervals(L) are determined by considering the roller specifications and site conditions.
3. Design the roll shape by applying an exponential function, . Here, exponents a, b, and c adjust the parabolic radius of the working zone. Thus, the index can be changed according to the design parameters specified in Step 3.
4. Design the mandrel in the same way as the roll shape design.
5. Predict the rolling force in the working zone in the pilger rolling process by applying the rolling force prediction method proposed by Equation (9).
6. Finally, employ the Q factor to evaluate the expected mechanical properties of the final product.
3.2. Pilger Die Groove Shape Design
The shape of the mandrel follows the shape of the roll groove, which determines the
R.A. of the tube and the load applied on the roller. The pilger die groove shape design method is described as follows. As shown in
Figure 13, three coordinates are needed. The mandrel and the roll inner groove shape are determined by the initial tube outer diameter, the final product outer diameter, and the product outer diameter at the principal deformation zone. The equation for the roll shape design is
Here,
y represents the outer shape of the roll. The variable (
a,
b,
c) are important factors for determining the roll shape. The coordinates of each point are represented in
Figure 13, and these are represented with Point 1 (0,
do1), Point 2 (
L,
do2), Point 3(
PDZ,
d), respectively. These values are substituted into Equation (11) to obtain the variables
a,
b, and
c.
And
a can be obtained by following the below-mentioned process. By substituting Equation (12) into Equation (11), we get
When Equation (12) is substituted to Equation (11), we obtain
Here a can be obtained using Equations (13) and (14).
Using the values obtained from the numerical analysis,
b and
c can be calculated.
The mandrel shape is designed in the same way as the roll shape design.
Figure 12 depicts a variable roll, and the mandrel is designed using Equation (10). The exponential values that are employed for the roll design are 0.0045, 0.4628, and 6.3515, respectively. The values employed for the mandrel design are 0.0045, 0.3832, and 4.0130, respectively.
3.3. Q Factor Calculation According to the Pilger Die Groove Shape
The Q factor controls the direction of the texture to ensure the integrity of the pipe used in the material for high-pressure vessels. The Q factor is defined as the ratio of wall reduction change to outer diameter reduction of the tube during the cold pilger rolling [
18,
19,
20]. The equation for the Q factor is as follows:
Here, δ1 and δ2 are wall thicknesses at the inlet and outlet of the material, and do1 and do2 denote the outer diameters at the inlet and outlet of the material, respectively.
In general, it is preferable for the Q factor to have the appropriately same value above 1 [
17]. However, if the Q factor value is increased, the shape and surface quality of the product is negatively affected because the material is significantly deformed in the wall direction. Therefore, if the wall and outer diameter reductions are similarly obtained, the deformation of the material in the wall direction is small, and the appropriate Q factor value can be obtained.
In this study, the Q factor value was greater than 1. It was intended to be as uniform as possible to prevent defects in the tube during the pilger rolling process as well as to obtain the characteristics that can be used at high pressures.
5. Conclusions
In this study, we developed a die groove shape design method and rolling force prediction model according to the die groove shape in the cold pilger rolling process to produce seamless pipes. A pilger rolling experiment was conducted to verify the effectiveness of the proposed design method and load prediction model. The following conclusions were drawn.
1. Based on the Geleji equation, a rolling force prediction model was developed for the main process variables (tube feed amount 3 mm, reduction area 70%, working zone 380 mm, principal deformation zone 190 mm, maximum roll outer diameter 303 mm). The proposed predictive model was used to calculate the load change in the working zone in the cold pilger rolling process for linear and parabolic die groove shapes.
2. The roll and mandrel shapes in the exponential function from () were designed using the proposed pilger die groove shape design method. The exponent values a, b, and c used in the die groove shape design defined the variable curvature of the working zone. The exponent values used in the variable roll design were 0.0045, 0.4628, and 6.3515, respectively, and the exponent values used in the mandrel design were 0.0045, 0.3832, and 4.0130, respectively.
3. Verification experiments were performed on the pilger die grooves in linear and parabolic shapes. The validity of the rolling force prediction model was verified by comparing the predicted and experimental values. As a result of predicting the pilger load, the maximum pilger force was found to be relatively high at 10.53 tons in the parabolic profiles. However, this profile will be helpful in decreasing the risk of mandrel breakage and product quality degradation due to the rapid reduction of the load in the outlet. As a result of calculating the Q factor for the two profiles (linear, parabolic), the Q factor values of both profiles were one or higher. It, therefore, can be applied to the production of high-pressure vessels and special steel. In particular, a parabolic-shaped die groove with a Q factor of 1 or higher and a relatively uniform distribution is advantageous for the production of SUS304 seamless pipe.
4. As a result of the pilger rolling experiment, the load and product dimension in the working zone were measured in a way similar to the predicted values. In the case of the outer diameter, the maximum dimension error was 0.32 mm; for the inner diameter, the value was 0.28 mm. These results indicate that the values were within the dimensional error range (less than ±0.5 mm). Therefore, using the pilger die design method and the rolling force prediction model presented in this study, a pilger-rolled SUS304 tube that satisfies the required quality standard could be manufactured.


