Article

An Integrated Study of Water Weakening and Fluid Rock Interaction Processes in Porous Rocks: Linking Mechanical Behavior to Surface Properties

1
GEC, CY Cergy Paris Université, F-95000 Cergy, France
2
LPPI, CY Cergy Paris Université, F-95000 Cergy, France
*
Author to whom correspondence should be addressed.
Appl. Sci. 2021, 11(23), 11437; https://doi.org/10.3390/app112311437
Submission received: 3 November 2021 / Revised: 26 November 2021 / Accepted: 29 November 2021 / Published: 2 December 2021
(This article belongs to the Special Issue Applied Petrology: Latest Advances and Prospects)

Abstract

:
We investigated the impact of water weakening on the mechanical behavior of Obourg Chalk and Ciply Chalk (Mons Basin, Belgium). Different mechanical tests were conducted to estimate the unconfined compressive strength (UCS), tensile strength, Young’s modulus, mechanical strength under triaxial loading, critical pressure, fracture toughness, cohesion, and internal friction coefficient on samples either dry or saturated with water or brine. This extensive dataset allowed us to calculate wet-to-dry ratios (WDR), i.e., the ratio between any property for a dry sample to that for the water-saturated sample. For both chalks, we found that water has a strong weakening effect with WDR ranging from 0.4 to 0.75. Ciply Chalk exhibits more water weakening than Obourg Chalk. The highest water weakening effect was obtained for UCS, critical pressure, and Young’s modulus. Weakening effects are still present in brine-saturated samples but their magnitude depends on the fluid composition. The mechanical data were correlated to variations in surface energy derived from three different methods: fracture mechanics, contact angle goniometry, and atomic force microscopy. Water weakening in the tested chalks can be explained by a clear reduction in surface energy and by the existence of repulsive forces which lower the cohesion.

Graphical Abstract

1. Introduction

The mechanical properties of fluid-bearing porous rocks depend on pore fluid properties. From the poroelasticity viewpoint, there are two different regimes to be considered: (i) in the drained regime, fluids can flow freely so that the mechanical behavior will not be very different from that of a dry rock; whereas (ii) in the undrained regime, the no-flow condition will induce pore pressure build up when applied stresses lead to rock deformation. The concept of effective stresses implies that variations of pore fluid pressure will impact most of the mechanical and physical properties of porous rocks [1]. Apart from the purely mechanical effect of pore fluid pressure, physico-chemical fluid–rock interactions may introduce additional complexities. For example, water weakening is a well-known phenomenon which can affect both carbonate [2] and siliciclastic rocks [3]. Many experimental studies have shown that the mechanical properties of porous rocks are lowered when the pore fluid is water. For example, Risnes et al. [4] compared the failure envelope of Liege Chalk saturated with air, water, and various water–glycol mixtures: they found that when saturated with water, the failure envelope is much smaller than for any other pore fluid. Water weakening and fluid–rock interactions were also responsible for the acceleration of the subsidence rate during and after water flooding operations in the Ekofisk oil field in North Sea [5]. Experimental studies on sandstones have shown that, like carbonate rocks, water weakening can significantly lower the mechanical strength and elastic moduli of siliciclastic rocks [6,7]. Using a protocol intended to mimic water flooding operations in reservoir to increase the production, David et al. [8] have shown that when dry or oil-saturated Sherwood sandstone samples are critically loaded, a small amount of water injected under low pressure is enough to trigger mechanical instabilities leading to failure. Baud et al. [3] linked the drop in the critical pressure, i.e., the pressure at the onset of grain crushing and pore collapse under isotropic loading, for water-saturated sandstones to the decrease in the fracture surface energy at the fluid–solid interface. Indeed, a decrease in fracture surface energy will promote crack propagation at lower stresses compared to the dry rock, for example. Therefore, it seems important to relate mechanical weakening to variations of the solid–fluid interface properties for different pore fluids.
The objective of this work is (i) to quantify the magnitude of water weakening effects in two chalks by measuring several mechanical properties (compressive and tensile strengths, elastic moduli, and fracture toughness) in laboratory experiments using different pore fluids, (ii) to characterize the surface properties in presence of different pore fluids using different techniques (atomic force microscopy, contact angle goniometry, and laser confocal microscopy), and (iii) to link the impact of water weakening on the mechanical properties to variations in the surface properties. Although other mechanisms have been proposed to explain water weakening in porous rocks, we show that the decrease in surface energy and the existence of repulsive forces are likely to be the dominant mechanism in our experiments.

2. Material and Methods

2.1. Selected Materials

Within the framework of a collaboration with the University of Mons in Belgium, two chalks from the Mons Basin were selected for our study. The Obourg Chalk samples were collected in a quarry located in Harmignies, and the Ciply Chalk samples in the La Malogne underground quarry in the same area. Table 1 summarizes the main characteristics of both rocks.
Obourg Chalk is a white fine-grained microporous chalk mainly composed of coccolith fragments with punctic contact. It has a homogeneous composition (100% calcite) with a very small grain size (around 1 µm) and pore size (around 0.3 µm), and a large porosity (about 43%). The microstructural features in Obourg Chalk have been thoroughly described in our previous work [9]. Ciply Chalk has a more heterogeneous composition with mainly calcite but also fluorapatite and other minerals, which gives the rock a brownish color. In Figure 1, typical microstructure images obtained with SEM and CT scan techniques are shown for this chalk. Taking an X-ray CT scan slice of a 16 × 18 cm block of Ciply Chalk revealed that the inner structure of the rock is heterogeneous, with the presence of dense material embedded in the rock matrix (Figure 1a). The SEM micrographs in Figure 1b,c show the presence of high-density nodules, with a composition (obtained by DRX analysis) made of oxygen, calcium, carbon, phosphorus, and fluor, a chemical composition close to that of fluorapatite. This has been observed also by Robaszynski and Martin [10], who described such nodules as a brain-like cortex having precipitated on the grains due to the action of cyanobacteria.
As the heterogeneous texture of the Ciply Chalk probably affects its mechanical properties, the studied samples were systematically cored away from the nodule-rich areas using the CT scan density maps as a guide in the coring process. Note that despite the similar porosity (about 39% compared to 43%), the Ciply Chalk has a permeability two orders of magnitude higher than Obourg Chalk (Table 1).

2.2. Mechanical Tests

Standard mechanical tests were conducted on two GDS Instruments Ltd.™ Virtual Infinite Stiffness (VIS) loading frames with a load capability of 100 kN. The first one was designed for conducting uniaxial compression tests in order to get the UCS (Unconfined Compressive Strength) for core samples with nominal diameter 40 mm and length 80 mm. The axial force is given by an external load cell with precision 0.01 kN and the axial shortening is measured with an accuracy of 1 µm. The same machine is also used for conducting Brazilian tests on samples with nominal diameter 40 mm and length 20 mm in order to get the rock tensile strength σ e x t . In such experiments, the sample is loaded across the diameter in a sample holder shown in Figure 2a.
On the second GDS™ VIS machine, a pressure vessel designed by Sanchez Technologies™ allows one to conduct standard triaxial tests under controlled confining pressure (up to 30 MPa) and pore fluid pressure (up to 20 MPa). A sketch of the pressure vessel connected to two GDS™ pressure–volume controllers is shown in Figure 2b. This setup permits the conducting of tests with different fluid contents (e.g., dry, or water- or oil-saturated samples) at fixed confining and pore pressures, and to build the rock failure envelope. In all the tests, a constant stain rate of 10−6 s−1 was applied and the samples were loaded until failure. For the compression tests (either unconfined or triaxial) we determined systematically the strength and Young’s modulus.

2.3. Hydromechanical Tests

Unconventional hydro-mechanical tests (called hereafter injection tests) were also conducted following the protocol proposed by David et al. [8] which was also applied on Obourg Chalk by Geremia et al. [9]. A dry rock sample was mounted inside the pressure vessel (Figure 2b) and loaded at a given confining pressure and axial stress. At this point, the stress field being held constant, water was injected through the bottom piston at a low pressure (0.2 MPa) to limit mechanical effects due to pore pressure (Figure 3). The objective of such tests is to mimic fluid substitution processes in reservoir rocks and to evidence the occurrence of water weakening effects in the rock. Indeed, in our previous works mentioned above, it was shown that when water is injected into dry samples loaded at a stress level above the failure stress of the water-saturated rock but below the yield stress of the dry rock, damaging processes can develop, which lead to the macroscopic failure of the rock samples.
Similar injection tests can also be conducted by injecting water in a sample previously saturated with oil (Figure 3), to reproduce possible mechanisms that might occur in an oil reservoir at depth during enhanced oil recovery by water flooding operations.

2.4. Fracture Mechanics Tests

One important parameter in fracture mechanics is the fracture toughness KIC, which is used as a threshold value in the criterion for crack or fracture propagation in mode I, also referred to as opening mode [11]. Several experimental methods are available for determining the mode I fracture toughness: we designed in our lab a new device which is suitable for conducting semi-circular bending tests for estimating KIC (Figure 4). The semi-circular bending (SCB) test is commonly used to determine mode I fracture toughness because of the simplicity of its geometry, test procedure, and low machining requirement [12]. Figure 4 shows a sketch of the SCB sample geometry, with R the radius of the specimen, B the thickness, a the notch length, t the notch width, S the distance between the two supporting cylindrical rollers, and F the load applied through the loading roller. The table in Figure 4 provides the recommended values for these parameters. In a standard test the load F increases monotonically until the sample fails, i.e., when a fracture propagates from the notch tip.
In our experiments, the following nominal values were used for the semi cylinders: R = 25 mm, B = 26 mm, S = 25 mm, a = 10 mm, and t = 1.5 mm. The mode I fracture toughness measured with the SCB method KIC(SCB) is given by the following equation [12]:
K IC SCB = F max π a 2 R B Y
with Y = −1.297 + 9.516(S/2R) − [0.47 + 16.457(S/2R)](a/R) + [1.071 + 34.401(S/2R)](a/R)2 and Fmax the load at sample failure.

2.5. Ultrasonic Monitoring

When conducting triaxial tests or injection tests in our pressure vessel, three pairs of ultrasonic P wave sensors were fixed at different heights in three cross-sectional planes at 20 mm (bottom plane), 40 mm (middle plane), and 60 mm (top plane) from the bottom surface of the rock sample [13]. Such an array allowed us to measure the P wave velocity across three horizontal wave paths in order, for example, to follow the rising of the injected water in the injection tests. An AMSY-5 Vallen™ System was used to operate with the sensors in active mode. An ultrasonic survey proceeds by switching each sensor between pulser and receiver. The pulsing frequency imposed during velocity surveys is 0.2 MHz and the voltage amplitude sent to the emitter is about 100 Volts. The time interval between each survey varies between 45 and 60 s. The P-wave first arrival times are picked automatically using the Akaike Information Criterion. P-wave velocities are computed by applying a calibrated distance matrix knowing the sample dimensions and the sensors positions. In addition to velocity, the P-wave first peak amplitude was also automatically measured in a time window after the P-wave first arrival. Variations in P-wave velocity and amplitude were then interpreted in terms of fluid substitution and/or damage experienced in our injection or triaxial tests.

2.6. Surface Characterization

To characterize the rock surface properties, three different techniques were applied: Atomic Force Microscopy (AFM), Contact Angle Goniometry, and Laser Scanning Confocal Microscopy. Such techniques are commonly used to obtain a thorough description of surface properties like roughness and wettability.

2.6.1. Sample Preparation for Surface Analyses

Different kinds of samples were tested. Obourg and Ciply Chalk samples (Figure 5) were prepared by slicing cylindrical samples cored from large blocks, with a diameter of 25 mm and a thickness ranging from 2 to 15 mm. The samples were subsequently saturated with epoxy resin, in order to remove the porosity and avoid water absorption during contact angle measurement. For this purpose, the rock samples were left immersed in epoxy resin in an oven at 60 °C for about 7 h. This method ensures a homogeneous saturation and excellent resin penetration. After the complete curing of the epoxy, the sample surface composed of chalks grain and resin was polished with silicon carbide paper from grit 120 to 4000.
A second kind of sample consists of single calcite crystals (Figure 5), with no particular preparation carried out on it. The calcite cleavage plane is defined as (104) according to the hexagonal setting and the axial convention based on the structural unit-cell of the calcite (described by the two orthogonal axial lengths a = 5 Å and c = 17 Å) [14].

2.6.2. Atomic Force Microscopy

The sample surfaces were scanned with a “Dimension Icon” Atomic Force Microscope from Bruker™ (Figure 6a). This AFM is a versatile instrument including a cantilever with a nanoscale tip at the end of it (right top corner of Figure 6a), which, through a piezoelectric system, is able to vibrate at a given resonance frequency (between 45 and 95 kHz for Scanasyst-Air Bruker probe). The force is then calculated knowing the cantilever stiffness and measuring the deflection by means of a laser reflection. The AFM was operated in the Peak Force Tapping mode in which the probe is cyclically approached to the sample where the attraction pulls the tip to the surface (Figure 6b, point A); subsequently, a user-defined force is applied (point B) and, in the withdraw phase, the negative peak at point C is dictated by the adhesion force.
Two kinds of probes were used: the Scanasyst-Air® and the Scanasyst-Fluid® probes from Bruker™, which have a tip radius from 2 to 12 nm and 20 to 60 nm, respectively, and are composed by silicon nitride. The Scanasyst-Fluid® operates with a liquid cell where water solutions can be used to acquire information about the fluid–rock interaction at the rock surface. For the purpose of this work, only distilled water with an electrical conductivity of 2.3 μS/cm was used. Due to its brittleness, the shape, and so the radius, of the tip can be altered after each acquisition, and for this reason we conducted a calibration using a titanium sample with known roughness. Hence, a tip radius going from about 6 to 10 nm and 32 to 36 nm was estimated for the Scanasyst-Air® and Scanasyst-Fluid®, respectively, depending on the depth of penetration. To be consistent, we selected a depth of 10 μm for both probe types, which resulted in a tip radius of 8.19 and 33.41 nm, respectively, for dry and wet conditions.

2.6.3. Contact Angle Goniometry

The drop shape analysis profile (DSA-P) device from Kruss™, shown in Figure 7a, uses the sessile drop technique to obtain a measure of the angle resulting from the spreading of a liquid droplet on a solid surface. A syringe deposits a drop of liquid (volume between 10 and 20 µL) above the surface, and a dedicated software performs an image analysis of the profile obtained through a high-resolution camera (Figure 7b). Two techniques have been used, the static and dynamic contact angle measurements. In the first case the angle is measured immediately after the drop has been deposited; in the second one, the whole instrument is tilted up to 90° and the shape analysis is carried out at the moment the drop starts gliding. Within the last method, a receding and an advancing angle is obtained, with the latter corresponding to the tilting direction.
The dynamic technique is normally selected for chemically heterogeneous materials, such as our resin-saturated chalks. By introducing the measured advancing angle θtot in the following Cassie’s law [17,18]:
cos θ tot = X c cos θ c + X r cos θ r
we obtain the angle θc corresponding to the chalk contribution only, knowing the surface fraction of the resin Xr and chalk Xc and the dynamic contact angle θr for a sample made up only of the same resin used to saturate the rocks. Assuming the resin totally filled the pores, Xr corresponds to the rock porosity φ, and consequently Xc = (1 − φ).
The contact angle for chalk depends of the free surface energy of the interface between chalk and the liquid used in the experiment. The surface free energy of chalk is hereby determined with the Owens–Wendt (OW) method [19], which defines the surface energy as the sum of two components: (1) dispersive forces γ(D) and (2) dipole–dipole interaction γ(P) between permanent or induced dipoles (e.g., hydrogen bonds) [20] according to:
γ l cos θ c + 1 2 γ l D = γ s P γ l P γ l D + γ s D
where the superscripts of the surface energy γ refer to the polar (P) and dispersive (D) components, while the subscripts refer to the liquid (l), chalk (c), and solid (s). The known parameters are the polar and dispersive components of the liquids used (from the literature) and the derived angle for the chalk, from Cassie’s law. By plotting the known parameters for at least two fluids (one polar and one apolar to ensure sufficient dispersion), a linear regression provides the intercept γ s D and slope γ s P , which yield the dispersive and polar components of the solid phase, the sum of which gives the total surface free energy. To insure better accuracy, five different fluids were used, with known polar and dispersive components given in mJ/m2 in Table 2.
To establish the effect of salt type and concentration on wettability, we additionally measured the static contact angle on two pure calcite crystals (Figure 5), using NaCl and MgCl2 aqueous solutions with increasing salinity from 0.04 to 0.60 mol/L. We also estimated the roughness of the tested materials by means of a laser scanning confocal microscope LSM 710 from Zeiss™ and the same Atomic Force Microscope used for adhesion characterization. They are able to provide the so-called roughness parameter, a measure of the surface topography, defined as the standard deviation of the height profiles measured on a given surface.

3. Results

Our experimental results will be presented here for both chalks with different pore fluids. In the following we will call “wet-to-dry ratio” WDR(Λ) for any given property Λ the following parameter:
WDR Λ = Λ sat Λ dry
where Λ(sat) is the value measured for the water-saturated rock and Λ(dry) the value measured for the dry rock, under the same experimental conditions. If water weakening processes are operating in the tested rocks, then this ratio is expected to be significantly lower than one. In the following, compressive stresses (or strengths) are positive, and extensive stresses (or strengths) are negative.

3.1. Strength and Elastic Weakening Evidenced through Standard Mechanical Testing

3.1.1. Uniaxial Compression Tests

In total, 100 uniaxial compression tests were conducted on Obourg chalk for different fluid contents: 10 tests on dry samples (after drying them in an oven at 60 °C for 48 h), 5 tests on distilled-water-saturated samples, and the rest on samples saturated with several aqueous solutions. Among these we used brines with different concentrations (10, 30, and 50 g/L) of NaCl (20 samples), MgCl2 (20 samples), NaHCO3 (15 samples), Na2SO4 (15 samples), and CaCl2 (15 samples). All the results for the UCS are plotted in Figure 8 vs. the sample porosity.
First, let us discuss the large difference in UCS values for the dry samples compared to the water-saturated samples. Systematically larger values are found for the UCS of dry samples compared to the water-saturated samples. For the dry samples the average value is UCS(dry) = 7.0 MPa with standard deviation 1.3 MPa, and for the water-saturated samples the average value is UCS(sat) = 3.6 MPa with standard deviation 0.6 MPa. This shows that there is a strong weakening effect on the compressive strength, which can be characterized by the wet-to-dry ratio WDR(UCS) = 0.51. Furthermore our results show that the UCS is strongly controlled by the porosity even in the very narrow range corresponding to our sample set: the UCS clearly decreases when the porosity increases for both the dry and water-saturated samples, with a much steeper slope for the former compared to the latter. For the brine-saturated samples, we did not find any systematic trend with the salt concentration; for this reason, we plotted in Figure 8 all the results with a single symbol per salt regardless the concentration. Sodium chloride has no effect on UCS as we found similar results as for the water-saturated samples. In contrast for magnesium chloride and sodium sulphate, the UCS values fall in between the values for dry and water-saturated samples, meaning that these salts have some inhibiting effect on water weakening in Obourg Chalk. The results for Young’s modulus are also very different for dry and water-saturated samples: we found E(dry) = 5.5 GPa with standard deviation 1.4 GPa and E(sat) = 3.2 GPa with standard deviation 1.3 GPa. Therefore, water has also an elastic weakening effect which can be characterized by the wet-to-dry ratio WDR(E) = 0.58, which is comparable to the UCS ratio.
For the Ciply chalk, five samples were tested until failure to get the UCS and Young’s modulus in dry conditions, five additional dry samples provided Young’s modulus but not the UCS, and four water-saturated samples were tested until failure. For the dry samples, the average UCS was UCS(dry) = 4.4 MPa with standard deviation 1.8 MPa, and Young’s modulus was E(dry) = 1.2 GPa with standard deviation 0.5 GPa. For the water-saturated samples, we found UCS(sat) = 1.7 MPa with standard deviation 0.14 MPa and E(sat) = 0.50 GPa with standard deviation 0.23 GPa. These values yield wet-to-dry ratios such as WDR(UCS) = 0.39 and WDR(E) = 0.42 for the Ciply Chalk.

3.1.2. Brazilian Tests

The tensile strengths for both chalks were measured for dry and water-saturated samples (Table 3), using the device shown in Figure 1a. Only a limited number of samples were tested, but like for the UCS, the magnitudes of the tensile strengths for both chalks are smaller for the water-saturated samples than for the dry samples.
The wet-to-dry ratio for Obourg Chalk WDR σ e x t = 0.51 is the same as the one for the UCS and comparable to the one for Young’s modulus. The Ciply Chalk has a higher ratio WDR σ e x t = 0.75 compared to the Obourg Chalk.

3.1.3. Triaxial Compression Tests

Figure 9 shows typical results obtained in triaxial tests on Obourg and Ciply chalk at the same low effective confining pressure (1.5 MPa) defined as Pc_eff = (σ3 − pf), with σ3 the confining pressure and pf the pore fluid pressure. While for dry tests pf corresponds to the atmospheric pressure, for the water and brine-saturated sample it is equal to 1 MPa. Several tests were conducted with different pore saturating fluids. The compressive strength is defined as the differential stress Qf = σ1 − σ3 at failure where σ1 is the axial stress. Whereas for most of the samples, failure is manifested by a peak on the loading curve, no peak is observed for the water-saturated Ciply Chalk sample (Figure 9); for that particular sample, we took the stress value at the kink correlated with the onset of strain hardening. Let us first compare the behavior of the dry samples to that of the water-saturated samples. For both chalks, the compressive strength is significantly reduced for the water-saturated samples compared to the dry ones. The same is true for Young’s modulus measured in the linear part of the loading curves (Table 4).
Therefore, both chalks exhibit a strong strength and elastic weakening induced by water, in good agreement with our results obtained under uniaxial loading. Note that despite the low value of the effective confining pressure, there is a significant enhancement of the compressive strength with respect to the UCS. The wet-to-dry ratio is WDR(Qf) = 0.62 for Obourg Chalk and 0.41 for Ciply Chalk, meaning that the latter experienced more water weakening.
For Obourg chalk, we found again that when the rock sample is saturated with NaCl brine, the behavior is comparable to the one obtained for the water-saturated sample, whereas using a MgCl2 brine slightly inhibits the water weakening. These results are consistent with our observations on UCS variations (Figure 8).

3.1.4. Yielding Envelopes

In addition to the test at 1.5 MPa confining pressure described in the previous section, more triaxial tests in a wide range of confining pressures were conducted in order to characterize completely the failure envelope of both chalks, for different pore fluids. We plotted in Figure 10 the stress state at yielding (i.e., departure from elasticity) in the so-called Q-P plot with on the x-axis the mean effective stress P = (σ1 + 2σ3)/3 − pf and Q is the differential stress Q = (σ1 − σ3). In doing so, we obtained the yielding envelope. For the dry tests the pore fluid was at atmospheric pressure and for all the other tests the pore pressure was 1 MPa or 0.5 MPa (for one test only). The data set for the dry and water-saturated Obourg Chalk was already presented in our previous work [9]: the large shrinkage of the envelope for the water-saturated rock was clearly linked to water weakening effects in Obourg Chalk. New results are presented in Figure 10 from experiments on oil-saturated Obourg Chalk samples. The oil that was used in the triaxial tests was Marcol™ 52, a light oil with density 0.83. Compared to the dry rock, the yielding envelope for the oil-saturated rock is slightly smaller, meaning that even oil has a small weakening effect on the mechanical properties of Obourg Chalk. We also added on the same plot the results from a multistage experiment on a single dry sample: in such a test (i) the sample is first loaded with an isotropic stress σ1 = σ3, (ii) the axial stress is increased until yielding providing one point on the Q-P plot, (iii) the confining pressure is increased and the axial stress is decreased to achieve again isotropic loading, and (iv) the loading cycle proceeds again [21,22].
With such a protocol, we could get the complete yielding envelope from one single sample for the dry Obourg Chalk (open symbols in Figure 10), which is very close to the “classical” one inferred from multiple triaxial tests. This gave us confidence to apply the multistage protocol to the Ciply Chalk, as we had only a limited volume of rock to prepare samples. Figure 10 shows that the water-saturated Ciply Chalk is much weaker than the dry rock. Whereas the yielding envelope of the dry Ciply Chalk is slightly larger than for Obourg Chalk, the one for the water-saturated Ciply Chalk has shrunk much more. As already mentioned, water weakening processes seem to be more intense in Ciply Chalk. To quantify this effect, we can compare the critical pressures P* which mark the onset of yielding by pore collapse under isotropic loading (Q = 0); indeed, it was shown in previous studies that the critical pressure is a scaling parameter for the actual shape of the failure envelopes because it anchors the envelope on the x-axis in the Q-P plot [23]. For Obourg Chalk we found P*(dry) = 14.1 MPa, P*(oil) = 12.4 MPa, and P*(water) = 7.1 MPa. For Ciply Chalk we found P*(dry) = 16 MPa and P*(water) = 5.9 MPa. Considering these values of critical pressures, this yields wet-to-dry ratios WDR(P*) of 0.50 for Obourg Chalk and 0.37 for Ciply Chalk reflecting the important shrinking of the yielding envelopes.
A Mohr–Coulomb type of approach was also used to characterize failure; this could be conducted for Obourg Chalk only, as all triaxial tests were conducted until the samples failed, but not for Ciply Chalk for which only the yield stresses were obtained from multistage loading (Figure 10). In Figure 11, we plotted all the Mohr circles representative of the stress state at failure for the triaxial tests conducted in the brittle field at low effective confining pressures (below 2 MPa) on the dry and water-saturated Obourg Chalk samples. The best lines tangent to the Mohr circles were obtained by a least-squares method. Following Mohr–Coulomb’s theory, the slope of the straight line is the internal friction coefficient µ = tan(φ) with φ the friction angle, and the intercept is So, the cohesion of the tested material.
For the dry Obourg Chalk we found µ(dry) = 0.59 (φ(dry) = 30.8°) and So(dry) = 2.13 MPa, and for the water-saturated Obourg Chalk we found µ(sat) = 0.45 (φ(sat) = 24.3°) and So(sat) = 1.35 MPa. These values provide wet-to-dry ratios WDR(µ) = 0.76 for the internal friction coefficient and WDR(So) = 0.63 for the cohesion. Knowing the friction coefficient and the cohesion, one can calculate the unconfined compressive strength [11] using the following relationship UCS = 2 S o μ + 1 + μ 2 : based on the above Mohr–Coulomb parameters, we get UCS(dry) = 7.5 MPa and UCS(sat) = 4.2 MPa, in reasonably good agreement with the measured values given in Section 3.1.1. (7.0 +/− 1.3 MPa and 3.6 +/− 0.6 MPa, respectively)

3.2. Impact of Water Injection on Mechanical Stability

In our previously published work on Obourg Chalk [9] it was shown that injecting water in a dry sample critically loaded can lead to the failure of the rock sample without any significant change in the stress state. Furthermore, the amount of water needed to induce failure normalized to the pore volume decreases exponentially as a function of the applied stress normalized to the dry peak stress. This was interpreted by the fact that as soon as the yield stress of the dry rock is exceeded, a small amount of water is enough to promote crack propagation, which will ultimately induce the failure of the rock sample. The data set obtained for Obourg Chalk at 1.5 MPa confining pressure is recalled in Figure 12a; except that here, the applied stress at failure was normalized to the yield stress of the dry rock and not to the strength (as in Figure 19a of reference [9]). This was done because, for the Ciply Chalk, we can only get the yield stresses from the multistage loading experiment. Similar injection tests at the same confining pressure were conducted on Ciply Chalk for comparison, and we added the results of these tests in Figure 12a. Both data sets can be fitted by decreasing exponential functions (dashed lines in Figure 11a), the one for Obourg Chalk being much steeper than for Ciply Chalk. Similar to other mechanical properties, the Ciply Chalk appears to be weaker than the Obourg Chalk. Indeed, failure by water injection can be induced in this rock at much lower stress levels, or in other words at any given stress level less injected water is required in order to induce failure.
With the water injection tests having led to failure, the samples can be seen in Figure 12b, respectively with a dry tested Obourg Chalk sample, an oil-saturated tested Obourg Chalk sample, and a dry tested Ciply Chalk sample. The results of the water injection test into a sample saturated with oil (Marcol™ 52) are preliminary ones and are not discussed here; such an experiment intends to mimic water flooding operations in situ to increase oil production in a reservoir.

3.3. Acoustic Monitoring of Fluid Substitution and Weakening Processes

During the injection tests, the P wave velocity and amplitude were recorded at three different heights using three pairs of ultrasonic sensors. For Obourg Chalk, such data were analyzed and thoroughly interpreted in a previous publication [13]; here we want to highlight the differences with a new data set obtained on the Ciply Chalk, and link these differences to possible water weakening effects. In Figure 13, we plotted the evolution of the P wave velocity and amplitude normalized to the amplitude at the start of the experiment vs. time, with time t = 0 corresponding to the beginning of the water injection into the dry samples. The Obourg Chalk sample, referenced as OB15-73 in our previous works [9,13], was tested at 1.5 MPa confining pressure and 7.3 MPa differential stress. The Ciply Chalk sample was also tested at 1.5 MPa confining pressure and at 4.0 MPa differential stress.
For the Obourg Chalk, the observed behavior was very similar to that of sample OB15-68, which was analyzed by Geremia and David [13]. Two different stages can be distinguished: in stage #1, the P wave velocity and amplitude are impacted by the rising of the water injected from bottom to top into the dry sample. The P wave velocity decreases in sequence, first on the bottom plane, then the middle one and finally the top plane. During the rise of the water, the P wave amplitude decreases systematically before the velocity does, in good agreement with our previous observations, then increases and stabilizes at a constant value.
After some time, a different kind of evolution was observed, referred to as stage #2 in Figure 13, which was interpreted as a relaxation transition induced by an increase in water saturation once the water front had reached the top surface of the sample. The P wave velocity increased because of the transition from a relaxed to an unrelaxed regime; this was also manifested by a peak-like shape of amplitude, where the minimum amplitude corresponds with the inflection point on the velocity plot. It was shown [13] that this behavior can be successfully modelled using the patchy saturation model proposed by Johnson [24]. Note that near the velocity inflection point on the bottom and middle planes, a sharp velocity drop occurred: this was due to failure in the lower part of the sample, induced by water weakening processes as discussed in [9]. In sample OB15-68 analyzed in [13], the sample failure occurred later, after completion of the relaxed–unrelaxed transition.
For the test on Ciply Chalk shown on the right-hand-side in Figure 13, our results are qualitatively in agreement with the Obourg Chalk behavior, with some differences. Firstly, the initial P wave velocity for the dry rock is significantly lower for the Ciply Chalk (average VP = 1763 m/s) compared to Obourg Chalk (average VP = 2438 m/s), which leads to a large contrast in the P wave elastic modulus M = ρVP2 where ρ is the dry rock density. We found M = 5.2 GPa for Ciply Chalk and M = 9.2 GPa for Obourg Chalk, so that from a dynamic elasticity viewpoint, Obourg Chalk appears to be much stiffer than Ciply Chalk under dry conditions. In contrast, the relative drop in velocity when the water front reaches the P wave measurement planes is almost the same for Obourg Chalk (−12.7%) and Ciply Chalk (−12.3%), meaning that water has a comparable effect on the P wave velocity for both rocks. However, Figure 13 clearly shows that the corresponding amplitude loss is much larger in Ciply Chalk, but it is difficult to relate this observation to the magnitude of water weakening effects. Whereas the relaxation processes in stage #2 are well recorded in Obourg Chalk (despite some disturbance induced by failure), it is not so clear for Ciply Chalk. Indeed, the velocity evolution matches qualitatively the transition from relaxed to unrelaxed regime, but the amplitude evolution does not show the expected peak-like shape. Interestingly stage #2 occurs much earlier in Ciply Chalk, which is probably a consequence of the higher permeability of this rock. The relative velocity increase from the relaxed value to the unrelaxed one is significantly smaller for Ciply Chalk (+9.9%) compared to Obourg Chalk (+19.1%), but again it is hard to link this observation to water weakening effects. No failure was observed during the injection test on this Ciply Chalk sample.

3.4. Fracture Toughness Measurements for Different Fluid Compositions

A total of 22 Obourg Chalk samples were tested with different pore fluids using the SCB method described in Section 2.4. In addition to air and water, three different brines were used as pore fluids, keeping the ionic strength constant at 0.59 mol/L. Similar to the UCS measurements reported in Section 3.1.1, the salinity of the monovalent NaCl brine was 35 g/L. For the Ciply Chalk, due to the lack of material, only six samples were tested, three under dry conditions, and three with distilled water as pore fluid. The average values and standard deviations for the fracture toughness KIC in mode I are given in Table 5. A strong water weakening effect is again observed with a wet-to-dry ratio WDR(KIC) = 0.65 for Obourg Chalk and 0.60 for Ciply Chalk. Concerning the results for the tested brines, surprisingly, sodium chloride has the strongest weakening effect (for the UCS no difference was found with water), calcium chloride and magnesium chloride have also a larger weakening effect than water. All in all, the KIC measurements for the brine-saturated samples are in poor agreement with our results for UCS. This will need to be further investigated.

3.5. Surface Characterization through Contact Angle Measurements

A total of 5 Obourg Chalk, 7 Ciply Chalk, and 7 pure resin samples were tested for contact angle, using 5 fluids for a total of 467 measurements. The average values obtained from these experiments are given in Table 6. As the surface energy is influenced by the surface roughness, which itself depends on the observation scale, we estimated this parameter at two different scales through AFM and Laser Scanning Confocal microscopy (Table 6), except for calcite crystal and resin for which no AFM study has been conducted. Both techniques provide different values: the discrepancy could be due to the different resolution; indeed, the AFM is able to retrieve information at a very fine scale, highlighting roughness at a smaller scale. However, there is consistency between both chalks and for this reason, the results can be compared.
When applying Cassie’s law (Equation (2)), we get the corrected contact angle values θc corresponding to each chalk for each tested fluid, which are subsequently introduced into Equation (3). The parameters of the Owens–Wendt model are plotted in Figure 14a, showing a good linear correlation. While the two chalks display a similar trend, the calcite has a much steeper slope. The surface energies inferred from these plots will be discussed in Section 4.2.
In order to test the influence of the salt type and ionic strength on the wettability of chalk, we measured the static contact angle NaCl and MgCl2 brines with different salinities on two calcite crystals. These results shown in Figure 14b display a decreasing trend of contact angle versus ionic strength, which is comparable for both salts. It is therefore important to take the fluid composition into consideration for the kind of analyses that were conducted in the present work.

3.6. Surface Characterization through AFM

Figure 15a shows a 3D map of the topography obtained with AFM on a 100 µm2 surface of Obourg Chalk. In addition to the surface roughness, AFM is also able to provide a measurement of the adhesion force Fadh on the sample surface. Figure 15b shows a color-coded map for the adhesion force on a 100 µm2 surface in Obourg Chalk. The sampling per scanning line was either 256 or 512 points, providing maps with either 65k or 262k points. As the rock was filled with resin in the pores, we assumed that the resin (less resistant to polishing) would be found in the topography troughs, whereas the rock grains would be mostly found in the reliefs. We then selected the forces by correlating the topography with the adhesion maps in order to investigate the rock part only.
For Obourg Chalk, an average adhesion force of Fadh(dry) = 2.14 nN and Fadh(wet) = 6.94 nN was found respectively, in dry and in the presence of distilled water. For Ciply Chalk, the adhesion forces were Fadh(dry) = 2.02 nN and Fadh(wet) = 5.91 nN. The resulting estimation of the surface energy will be discussed in Section 4.2.

4. Discussion

An extensive experimental data set on the mechanical behavior of two chalks, the Obourg and Ciply Chalks, has been presented for different pore fluids saturating the pore space, with the objective of studying and comparing how water weakening processes impact the investigated rock properties. In the following, we will summarize our results and produce a synthetic table and chart for a better understanding of the whole data set. Then, we will show that some of our experimental results can be linked to the intensity of fluid–rock interactions at the pore–grain interface, which was studied through AFM, contact angle, and free surface energy measurements. Linking the macroscopic mechanical properties to the surface characteristics at the microstructure scale is a major achievement of this work.

4.1. Impact of Water Weakening on Mechanical Properties

A compilation of the experimental results discussed in the above sections for tests on dry and water-saturated samples is presented in Table 7. The parameters involved in this compilation are UCS and Young’s modulus derived from uniaxial compression tests, tensile strength obtained from Brazilian tests, compressive strength and Young’s modulus from triaxial tests at 1.5 MPa effective confining pressure, critical pressure derived from isotropic compression experiments, cohesion and internal friction coefficient inferred from Mohr–Coulomb analysis on the complete set of triaxial tests (only for Obourg Chalk), and finally the mode I fracture toughness measured with the semi-circular bending test. In addition to the measured parameters for the dry and water-saturated rocks, Table 7 also presents the corresponding wet-to-dry ratios (WDR values) as defined previously.
Note that for some experiments like the water injection and ultrasonic monitoring tests, no WDR value can be estimated; although, as discussed above, features potentially associated with water weakening were observed in those experiments not included in Table 7. To make the interpretation more visual, Figure 16 shows a bar chart with the height of the bars corresponding to the wet-to-dry ratios. For each chalk, the WDR values are given in increasing order with the corresponding parameter on the horizontal axis.
Several interesting conclusions can be derived from our compilation in Table 7 and Figure 16:
  • For both chalks, the WDR values are significantly lower than one, meaning that water definitely has a weakening effect on both Obourg and Ciply Chalks.
  • The WDR values for Obourg Chalk show less fluctuation than for Ciply Chalk: this can be quantified through the standard deviation, which is lower for Obourg (0.08) compared to Ciply (0.14) Chalk.
  • Whatever the mechanical property involved, the WDR values for Ciply Chalk are lower than the corresponding values for Obourg Chalk, except for the tensile strength.
  • The average WDR value for Obourg Chalk (0.60) is significantly higher than for Ciply Chalk (0.49); therefore, the latter experiences significantly more water weakening than the former.
  • For both chalks, the critical pressure, UCS, and Young’s modulus in uniaxial compression are the parameters that are the more sensitive to water weakening (not taking into account the low tensile stress value for Obourg corresponding to a much higher value for Ciply).
  • The internal friction coefficient obtained for Obourg Chalk, only, is less prone to water weakening compared to the other parameters.
Such trends obtained only on two chalks need to be confirmed (or not) on a larger number of rocks, mixing carbonate rocks, and siliciclastic rocks, in order to have a better view on a larger spectrum of reservoir rocks.

4.2. Estimation of Surface Energy

In this work, we are able to estimate the surface energy in three different ways: (1) from mechanical tests in the SCB configuration; (2) from contact angle measurements coupled with the Owens–Wendt methodology; and (3) from atomic force microscopy providing the local adhesion force. The first method is a destructive one, and the energy needed to fracture the rock is estimated via the maximum applied load, corresponding to the energy spent to create intra and inter-granular cracks. For the second and third methods, the surface energy is inferred in a non-destructive way from surface properties through wettability attributes and small-scale adhesion pressure.
From the KIC values, one can estimate the fracture surface energy γ using the following equation:
γ = K IC 2 2 E
with E, the Young’s modulus of the tested material. Note that Equation (5) is valid for plane stress conditions: in the case of plane strain conditions, E needs to be replaced by E/(1 − ν2) where ν is Poisson’s ratio of the tested material. As we did not measure Poisson’s ratio in our rocks, we used Equation (5), knowing that the inferred fracture surface energy would in any case only differ by a few percent. The surface energy values are given in Table 8. The fracture toughness of Obourg Chalk is higher than the one of Ciply Chalk, but in contrast, the fracture surface energy, which depends on KIC2 (Equation (5)), is about half that of Ciply Chalk. This higher surface energy in Ciply Chalk results from the much lower Young’s modulus in that rock.
Following the Owens–Wendt model, the linear regression shown in Figure 14a yielded a dispersive and polar component of 22.3 and 1.1 mJ/m2 respectively, for Obourg Chalk, and 22.8 and 2.5 mJ/m2 for Ciply Chalk. Consequently, the total surface free energy is 23.4 mJ/m2 for Obourg Chalk and 25.3 mJ/m2 for Ciply Chalk. The same method was applied on two single calcite crystals using only three fluids (water, diiodomethane, and formamide), yielding a dispersive and polar component of 35.2 and 63.1 mJ/m2, respectively, with a total surface energy of 98.3 mJ/m2, whereas the roughness obtained through laser confocal microscopy was 2766 nm on average (Table 6).
Following Iazykov et al. [25], our AFM study is also able to provide an estimation of the rock surface energy from the adhesion force through the following relationship:
γ = F adh 4 π R
which for Obourg Chalk yields a value γ(dry) = 20.7 mJ/m2 in dry conditions, and a smaller value γ(wet) = 16.5 mJ/m2 in wet conditions. For the Ciply Chalk, we have γ(dry) = 19.6 mJ/m2 in dry conditions and a lower value γ(wet) = 14.1 mJ/m2 in wet conditions. For sake of simplicity, Table 8 summarizes all the values for both chalks.

4.3. Link between Mechanical Properties and Surface Properties

From Table 8, we can see that there is a rather poor agreement between the surface energy derived from the three methods: whereas the same order of magnitude is found for the contact angle and AFM methods, the surface energy derived from the mechanical tests is about ten times higher. Nevertheless, qualitatively all the methods give a lower surface energy for the water-saturated rocks compared to the dry ones, meaning that the observed water weakening effects on the measured mechanical properties may be explained, at least partially, by a decrease in surface energy. Another possible explanation will be tested, the existence of molecular repulsive forces near grain contacts.

4.3.1. Weakening Mechanism Linked to Surface Energy Reduction

The surface energy decrease as a possible mechanism for water weakening is in agreement with the observations made by Baud et al. [3] on a set of sandstones: based on a model for the prediction of the critical pressure P* from Hertzian contact theory [26], these authors claim that the wet-to-dry ratio WDR(P*) should scale as λ 3 / 2 where λ = γ s a t / γ d r y is the wet-to-dry ratio of the surface energy (Table 8). In accordance with this model, the surface energy values to be used are the ones derived from the KIC analysis; indeed, the underlying assumption in the model is that crack propagation is favored when the surface energy is lowered, leading to the weakening of the rock. Taking λ = 0.79 for the Obourg Chalk and λ = 0.83 for the Ciply Chalk (Table 8), the predicted wet-to-dry ratios are 0.70 and 0.76, compared to the measured values 0.50 and 0.37 for Obourg Chalk and Ciply Chalk, respectively (Table 7). To account for the lower ratios measured in our experiments, additional weakening mechanisms most likely exist in these chalks. This will be discussed in the next section.
Note that the “fracture” surface energy values (i.e., derived from fracture toughness) in Table 8 are comparable to data found in the literature. Indeed, Røyne et al. [27] derived a surface energy of 0.32 and 0.15 J/m2 for dry and fully water saturated conditions, respectively, through double torsion experiments on calcite. Gilman [28] and Santhanam and Gupta [29] derived through fracturing experiments a surface energy of 0.23 and 0.347 J/m2, respectively, which are much closer to our mechanical-derived values. Nonetheless, the contact angle and AFM methods provided a surface energy approximatively one order of magnitude lower than the fracture surface energy. Similar differences between the surface energy estimated through mechanical tests and through surface characterization can be found in the literature. Donnet et al. [30] obtained a value of 0.046 J/m2 in their study of calcite precipitation with a method that does not involve fracturing processes, a value similar to our estimation through contact angle and AFM. The main reason for this discrepancy may be found in the experimental procedure. Both for the Semi-Circular-Bending and double torsion [27] tests, part of the energy may have been dissipated to produce some ductile deformation, which is reasonable on calcite even at ambient temperature and pressure, or to produce microcracking other than the macroscopic fracture at the peak load. In this way, the surface energy can be overestimated. In addition, the length scale for the mechanical tests (in the centimeter range) is very different to that of the contact angle measurement (the radius of the droplet is in the millimeter range) and even more for the AFM measurements (in the sub-micrometer range). Another major difference is the fact that the surface energy derived from the contact angle, and the AFM studies are based on thermodynamics principles, with no actual surface creation such as in cracking processes.
Another parameter that might be important is the surface roughness. For example, a higher surface energy was obtained on calcite crystals (0.098 J/m2) with the Owens–Wendt method, compared to both chalks. Normally, the surface energy of a material does not depend on its roughness, but an increase in roughness would increase the actual surface area in contact with the liquid droplet causing a stronger interaction and a lower contact angle, which finally would result in a higher estimation of the surface energy. Indeed, we have shown in Table 6 that a higher surface roughness was obtained for the calcite crystals.

4.3.2. Weakening Mechanism Induced by Molecular Repulsive Forces

The low surface energy values acquired through AFM on Obourg Chalk (Table 8) could be caused by the possible presence of a very thin layer of water adsorbed onto the surface due to humidity. While for contact angle the Owens–Wendt method allows one to get the intrinsic surface energy of chalk or calcite, which is not dependent on any fluid interaction, the presence of even a very small amount of water may have resulted in a partial saturation of the atomic bonds. This latter scenario could also affect the adhesion force in dry conditions. Indeed, while the contrast in adhesion pressures is perfectly in line with those obtained in the different mechanical tests conducted in dry and wet conditions, the measurements conducted with AFM are very sensitive to humidity, tip radius, and shape, which can cause variations in the measured values. Hence, it would be wise to consider that even in dry conditions, a very thin layer of water exists on the grain surface, and for this reason, the capillary force acting on the probe needs to be subtracted from the measured adhesion force. However, as we do not know if such effects, which depend on the relative humidity in the testing room, really occurred during our measurements, we will discard them in the following. We here compute the adhesion pressure in dry (Padh(dry)) and wet (Padh(wet)) conditions by dividing the forces by the area of a half sphere with a radius corresponding to the probe tip radius R [26]:
P adh dry ,   wet = F adh dry ,   wet 2 π R 2
Using for R, the values given in Section 2.6.2 after probe calibration, a pressure of 5.06 MPa and 0.99 MPa was obtained in dry and wet conditions respectively, for Obourg Chalk, and for Ciply Chalk, we found 4.79 MPa and 0.84 MPa, respectively
Regardless of the effect caused by the relative humidity, in all the measurements taken, the adhesion pressure was always higher when the sample was nominally dry with respect to full water saturation in the liquid cell. To go further, the difference Padh(dry) − Padh(wet) between the adhesion pressure in dry and wet conditions can be considered as a repulsive pressure acting between the chalk grains in the water-saturated chalks. This repulsive pressure would contribute to reduce the rock cohesion. Many authors have argued that the water adsorbed onto the grain surface can induce repulsive effects, referred to as disjoining pressure [31,32,33,34]. This pressure may arise from the dipolar nature of the water molecules: if water is adsorbed onto two close layers of the same composition and with the same surface species (with a negative net charge [35,36]), repulsive effects can arise from this structure (Figure 17a). By adding salts, the ions could replace the water molecules or balance the repulsion in between the two layers, reducing the disjoining pressure (Figure 17b). The ionic strength of the pore fluid is then the parameter that can quantify the amount of weakening [4,31].
Nevertheless, more complexities could be introduced into the simplified scenario in Figure 17; such as, the calcite surface, which actually has calcium and carbonate ions with partial positive and negative unsaturated charge (thus, not totally negative); or the hydration layers/shell on the dissolved ions, such features could themselves set up repulsion forces between two nearby surfaces [37].
To quantify the effect of repulsive forces, we estimated the value of the repulsive pressure Padh(dry) – Padh(wet) and found 4.1 MPa for Obourg Chalk and 3.9 MPa for Ciply Chalk. For Obourg Chalk the repulsive pressure value can be compared to the contrast in cohesion given by the Mohr–Coulomb approach between dry and wet conditions So(dry) – So(sat) = 0.78 MPa (Table 7). This value is lower than the estimated repulsive pressure, but still in the same order of magnitude. A better agreement might be found if the adhesion pressure were corrected for capillary pressure effects potentially induced by the presence of a thin water layer at the probe tip; such capillary effects would significantly lower the adhesion pressure in the “dry” rock [25]. In the same line, we would expect a comparable cohesion contrast in Ciply Chalk.
The decreasing trend of the contact angle with respect to the ionic strength of the NaCl and MgCl2 solutions can in part explain this process. A lower contact angle results from a higher wettability of the calcite surface, which could be linked to an enhanced adsorption of ions with respect to pure water. Nevertheless, the affinity of each ion with the chemical species at the surface of the grains depends on the environmental conditions (e.g., temperature, humidity, and pH) [38] and for this reason, further works need to be conducted to bridge the gap between mechanical tests and geochemistry of the fluid–rock interaction.

5. Conclusions

The impact of water weakening on the mechanical behavior of two chalks, the Obourg Chalk and the Ciply Chalk from the Mons Basin in Belgium, was investigated through different mechanical tests in the laboratory: uniaxial and triaxial compression tests, Brazilian tests, water injection tests, and semi-circular bending tests were conducted on samples saturated with air, water, or brine. From these experiments, we obtained the so-called wet-to-dry ratios, i.e., the ratio between a given property measured on a dry sample and the same property for the water-saturated sample, for the following mechanical properties: UCS, tensile strength, Young’s modulus, mechanical strength under triaxial loading, critical pressure, fracture toughness in mode I, cohesion, and internal friction coefficient. For both chalks, and for any of these rock properties, water has a significant weakening effect, as the wet-to-dry ratios roughly ranged between 0.40 and 0.75. On average, the Ciply Chalk exhibits more water weakening than the Obourg Chalk. Some parameters like UCS, critical pressure, and Young’s modulus have the highest water sensitivity compared to other properties. From the experiments on brine-saturated samples, a weakening effect is still present but the results are dependent on the fluid composition.
As the fluid–rock interaction processes occur mainly at the fluid–solid interface, we tried to link our results to the surface properties of the chalks using three different techniques: AFM (atomic force microscopy), contact angle goniometry, and laser confocal microscopy. AFM and contact angle analysis allow one to estimate the surface energy of the fluid–rock interface, which can be compared to the “fracture” surface energy inferred from fracture toughness measurements. Our results show that the latter is about one order of magnitude higher that the former. However, in all cases the surface energy in the presence of water was reduced with respect to the dry rocks, which could explain the observed water weakening in both chalks. Another possible explanation is the existence of repulsive forces near the fluid–rock interface, the magnitude of which could be estimated from the adhesion forces provided by AFM. The higher surface energy decrease for Ciply Chalk is in good agreement with the stronger water weakening impact on the mechanical properties observed in this chalk.

Author Contributions

Conceptualization, D.G. and C.D.; data curation, D.G.; formal analysis, D.G. and R.I.; funding acquisition, C.D.; investigation, D.G., C.D. and R.I.; methodology, D.G. and A.E.H.; project administration, C.D.; resources, D.G., C.D. and A.E.H.; supervision, C.D. and A.E.H.; validation, D.G., C.D., R.I. and A.E.H.; visualization, D.G.; writing—original draft, D.G. and C.D.; writing—review and editing, D.G., C.D. and A.E.H. All authors have read and agreed to the published version of the manuscript.

Funding

This work was funded by the GEO2FRI2SK project (Geophysical and Geotechnical Impact of Fluid–Rock Interactions for Risk Assessment in Chalk Formations) granted by the Initiative d’Excellence Paris Seine at CY Cergy Paris Université.

Data Availability Statement

The data set supporting this work has been made available at https://doi.org/10.6084/m9.figshare.16918519 (accessed date 1 December 2021).

Acknowledgments

Part of the experimental results on Obourg Chalk was obtained by Adilbek Zhengissov, currently lab analyst at Stratum Reservoir, during a Master internship at Cergy Paris Université in 2020. Many thanks to Sébastien Peralta, Carolina Ferreira, and Rémy Agniel for technical help with the experiments ran at the i-Mat Microscopy and Analyses Platform at CY Cergy Paris Université. This work has benefited from discussions with Beatriz Menéndez and Christophe Barnes, co-advisors of D.G., and Sophie Cantin. Fruitful collaborations with our project partners at Université de Mons and CSIRO Perth are acknowledged. D.G. is grateful to the Ecole Doctorale Sciences et Ingénierie who granted his PhD fellowship. R.I. is grateful to i-Mat (Fédération Institut des Matériaux) at CY Cergy Paris Université who granted his master fellowship.

Conflicts of Interest

The authors declare that there are no conflict of interest.

References

  1. Biot, M.A. General Theory of Three-Dimensional Consolidation. J. Appl. Phys. 1941, 12, 155. [Google Scholar] [CrossRef]
  2. Rutter, E.H. The Influence of Interstitial Water on the Rheological Behaviour of Calcite Rocks. Tectonophysics 1972, 14, 13–33. [Google Scholar] [CrossRef]
  3. Baud, P.; Zhu, W.; Wong, T. Failure Mode and Weakening Effect of Water on Sandstone. J. Geophys. Res. Solid Earth 2000, 105, 16371–16389. [Google Scholar] [CrossRef]
  4. Risnes, R.; Madland, M.V.; Hole, M.; Kwabiah, N.K. Water Weakening of Chalk—Mechanical Effects of Water–Glycol Mixtures. J. Pet. Sci. Eng. 2005, 48, 21–36. [Google Scholar] [CrossRef]
  5. Doornhof, D.; Tron, G.K.; Nagel, N.B.; Pattillo, P.D.; Sayers, C. Compaction and Subsidence. Oilfield Rev. 2006, 18, 50–68. [Google Scholar]
  6. Duda, M.; Renner, J. The Weakening Effect of Water on the Brittle Failure Strength of Sandstone. Geophys. J. Int. 2013, 192, 1091–1108. [Google Scholar] [CrossRef] [Green Version]
  7. David, C.; Dautriat, J.; Sarout, J.; Delle Piane, C.; Menendez, B.; Macault, R.; Bertauld, D. Water Weakening Triggers Mechanical Instability in Laboratory Fluid Substitution Experiments on a Weakly-Consolidated Sandstone. In Proceedings of the 50th US Rock Mechanics/Geomechanics Symposium, Houston, TX, USA, 26–29 June 2016; American Rock Mechanics Association: Houston, TX, USA, 2016; p. ARMA 16-0229. [Google Scholar]
  8. David, C.; Dautriat, J.; Sarout, J.; Delle Piane, C.; Menéndez, B.; Macault, R.; Bertauld, D. Mechanical Instability Induced by Water Weakening in Laboratory Fluid Injection Tests. J. Geophys. Res. Solid Earth 2015, 120, 4171–4188. [Google Scholar] [CrossRef]
  9. Geremia, D.; David, C.; Descamps, F.; Menéndez, B.; Barnes, C.; Vandycke, S.; Dautriat, J.; Esteban, L.; Sarout, J. Water-Induced Damage in Microporous Carbonate Rock by Low-Pressure Injection Test. Rock Mech. Rock Eng. 2021, 54, 5185–5206. [Google Scholar] [CrossRef]
  10. Robaszynski, F.; Martin, M. Late cretaceous phosphate stratiform deposits of the Mons Basin (Belgium). In Mineral Deposits within the European Community; Springer: Berlin/Heidelberg, Germany, 1988; pp. 515–529. [Google Scholar] [CrossRef]
  11. Jaeger, J.C.; Cook, N.G.W.; Zimmerman, R.W. Fundamentals of Rock Mechanics; Blackwell Pub: Hoboken, NJ, USA, 2007. [Google Scholar]
  12. Kuruppu, M.D.; Obara, Y.; Ayatollahi, M.R.; Chong, K.P.; Funatsu, T. ISRM-Suggested Method for Determining the Mode I Static Fracture Toughness Using Semi-Circular Bend Specimen. Rock Mech. Rock Eng. 2013, 47, 267–274. [Google Scholar] [CrossRef] [Green Version]
  13. Geremia, D.; David, C. Continuous Recording of Viscoelastic Relaxation Processes at a Constant Ultrasonic Frequency Due To Wave-Induced Fluid Flow in a Microporous Carbonate Rock. Geophys. Res. Lett. 2021, 48, e2021GL095244. [Google Scholar] [CrossRef]
  14. Hazen, R.M. Chiral crystal faces of common rock-forming minerals. In Progress in Biological Chirality; Palyi, G., Zucchi, C., Caglioti, L., Eds.; Elsevier: Amsterdam, The Netherlands, 2004; pp. 137–151. [Google Scholar]
  15. Bruker. Webpage dimension_ion@Bruker. Available online: https://www.bruker.com/en/products-and-solutions/microscopes/materials-afm/dimension-icon-afm.html (accessed on 2 November 2021).
  16. Bruker. Webpage afmprobe@Bruker. Available online: https://www.brukerafmprobes.com/p-3726-scanasyst-air.aspx (accessed on 2 November 2021).
  17. Cassie, A.B.D. Contact Angles. Discuss. Faraday Soc. 1948, 3, 11–16. [Google Scholar] [CrossRef]
  18. Erbil, H.Y. Surface Chemistry of Solid and Liquid Interfaces; Blackwell Pub: Oxford, UK, 2006. [Google Scholar]
  19. Owens, D.K.; Wendt, R.C. Estimation of the Surface Free Energy of Polymers. J. Appl. Polym. Sci. 1969, 13, 1741–1747. [Google Scholar] [CrossRef]
  20. Royaux, A.; El Haitami, A.; Fichet, O.; Cantin, S. Surface Free-Energy Determination of Copper Wire Using a Large Range of Model Liquids. SN Appl. Sci. 2019, 2, 48. [Google Scholar] [CrossRef] [Green Version]
  21. Crawford, A.M.; Wylie, D.A. A modified multiple failure state triaxial testing method. Proceedings of 28th US Symposium on Rock Mechanics, Tucson, AZ, USA, 29 June–1 July 1987; OnePetro: Tucson, AZ, USA, 1987; pp. 133–140. [Google Scholar]
  22. Velcin, H.; Dautriat, J.; Sarout, J.; Esteban, L.; Godel, B. Experimental Reactivation of Shear-Fractured Berea and Boise Sandstones by Brine or Liquid CO2 Injection at Depth. J. Geophys. Res. Solid Earth 2020, 125, e2019JB018281. [Google Scholar] [CrossRef]
  23. Wong, T.; David, C.; Zhu, W. The Transition from Brittle Faulting to Cataclastic Flow in Porous Sandstones: Mechanical Deformation. J. Geophys. Res. Solid Earth 1997, 102, 3009–3025. [Google Scholar] [CrossRef]
  24. Johnson, D.L. Theory of Frequency Dependent Acoustics in Patchy-Saturated Porous Media. J. Acoust. Soc. Am. 2001, 110, 682. [Google Scholar] [CrossRef] [Green Version]
  25. Iazykov, M.; Erouel, M.; Villey, R.; Souteyrand, E.; Tardy, J.; Phaner-Goutorbe, M.; Skryshevsky, V.A. An AFM Investigation of Surface Energy of Pentacene Films on Parylene-C and Benzocyclobutene. Funct. Mater. Lett. 2012, 5, 1250016. [Google Scholar] [CrossRef]
  26. Wong, T.; David, C.; Menendez, B. Mechanical Compaction; Elsevier Science & Technology: Amsterdam, The Netherlands, 2004; pp. 55–114. [Google Scholar] [CrossRef]
  27. Røyne, A.; Bisschop, J.; Dysthe, D.K. Experimental Investigation of Surface Energy and Subcritical Crack Growth in Calcite. J. Geophys. Res. 2011, 116. [Google Scholar] [CrossRef] [Green Version]
  28. Gilman, J.J. Direct Measurements of the Surface Energies of Crystals. J. Appl. Phys. 1960, 31, 2208–2218. [Google Scholar] [CrossRef]
  29. Santhanam, A.T.; Gupta, Y.P. Cleavage Surface Energy of Calcite. Int. J. Rock Mech. Min. Sci. 1968, 5, 253–259. [Google Scholar] [CrossRef]
  30. Donnet, M.; Bowen, P.; Jongen, N.; Lemaître, J.; Hofmann, H. Use of Seeds to Control Precipitation of Calcium Carbonate and Determination of Seed Nature. Langmuir 2005, 21, 100–108. [Google Scholar] [CrossRef] [PubMed]
  31. Røyne, A.; Dalby, K.N.; Hassenkam, T. Repulsive Hydration Forces between Calcite Surfaces and Their Effect on the Brittle Strength of Calcite-bearing Rocks. Geophys. Res. Lett. 2015, 42, 4786–4794. [Google Scholar] [CrossRef] [Green Version]
  32. Risnes, R. Deformation and Yield in High Porosity Outcrop Chalk. Phys. Chem. Earth Part A Solid Earth Geod. 2001, 26, 53–57. [Google Scholar] [CrossRef]
  33. Meireles, L.T.P.; Storebo, E.M.; Welch, M.J.; Fabricius, I.L. Water Weakening of Soft and Stiff Outcrop Chalk Induced by Electrical Double Layer Disjoining Pressure. Int. J. Rock Mech. Min. Sci. 2021, 141, 104700. [Google Scholar] [CrossRef]
  34. Voake, T.; Nermoen, A.; Ravnås, C.; Korsnes, R.I.; Fabricius, I.L. Influence of Temperature Cycling and Pore Fluid on Tensile Strength of Chalk. J. Rock Mech. Geotech. Eng. 2019, 11, 277–288. [Google Scholar] [CrossRef]
  35. Al Mahrouqi, D.; Vinogradov, J.; Jackson, M.D. Zeta Potential of Artificial and Natural Calcite in Aqueous Solution. Adv. Colloid Interface Sci. 2017, 240, 60–76. [Google Scholar] [CrossRef] [Green Version]
  36. Heberling, F.; Trainor, T.P.; Lützenkirchen, J.; Eng, P.; Denecke, M.A.; Bosbach, D. Structure and Reactivity of the Calcite-Water Interface. J. Colloid Interface Sci. 2011, 354, 843–857. [Google Scholar] [CrossRef]
  37. Zhang, C. Hydration force. In Encyclopedia of Tribology; Springer: Boston, MA, USA, 2013. [Google Scholar] [CrossRef]
  38. Zeng, L.; Chen, Y.; Lu, Y.; Hossain, M.M.; Saeedi, A.; Xie, Q. Role of Brine Composition on Rock Surface Energy and Its Implications for Subcritical Crack Growth in Calcite. J. Mol. Liq. 2020, 303, 112638. [Google Scholar] [CrossRef]
Figure 1. (a) Density map in a 16 × 18 cm block of Ciply Chalk obtained by CT scan. (b) SEM micrograph showing the heterogeneous microstructure in Ciply Chalk. (c) Close view of a brain-like nodule made of fluorapatite.
Applsci 11 11437 g001
Figure 2. (a) Device used for conducting Brazilian tests for the determination of the tensile strength. (b) Sketch of the setup used for conducting standard triaxial tests and injection tests in a pressure vessel.
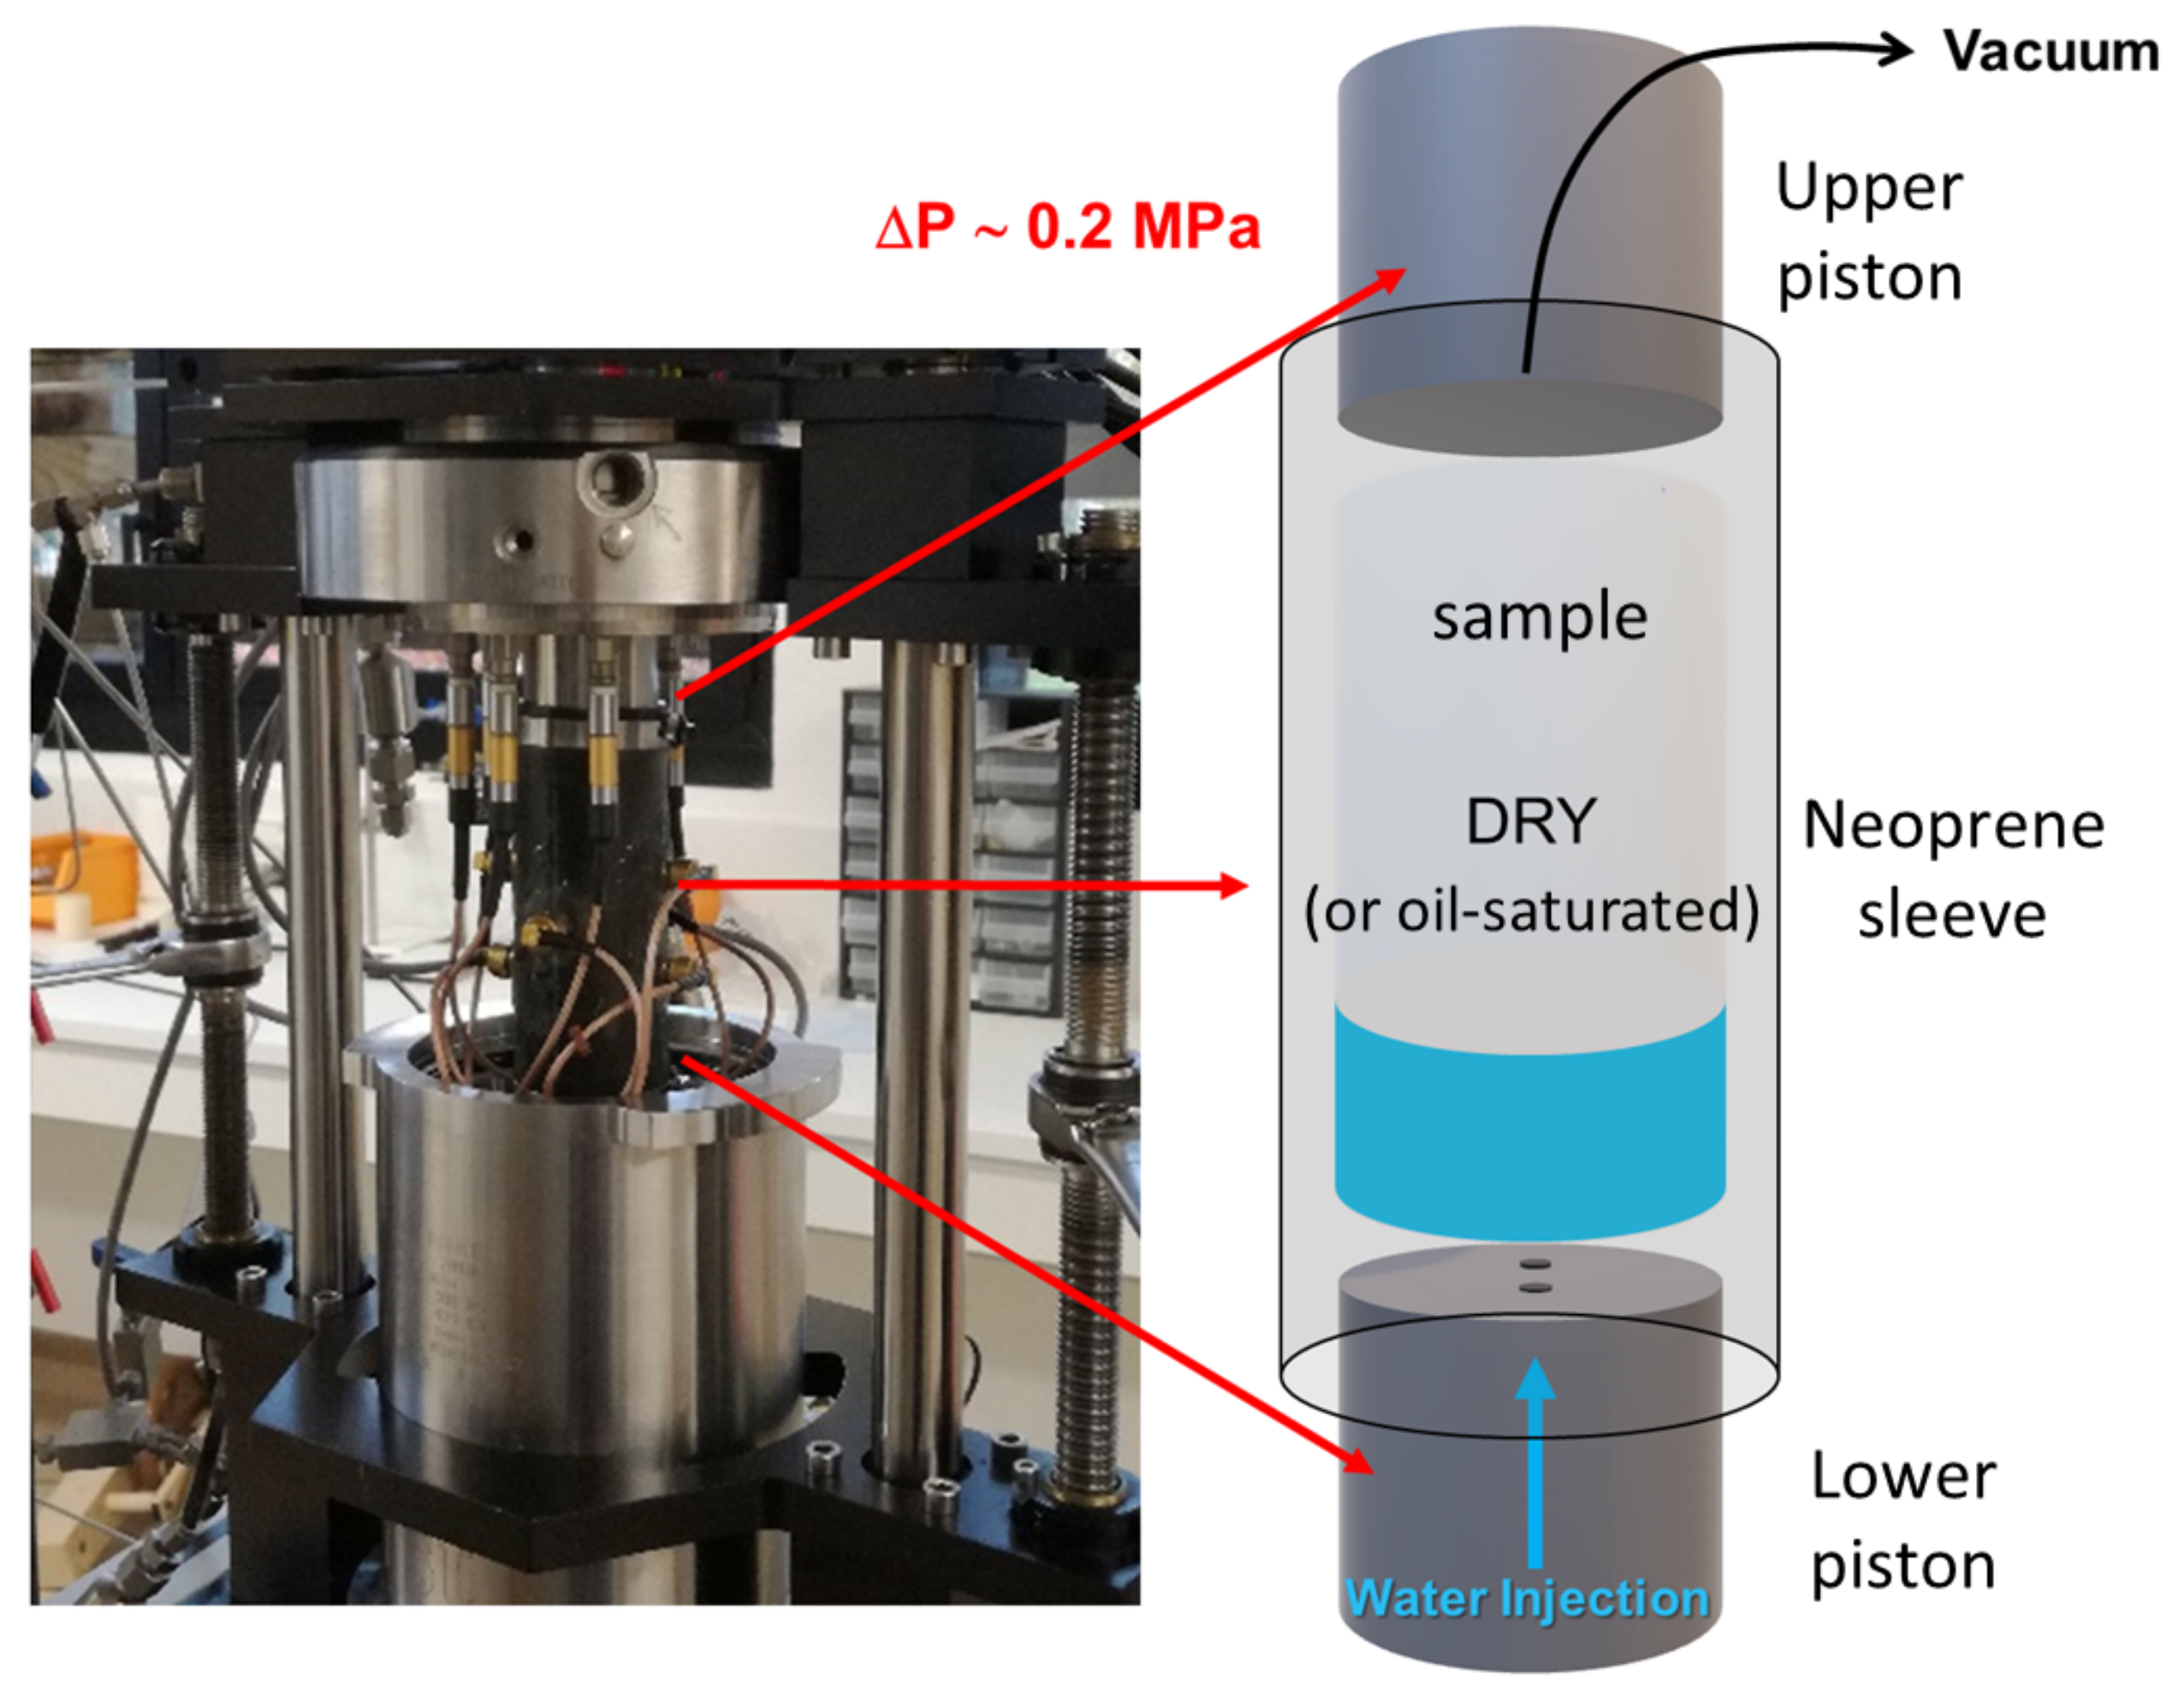
Applsci 11 11437 g002
Figure 3. View of the open pressure vessel and sketch explaining the protocol used for the injection tests. ΔP is the fluid pressure difference between the bottom and top of the sample.
Applsci 11 11437 g003
Figure 4. The new device developed at GEC laboratory for measuring the mode I fracture toughness. The sample geometry is given on the right and the requirements for the different parameters are summarized in the table.
Applsci 11 11437 g004
Figure 5. Cylindrical rock plugs of Ciply Chalk (bottom left) and Obourg Chalk (bottom right), and pure single calcite (top) used for surface characterization. The scale is given by the ruler in mm.
Applsci 11 11437 g005
Figure 6. (a) Bruker™ “dimension icon” Atomic Force Microscope [15] with the Scanasyst-Air® probe [16] on the right top corner. (b) Typical cycle of force vs. time in the Peak Force Tapping mode.
Applsci 11 11437 g006
Figure 7. (a) Drop shape analysis profile (DSA-P) device from Kruss™. (b) Example of picture used to measure the contact angle on a surface through a dedicated software.
Applsci 11 11437 g007
Figure 8. UCS values for the Obourg chalk vs. porosity for 100 samples with different fluid content.
Applsci 11 11437 g008
Figure 9. Triaxial tests at 1.5 MPa effective confining pressure for Obourg and Ciply chalks with different fluids saturating the pore space. The y-axis scale is the same for both plots.
Applsci 11 11437 g009
Figure 10. Yielding envelopes obtained from the yield stresses for both chalks saturated with different fluids. Solids symbols are for conventional triaxial tests, open symbols are for data obtained using a multistage loading approach on a single sample. The y-axis scale is the same for both plots.
Applsci 11 11437 g010
Figure 11. Mohr circles obtained from triaxial tests on dry (in red) and water-saturated (in blue) Obourg Chalk samples. The Coulomb failure lines were derived by a least-squares fitting scheme using the points with error bars on the plot.
Applsci 11 11437 g011
Figure 12. (a) Injected water volume normalized to pore volume vs. applied differential stress normalized to the strength of the dry rock at fixed confining pressure (1.5 MPa). (b) Samples after failure induced by water injection at constant stress level.
Applsci 11 11437 g012
Figure 13. Results for acoustic monitoring of the P wave velocity (top) and amplitude (bottom) during injection tests in Obourg (left) and Ciply (right) Chalks at 1.5 MPa confining pressure. The different colors correspond to measurements at different heights in the bottom (red), middle (green), and top (blue) planes. The velocity and amplitude scale are the same for the Obourg and Ciply Chalks plots.
Applsci 11 11437 g013
Figure 14. (a) Application of the Owens–Wendt method to get the two components of surface energy from the linear regression. (b) Contact angle measurements vs. ionic strength for NaCl and MgCl2 brines in contact with a single calcite crystal.
Applsci 11 11437 g014
Figure 15. (a) Example of 3D topography on a 10 × 10 μm surface obtained on Obourg chalk. (b) Example of adhesion force map on a 10 × 10 μm surface for Obourg chalk.
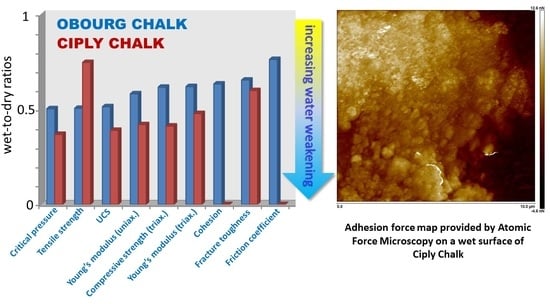
Applsci 11 11437 g015
Figure 16. Bar chart with the wet-to-dry ratios in increasing order for each chalk.
Applsci 11 11437 g016
Figure 17. Schematic drawing of the repulsive effect (a) in a water-saturated chalk, (b) in a brine-saturated chalk. For the sake of simplicity, the relative size of the water molecule with respect to Mg2+ and Cl- ions is not respected.
Applsci 11 11437 g017
Table 1. Composition and petrophysical properties of the selected rocks.
Obourg ChalkCiply Chalk
mineralogical compositioncalcitecalcite, fluorapatite
grain density (kg/m3)27202730
bulk density (kg/m3)15501680
average porosity 0.430.39
average permeability (m2)6.4 · 10−164.0 · 10−14
Table 2. Dispersive and polar components of the free surface energy for the 5 fluids used in our experiments. The total free energy is the sum of both components. DW = distilled water/DIO = Diiodomethane/Form = Formamide/DMSO = Dimethyl Sulfoxide/Glyc = Glycerol.
Free Surface Energy (mJ/m2)DWDIOFormDMSOGlyc
Dispersive component γ(D)21.848.539.536.034.0
Polar component γ(P)51.02.318.78.030.0
Total free energy72.850.858.244.064.0
Table 3. Tensile strength values for both chalks for dry and water-saturated samples.
Obourg ChalkCiply Chalk
Pore FluidNumber of SamplesTENSILE Strength (MPa)Standard Deviation (MPa)Number of SamplesTensile Strength (MPa)Standard Deviation (MPa)
Air (dry)4−0.870.141−0.75-
Distilled water2−0.440.072−0.560.15
Table 4. Compressive strengths and elastic moduli for both chalks tested under dry and water-saturated conditions at 1.5 MPa effective confining pressure. Two Obourg chalk samples were tested in order to check the reproducibility of the experiments. Additional experiments were conducted on Obourg Chalk with two different brines saturating the pores.
Obourg ChalkCiply Chalk
Pore FluidCompressive Strength (MPa)Young’s Modulus (GPa)Compressive Strength (MPa)Young’s Modulus (GPa)
Air (dry sample)11.15.09.72.3
10.34.9
Deionized water6.53.141.1
6.73.1
Brine 35 g/L NaCl6.73.2XX
Brine 35 g/L MgCl28.83.8XX
Table 5. Compilation of fracture toughness measurements for Obourg and Ciply Chalk samples saturated with different pore fluids.
Obourg ChalkCiply Chalk
Pore FluidNumber of SamplesKIC (MPa·m1/2)Standard Deviation (MPa·m1/2)Number of SamplesKIC (MPa·m1/2)Standard Deviation (MPa·m1/2)
Air (dry)70.07780.008630.04790.0142
Distilled water60.05090.006830.02870.0042
NaCl brine30.03790.0015
MgCl2 brine30.04250.0141
CaCl2 brine30.04580.0077
Table 6. Average advancing contact angle of different model fluids on the different studied surfaces (see caption of Table 2 for fluid nomenclature) and surface roughness measured by AFM and laser confocal microscopy. For calcite crystal only three fluids were tested.
Average Advancing Contact Angle (°)Roughness Ra (nm)
DWDIOFormDMSOGlycAFMConfocal
Obourg + Resin89.4 ± 4.774.2 ± 4.977.6 ± 3.553.5 ± 4.377.8 ± 3.672.5 ± 19.5893 ± 40
Ciply + Resin86.0 ± 4.372.4 ± 4.070.5 ± 5.356.3 ± 3.075.8 ± 4.158.8 ± 21.9511 ± 480
Calcite crystal77.8 ± 4.971.3 ± 3.573.8 ± 7.12766 ± 919
Resin80.7 ± 4.275.2 ± 5.069.5 ± 4.455.1 ± 4.870.3 ± 4.8
Table 7. Compilation of experimental results for the mechanical tests conducted on the dry and water-saturated chalks. The wet-to-dry ratios WDR(Λ) are given for the corresponding parameters Λ.
Obourg ChalkCiply Chalk
Testing MethodPropertiesDry rockWater Saturated RockWet-to-Dry RatioDry RockWater Saturated RockWet-to-Dry Ratio
Uniaxial compressionUCS (MPa)7.03.60.514.41.70.39
Young’s Modulus (GPa)5.53.20.581.20.50.42
Brazilian testTensile strength (MPa)−0.87−0.440.51−0.75−0.560.75
Triaxial compression @1.5 MPa confining pressureCompressive strength (MPa)10.76.60.629.74.00.41
Young’s Modulus (GPa)5.03.10.622.31.10.48
Isotropic compressionCritical pressure (MPa)14.17.10.516.05.90.37
Triaxial testsInternal friction coefficient (-)0.590.450.76XXX
Cohesion (MPa)2.131.350.63XXX
Semi-circular bending testFracture toughness KIC (MPa∙m1/2)0.07780.05090.650.04790.02870.60
Table 8. Surface energy derived from the three different methods tested in this work.
Obourg ChalkCiply Chalk
Surface Energy (J/m2)Dry RockWater-Saturated Rock λ = γ sat γ dry Dry RockWater-Saturated Rock λ = γ sat γ dry
From contact angle measurements0.0234not measurableX0.0253not measurableX
From AFM0.02070.01650.800.01960.01410.72
From KIC measurements0.52700.41500.791.010.840.83
Publisher’s Note: MDPI stays neutral with regard to jurisdictional claims in published maps and institutional affiliations.

