1. Introduction
Construction sites are hazardous work environments, even after a significant effort is invested for identifying hazards and mitigating safety risks following the construction safety management guidelines and standard practices. This is because many safety risks on construction sites cannot be eliminated given the current construction methods and techniques, and those “reduced” safety risks still require workers’ awareness and perception of the risks and their ability to respond to those risks appropriately to prevent accidents. In other words, construction sites rely on many administrative controls such as training, policies, signs, interpersonal communications, and shift designs, which are all implemented to increase workers’ risk awareness and control the residual hazards. However, those administrative controls are limited in preventing accidents and have proven to be less effective than other measures in the hierarchy of controls, as they require significant effort by the workers involved [
1].
With interest in finding how to help workers maintain adequate recognition of hazards and risk perception, researchers have investigated the effectiveness of training. Previous research works unanimously state that safety training programs have a positive impact on construction workers’ risk perception and safety attitude [
2,
3,
4] but provided limited discussion on how much safety training programs increase workers’ ability to recognize all hazards and perceive appropriate risks in the work environment. Specifically, Man et al. [
4] found that their data did not support the links between safety training and workers’ ability to recognize the probability and severity of specific safety risks.
Several researchers approached the problem of worker hazard recognition by developing a sensor-based hazard alarm system designed to alert construction workers in a timely manner when they were around a hazard. The researchers used various types of sensors, including Radio Frequency (RF) [
5,
6], Bluetooth Low Energy (BLE) [
7,
8,
9,
10], Global Positioning System (GPS) [
11], Chirp Spread Spectrum (CSS), and Inertial Measurement Unit (IMU) [
12] sensors, to name just a few examples, to create a system to quickly give a warning to the worker exposed to a critical hazard. In addition, researchers reviewed the use of these different types of sensor-based location- or proximity-based warning systems for construction safety and found that the number of publications discussing sensing and warning-based technology for construction safety has increased dramatically since 2013, especially for BLE-based proximity warning systems [
13,
14,
15].
However, the application of BLE-based hazard alarm systems on construction sites is in an early stage in the construction industry, and many questions need to be answered before such a system can be fully implemented. One of the important questions is about the suitability and reliability of Bluetooth signal-based distance measures and proximity detection in construction work environments. Researchers indicated that BLE sensors are influenced by the ambient temperature and humidity, and therefore, the performance of proximity sensing and alert systems can be compromised by these factors [
8]. As BLE signals are also significantly attenuated when they hit an obstacle like concrete walls in indoor environments [
16], the applicability of BLE-based proximity sensing for construction worker hazard alert systems needs to be tested in real-world settings to provide clearer empirical evidence for such a system’s viability and possibly reveal the potential issues to be addressed before such systems can be implemented in construction sites.
To address this research need, this paper aims to investigate the impact of different beacon sensor deployment locations on the location where a worker would receive a proximity-based hazard notification in a concrete building structure. This goal was achieved by conducting an experimental study at a typical concrete structure building construction site and marking the locations at which a BLE proximity sensing-based hazard notification is received on a mobile phone through a cloud-based hazard notification system. As environmental factors and random effects affect the exact location of the BLE signal and mobile data reception, the data collection was repeated so that the notification reception locations were visualized as a heat map, which was then qualitatively analyzed for ascertaining the impact of the beacon sensor locations on hazard notification performance.
The rest of the paper is organized as follows. First, the relevant literature is reviewed, primarily focusing on three areas of research: construction worker hazard recognition and risk perception, site hazard information communication, and sensor-based site hazard alarm systems. The subsequent section will explain the detailed design of the BLE-based hazard notification cloud system used in this study. Next, the experimental design and the case site are explained, followed by the results. Lastly, the implications of the experiment results and findings are discussed, and the paper concludes.
2. Research Background
2.1. Construction Worker Hazard Recognition and Risk Perception
The hazard recognition and risk perception of workers are essential for safety in construction work environments, but unfortunately, recent studies showed that many construction hazards are not recognized by the workers, leading to accidents and injuries [
17]. Furthermore, many previous studies indicated that workers frequently underestimate the safety risks [
17]. Researchers found that among the many reasons for such missed hazard recognition or underestimated risks are safety knowledge [
18], distraction [
17], training [
2], blind spots [
19], the emotional states of the workers [
20], and the organizational safety climate [
21].
Researchers have found that situation awareness (SA) is a useful theoretical framework for understanding how a construction worker recognizes a hazard within a work environment and the factors involved with the process of risk perception [
11,
19]. SA is a comprehensive term denoting the perception of the elements in a constrained environment and consists of three dimensions: “a constrained time and space, the comprehension of the meaning, and the projection of their status in the near future.” [
22]. Endsley [
23] viewed situation awareness as part of a person’s state of knowledge related to perceiving risks and making decisions in a dynamic environment. To achieve good SA, the first step is to perceive the details of the relevant elements. The second step is to comprehend the perceived information and its meaning in the given environment. The third step is to project future events and possibilities to make a decision for an action that is most appropriate in the given situation [
24]. This process of situation awareness is influenced by internal and external factors, including the individual’s ability to recognize and comprehend an observed situation and previous experience and mental models [
24].
It is difficult for workers to keep aware of all hazards in the surrounding environment during work. Furnham [
25] developed an accident causal process model showing that incomplete cognition of hazards can cause multiple human errors. Previous research revealed that keeping good SA is even harder for people who work in a dynamic and less organized environment, such as military, construction, and road environments [
26,
27,
28]. Salmon et al. [
29] identified some implications of the theory of SA regarding the use of road environments and explained accident causation based on the theory. In the context of construction works, the theory of SA explains why workers’ correct and timely recognition of hazards is critical for safety. Such criticality has already resonated among several researchers in the construction domain, who have investigated how technology can assist workers with maintaining good SA. For example, Oloufa et al. [
30] integrated a Differential Global Positioning System (DGPS) and wireless and web-based technologies into construction equipment to track mobile targets and inform workers when they are approaching. Their research revealed that various technologies can be used to define, detect, and evaluate the SA performance of workers and supervisors. Mamessier et al. [
31] conducted a virtual reality-based experiment to evaluate the SA of workers in a simulated environment and proved that eye-tracking technology is a practical way to examine the level of SA. Additionally, Hasanzadeh et al. [
32] investigated construction workers’ SA in dynamic construction work environments using eye-tracking devices.
2.2. Site Hazard Information Communication
There would be four critical components in site hazard information management: site rules, site inductions, permits to work, and on-site training, such as toolbox talks [
33]. Among these, site inductions and toolbox talks play a crucial role in site hazard management, as they affect workers’ knowledge and skills to recognize and appropriately respond to site hazards. Kines et al. [
34] conducted an experimental study and found that workers involved in toolbox meetings had a significant increase in interaction with their supervisor, and as a result, they had higher levels of hazard awareness. Esmaeili et al. [
35] reviewed the literature on the effectiveness of on-site safety training programs and found that specific training and safety meetings were the two most effective programs among the twelve different types of safety training programs they reviewed. Hinze et al. [
36] found that the participation of contractors in safety meetings had the most significant relationship with the reduction of the injury rate. With an understanding of the importance of toolbox meetings and hazard information communication with workers, many safety authorities require toolbox meetings in site safety management systems [
37,
38,
39]. However, researchers also indicated limitations in the current toolbox meeting practices in the construction industry. Olson et al. [
40] reviewed the toolbox meetings in the US and found that the time for workers and subcontractors to talk and engage needs to be increased. They also found that more visualization and specific incident case studies can increase the effectiveness of toolbox meetings in increasing workers’ hazard recognition.
Site induction is another commonly used method to increase hazard awareness in construction workers. Since OSHA started a hazard awareness program called Smart Mark in the US in 1997, such site induction programs have become a norm in construction sites across the US [
41]. In 2007, the Western Australia government also developed a similar mandatory site induction program called Construction Induction Training (CIT), and more recently, an online version of this type of training also became available [
42]. Similar site induction programs are required in other countries in Asia and Europe as well [
33,
43]. Researchers investigated the effectiveness of the current practices in site induction programs applied in the construction industry. Bahn and Barratt-Pugh [
42] conducted two studies in 2006 and 2010 in Western Australia to assess the benefits of site induction training programs from the worker’s perspective. They found that practitioners in general changed their attitudes from indifference or even a refusal to support them. Bahn and Barratt-Pugh’s subsequent research found that site induction programs contributed to decreasing accident rates in Western Australian construction workplaces [
44]. Other research also proved that safety training intervention programs could reduce injuries at construction sites.
Despite the successful results of those worker safety training and site induction programs, researchers indicated that a worker’s ability to appropriately recognize site hazards and correctly perceive the level of safety risks can still be compromised due to distraction [
17], blind spots [
19], and their emotional state [
20]. In addition, workers’ sensitivity to important hazards and safety risks can be reduced over time. For example, Perlman, Sacks, and Barak [
45] found experienced workers who regularly worked at heights underestimating the risk of falling when using a ladder. Such unrecognized or underestimated safety hazards increase the possibility of catastrophic workplace incidents [
46]. These limitations of the current methods for communicating site hazards and the human nature of becoming insensitive to hazards motivated researchers to look into the possibility of using sensor-based systems to address the problem of the hazard recognition and risk perception of workers, as discussed in the following section.
2.3. Sensor-Based Site Hazard Alarm Systems and Knolwedge Gaps
In general, many of the safety injuries at construction sites would be associated with whether the workers have a possibility to be close to or make contact with any existing safety risks such as floor holes or open spaces without proper safety protection, which can lead to “falls from height”, or working areas that are exposed to “struck-by hazards” (e.g., flying, falling, swinging, and rolling objects). As a result, monitoring the locations of workers or any sources of forcible contact (e.g., equipment) is important to provide a timely alarm to workers and avoid potential hazards. The primary function of such sensor-based hazard alarm systems would be to obtain accurate worker location information by using various positioning and localization sensors such as Global Positioning Systems (GPSs), Radio Frequency Identification (RFID), Ultra-Wide Band (UWB), Wireless Local Area Networks (WLANs), or BLE. For example, Fu [
47] designed an alarm system that obtained distance data through a GPS to remind railway construction workers of a coming train at the sites. Fang et al. [
48] used RFID to localize workers to provide a timely warning if a worker was near predefined hazardous areas. Giretti et al. [
49] applied UWB technologies to develop a real-time monitoring system for workers and equipment. Woo et al. [
50] developed a WLAN-based indoor positioning system to track laborers at construction sites and conducted a case study at the Guangzhou MTR tunnel construction site. Park, Yang, Cho, and Seo [
8] proposed a BLE beacon-based safety alert system for indoor worker safety monitoring [
7].
Fang, Cho, Zhang, and Perez [
48] pointed out several features of sensors when selecting localization technologies, such as (1) accuracy, (2) affordability (e.g., required capital hardware investment), (3) need for line of sight, (4) wireless communication, (5) need for a power supply, and (6) scalability. Considering these features, BLE beacons have comparative advantages compared with others, especially for sensor deployment at dynamically changing construction environments. These days, various cheap, off-the-self BLE beacons with long-lasting batteries (more than 2–3 years without changing batteries) are available on the market. They can communicate with mobile phones to serve as signal receivers and hazard alarming devices by using mobile applications. Even though they may suffer from low accuracy in long-distance and line-of-sight issues (blocked signals can be degraded), deploying multiple BLE beacons somehow can address these issues. In particular, they can be quickly installed and relocated only by attaching and detaching them at the site, allowing flexible deployment when considering dynamic hazardous site conditions.
However, from a practical point of view, how to deploy the beacon sensors is still challenging. In general, two different strategies for beacon deployment have been widely used: (1) point-based (deploying at specific places) and (2) grid-based (deploying to cover the entire space) beacon deployment. For hazard alarm systems, point-based deployment would be preferred, as the alarm system aims to give an alarm to workers who are exposed to hazardous areas or objects, and it can also save the costs and efforts of buying and managing multiple beacons. However, point-based deployment may need to compromise the reliability of safety alarms due to the limited coverage and vulnerability to blockage of BLE beacons. In this regard, understanding how beacon-based alarms can be affected by various site conditions would be essential for more cost-effective beacon deployment for hazard alarm systems.
3. Beacon-Based Hazard Alarm System Design
In this section, the three aspects of the beacon sensor-based alarm system developed for this study are explained: (1) the design rationale, (2) the structure of the system, and (3) the details of the system components.
3.1. Design Rationale
The system is designed to connect workers with the work environment through an IoT sensor system facilitated by beacon sensors, cloud platforms, and mobile devices.
Figure 1 depicts the conceptual design of the proposed mobile communication system.
A few types of data can be extracted from beacon sensors, including the temperature, distance, position, and acceleration, depending on the beacons used. This research used proximity data produced by LTE beacon sensors manufactured by the Estimote Inc. Based on the proximity data collected by the sensor, an alarm process is activated when the distance between the hazard source and the user is closer than the pre-set threshold. To achieve this, one beacon sensor that can broadcast BLE signals can be arranged at a suitable location for the hazard source. If the hazard source itself is an object with a large volume or covering a large area, such as large-sized mobile equipment, multiple beacon sensors can be deployed.
Once a proximity case is detected, the system activates an alarm process to ensure that the user perceives the hazard existing in the surrounding environment. There can be several ways to communicate the hazard information to the end user, including visual cues, auditory cues, and tactile cues. This research uses a mobile phone as the end user device to support the availability of all three types of cues with a single device. When the distance between the user and a hazard source is closer than the threshold, the mobile phone can sound an alarm, vibrate, and show a notification on the screen. The end user system interface can ensure that workers do not ignore the alarm by requiring a confirmation of reception of the hazard alarm.
To achieve this design concept, three specific objectives were developed: (1) design an IoT application for the LTE beacon sensor to receive the Bluetooth Low Energy signal (so-called “BLE package”) from other beacons and parse the BLE package; (2) build a connection between the LTE beacon sensor and a personal mobile phone using APIs, Estimote Cloud, and Google Firebase Cloud Messaging platforms; and (3) develop a mobile phone application for the mobile phone to receive an alarm message through the Google messaging service and produce the visual, auditory, and tactile cues, as explained above. The next section explains each of the structural elements of the system.
3.2. Structure of the System
Figure 2 depicts the structure of the system. The system includes components to sense and generate data in the backend, transmit data to the frontend (a phone application) by server platforms, and send the hazard alarm to the affected workers. The details of the system are expounded below in this order.
3.2.1. Sensing and Data Generation (Backend)
The primary function of the BLE beacon is to keep broadcasting Bluetooth packages in the form of BLE signals to the surrounding environment. This research used an LTE beacon manufactured by Estimote Inc. for the beacon signal generating component. A BLE package can contain several different types of data, depending on the type of the beacon sensor, and the origin of data is identifiable, as each beacon sensor has a unique ID number [
51].
The second part of generating proximity data is to transmit the BLE package. A BLE package is a type of Bluetooth signal which beacon signal-reading devices can receive. While the beacon sensor device continuously sends out Bluetooth packets, a corresponding receiving device can receive Bluetooth signals within a certain range. This means that in the proposed system design, two LTE beacon sensors are used: one as the BLE signal-generating unit and the other as the BLE signal-receiving unit. The distance between a beacon and a receiving device varies from 7 m to 200 m, depending on the different types of Estimote Bluetooth equipment [
52]. The Bluetooth Special Interest Group (SIG)‘s research [
53] found that the factors that influence the transmission distance include the radio spectrum, physical layer, receiver sensitivity, transmit power, antenna gain, and path loss.
The third part of data generation is to parse the Bluetooth package. Another LTE beacon sensor works as a BLE signal receiver and collects BLE packages when the sensor is located within the Bluetooth signal distance range. In this way, the LTE beacon sensor can generate proximity data as the person who holds the sensor gets close to the location of the beacon signal’s origin, which is the location of a hazard in the context of this application. Another IoT application needs to be installed in the receiver device to extract the data within the package. The IoT application receives, parses, and analyzes the Bluetooth signals, translating the Bluetooth packages into data transmitted across the internet by mobile data. In this manner, the Bluetooth signal-receiving device works as a micro-Bluetooth signal processor. In addition to data transmission, the application also synchronizes the processed data with the server platform to trigger the hazard alarm process.
3.2.2. Server Platform
Two server platforms were used and integrated into this system; one was Estimote Cloud, an Integrated Development Environment (IDE) provided by Estimote Inc. New York, US, and the other was Firebase Cloud Messaging (FCM), provided by Google. Using APIs provided by Estimote Cloud, a web application was developed to process the data from the beacon receiver device. This application analyzed the identifier and the Bluetooth energy power data, defined a threshold for triggering the alarm system, and sent the alarm notification to FCM. Then, the FCM platform worked as a mobile phone notification hub; it received messages from Estimote Cloud and sent them to an Android mobile application.
3.2.3. Frontend
The frontend of the system is an Android application. The Android application integrates the FCM notification service into an Android application and allows a mobile phone to receive a notification. Once the alarm message is transmitted and received by the target mobile phone, the application makes an auditory alarm sound, and the message contained within the alarm data shows up on the screen to warn the user to recognize the hazard and take measures to mitigate the risks. The application keeps producing the alarm sound until the user responds to the alarm message and confirms the reception of the alarm message.
3.3. Detailed Design of the Components
3.3.1. Beacon-Based Distance Monitoring
A set of parameters is integrated into a BLE package. The Received Signal Strength Indicator (
RSSI) value, measured power value, type, and name are the four types of data used in the alarm system. An
RSSI value is a value to represent the distance from one Bluetooth point to another Bluetooth point based on the Bluetooth propagation energy loss model [
54]. It is generally expressed as
where
is a Gaussian distribution random variable, usually taken as zero in calculations, and
is the space obstacle attenuation factor. Generally, the more factors that hinder Bluetooth transmission in the environment, the larger its value.
A is defined as the average measured power value, meaning the
RSSI value obtained at a distance
(generally taken as 1 m). Subsequently, the distance estimation model is written as
The type and name information in the Bluetooth data package are used to identify the beacon signal source. A construction site is a complicated environment with multiple hazards located in the same workspace, and therefore, it is likely that more than one BLE sensor is deployed at the same time. For that reason, the package type and name information are essential for the beacon signal receiver to identify the sources of particular beacon signals. Similarly, a unique package name is the identifier of a specific hazard, for which separate safety measures may be required for effective risk mitigation.
Algorithm 1 [
55] shows the computational process through which a distance between the beacon sensors is calculated based on the RSSI value. In this system, the receiver application first checks the received package type and the identifier to choose the proper BLE package. The threshold for triggering the alarm system is set to be 3 m, and the receiver’s responding range is set to be 5 m. This means the receiver sensor starts to send data to the cloud when the estimated distance is equal to or less than 5 m and sends an alarm trigger when the estimated distance is equal to or less than 3 m. Parameters n and A are related to the environment as mentioned, obtained, and calibrated from the experimental measurements. To minimize the fluctuation of the distance estimation results caused by surrounding obstacles and interference electromagnetic waves, this algorithm utilizes 1 average value based on every 10 readings.
| Algorithm 1 LTE beacon sensor distance algorithm [55] |
| | RSSI (): RSSI value in package () |
| | Type (): the type of package () |
| | ID (): Identifier of Package() |
| | MP (): measured power of package () |
| Input: Package (), Beacon_ID, |
| Output: Average Distance
|
| 1 | function Dist () |
| 2 | Dist () = 10 ^ ((RSSI (i)- MP (i))/(−10n)) |
| 3 | end function |
| 4 | Scan BLE Package |
| 5 | if Type(i) == ‘est_lot’ then |
| 6 | if ID(i) == Beacon_ID then |
| 7 | if Package (10) == Ture then |
| 8 | = Dist(i) |
| 9 | = Dist(i + 1) |
| 10 | = Dist(i + 2) |
| 11 | … |
| 12 | = Dist(i + 8) |
| 13 | = Dist(i + 9) |
| 14 | Average Distance = ( + + + … + + )/10 |
| 15 | end |
| 16 | end |
| 17 | end |
3.3.2. Cloud Computing-Based Alarm System
In the FCM platform, a project named “SendTopicTest” was created. The project is a pivotal online file providing a connection channel between Estimote Cloud and the Android mobile application, and it activates the cloud messaging function. The project generates a unique project ID and project number for Estimote Cloud and the Android application to connect them to the project. FCM also provides a credential key number for Estimote Cloud to adopt the cloud messaging service. A topic is necessary for broadcasting messages to multiple Android applications within an FCM project. For this research, a topic called “notification” was created to receive the messages from Estimote Cloud and transfer it to the listed mobile applications.
In Estimote Cloud, another IoT application was designed to create a notification and send it to the FCM topic based on the data received from the LTE beacon. As shown in
Figure 3, the system uses the “Post” method to create both the data and notification within FCM and send them to the mobile applications. The two fields within the data correspond to the district and the identification number of the beacon sensor to locate the hazard source. The notification is the words shown on the screen of the Android application, and the title and body text of the notification instruct the user about the hazard and the appropriate actions to be taken to mitigate the safety risks.
3.3.3. Android Application
The Android application is designed to receive the notification and data from FCM and warn the user by auditory signals and a notification message. The application includes an FCM configuration and dependencies to enable the FCM platform to work with the application for this function. The mobile application is connected with the FCM platform by subscribing to the topic explained above, which allows a mobile phone to receive what Estimote Cloud has sent to the FCM platform.
When a hazard alarm message arrives, the application produces an auditory alarm and a message that can contain information about the type of hazard and how to mitigate the risk.
Figure 4 shows the user interface and the screen when a notification arrives on a mobile phone. When the user opens the application, it is automatically subscribed to the FCM topic, which means that it is ready to get notifications and data from the FCM platform, and the system is activated, as shown in
Figure 4. During the operation of the application, when the receiver beacon sensor gets close enough to the sender beacon sensor located near a hazard, the mobile phone keeps receiving notifications and sounding alarms, as shown in
Figure 4a. The alarm system continuously sends the alarm notifications until the user pushes the “understood” button (
Figure 4b), making the application unsubscribe from the particular topic.
4. Field Experiment
4.1. Experiment Design Concept
As the next step, a field experiment was conducted to investigate the impact of different deployments of the beacon signal sending devices on the hazard notification reception on the user’s mobile phone. The question to be addressed by this experiment was the following: “What should be the locations of the Bluetooth sensors for the workers to receive individualized hazard notifications most effectively?” In this question, the word “effectively” is combinatory of several conditions the system would need to satisfy, such as the timing and range of alarm notifications.
Depending on the type of hazards, the timing of the notification’s reception can be critical for worker safety. If exposure to the hazard instantly poses a great threat to the worker’s health and safety, such as live electrical wires, it would be ideal for the worker to recognize the hazard before entering or nearing the workspace. On the other hand, some hazards, such as dust and ergonomic hazards, are dangerous only when exposed to the hazard for a while. In this case, it may not be a significant problem if the hazard notification is received shortly after the worker enters the workspace. In addition, some hazards, such as a poisonous chemical spill or gaseous hazardous materials, can affect workers over a wide area, and therefore, every worker in the affected area needs to be notified of the hazard. On the other hand, some hazards are exposed to the worker only when the worker contacts an object or the structure, such as collisions or falling. In this case, only the workers carrying out a task near the hazardous object or work environment need to be notified of the hazard.
When a sensor-based hazard alarm system is designed, alarm fatigue also needs to be seriously considered. Alarm fatigue has been identified as a major issue in many sensor-based danger alarm systems in construction and other industries, such as health care [
56,
57]. If a worker keeps receiving alarm notifications that are not relevant to their task or workspace, redundant, or repetitive, it is likely that they will ignore the alarms or even disable the alarm device. Therefore, how widely the hazard alarm notifications should be sent is not a trivial issue when designing a location-based hazard alarm system.
This research took an experimental approach to address these questions related to the beacon sensor deployment problem in the context of a hazard alarm system. A beacon signal-sending device was put at 4 different locations within a construction workspace (e.g., an unfinished room under construction). Each of these 4 different locations represented (1) at the entrance of the room, (2) behind the front side wall, (3) on the internal wall facing the access point, and (4) on the internal wall not facing the access point. Then, many trials of approaching the workspace on various paths were performed, and the location where the user received the first hazard alarm notification was marked in each trial. Then, all the locations of the first hazard alarm notification from all trials were visualized as a heat map, which could provide insights into how the beacon sensors would need to be deployed for the system to notify of hazards most effectively while avoiding alarm fatigue in construction workers.
4.2. Experiment Setting
An education building project that was under construction, located in Xi’an, China, was selected for this experiment. The total construction area of the project was 77,535.52 m
2, including a 3-story basement, a 25-story building, and a 12-story building. The experiment was conducted on a floor of this building for which the structure construction was just completed, but the finishing work did not begin yet. Specifically, a semi-enclosed room with two concrete walls and two open access points on the second floor of the building was selected as the experiment site. The simulated scenario was that the room had a particular hazard that required notifying all the affected workers.
Figure 5 shows the floor plan where the experiment took place and the 5 paths followed by the experimenter to approach the workspace.
Since the alarm system’s operation is based on the relation between the RSSI value and distance, the parameters included in Equation (1) needed to be calibrated based on initial measurements collected in the same environment. For this purpose, a preliminary test was conducted for a known distance at the experiment site, and the parameters in the RSSI equation were determined. The hazard alarming distance was set to be 5 m, which means the alarm system would be triggered when the distance between the beacon receiver and sender sensors calculated based on the RSSI value was less than 5 m.
4.3. Procedure
Beacon sensors were placed at 4 different locations—at the entrance of the room and 3 corners of the room—as marked with small, numbered circles in
Figure 5. With the beacon sensor located at 1 of the 4 locations in the room, the user approached the room with one beacon receiver and the mobile phone equipped with the hazard alarm application starting from 5 different positions in the wider area of the floor, as marked with larger, numbered circles in
Figure 5. The lines with an arrow in
Figure 5 show the directions of the routes. To mark the locations on the building floor, a 2D coordination system was established. For each route, the experimenter moved toward the room at a regular walking speed and recorded the point at which the hazard alarm was received for the first time. This trial was repeated 20 times for each route. If the hazard alarm was not received until reaching the entrance of the room, the result was recorded as (0,0).
5. Results
The collected data (i.e., locations where the experimenter received the first alarm notification, expressed as x and y coordinates) were then visualized in heat map-style 2D graphs. In this process, a data analysis and graphing software program, Origin, was utilized, and specifically, a 2D kernel density algorithm in this software was used to create the heat map graphs, as shown in
Figure 6. This algorithm uses existing data points to estimate the possibility of unknown data points falling in a certain local position. In this type of graph, a higher density value means that the statistical probability of the function (in the context of this research, the alarm notification) occurring at that location is higher. As the experiment site was modeled as a 2D plane with XY grids, the 2D kernel density results could be integrated with the site map, showing the distribution of the locations where the first alarm notification was received in each trial.
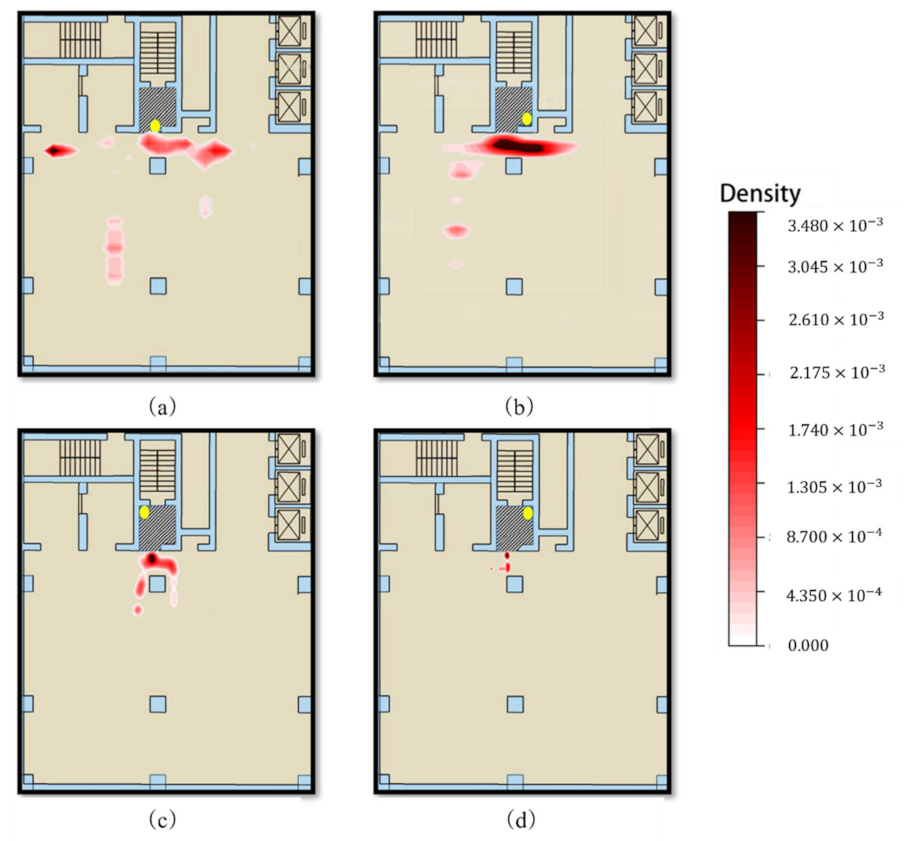
Figure 6 shows the heat map of the locations where the user received a hazard alarm notification on the mobile phone for the first time in each of the four sensor deployment cases. The denser the notification locations, the darker the color on the heat map. When the beacon signal-sending sensor was placed at the entrance of the room, the results show that the notifications were received many footsteps before, as shown in
Figure 6a. The longest distance between the beacon sensor and the notification point was approximately 10 m. Therefore, the area of the notification points was the widest in this setting. Additionally, the rate of successful alarm notification (meaning that the user received the notification before the user arrived at the entrance of the room) was 89%.
When the beacon sensor was placed behind the front side wall close to the entrance, the notifications were received mostly when the user was near the entrance, as shown in
Figure 6b. The rate of successful alarm notification was 68% in this case.
Figure 6c,d shows that the rate of successful alarm notification decreased dramatically when the beacon sensor was placed on the back side wall, meaning that many times, the user did not receive a hazard alarm notification until arriving at the entrance of the workspace. The rate of successful alarm notification was only 48% and 19% when the beacon sensor was located at positions 3 and 4, respectively. In these cases, the hazard alarm notifications were received only when the user arrived at the entrance of the room or even after the user entered the room, except for a few alarm notifications received early enough when the user approached by following walking route 5, in which there was no obstacle in the straight line between the user and the sensor.
Table 1 summarizes the rate of successful alarm notification and the longest distance at which the hazard alarm notification arrived for each of the four sensor deployment cases.
6. Discussion
The results of this research help clarify both the feasibility and potential issues of using a beacon sensor-based hazard alarm notification system at construction sites. The experiment results show that, depending on the sensor deployment setting, the user can receive a hazard alarm notification on time, meaning a worker would receive the hazard information just before arriving at the workspace with the hazard in it. As the hazard alarm system requires the user’s response, construction managers can confirm that the hazard information has been transferred to the affected workers. In that sense, this method of hazard information communication is not only helpful for enhancing workers’ hazard recognition and risk perception but the record keeping of the fulfillment of the construction manager’s duty of care regarding site hazard information communication. Such on-time, on-the-spot hazard information notification can be effective and supplementary to conventional hazard information communication methods such as signage, toolbox meetings, and site induction and help increase the workers’ situation awareness regarding all the hazards they might miss otherwise.
The results also show that careful planning would be strongly required regarding beacon sensor deployment. Depending on the beacon sensor’s location, many workers can receive redundant, irrelevant hazard alarm notifications, which will unavoidably create alarm fatigue, or workers might not receive any hazard notifications until they enter the workspace and start to be exposed to the hazard. The heat maps shown in
Figure 5 might look like they suggest the best location for beacon sensors for hazard alarms to be behind the front side wall near the entrance, but it all depends on the type of hazard to the workers are notified about. If the hazard can expose workers in a wide area to a threat, such as a gaseous poisonous chemical, the hazard notification and risk mitigation method information, such as wearing respirators, needs to be broadcast to the widely affected area. Therefore, in this case, placing the beacon sensor near the entrance would be most appropriate. On the other hand, if the hazard exposes a worker to a threat only when he or she contacts an object or a structure, placing the sensors on one of the internal walls of the workspace would be more suitable, as this would prevent sending hazard notifications to workers unrelated to the hazard, such as those workers just passing by the room.
In addition, understanding the relationship among the type of hazard, the location of the on-site beacon sensor, and the location of the hazard notifications with sensor configurations would help develop a sensor deployment planner system and enhance the personalized notification of hazards for construction workers. A sensor deployment planner system would assist construction managers in deciding the best location of each beacon sensor according to hazard type and location by visualizing the first alarm location on the site before the actual installation of the sensors and even recommending the optimized location of sensors to construction managers. Such a system would reduce workers’ fatigue by receiving unnecessary alarms by the sensors without compromising the effect of the beacon sensor-based hazard alarm system.
Last but not least, this type of sensor- and IoT network-based hazard notification system should be planned with consideration of the failure modes that can be caused by malfunction or disconnection of the communication network involved. The proposed BLE-based system relies on existing communication network services and several cloud computing platforms, including the LTE network, Estimote Cloud, and Google Firebase Cloud. The LTE network is known to have good indoor data rates, indoor penetration, and SMS services. In addition, the communication between the two cloud systems uses HTTP and MQTT protocols, and these protocols have high reliability in data transmission. However, if any of these system components has a breakdown or delays in response, it can disrupt the entire hazard alarm system, creating a great risk for those workers relying on the system. Therefore, the planning of this type of sensor-based hazard alarm system would need to be complemented with a secondary hazard notification system, and it also should have a built-in self-monitoring mechanism so that the workers do not rely on the hazard alarm system when it is not functioning properly. Similar points have been put forward by other researchers. As a BLE-based safety monitoring system has several limitations, the integration of BLE with other sensor technologies, such as BIM, RFID, and GPS, can improve the effectiveness of safety monitoring systems in the construction sector [
58].
7. Conclusions
An experimental study was conducted to address the knowledge gaps regarding the impact of the beacon sensor locations on the effectiveness of beacon-based hazard alarm systems in construction sites. In the experiment, the locations where the experimenter received the first hazard alarm were recorded in repetitive trials while the beacon sensor was located in four different locations, such as (1) at the entrance of the room, (2) behind the front side wall, (3) on the internal wall facing the access point, and (4) on the internal wall not facing the access point, in a partially enclosed room in a concrete building. The results show that the hazard alarm function of the system could be severely affected by the beacon sensor’s location in such a context and implies that the locations of the beacon sensors should be decided carefully based on the type of hazard to be warned of and the workers targeted to receive the alarms. Furthermore, the findings imply that the distance of the hazard alarm signal deliveries can be controlled by deciding the most appropriate location for the beacon sensors in construction work environments. For example, beacon sensors can be located behind walls to limit the area of interest for sending the alarms, and beacon sensors can be located near the access point to the workspace to send the hazard alarms to all workers in the wider area. These findings provide practical insights into how beacon sensors can be deployed for the best performance of hazard alarm systems.
This research has several limitations that need to be considered in future research. As the RSSI value-based distance measure can be influenced by several environmental factors, such as the temperature, humidity, and obstacles that can block the sensor signals, the experiment would need to be repeated under different environmental conditions, such as different times of the year, different climates, and different structural materials, for a more comprehensive understanding of how beacon-based hazard alarm systems can work most effectively to send targeted hazard alarm notifications. Additionally, future research can investigate the sensor deployment problem in the context of multiple beacon sensors used simultaneously to localize construction workers for better accuracy of hazard alarming. Such location tracking-based hazard alarm systems can have advantages over single-sensor-based and proximity-based sensor systems in producing hazard alarm notifications with lower error rates, but sensor deployment plans cannot be as dynamic, flexible, or cost-effective as single-proximity sensor-based systems. Hence, the benefits and limitations of different sensor-based hazard alarm systems need to be investigated with further experimental research efforts, and more experimental studies would be required to compare the performance of different system designs while considering the practicality and user experience perspectives.
Author Contributions
Conceptualization, S.A., J.S. and T.W.K.; methodology, S.A., J.S. and T.W.K.; software, F.K.; validation, F.K. and Y.H.; formal analysis, F.K.; investigation, F.K.; resources, S.A. and Y.H.; data curation, F.K.; writing—original draft preparation, F.K. and S.A.; writing—review and editing, S.A., J.S. and T.W.K.; visualization, F.K.; supervision, S.A. and Y.H.; project administration, S.A.; funding acquisition, S.A. All authors have read and agreed to the published version of the manuscript.
Funding
This work was supported by the Hongik University new faculty research support fund.
Institutional Review Board Statement
Not applicable.
Informed Consent Statement
Not applicable.
Data Availability Statement
Conflicts of Interest
The authors declare no conflict of interest.
References
- Hierarchy of Controls. Available online: Https://Www.Cdc.Gov/Niosh/Topics/Hierarchy/ (accessed on 22 June 2021).
- Rodríguez-Garzón, I.; Lucas-Ruiz, V.; Martínez-Fiestas, M.; Delgado-Padial, A. Association Between Perceived Risk and Training in the Construction Industry. J. Constr. Eng. Manag. 2015, 141, 4014095. [Google Scholar] [CrossRef]
- Jeschke, K.C.; Kines, P.; Rasmussen, L.; Andersen, L.P.S.; Dyreborg, J.; Ajslev, J.; Kabel, A.; Jensen, E.; Andersen, L.L. Process Evaluation of a Toolbox-Training Program for Construction Foremen in Denmark. Saf. Sci. 2017, 94, 152–160. [Google Scholar] [CrossRef]
- Man, S.S.; Chan, A.H.S.; Alabdulkarim, S.; Zhang, T. The Effect Of Personal and Organizational Factors on the Risk-Taking Behavior of Hong Kong Construction Workers. Saf. Sci. 2021, 136, 105155. [Google Scholar] [CrossRef]
- Teizer, J.; Allread, B.S.; Fullerton, C.E.; Hinze, J. Autonomous Pro-Active Real-Time Construction Worker and Equipment Operator Proximity Safety Alert System. Autom. Constr. 2010, 19, 630–640. [Google Scholar] [CrossRef]
- Kanan, R.; Elhassan, O.; Bensalem, R. An Iot-Based Autonomous System for Workers’ Safety in Construction Sites with Real-Time Alarming, Monitoring, and Positioning Strategies. Autom. Constr. 2018, 88, 73–86. [Google Scholar] [CrossRef]
- Park, J.; Kim, K.; Cho, Y.K. Framework of Automated Construction-Safety Monitoring Using Cloud-Enabled Bim and Ble Mobile Tracking Sensors. J. Constr. Eng. Manag. 2017, 143. [Google Scholar] [CrossRef]
- Park, J.; Yang, X.; Cho, Y.K.; Seo, J. Improving Dynamic Proximity Sensing and Processing for Smart Work-Zone Safety. Autom. Constr. 2017, 84, 111–120. [Google Scholar] [CrossRef]
- Baek, J.; Choi, Y. Bluetooth-Beacon-Based Underground Proximity Warning System for Preventing Collisions Inside Tunnels. Appl. Sci. 2018, 8, 2271. [Google Scholar] [CrossRef] [Green Version]
- Gómez-De-Gabriel, J.M.; Fernández-Madrigal, J.A.; López-Arquillos, A.; Rubio-Romero, J.C. Monitoring Harness Use in Construction with Ble Beacons. Measurement 2019, 131, 329–340. [Google Scholar] [CrossRef]
- Chan, K.; Louis, J.; Albert, A. Incorporating Worker Awareness in the Generation of Hazard Proximity Warnings. Sensors 2020, 20, 806. [Google Scholar] [CrossRef] [PubMed] [Green Version]
- Yan, X.; Li, H.; Li, A.R.; Zhang, H. Wearable Imu-Based Real-Time Motion Warning System for Construction Workers’ Musculoskeletal Disorders Prevention. Autom. Constr. 2017, 74, 2–11. [Google Scholar] [CrossRef]
- Antwi-Afari, M.F.; Li, H.; Wong, J.K.-W.; Oladinrin, O.T.; Ge, J.X.; Seo, J.; Wong, A.Y.L. Sensing And Warning-Based Technology Applications To Improve Occupational Health And Safety In The Construction Industry: A Literature Review. Eng. Constr. Archit. Manag. 2019, 26, 1534–1552. [Google Scholar] [CrossRef]
- Soltanmohammadlou, N.; Sadeghi, S.; Hon, C.K.H.; Mokhtarpour-Khanghah, F. Real-Time Locating Systems And Safety in Construction Sites: A Literature Review. Saf. Sci. 2019, 117, 229–242. [Google Scholar] [CrossRef]
- Asadzadeh, A.; Arashpour, M.; Li, H.; Ngo, T.; Bab-Hadiashar, A.; Rashidi, A. Sensor-Based Safety Management. Autom. Constr. 2020, 113, 103128. [Google Scholar] [CrossRef]
- Leith, D.J.; Farrell, S. Coronavirus Contact Tracing: Evaluating the Potential of Using Bluetooth Received Signal Strength for Proximity Detection. ACM SIGCOMM Comput. Commun. Rev. 2020, 50, 66–74. [Google Scholar] [CrossRef]
- Namian, M.; Albert, A.; Feng, J. Effect Of Distraction On Hazard Recognition And Safety Risk Perception. J. Constr. Eng. Manag. 2018, 144. [Google Scholar] [CrossRef]
- Hasanzadeh, S.; Esmaeili, B.; Dodd, M.D. Measuring The Impacts of Safety Knowledge on Construction Workers’ Attentional Allocation and Hazard Detection Using Remote Eye-Tracking Technology. J. Manag. Eng. 2017, 33, 4017024. [Google Scholar] [CrossRef] [Green Version]
- Fang, Y.; Cho, Y.K.; Durso, F.; Seo, J. Assessment of Operator’s Situation Awareness for Smart Operation of Mobile Cranes. Autom. Constr. 2018, 85, 65–75. [Google Scholar] [CrossRef]
- Xia, N.; Wang, X.; Griffin, M.A.; Wu, C.; Liu, B. Do We See How They Perceive Risk? An Integrated Analysis of Risk Perception and Its Effect on Workplace Safety Behavior. Accid. Anal. Prev. 2017, 106, 234–242. [Google Scholar] [CrossRef] [PubMed]
- Pandit, B.; Albert, A.; Patil, Y.; Al-Bayati, A.J. Impact of Safety Climate on Hazard Recognition and Safety Risk Perception. Saf. Sci. 2019, 113, 44–53. [Google Scholar] [CrossRef]
- Endsley, M.R. Design and Evaluation for Situation Awareness Enhancement. Proc. Hum. Factors Soc. Annu. Meet. 1988, 32, 97–101. [Google Scholar] [CrossRef]
- Endsley, M.R. Toward a Theory of Situation Awareness in Dynamic Systems. Hum. Factors: J. Hum. Factors Ergon. Soc. 1995, 37, 32–64. [Google Scholar] [CrossRef]
- Administration, N.A.S. Situation Awareness Information Requirements for Commercial Airline Pilots; CreateSpace Independent Publishing Platform: Scotts Valley, CA, USA, 2018. [Google Scholar]
- Furnham, A.; Furnham, A. Personality at Work: The Role of Individual Differences in the Workplace/Adrian Furnham; Routledge: London, UK, 1994. [Google Scholar]
- Rafferty, L.A.; Stanton, N.A.; Walker, G.H. Great Expectations: A Thematic Analysis of Situation Awareness in Fratricide. Saf. Sci. 2013, 56, 63–71. [Google Scholar] [CrossRef]
- Kim, S.; Lee, H.; Hwang, S.; Yi, J.-S.; Son, J. Construction Workers’ Awareness of Safety Information Depending on Physical and Mental Load. J. Asian Archit. Build. Eng. 2021, 1–11. [Google Scholar] [CrossRef]
- Yang, Y.; Chen, M.; Wu, C.; Easa, S.M.; Zheng, X. Structural Equation Modeling Of Drivers’ Situation Awareness Considering Road And Driver Factors. Front. Psychol. 2020, 11, 1601. [Google Scholar] [CrossRef] [PubMed]
- Salmon, P.M.; Lenne, M.G.; Walker, G.H.; Stanton, N.A.; Filtness, A. Exploring Schema-Driven Differences in Situation Awareness between Road Users: An On-Road Study of Driver, Cyclist and Motorcyclist Situation Awareness. Ergonomics 2014, 57, 191–209. [Google Scholar] [CrossRef] [PubMed]
- Oloufa, A.A.; Ikeda, M.; Oda, H. Situational Awareness of Construction Equipment Using Gps, Wireless and Web Technologies. Autom. Constr. 2003, 12, 737–748. [Google Scholar] [CrossRef]
- Mamessier, S.; Dreyer, D.; Oberhauser, M. Calibration of Online Situation Awareness Assessment Systems Using Virtual Reality. In Proceedings of the International Conference on Digital Human Modeling and Applications in Health, Safety, Ergonomics and Risk Management, Heraklion, Greece, 22–27 June 2014; pp. 124–135. [Google Scholar]
- Hasanzadeh, S.; Esmaeili, B.; Dodd, M.D. Examining the Relationship between Construction Workers’ Visual Attention and Situation Awareness under Fall and Tripping Hazard Conditions: Using Mobile Eye Tracking. J. Constr. Eng. Manag. 2018, 144. [Google Scholar] [CrossRef] [Green Version]
- Sherratt, F.; Farrell, P.; Noble, R. Uk Construction Site Safety: Discourses of Enforcement and Engagement. Constr. Manag. Econ. 2013, 31, 623–635. [Google Scholar] [CrossRef]
- Kines, P.; Andersen, L.P.S.; Spangenberg, S.; Mikkelsen, K.L.; Dyreborg, J.; Zohar, D. Improving Construction Site Safety through Leader-Based Verbal Safety Communication. J. Saf. Res. 2010, 41, 399–406. [Google Scholar] [CrossRef]
- Esmaeili, B.; Hallowell, M.R. Diffusion of Safety Innovations in the Construction Industry. J. Constr. Eng. Manag. 2017, 138, 955–963. [Google Scholar] [CrossRef]
- Hinze, J.; Hallowell, M.; Baud, K. Construction-Safety Best Practices and Relationships to Safety Performance. J. Constr. Eng. Manag. 2013, 139, 04013006. [Google Scholar] [CrossRef]
- Oregon OSHA’s Quick Guide to Safety Committees and Safety Meetings. Available online: Https://Www.Oregon.Gov/oda/Shared/Documents/Publications/NaturalResources/QuickGuidetoSafetyCommitteeandMeetings.pdf (accessed on 1 September 2021).
- The Center for Construction Research and Training. Handouts and Toolbox Talks. Available online: Http://Www.Cpwr.Com/Publications/Handouts-Toolbox-Talks (accessed on 5 September 2021).
- Pereira, E.; Ahn, S.; Han, S.; Abourizk, S. Finding Causal Paths between Safety Management System Factors and Accident Precursors. J. Manag. Eng. 2020, 36, 4019049. [Google Scholar] [CrossRef]
- Olson, R.; Varga, A.; Cannon, A.; Jones, J.; Gilbert-Jones, I.; Zoller, E. Toolbox Talks to Prevent Construction Fatalities: Empirical Development and Evaluation. Saf. Sci. 2016, 86, 122–131. [Google Scholar] [CrossRef]
- Sokas, R.K.; Nickels, L.; Rankin, K.; Gittleman, J.L.; Trahan, C. Trainer Evaluation of A Union-Based Ten-Hour Safety and Health Hazard-Awareness Program for U.S. Construction Workers. Int. J. Occup. Environ. Health 2007, 13, 56–63. [Google Scholar] [CrossRef] [PubMed]
- Bahn, S.; Barratt-Pugh, L. Evaluation of the Mandatory Construction Induction Training Program in Western Australia: Unanticipated Consequences. Eval. Program Plan. 2012, 35, 337–343. [Google Scholar] [CrossRef] [PubMed]
- Keng, T.C.; Razak, N.A. Case Studies on the Safety Management at Construction Site. J. Sustain. Sci. Manag. 2014, 9, 90–108. [Google Scholar]
- Bahn, S.; Barratt-Pugh, L. Safety Training Evaluation: The Case of Construction Induction Training and The Impact on Work-Related Injuries in the Western Australian Construction Sector. Int. J. Train. Res. 2014, 12, 148–157. [Google Scholar] [CrossRef]
- Perlman, A.; Sacks, R.; Barak, R. Hazard Recognition and Risk Perception in Construction. Saf. Sci. 2014, 64, 22–31. [Google Scholar] [CrossRef]
- Albert, A.; Hallowell, M.R.; Kleiner, B.M. Experimental Field Testing of a Real-Time Construction Hazard Identification and Transmission Technique. Constr. Manag. Econ. 2014, 32, 1000–1016. [Google Scholar] [CrossRef]
- Fu, H.J. Railway Automatic Safety Protection System Based on Gps. Matec Web Conf. 2016, 44, 1061. [Google Scholar] [CrossRef] [Green Version]
- Fang, Y.; Cho, Y.K.; Zhang, S.; Perez, E. Case Study of Bim and Cloud-Enabled Real-Time Rfid Indoor Localization for Construction Management Applications. J. Constr. Eng. Manag. 2016, 142, 5016003. [Google Scholar] [CrossRef]
- Giretti, A.; Carbonari, A.; Naticchia, B.; Degrassi, M. Design and First Development of an Automated Real-Time Safety Management System for Construction Sites. J. Civ. Eng. Manag. 2009, 15, 325–336. [Google Scholar] [CrossRef] [Green Version]
- Woo, S.; Jeong, S.; Mok, E.; Xia, L.; Choi, C.; Pyeon, M.; Heo, J. Application of Wifi-Based Indoor Positioning System for Labor Tracking at Construction Sites: A Case Study in Guangzhou Mtr. Autom. Constr. 2011, 20, 3–13. [Google Scholar] [CrossRef]
- Statler, S.; Audenaert, A.; Coombs, J.; Gordon, T.M.; Hendrix, P.; Kolodziej, K.; Leddy, P.; Parker, B.; Proietti, M.; Rotolo, R. Beacon Technologies: The Hitchhiker’s Guide to the Beacosystem; Apress L. P.: Berkeley, CA, USA, 2016. [Google Scholar]
- Compare Beacons. Available online: Https://Estimote.Com/Products/ (accessed on 8 July 2021).
- Understanding Bluetooth Range. Available online: Https://Www.Bluetooth.Com/Learn-About-Bluetooth/Key-Attributes/Range/ (accessed on 8 July 2021).
- Li, G.; Geng, E.; Ye, Z.; Xu, Y.; Lin, J.; Pang, Y. Indoor Positioning Algorithm Based on the Improved Rssi Distance Model. Sensors 2018, 18, 2820. [Google Scholar] [CrossRef] [PubMed] [Green Version]
- Huang, Y.; Fansheng, K.; Yifei, H. Applying Beacon Sensor Alarm System for Construction Worker Safety in Workplace. Iop Conf. Ser. Earth Environ. Sci. 2020, 608, 012036. [Google Scholar] [CrossRef]
- Sowan, A.K.; Reed, C.C. A Complex Phenomenon in Complex Adaptive Health Care Systems—Alarm Fatigue. Jama Pediatrics 2017, 171, 515–516. [Google Scholar] [CrossRef]
- Wilken, M.; Hüske-Kraus, D.; Klausen, A.; Koch, C.; Schlauch, W.; Röhrig, R. Alarm Fatigue: Causes and Effects. Stud. Health Technol. Inform. 2017, 243, 107–111. [Google Scholar]
- Rey-Merchán, M.D.; Gómez-de-Gabriel, J.M.; Fernández-Madrigal, J.-A.; López-Arquillos, A. Improving the prevention of fall from height on construction sites through the combination of technologies. Int. J. Occup. Saf. Ergon. 2020, 2020, 1–10. [Google Scholar] [CrossRef] [PubMed]
| Publisher’s Note: MDPI stays neutral with regard to jurisdictional claims in published maps and institutional affiliations. |
© 2021 by the authors. Licensee MDPI, Basel, Switzerland. This article is an open access article distributed under the terms and conditions of the Creative Commons Attribution (CC BY) license (https://creativecommons.org/licenses/by/4.0/).


