
Design and Validation of a Camera-Based Safety System for Fenceless Robotic Work Cells


Abstract
:1. Introduction
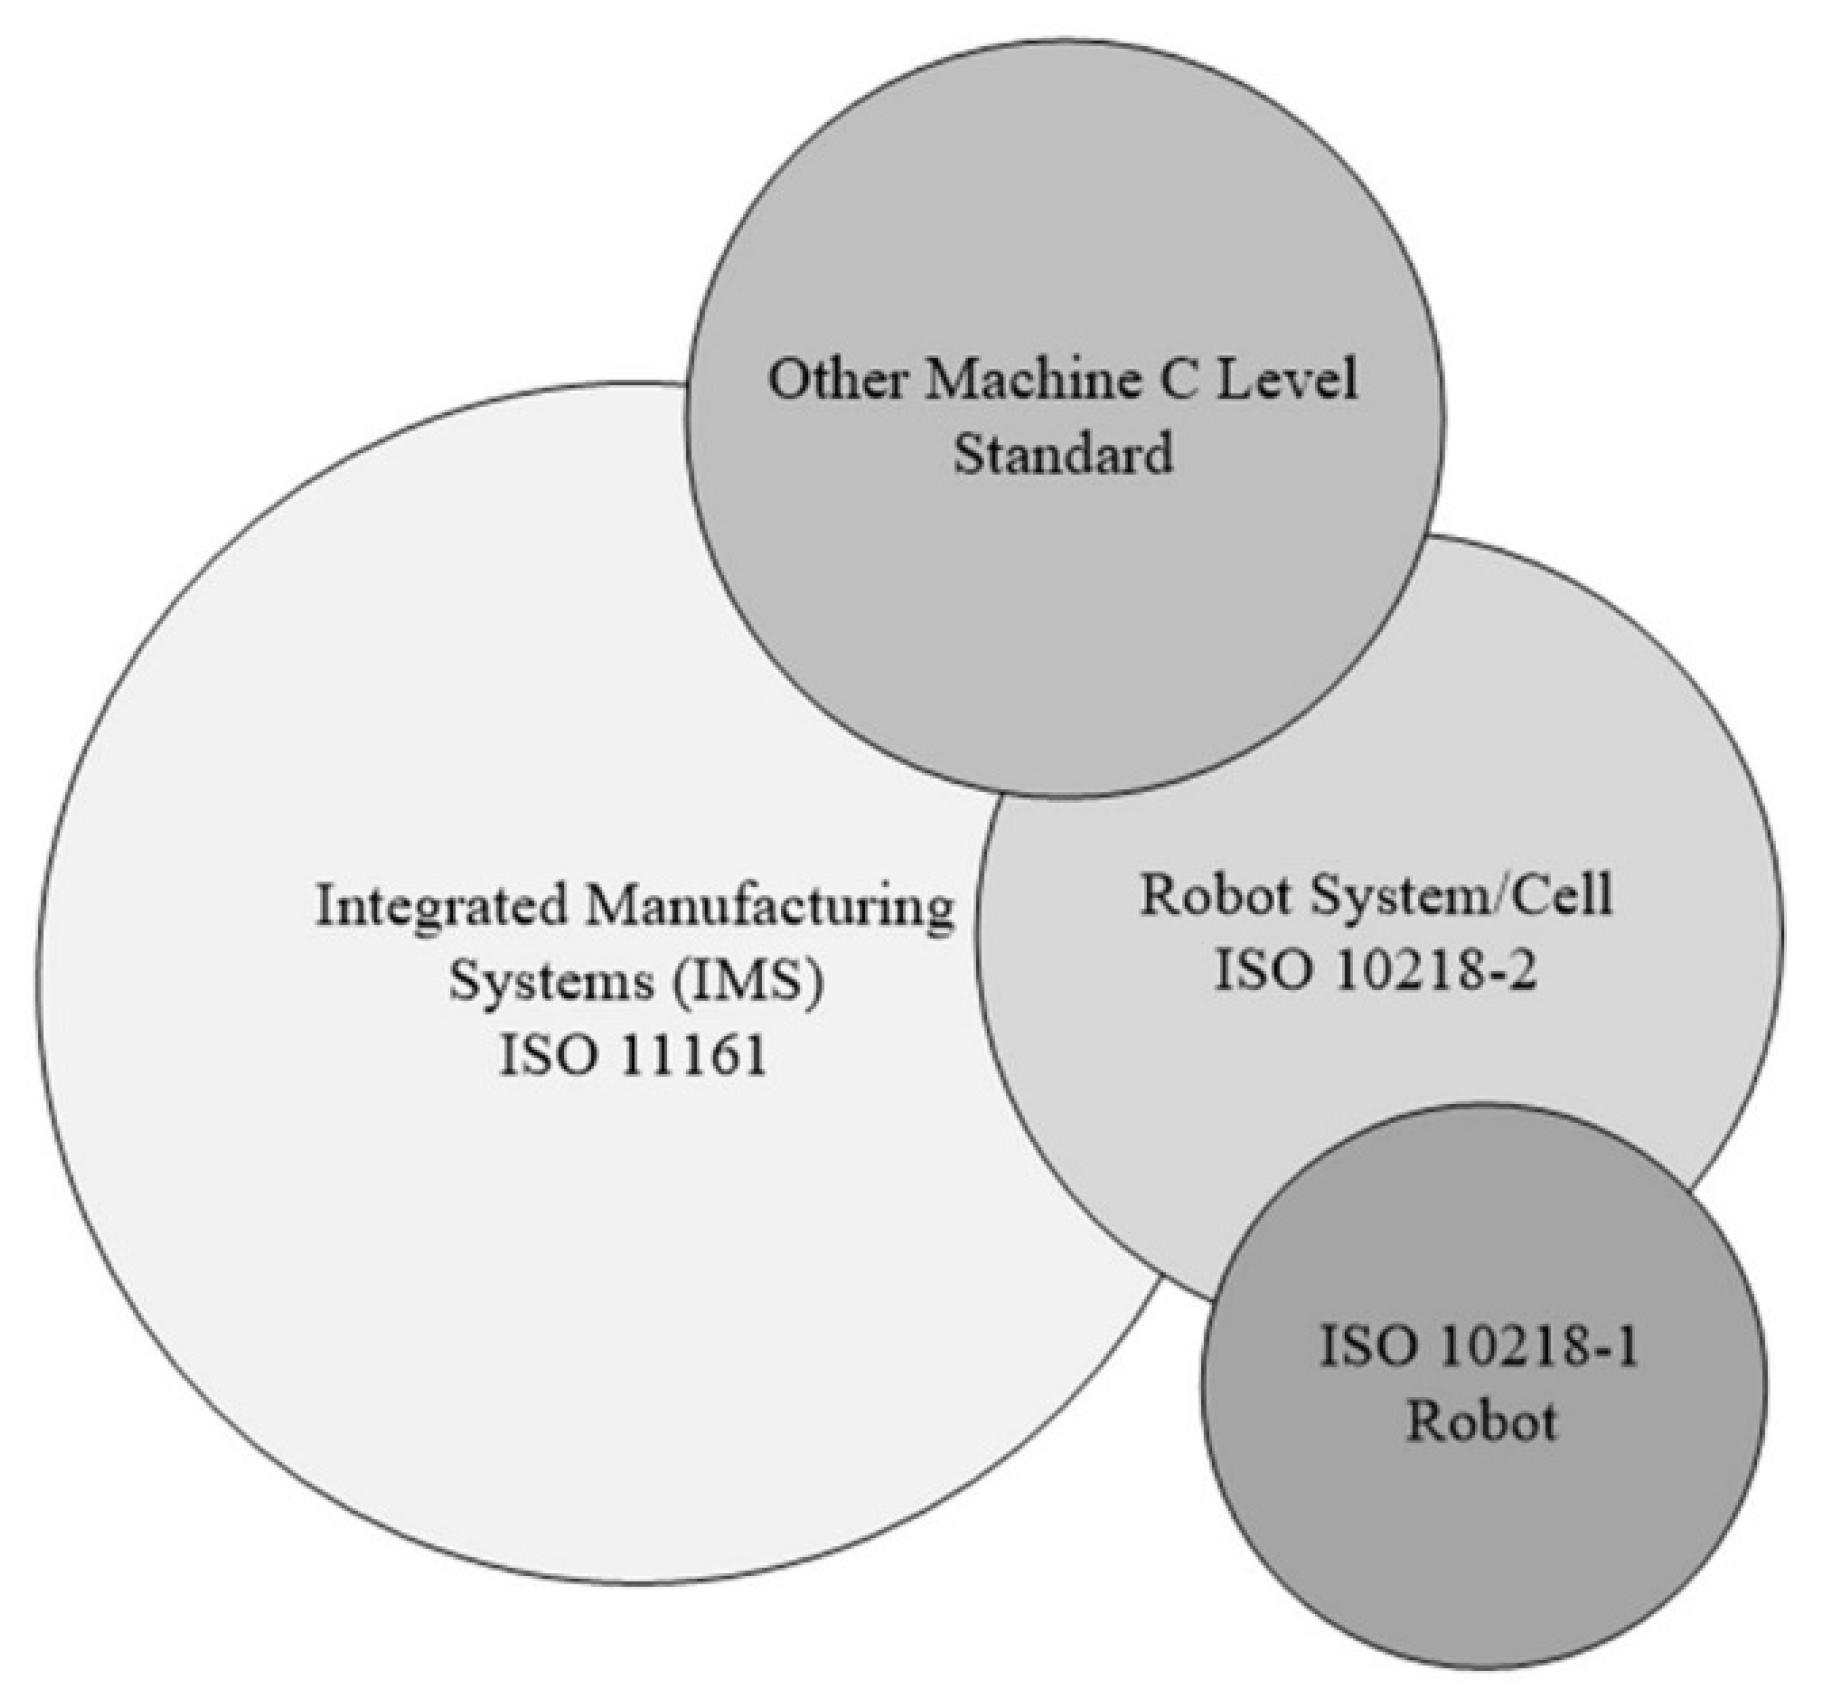
2. Background
3. Design of the Image-Based Safety System
3.1. Locating the Camera(s)
3.2. Combining Images from Multiple Cameras
3.3. Image Characterization of the Camera(s) at Optimal and Nonoptimal Locations
4. An Industrial Case Study and Experimental Verification
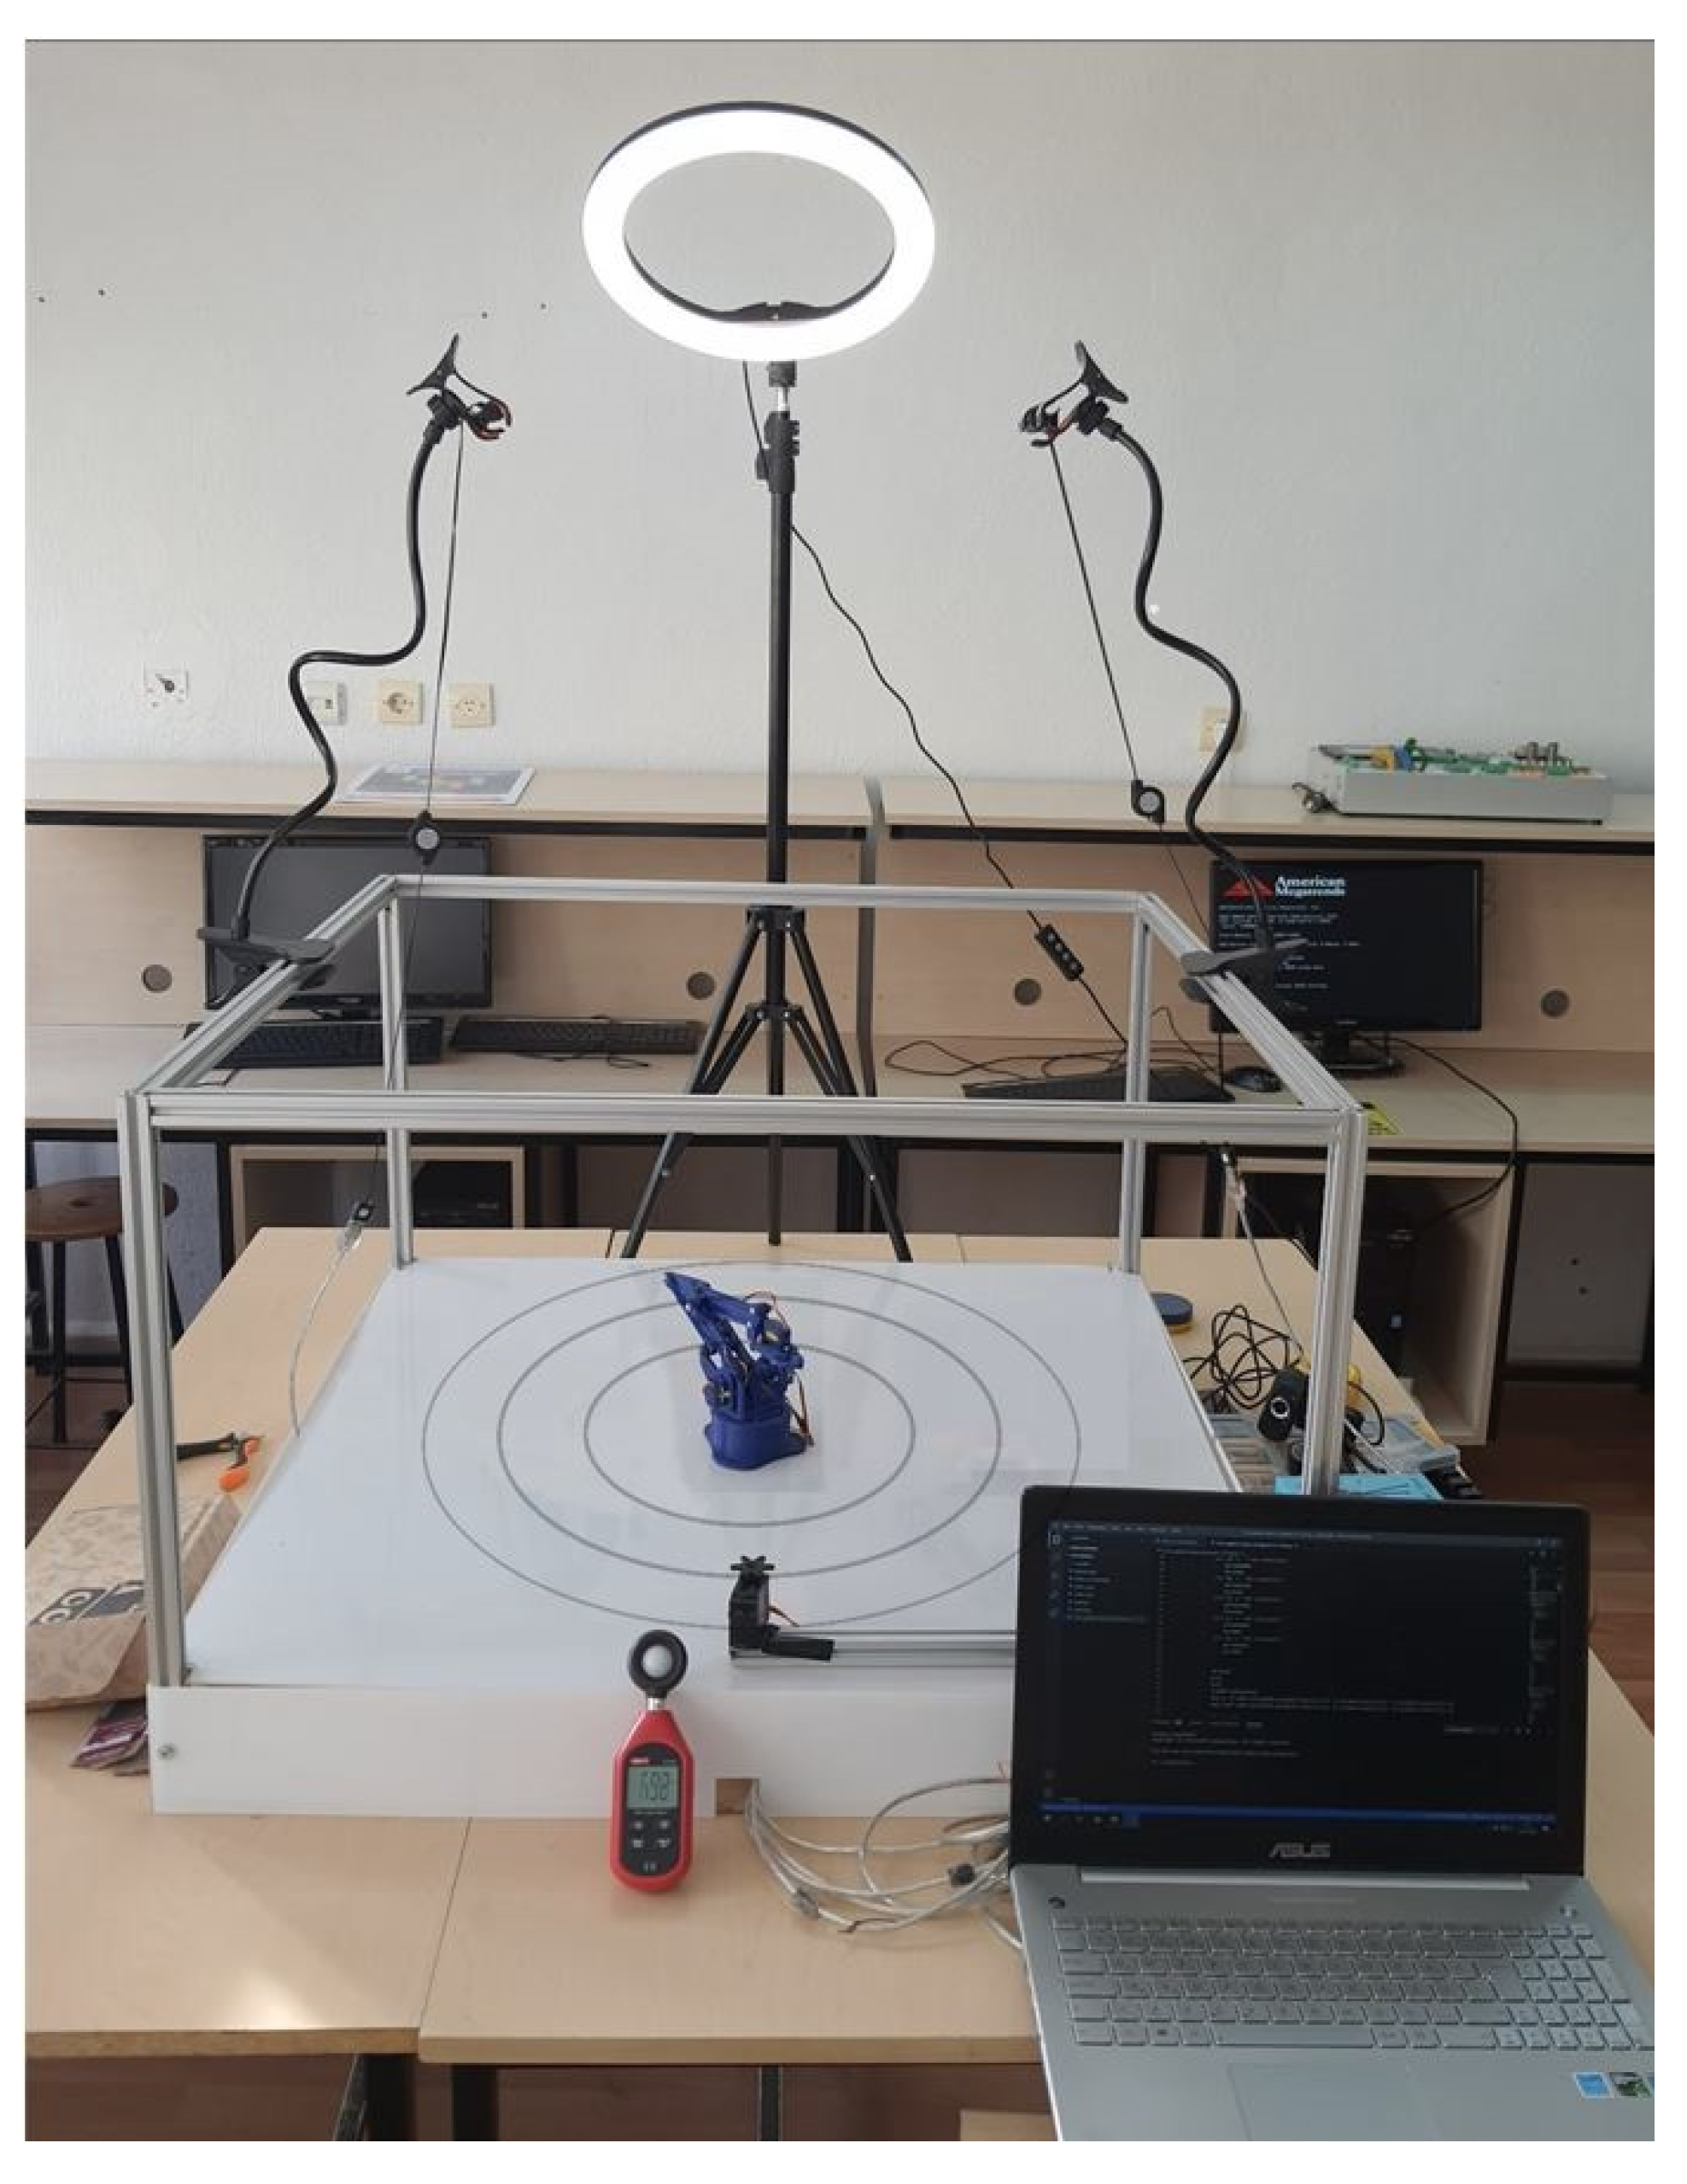
4.1. Design of the Experimental Setup
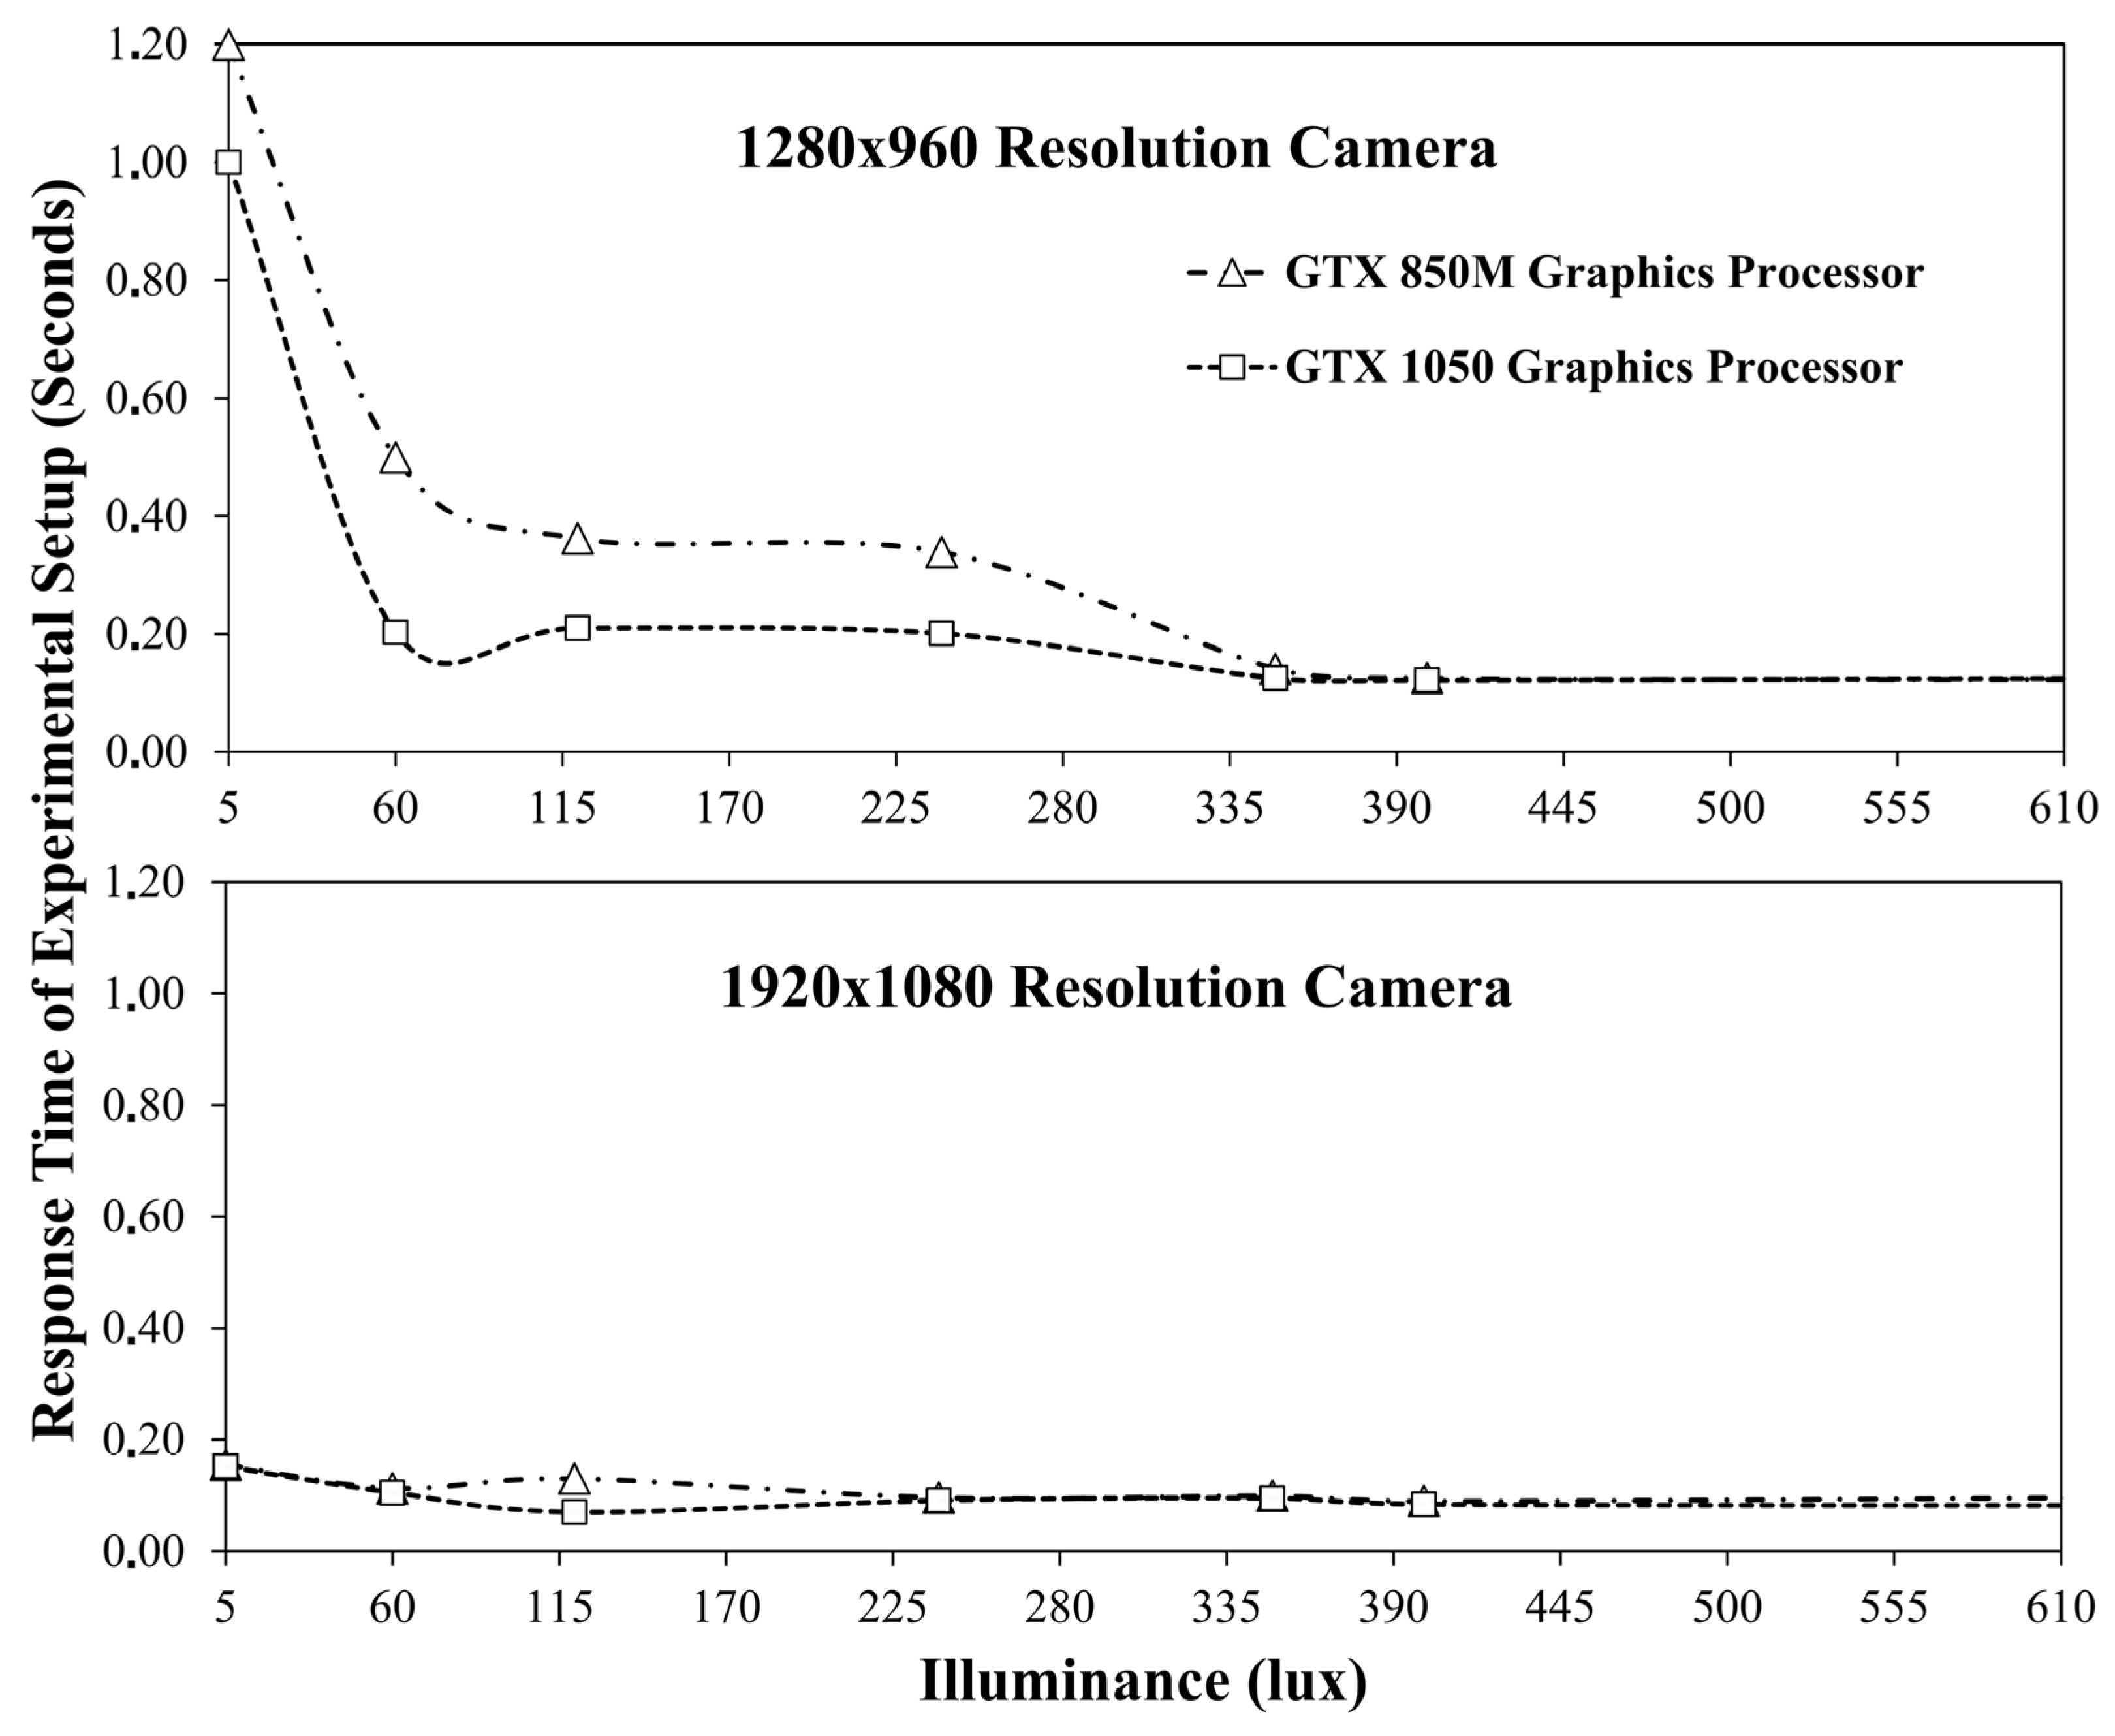
4.2. Test Results and Discussion
- Object size;
- Object brightness;
- Object geometry;
- Defective object corners;
- Camera resolution;
- The closeness of object and background colors to each other;
- Shadows on the object;
- Stray light reflections from the object.
5. Concluding Remarks
Author Contributions
Funding
Institutional Review Board Statement
Informed Consent Statement
Data Availability Statement
Acknowledgments
Conflicts of Interest
References
- Takata, S.; Hirano, T. Human and robot allocation method for hybrid assembly systems. CIRP Ann. 2011, 60, 9–12. [Google Scholar] [CrossRef]
- Koren, Y.; Heisel, U.; Jovane, F.; Moriwaki, T.; Pritschow, G.; Ulsoy, G.; Van Brussel, H. Reconfigurable manufacturing systems. CIRP Ann. 1999, 48, 527–540. [Google Scholar] [CrossRef]
- Krüger, J.; Lien, T.; Verl, A. Cooperation of human and machines in assembly lines. CIRP Ann. 2009, 58, 628–646. [Google Scholar] [CrossRef]
- Krüger, J.; Nickolay, B.; Heyer, P.; Seliger, G. Image based 3D Surveillance for flexible Man-Robot-Cooperation. CIRP Ann. 2005, 54, 19–22. [Google Scholar] [CrossRef]
- Weitschat, R.; Ehrensperger, J.; Maier, M.; Aschemann, H. Safe and efficient human-robot collaboration part I: Estimation of human arm motions. In Proceedings of the IEEE International Conference on Robotics and Automation, Brisbane, Australia, 21–25 May 2018. [Google Scholar]
- Gecks, T.; Henrich, D. Human-robot cooperation: Safe pick-and-place operations. In Proceedings of the Robot and Human Interactive Communication, IEEE International Workshop, Nashville, TN, USA, 13–15 August 2005. [Google Scholar]
- Bley, H.; Reinhart, G.; Seliger, G.; Bernardi, M.; Korne, T. Appropriate Human Involvement in Assembly and Disassembly. CIRP Ann. 2004, 53, 487–509. [Google Scholar] [CrossRef]
- ISO 10218-1: 2011: Robots and Robotic Devices-Safety Requirements for Industrial Robots-Part 1: Robots; ISO: Geneva, Switzerland, 2011.
- Oberer, S.; Schraft, R.D. Robot-dummy crash tests for robot safety assessment. In Proceedings of the Robotics and Automation, IEEE International Conference, Rome, Italy, 10–14 April 2007. [Google Scholar]
- Saenz, J.; Behrens, R.; Schulenburg, E.; Petersen, H.; Gibaru, O.; Neto, P.; Elkmann, N. Methods for considering safety in design of robotics applications featuring human-robot collaboration. Int. J. Adv. Manuf. Technol. 2020, 107, 2313–2331. [Google Scholar] [CrossRef]
- Tashtoush, T.; Garcia, L.; Landa, G.; Amor, F.; Nicolas, A.; Oliva, D.; Safar, F. Human-Robot Interaction and Collaboration (HRI-C) Utilizing Top-View RGB-D Camera System. Int. J. Adv. Comput. Sci. Appl. 2021, 12, 11–17. [Google Scholar] [CrossRef]
- Kaonain, T.E.; Rahman, M.A.A.; Ariff, M.H.M.; Yahya, W.J.; Mondal, K. Collaborative Robot Safety for Human-Robot Interaction in Domestic Simulated Environments. IOP Conf. Series: Mater. Sci. Eng. 2021, 1096, 012029. [Google Scholar] [CrossRef]
- ISO 13855: 2010 Safety of Machinery–Positioning of Safeguards with Respect to the Approach Speeds of Parts of the Human Body; ISO: Geneva, Switzerland, 2010.
- Bessler, J.; Prange-Lasonder, G.B.; Schaake, L.; Saenz, J.F.; Bidard, C.; Fassi, I.; Valori, M.; Lassen, A.B.; Buurke, J.H. Safety Assessment of Rehabilitation Robots: A Review Identifying Safety Skills and Current Knowledge Gaps. Front. Robot. AI 2021, 8, 33. [Google Scholar] [CrossRef] [PubMed]
- Hanh, L.D.; Lin, C.Y. Autonomous gluing based on image-based visual servoing. Int. J. Robot. Autom. 2021, 36. [Google Scholar] [CrossRef]
- Yin, C.; Li, B.; Shi, W.; Sun, N. Monitoring-based visual servoing of wheeled mobile robots. Int. J. Robot. Autom. 2019, 34, 34. [Google Scholar] [CrossRef]
- Tan, J.T.C.; Duan, F.; Zhang, Y.; Kato, R.; Arai, T. Safety design and development of human-robot collaboration in cellular manufacturing. In Proceedings of the IEEE International Conference on Automation Science and Engineering, St. Louis, MO, USA, 10–15 October 2009. [Google Scholar]
- Himmelsbach, U.B.; Wendt, T.M.; Lai, M. Towards safe speed and separation monitoring in human-robot collaboration with 3-D-time-of-flight cameras. In Proceedings of the Second IEEE International Conference on Robotic Computing, Laguna Hills, CA, USA, 31 January–2 February 2018. [Google Scholar]
- Michalos, G.; Makris, S.; Tsarouchi, P.; Guasch, T.; Kontovrakis, D.; Chryssolouris, G. Design considerations for safe human-robot collaborative workplaces. Procedia CIRP 2015, 37, 248–253. [Google Scholar] [CrossRef]
- Schmidt, B.; Wang, L. Depth camera-based collision avoidance via active robot control. J. Manuf. Syst. 2014, 33, 711–718. [Google Scholar] [CrossRef]
- Steger, C.; Ulrich, M.; Wiedemann, C. Machine Vision Algorithms and Applications; John Wiley & Sons: Hoboken, NJ, USA, 2018. [Google Scholar]
- ISO 13849-1: 2008. Safety of Machinery–Safety-Related Parts of Control Systems-Part 1; ISO: Geneva, Switzerland, 2009.
- Durgun, I.; Tokçalar, Ö.; Ilhan, R.; Şimşek, Ö. Human-robot interaction in hybrid assembly systems using medium payload robots. In Proceedings of the National Robotic Conference—ToRK 2016, İstanbul, Turkey, 2–3 November 2016. [Google Scholar]
- ISO 13849-2: Safety of Machinery-Safety-Related Parts of Control Systems-Part 2: Validation; ISO: Geneva, Switzerland, 2003.
- Metev, B.; Gueorguieva, D. A simple method for obtaining weakly efficient points in multiobjective linear fractional programming problems. Eur. J. Oper. Res. 2000, 126, 386–390. [Google Scholar] [CrossRef]
- Rajpoot, M.H.C. “HCR’s infinite-series” analysis of oblique frustum of a right circular cone. Int. J. Math. Phys. Sci. Res. 2014, 2, 1–17. [Google Scholar]
- CIPA DCG-001-2005. Guideline for Noting Digital Camera Specifications in Catalogues; CIPA: Minato-ku, Tokyo, Japan, 2005.
- CIPA DC-003-2003. Resolution Measurement Methods for Digital Cameras; CIPA: Minato-ku, Tokyo, Japan, 2003.
- Hornberg, A. Handbook of Machine Vision; John Wiley & Sons: Hoboken, NJ, USA, 2006. [Google Scholar]
- He, K.; Zhang, X.; Ren, S.; Sun, J. Deep residual learning for image recognition. In Proceedings of the IEEE Conference on Computer Vision and Pattern Recognition, Las Vegas, NV, USA, 27–30 June 2016. [Google Scholar]
- Pilz Safe Camera System Safety Eye. Available online: https://en.sslog.de/equipment/safety-sensors-psen/safe-camera-system-safetyeye (accessed on 3 December 2021).
- Yusuf, M.; Azmi, M.S.B.M.; Ismail, A.; Ibrahim, I.I.; Hashim, M.; Kamarrudin, N. Webcam Based Lux Meter Using Grid-Based Image Processing. In Proceedings of the International Conference on Computational Approach in Smart Systems Design and Applications, Kuching, Malaysia, 15–17 August 2018. [Google Scholar]
- Ismail, A.H.; Azmi, M.S.M.; Hashim, M.A.; Ayob, M.N.; Hashim, M.S.M.; Hassrizal, H.B. Development of a webcam-based lux meter. In Proceedings of the IEEE Symposium on Computers & Informatics, Langkawi, Malaysia, 7–9 April 2013. [Google Scholar]
- He, Y.; Zhang, X.; Zhu, L.; Sun, G.; Qiao, J. Design and implementation of the visual detection system for amphibious robots. Int. J. Robot. Autom. 2019, 34. [Google Scholar] [CrossRef] [Green Version]
- Schlyter, P. Radiometry and Photometry in Astronomy. Available online: Stjarnhimlen.se/comp/radfaq.html (accessed on 3 December 2021).
- Pears, A. Strategic Study of Household Energy and Greenhouse Issues; Australian Environmental Report; Sustainable Solutions Australia: Brighton, Australia, 1998. [Google Scholar]


| Camera Height Difference | Percentage of Similarity to Optimal Placed Camera Image |
|---|---|
| 10% Decreased | 58% |
| 5% Decreased | 60% |
| 5% Increased | 55% |
| 10% Increased | 41% |
| Camera Orientation Angle Deviation (Degree) | Percentage of Similarity to Optimal Placed Camera Image |
|---|---|
| 10° Decreased | 57% |
| 5° Decreased | 59% |
| 5° Increased | 51% |
| 10° Increased | 41% |
| Case | Industrial | Experimental |
|---|---|---|
| No. of Manipulators | Variable | 1 |
| Manipulator Reach (mm) | 2800 | 270 |
| Work Envelope Radius (mm) | 3000 | 300 |
| Maximum Manipulator Speed (deg/s) | 260 | 500 |
| Alarm Zone Radius (mm) | 3500 | 300 |
| Warning Zone Radius (mm) | 4000 | 350 |
| No. of Cameras | 1 | 2 |
| Camera Resolution | Undisclosed | 1280 × 960 and 1920 × 1080 |
| Camera Angle (degree) | 80 | 50 and 70 |
| Graphics Cards | PSEN se AU AM3 | Nvidia Geforce GTX 1050 and GTX 850 M |
| Penetrating Object Radius (mm) | Human Body | 5 |
| Minimum Illuminance Range (lux) | 300 | 120 |
| Minimum Frame per Second | Undisclosed | 23 and 28 |
| Commercial System (USD) | Proposed System with 2 Cameras (USD) | Proposed System with 3 Cameras (USD) | |
|---|---|---|---|
| 3D Camera | 9500 | - | - |
| 2D Cameras | - | 120 | 180 |
| Analysis Unit | 14,000 | 360 | 540 |
| Control System | 12,000 | 1700 | 2550 |
| Total | 35,500 | 2180 | 3270 |
Publisher’s Note: MDPI stays neutral with regard to jurisdictional claims in published maps and institutional affiliations. |
© 2021 by the authors. Licensee MDPI, Basel, Switzerland. This article is an open access article distributed under the terms and conditions of the Creative Commons Attribution (CC BY) license (https://creativecommons.org/licenses/by/4.0/).
Share and Cite
Ozkahraman, M.; Yilmaz, C.; Livatyali, H. Design and Validation of a Camera-Based Safety System for Fenceless Robotic Work Cells. Appl. Sci. 2021, 11, 11679. https://doi.org/10.3390/app112411679
Ozkahraman M, Yilmaz C, Livatyali H. Design and Validation of a Camera-Based Safety System for Fenceless Robotic Work Cells. Applied Sciences. 2021; 11(24):11679. https://doi.org/10.3390/app112411679
Chicago/Turabian StyleOzkahraman, Merdan, Cuneyt Yilmaz, and Haydar Livatyali. 2021. "Design and Validation of a Camera-Based Safety System for Fenceless Robotic Work Cells" Applied Sciences 11, no. 24: 11679. https://doi.org/10.3390/app112411679