Abstract
Traditionally, circular cross-section towers have been used as supporting systems of wind turbines, but weaknesses have become apparent with recent upsizing of wind turbines. Thus, polygonal cross-section towers have been proposed and used in Europe. In this study, the effects of polygonal cross-sections on the aeroelastic and aerodynamic characteristics of wind turbines were examined through a series of wind tunnel tests. Aeroelastic tests showed that a square cross-section tower showed instability vibrations, and polygonal cross-section towers showed limited vibrations for tower-only cases. However, for wind turbines with various polygonal cross-section towers, no instability vibrations were observed, and displacements increased proportionally to the square of mean wind speed. Furthermore, pressure measurements showed that local force coefficients changed largely depending on wind direction and azimuth angle. Local drag force coefficients decreased with increasing number of tower sides, approaching those of the tower-only case, and local lift force coefficients showed larger absolute values than those of the tower-only case. The maximum mean and fluctuating drag force and the maximum fluctuating lift coefficients at each height decreased with increasing number of tower sides.
1. Introduction
Demand for renewable energy production has increased because of global climate change, and wind power potential is significant as an environmentally friendly energy resource. As the total cost of electricity generation is proportional to the sizes of wind turbines, the sizes of wind turbines have been steadily increasing with the development of materials and control techniques. Large rotors optimize electricity generation efficiency and maximize investment returns. As of 2021, the most powerful wind turbine was rated at 16 MW and had a blade length of 118 m and a height of 242 m. In particular, the offshore wind turbine market is expected to expand from its current market value more than USD 7 billion in 2020 to over USD 21 billion by 2026.
A wind turbine’s tower is the sole supporting system of its structure; it needs to resist horizontal wind and earthquake loads, as well as the vertical load of a large and heavy topside structure (rotor and nacelle). The tower’s safety and reliability ensures the total system’s safety and electricity generation efficiency. Wind loads on a wind turbine system are some of the dominant horizontal loads, and they cause severe horizontal vibrations. When wind turbine towers lose their expected and intended function by any environmental loads such as wind and earthquake loads, electricity generation efficiency is negatively affected, causing considerable economic losses and social impact. There have been many reports on severe wind events that have damaged wind turbine systems around the world [1,2]. Ma et al. [2] described a large number of serious tower failures resulting from design and operation errors or inappropriate performance assessment. An in-depth understanding of aerodynamic characteristics and failure mechanisms of a tower is necessary for both academic and related industrial communities. Dynamic analyses of wind turbine systems have mainly been verified by long-term field measurements, CFD, and numerical/analytical simulations. However, one of the challenging problems related with CFD and numerical/analytical simulations is a poor amount of dependable test and long-term field measurement data. Wind tunnel tests, one of the most reliable methods, have also been widely used to examine the aeroelastic and aerodynamic performance of wind turbines as well as electricity generation efficiency [3,4,5,6,7,8,9]. Problems related to Reynolds number have been important issues in conducting wind tunnel tests. However, Tian et al. [9] pointed out that results from wind tunnel tests are acceptable once the aerodynamic characteristics of the topside structure are identified, even though Reynolds number is smaller than the full-scale one, implying that wind tunnel studies at low Reynolds numbers can still be used for validation and verification.
With upsizing of wind turbines, tower safety is becoming increasingly important. Traditionally, circular cross-section towers have been used. However, limitations of circular cross-section towers with upsizing of wind turbines have become apparent, especially with regard to problems related to inadequate and uneconomic design strength. To solve these problems, researchers have proposed polygonal-cross-section towers, which have been used in Europe, but their wind-resistant performance has not been thoroughly investigated [10,11,12].
Any polygonal cross-section can be used to support towers. In this study, the effects of polygonal cross-sections were investigated through aeroelastic and aerodynamic wind tunnel tests. Square and square helical (4), octagon (8), decagon (10), dodecagon (12), tetradecagon (14), and circular (∞) were tested. The main parameters include reference mean wind speed at hub height Uref, wind direction θwd, azimuth angle θazi, and pitch angle θpit, as well as cross-sectional shape. Strong wind speed that is higher than cut-out wind speed was assumed where the blades were in the feathered position.
2. Wind Tunnel Test
Wind tunnel tests were conducted in an Eiffel-type turbulent boundary layer wind tunnel. Pitch-controlled wind turbine was considered, and hub height and blade length were assumed to be 90 m and 60 m in full scale, respectively. A length scale of 1/100 and a time scale of 1/10 were assumed. Table 1 shows details of the wind turbine.

Table 1.
Details of wind turbine (in full scale).
Figure 1 shows the shapes of polygonal towers and blade used in the wind tunnel tests. In this study, the seven polygonal towers were considered. A circular tower size, as a prototype, was determined, considering existing wind turbines with a bottom diameter of 6 m and a top diameter of 4 m. The heights and cross-sectional areas of the polygonal towers were designed to be the same as that of the circular tower. The numbers in parenthesis are the number of pressure taps on the towers. Blades were made on the basis of the LM-Glasfiber blade [13], and a box-shaped nacelle and a half prolate spheroid hub were used. For direction comparison, the same hub, blade, and nacelle (topside structure) were used for all polygonal-cross-section towers.
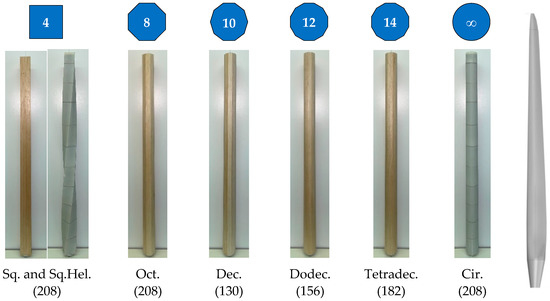
Figure 1.
Polygonal cross-sectional towers and blade (LM-Glasfiber) used in the present study (the numbers in parentheses are the number of pressure taps on the towers).
Figure 2 shows the pressure measurement setting. Pressure taps were distributed along the tower heights at 13 levels, and the number of pressure taps ranged from 156 to 208. All pressures on the towers were measured at the same time using a simultaneous multi-channel pressure-sensing system, and tubing effects were numerically compensated using a transfer function. The phase difference of the pressure measurement system had a cut-off frequency of 300 Hz.

Figure 2.
Pressure tap arrangement and wind turbine model with square tower (Href = 0.9 m).
Figure 3 shows the conditions of the oncoming flows at model position. Turbulent-boundary-layer flow representing an open area was simulated using spires and various-sized roughness elements. The turbulence intensity at hub height was about Iu,ref ≈ 11%. Reference mean wind speed at hub height Uref was 5 m/s for the pressure measurement tests, and for the aeroelastic tests, reference mean wind speeds were increased by up to about 6.3 m/s for the tower-only case and 5.6 m/s for a wind turbine case, giving a reduced velocity of 23 for the tower-only case and 32 for the wind turbine case, where a reduced velocity was defined as U* = Uref/(Dref × f0). Dref is a reference length, which is the diameter at mid-height of the circular tower, and f0 is the natural frequency of the aeroelastic system with test models (ftower or fwturbine).
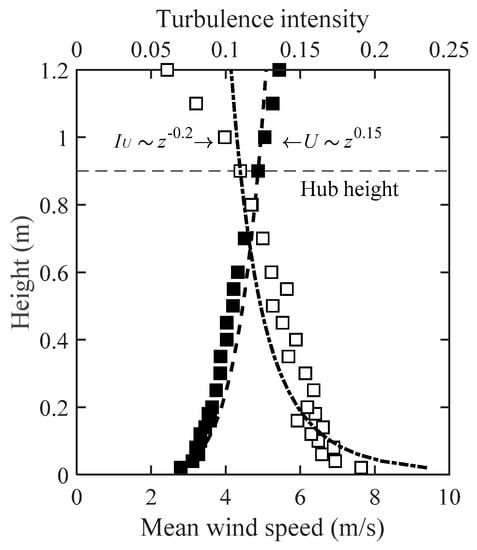
Figure 3.
Experimental flow.
Wind tunnel tests were conducted by assuming two cases: with and without topside structures. In this study, results without topside structure are indicated as tower-only case. During the aeroelastic tests, displacements at the bottoms of the towers were measured by laser displacement sensors and recalculated to displacements at hub height. Two wind directions θwd of 0° and 90° were considered for the aeroelastic tests, and 10 wind directions from 0° to 90° at 10° intervals were considered for the pressure measurements. As shown in Figure 4, four azimuth angles θazi were considered, where an azimuth angle of 0° is defined as when one of the blades was vertical, and an azimuth angle of 60° as when one of the blades was located in front of the tower. The sampling frequency of the laser displacement sensors was set to 600 Hz, and the measurement time was adjusted such that 10 10-min samples were obtained. The natural frequencies and damping ratios in principal axes were controlled by using the spring stiffness and magnet at the bottom of the aeroelastic gimbal system. The natural frequencies were determined to be 5.6 Hz and 3.5 Hz for the tower-only case and the wind turbine case, respectively, and damping ratios were 1.1% and 0.8%, respectively, on the basis of guidelines for wind turbines in Japan [14]. The wind tunnel test conditions are summarized in Table 2.
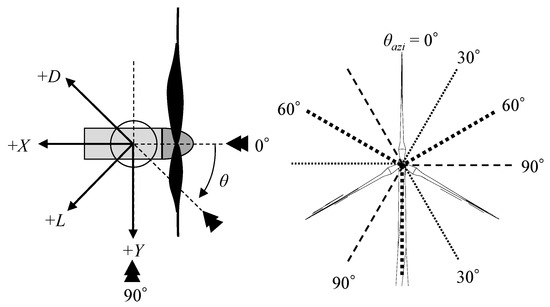
Figure 4.
Definition of forces (left) and azimuth angle (right).
Table 2.
Details of wind tunnel test.
Reynolds number was defined by using reference length and reference wind speed at hub height, and Reynolds number was about Re = 1.8 × 10⁴ for the smooth-surfaced circular tower. The maximum blockage ratio by wind turbine model was less than 2%; thus, corrections were not applied to the experimental data.
3. Results and Discussions
3.1. Fluctuating Displacements from Aeroelastic Tests
Figure 5 shows fluctuating displacements in the along- and across-wind directions for tower-only cases. For tower-only cases, one wind direction that is normal to one of the surfaces was considered. The abscissa indicated reduced velocity defined by a reference wind speed at hub height Uref, a reference length Dref, and a natural tower frequency ftower. The ordinate indicates reduced displacements in the along- (Dstd) and across-wind (Lstd) directions normalized by a reference length Dref. Fluctuating displacements in the along-wind direction (Figure 5a) increased proportionally to the square of mean wind speed and decreased with increasing number of tower sides, showing a maximum value for the square tower. However, the slope for the square tower was greater than those of the other towers. For the across-wind direction, as shown in Figure 5b, fluctuating displacements for the square tower were much greater than those for the other towers, showing instability vibrations. For the other polygonal towers, limited vibrations such as vortex-induced vibration were found near the reduced velocity of 6.3, showing large vibrations for the octagonal tower. Fluctuating displacements near limited vibrations decreased with increasing number of sides, and the difference seemed to be small for the polygonal towers with number of sides larger than 10. Generally, as limited vibrations by vortex shedding were strongly related to vortex formation and shedding, it can be understood that vortex shedding weakened as the number of sides increased. For reduced velocities larger than 15, the fluctuating displacements for the decagonal tower became large. The aspect ratio (Href/Dref) and tapering ratio (((Dbottom − Dtop)/Href) × 100) of the circular tower were 18 and 2%, respectively; thus, it was assumed that aeroelastic characteristics depending on cross-sectional shapes were clearly found.
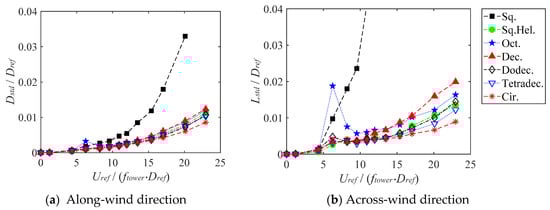
Figure 5.
Fluctuating displacements for tower-only cases [15].
Figure 6 shows the fluctuating displacements in the along- and across-wind directions for a square wind turbine. In the present study, a wind turbine with a square-cross-section tower was simply referred to as a square wind turbine, which is true for all other polygonal cross-section towers. Like the tower-only case in the along-wind direction, the fluctuating displacements increased proportionally to the square of mean wind speed, but unlike the tower-only case, very small differences were found between the along- and across-wind directions. This trend was true for the wind turbines with other polygonal towers.
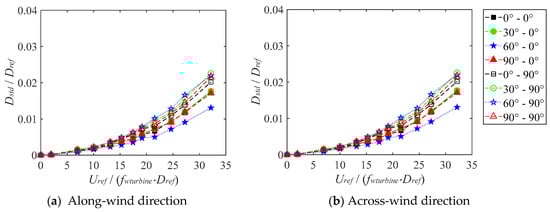
Figure 6.
Fluctuating displacements for square wind turbine.
Figure 7 shows the maximum fluctuating displacements for wind turbines installed on seven polygonal towers. Here, maximum fluctuating displacements were defined as the largest fluctuating displacement for all wind directions and all azimuth angles at a specific wind speed. Surprisingly, small differences in maximum fluctuating displacements were found among polygonal towers, except for those in the across-wind direction. For those displacements, although the square wind turbine showed greater values than the others, no instability or limited vibrations, which were observed for the tower-only cases as shown in Figure 5, were observed. This was assumed to result from the existence of the blades.
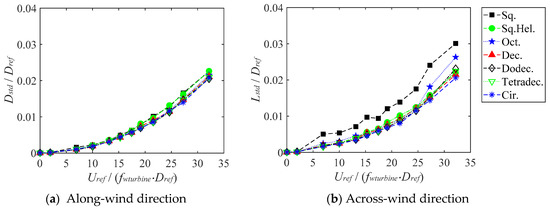
Figure 7.
Maximum fluctuating displacements for wind turbines installed on seven polygonal towers [15].
From these results, even though the blades were in the feathered position, as the aerodynamic force on the hub, blade, and nacelle were greater than that on the tower, the effect of cross-sectional shapes of towers became small, negligible in some cases, except for the square wind turbine in the across-wind direction.
3.2. Power Spectral Densities from Aeroelastic Tests
Power spectral densities of displacements at hub height were obtained to investigate the characteristics of vortex shedding condition of tower-only and wind turbine cases. One example of the power spectral densities of the octagonal tower-only case is shown in Figure 8 for some reduced velocities. The dotted vertical line indicates the system’s natural frequency. For reduced velocity U* = 1.21 (Figure 8a), two clear peaks were found. The left peak corresponded to the vortex shedding frequency fs (▼ in the figure) and the right peak to the system’s natural frequency f0 (● in the figure), showing a slightly greater power for the system’s natural frequency. When the reduced velocity increased near U* = 6.25 (Figure 8b), only one peak was found, indicating that a lock-in mechanism occurred. As the reduced velocity further increased, a peak corresponding to the vortex shedding frequency was again able to be found in the high-frequency range (Figure 8c). The peak in the high-frequency range was quite small, and the reason for this can be understandable when the power spectral density of the displacement is calculated from the displacement mechanical admittance and the power spectral density of the generalized force [16]. The small peak in the high-frequency range after the lock-in range resulted from the characteristics of the displacement admittance function, i.e., it gave an almost constant value when the frequency was lower than the system’s natural frequency, but it dropped quickly right after the system’s natural frequency and approached zero. This quick drop was attributed to the small peak in the high-frequency range. Similar discussions can be made for other polygonal towers, but it was found that the peaks in vortex shedding frequency were largely suppressed for polygonal cross-sectional towers. For the reduced velocity where instability vibrations were observed, the peak powers corresponding to the system’s natural frequencies greatly increased, as also explained by Kawai [17].
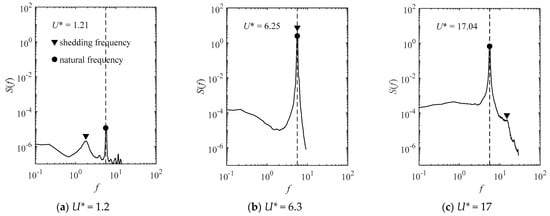
Figure 8.
Power spectral densities of octagonal tower (tower-only case).
The reduced shedding frequencies fs/f0, which were identified from the peaks in power spectral densities, are plotted in Figure 9 with reduced velocities U* for several polygonal towers. The obvious lock-in range where the vortex shedding frequency was close to the system’s natural frequency deviating from the linear trend was clearly found. The lock-in range for the square and octagonal towers began near reduced velocity U* = 6.25, and for the dodecagonal and tetradecagonal towers started near reduced velocity U* = 4.32, showing a larger lock-in range. For the dodecagonal and tetradecagonal towers, even though lock-in began at a smaller reduced velocity, peak powers in power spectral densities were smaller than those for the square and octagonal towers. When the reduced shedding frequencies fs/f0 were plotted with reduced velocities U*, the slopes shown in Figure 9 can be interpreted as Strouhal number St, which is a dimensionless parameter commonly used to examine the characteristics of vortex shedding frequency. The St of the square tower (circular symbol) was about 0.14, the St of the octagonal tower (square symbol) was about 0.16, the St of the dodecagonal tower (star symbol) was about 0.17, and the St of the tetradecagonal tower (triangular symbol) was about 0.18, showing larger Strouhal number with increasing number of sides.
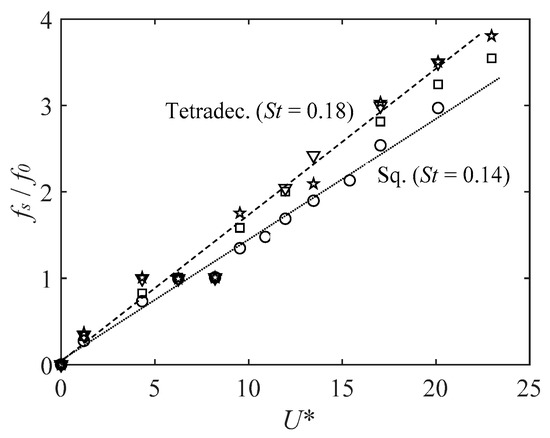
Figure 9.
Variation of reduced shedding frequencies on reduced velocities for several polygonal towers (tower-only case).
Figure 10 shows the power spectral densities of the wind turbine installed on the square, square helical, and circular towers for wind direction θwd = 0° and azimuth angle θazi = 0°. When the reduced velocity U* was small (U* = 1.94), there were two clear peaks for the square wind turbine, one for the vortex shedding frequency fs (▼ in the figure) and the other for the system’s natural frequency f0 (● in the figure), but the peaks for the vortex shedding frequency became small with increasing number of sides. In addition, for larger reduced velocities, only one peak was found over a wide range of reduced velocities. For the wind turbine cases, no peaks in the high-frequency range induced by vortex shedding were observed for all cases.
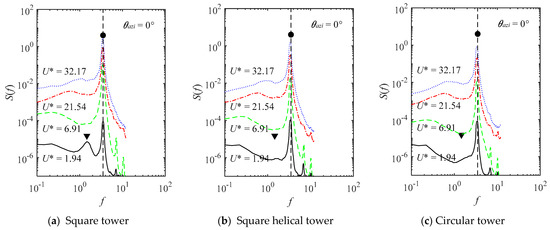
Figure 10.
Power spectral densities of wind turbine installed on various polygonal towers at θwd = 0° and θazi = 0°.
For azimuth angle θazi = 60°, which is not shown here, similar discussions can be made, but the peak corresponding to the vortex shedding frequency was quite small because one of the blades was located just in front of the tower, interrupting the regular vortex formation and shedding.
3.3. Local Force Coefficients from Pressure Measurements
As previously mentioned, pressures on towers were measured by simultaneous multi-channel pressure sensing systems. Pressure taps were installed along the tower heights at 13 levels at constant intervals, and all pressures were measured simultaneously. Details on pressure measurements were found in Kim and Tamura [18].
Figure 11 shows the variation of local force coefficients of tetradecagonal wind turbine at θpit = 90° and θazi = 90° for various wind directions. Local force coefficients were defined by the reference wind speed at hub height (Uref = 5 m/s) and reference width of circular tower at 0.5 Href (Dref = 0.05 m). As the effect of pitch angle on forces on the tower was very small [18], the results for a pitch angle of 90° were used, and “T only” in the legend indicates the tower-only case without topside structure. At azimuth angle θazi = 90°, as one of the blades was located in front of the tower for the oblique wind directions, it was found that local force coefficients near the top varied greatly. Local drag force coefficients of the wind turbine were smaller than that for the tower-only case (T only), while the local lift force coefficients showed larger absolute values than that for the tower-only case. In particular, large absolute values were found for the oblique wind directions: wind direction 40° for mean lift force coefficient and wind direction 60° for fluctuating lift force coefficient. When the azimuth angles were θazi = 0° and θazi = 30°, the variations of the force coefficients were generally small, showing similar values to the tower-only case, and when the azimuth angle was θazi = 60°, the variations of the force coefficients were similar to those in Figure 11 [18].
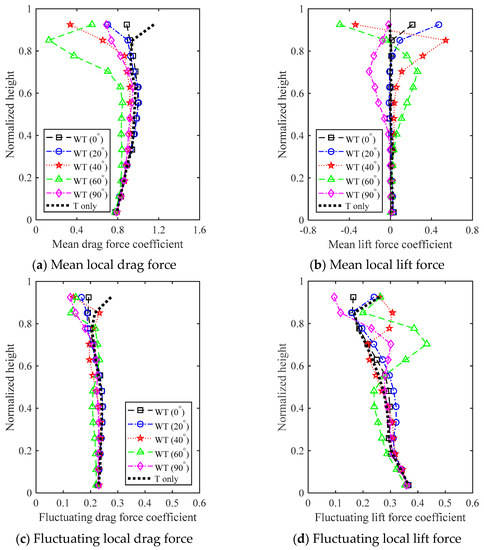
Figure 11.
Variation of local force coefficients of tetradecagonal wind turbine at θpit = 90° and θazi = 90°.
Figure 12 shows the variations of mean lift force coefficients depending on number of sides of towers at θpit = 90° and θazi = 0°. Although large mean lift forces were found for wind direction 20° for the square wind turbine, the variation of mean lift force coefficient was generally small, and this trend became more significant when the number of sides increased. Similar trends were found for azimuth angle θazi = 30° and for other force components.
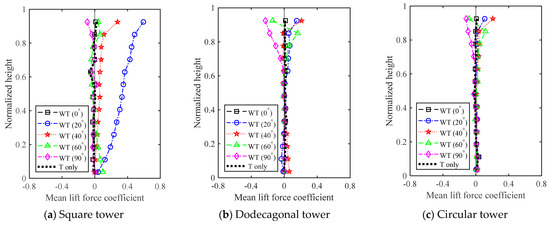
Figure 12.
Variation of mean lift force coefficients with number of tower sides at θpit = 90° and θazi = 0°.
In the tower’s design, maximum force coefficients for all wind directions and all azimuth angles were generally used. The maximum force coefficients for all considered cases at each height were chosen, and the ratios to the circular wind turbine are shown in Figure 13. As for the mean and fluctuating local drag force coefficients, they decreased with increasing number of sides, showing the largest values for the square wind turbine and the smallest values for the tetradecagon wind turbine. For the fluctuating lift force coefficients, in essence, they also decreased with increasing number of sides, but the fluctuating lift force coefficients of the square helical wind turbine showed even smaller values than the circular wind turbine. For tall buildings and structures, the helical/twisting shape is well known to be efficient in mitigating fluctuating lift forces, and this was confirmed again, even for the wind turbine.
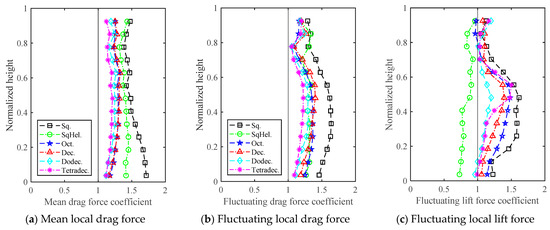
Figure 13.
Maximum force coefficients for all cases (ratio to circular wind turbine).
Although moderate height variations were found for the fluctuating drag and lift force coefficients as shown in Figure 13, average value of ratio to the circular wind turbine for all heights were derived and are shown in Table 3. As mentioned, the force coefficients decreased with increasing number of sides except for the square helical wind turbine in fluctuating lift forces, and the ratios in Table 3 can be used when designing the polygonal wind turbines by multiplying them by the force coefficients of the circular wind turbine prescribed in codes and standards.
Table 3.
Average value of ratio to circular wind turbine for all heights.
4. Concluding Remarks
Considering the wind turbine in the feathered position, this study conducted a series of aeroelastic and aerodynamic wind tunnel tests for wind turbines installed on seven polygonal-cross-section towers, and the following concluding remarks can be made.
In terms of the aeroelastic tests, a square cross-section tower showed instability vibration, and limited vibrations were found for other polygonal cross-sectional towers near reduced velocity U* = 6.3 for the tower-only case. For wind turbine cases under various conditions, no instability or limited vibrations were observed, and the displacements increased proportionally to the square of mean wind speed. The existence of blades in front of the tower was assumed to disturb the incoming flow conditions, preventing periodic vortex formation and shedding.
Pressure measurements showed that the local force coefficients varied greatly depending on wind direction and azimuth angle. Local drag force coefficients decreased with an increasing number of tower sides, approaching those of the tower-only case, and local lift force coefficients showed larger absolute values than those of the tower-only case. The maximum mean and fluctuating drag force coefficients for all wind directions and all azimuth angles at a specific height decreased with increasing number of tower sides, and for the maximum fluctuating lift force coefficients, in essence, they also decreased with increasing number of sides, but the maximum fluctuating lift force coefficients of the square helical wind turbine showed even smaller values than the circular wind turbine.
As the forces on the topside structure were larger than those on the tower, the effect of polygonal cross-section towers on the aeroelastic and aerodynamic characteristics of wind turbines were small, except for the square wind turbine in the across-wind direction.
In this study, the wind turbines with the blades in the feathered position were considered, and the effect of rotating blades will be examined in the next research step.
Funding
This work was supported by JSPS KAKENHI grant number 19H02291.
Institutional Review Board Statement
Not applicable.
Informed Consent Statement
Not applicable.
Data Availability Statement
Not applicable.
Conflicts of Interest
The author declares no conflict of interest.
References
- Chou, J.S.; Ou, Y.C.; Lin, K.Y. Collapse mechanism and risk management of wind turbine tower in strong wind. J. Wind Eng. Ind. Aerodyn. 2019, 193, 103962. [Google Scholar] [CrossRef]
- Ma, Y.; Martinez-Vazquez, P.; Baniotopoulos, C. Wind turbine tower collapse cases: A historical overview. Proc. Inst. Civ. Eng. Struct. Build. 2019, 172, 547–555. [Google Scholar] [CrossRef]
- Noda, H.; Ishihara, T. Wind tunnel test on mean wind forces and peak pressures acting on wind turbine nacelles. Wind Energy 2014, 17, 1–17. [Google Scholar] [CrossRef]
- Hu, H.; Yang, Z.; Sarkar, P. Dynamic wind loads and wake characteristics of a wind turbine model in an atmospheric boundary layer wind. Exper. Fluids 2012, 52, 1277–1294. [Google Scholar] [CrossRef]
- Verelst, D.R.S.; Larsen, T.J.; Wingerden, J.W. Wind tunnel tests of a free yawing downwind wind turbine. J. Phys. 2014, 555, 012103. [Google Scholar] [CrossRef]
- Bottasso, C.L.; Campagnolo, F.; Petrovic, V. Wind tunnel testing of scaled wind turbine models: Beyond aerodynamics. J. Wind Eng. Ind. Aerodyn. 2014, 127, 11–28. [Google Scholar] [CrossRef]
- Mitulet, L.A.; Oprina, G.; Chihaia, R.A.; Nicolaie, S.; Nedelcu, A.; Popescu, M. Wind tunnel testing for a new experimental model of counter-rotating wind turbine. Procedia Eng. 2015, 100, 1141–1149. [Google Scholar] [CrossRef]
- Treuren, K.V. Small-scale wind turbine testing in wind tunnels under low Reynolds number conditions. J. Energy Resour. Technol. 2015, 137, 051208. [Google Scholar] [CrossRef]
- Tian, W.; Ozbay, A.; Hu, H. A wind tunnel study of wind loads on a model wind turbine in atmospheric boundary layer winds. J. Fluids Struct. 2019, 85, 17–26. [Google Scholar] [CrossRef]
- Park, S.M.; Choi, B.H. Finite element analyses on local buckling strength of polygonal-section shell towers. J. Korea Acad. Ind. Coop. Soc. 2012, 13, 1900–1907. (In Korean) [Google Scholar] [CrossRef]
- Choi, B.H.; Park, S.M.; Hwang, M.O. Local buckling strength of modular hexagon-section shell wind-turbine towers. J. Korea Soc. Hazard. Mitig. 2013, 13, 81–87. (In Korean) [Google Scholar] [CrossRef][Green Version]
- Choi, B.H.; Kim, J.W. Compressive strength evaluation of longitudinally stiffened octangular-section modular shell towers. J. Korea Acad. Ind. Coop. Soc. 2016, 17, 135–140. (In Korean) [Google Scholar]
- Jonkman, J.; Butterfield, S.; Musial, W.; Scott, G. Definition of a 5-MW Reference Wind Turbine for Offshore System Development; National Renewable Energy Laboratory: Golden, CO, USA, 2009.
- Japan Society of Civil Engineers. Guidelines for Design of Wind Turbine Support Structures and Foundations; Japan Society of Civil Engineering: Tokyo, Japan, 2010. [Google Scholar]
- Kim, Y.C. Aeroelastic characteristics of wind turbine with various cross-sectional shape of tower. In Proceedings of the 2021 International Conference on Structural Engineering and Mechanics, Seoul, Korea, 24–26 August 2021. [Google Scholar]
- Kim, Y.C.; Lo, Y.L.; Chang, C.H. Characteristics of unsteady pressures on slender tall building. J. Wind Eng. Ind. Aerodyn. 2018, 174, 344–357. [Google Scholar] [CrossRef]
- Kawai, H. Effects of angle of attack on vortex induced vibration and galloping of tall buildings in smooth and turbulent boundary layer flows. J. Wind Eng. Ind. Aerodyn. 1995, 54–55, 125–132. [Google Scholar] [CrossRef]
- Kim, Y.C.; Tamura, Y. Investigation of aerodynamic performance of pitch-control wind turbine with polygonal towers. Wind Struct. Int. 2021, 33, 87–101. [Google Scholar]


Publisher’s Note: MDPI stays neutral with regard to jurisdictional claims in published maps and institutional affiliations. |
© 2021 by the author. Licensee MDPI, Basel, Switzerland. This article is an open access article distributed under the terms and conditions of the Creative Commons Attribution (CC BY) license (https://creativecommons.org/licenses/by/4.0/).