Article

Study and Application of Industrial Thermal Comfort Parameters by Using Bayesian Inference Techniques

by
Patricia I. Benito
*,
Miguel A. Sebastián
and
Cristina González-Gaya
Department of Construction and Manufacturing Engineering, ETS Ingenieros Industriales, Universidad Nacional de Educación a Distancia (UNED), C/Juan del Rosal 12, 28040 Madrid, Spain
*
Author to whom correspondence should be addressed.
Appl. Sci. 2021, 11(24), 11979; https://doi.org/10.3390/app112411979
Submission received: 29 November 2021 / Revised: 11 December 2021 / Accepted: 14 December 2021 / Published: 16 December 2021

Abstract

:
This paper focuses on the use of Bayesian networks for the industrial thermal comfort issue, specifically in industries in Northern Argentina. Mined data sets that are analyzed and exploited with WEKA and ELVIRA tools are discussed. Thus, networks giving the predictive value of thermal comfort for different pairs of indoor temperature and humidity values according to activity, time, and season, verified in the workplace, were obtained. The results obtained were compared to other statistical models of linear regression used for thermal comfort, thus observing that comfort temperature values are within a same range, yet the network offered more information since a range of options for interior design parameters (temperature/relative humidity) was offered for different work, time, and season conditions. Additionally, if compared with static models of heat exchange, the contribution of Bayesian networks is noted when considering a context of actual operability and adaptability conditions to the environment, which is promising for developing thermal comfort intelligent systems, especially for the development of sustainable settings within the Industry 4.0 paradigm.

1. Introduction

Industrial Revolution 4.0 is based on Information and Communications Technology (ICT), Internet of Things (IoT), artificial intelligence (AI) linked to Big Data and algorithms used to process them, robotics, and cloud services, among others, to optimize processes and achieve more efficiency and productivity [1,2,3].
Within this great Industry 4.0 paradigm, occupational health and safety and the issue of thermal comfort are included.
ISO 7730 Standard defines thermal comfort, also known as hygrothermal comfort, as “that mental condition in which thermal environment satisfaction is expressed” [4], which is a subjective concept and thus very difficult to assess. It is even defined by its opposite concept—hygrothermal discomfort, which is climate discomfort due to temperature, humidity, or air velocity.
From a physiological standpoint, a person experiences thermal comfort when their organism does not need to use their body temperature autoregulation mechanisms [5].
Hygrothermal comfort has major impact on both people’s health and environmental sustainability. The application handbook of Law 13059, Hygrothermal Conditioning of Buildings from the Housing Institute of Buenos Aires, describes that adequate levels of thermal comfort are essential for maintaining health, moderating humidity condensation effects, and saving energy [6].
Additionally, the Ministry of Health of Argentina [7] mentions that the World Health Organization defines occupational health as a multidisciplinary activity aimed at promoting and protecting workers’ health by disease and accident prevention and at controlling risk prevention and safety at work. It aims at creating and promoting healthy and safe work as well as comfortable work environments, emphasizing the mental, physical, and social wellbeing of workers and promoting the optimization and maintenance of their work capacity.
Taking into consideration the general importance of the subject and the World Health Organization recommendations about occupational health as for hygrothermal comfort, the following issues about the air conditioning installation project are considered.
In this sense, Néstor Quadri [8] suggests designing and calculating heating, ventilation, and air conditioning (HVAC) installations in which the following factors should be considered:
  • Building factors: dimensions and sun orientation of the premises, total transmittance coefficients on walls, floors and ceilings, room distribution;
  • Purposes of premises: number of people, type of activity and time schedule, lighting, equipment and motor-driven machines, and other heat-emitting sources;
  • Design parameters: outdoor temperature and relative humidity determined in the premises, indoor temperature, and relative humidity. In closed spaces, air velocity has no decisive influence since its values for comfort conditions may vary from 5 to 8 m/s, and in summer, velocities up to 12 m/s may be acceptable.
Both building factors and the purpose of the premises can be determined with some precision, while design parameters related to indoor temperature and relative humidity for people to be at thermal comfort cannot if we consider the concept’s subjective factor.
In general, the parameters used when calculating air conditioning installations are obtained from charts and/or tables based on controlled experiences under ideal conditions and for a specific population. In this sense, the American Society of Heating, Refrigerating and Air-Conditioning Engineers (ASHRAE), with the help of different universities and official entities, carried out experiences to see different people’s reactions under different temperature, relative humidity, and air movement conditions. The results were used to create a comfort chart linking psychometric conditions to human reactions [9].
When using indoor temperature and relative humidity values to calculate installations, actual working conditions, regional customs, and local weather characteristics are not taken into consideration.
So far, mathematical methods and statistical analysis techniques, by means of charts and/or equations, are used to determine hygrothermal comfort parameters [10,11,12,13,14].
However, they do not show the complexity and relationships of hygrothermal comfort expressed by people.
In an experiment carried out by Ma, N. et al. [15], they propose a Bayesian approach by applying a neural network (BNN) to build a predictive model for the occupants’ thermal preference indoor. The authors found that this model is better than conventional thermal comfort models, yet they assessed that it provides roughly reliable predictions, according to the occupants’ preferences.
This paper proposes the use of Bayesian inference techniques [16,17], which create a model of the event being studied by means of a variable set and its dependence relationships. Bayesian inference allows determining the posterior probability of unknown variables, based on known variables, and provides information through graphic presentation of probabilistic relationships as for how the domain variables relate. These variables can be occasionally construed as cause–effect relationships in different fields of knowledge, and particularly in the thermal comfort field. Expert involvement can help in building these models and determining the conditional probability of network nodes; however, the models can also be determined by means of machine learning.
In this particular study, a Bayesian network was used to determine the thermal comfort parameters in industrial settings that allow improving the work environment, reducing occupational risks, and increasing energy efficiency.

2. Background

As main background, the Fanger model published in the British Journal of Industrial Medicine can be mentioned [10]. It assesses thermal comfort status based on predictive mean vote (PMV) and predictive percentage of dissatisfied (PPD). The predictive mean vote is calculated by means of clothing insulation, metabolic rate, and environment characteristics (temperature, radiant temperature, relative humidity, and air velocity). This rate allows the determination of people dissatisfied with the environment, showing major progress in comparison with other thermal comfort rates. Nonetheless, as it is performed in controlled chambers with young people of European or North American descent (physiological model) at rest, it does not consider the lack of local thermal comfort, actual operability conditions, or regional working habits. Diego-Mas, J.A. [11] considers that the calculation of PMV and PPD allows the identification of thermal discomfort events perceived by the body. Moreover, there are a series of factors, such as drafts, differences in vertical temperature, and the existence of hot or cold ceilings, walls, or floors, that may cause discomfort in workers even when the overall situation has been assessed as satisfactory by the Fanger method. Thus, he concludes that the assessment should be completed with the study of “local thermal discomfort” in such cases.
According to ISO 7730 Standard: Ergonomics of the thermal environment [4], another limitation of the Fanger model applicability is that the predictive mean vote (PMV) rate should only be used to assess thermal environments in which the variables in the calculation are within specific intervals of a metabolic rate (46 and 232 W/m2), clothing insulation (0 and 0.31 m2 K/W), air temperature (10 °C and 30 °C), mean radiant temperature (10 °C and 40 °C), air velocity (0 and 1 m/s), and water vapor pressure (0 and 27 HPa).
From another approach, adaptive models (Brager, G. and De Dear, R. [12], Nicol, F. and Humphreys. M. [13]) consider the outdoor climate to determine the preferences of indoor comfort, where the person is not a passive receptor but part of a dynamic system with the environment. These two theoretical approaches (Gómez-Azpeitia, L. et al. [14]) have not delivered answers for establishing design parameters of air conditioning installations.
Furthermore, Atmaca and Koçak [18] found that thermal environment conditions are one of the most important factors in workplaces from a productivity, occupational safety, and human health standpoint. In the simulation, they used an energy balance model to determine the thermal comfort area. They identified that the optimal operational temperature decreases while metabolic activity levels increase. This research paper considers air velocity, yet there is no evidence of the relative humidity influence.
Another background study is the experience provided by Sun et al., focusing on the combination between ambient temperature and the temperature of facilities while being ventilated by an air-conditioning unit. In this case, they used 18 test subjects and three temperature combinations, with low air speed to reduce one variable. For the authors, the results imply that the adoption of local ventilation could improve thermal comfort while consuming less energy, compared with the traditional air conditioning mode, which creates a uniform comfortable environment by setting air temperature at 26 °C [19].
The results of a case study in the History Museum of Valencia, Spain, about the thermal comfort of its visitors stressed the limitations of the Fanger model when used in this type of building, highlighting the need for further research in this field [20]. Activity incidence, building conditions for art preservation, and their impact on people whose clothing is fitted for outdoor temperature and does not guarantee their comfort within the building during warm season are stressed.
Several studies on thermal comfort were carried out in educational institutions of different levels. The study performed by Singh, M.K. et al. [21], compiling 93 research papers on the subject, found that students were dissatisfied with the thermal environment and preferred a colder temperature in all education levels. This study shows that it is necessary to establish a different set of guidelines or standards for students of different ages in different educational levels in order to satisfy their thermal comfort needs or preferences.
Another study conducted by Martínez-Molina et al. on a post-occupancy thermal comfort assessment in a primary school focused on the building’s energy adaptation and improvement. A post-occupancy evaluation (POE), in which the sample size was the classroom [22], was performed. Standard PMV and PPD values for both students and teachers were calculated, and then, a survey about their comfort level was conducted. Results show that the children’s thermal comfort status is different from that of adults and highlight the concept’s subjectivity. Once again, age incidence is stressed and further shows the need to find other tools to get closer to reality.
Forgiarini, R. and Ghisi, E. [23] performed studies in office buildings with air conditioners and mixed mode ventilation, and they used analytical and adaptive models for thermal comfort. For the authors, the analytical model overestimated users’ sensation of cold and did not adequately predict the percentage of thermal dissatisfaction. As such, they recommended adapting a broader range of indoor thermal conditions than those recommended by ASHRAE 55-2013 during the functioning of air-conditioning, while the application of the adaptive model would prove inadequate for buildings with air-conditioning, although this finding was not conclusive due to a lack of sufficient data.
In the same research line, Jia, X. et al. [24] noted that: “...there is no consensus among previous studies on how to assess thermal comfort on occupants in mixed mode (MM) buildings. This study aims at comparing the PMV-PPD and the adaptive model applicability in MM buildings and assessing if the occupants’ thermal perception varies with different functioning modes...”. The results showed that the analytical model was not fitted for MM buildings and that the adaptive model proved better applicability in cooling mode with air conditioners than with natural ventilation.
Studies by Gallardo, A. et al. showed that the PMV model predicts to some extent the thermal sensation of occupants but fails to estimate the temperature at which occupants feel comfortable [25].
According to Piasecki, M. et al. [26], “it was noted that the panelists showed better thermal comfort sensation at lower temperatures than would result from the traditional Fanger distribution, so the authors proposed the experimental function of percentage of dissatisfied (PPD) = f(PMV)”. It is another case that highlights the need to review the methodology for assessing thermal comfort in the face of new challenges.
Based on this background, the research study on thermal comfort has been mainly conducted on two models—the mathematical and the adaptive—from a conceptual and methodological standpoint.
In the mathematical model, also known as the quantitative method, the person–environment heat exchange is studied by measuring the physiological variations experienced by test subjects in controlled chambers. Thermal balance equations linked to physiological values obtained through experience are solved to predict comfort sensation. As it has been stated, the model reference is Povl Ole Fanger [10]. This model is fitted for evaluating thermal comfort in constantly conditioned buildings.
Adaptive models are based on qualitative methods using observation, surveys, and/or interviews in actual operability settings, mostly offices and houses, for data mining. They record all possible details about clothing type, people’s characteristics, activity, and temperature. In general, the tools used for this model were statistics aiming at determining which temperatures most people were comfortable with, related to outdoor temperature but excluding design parameters such as indoor relative humidity (RH). Table 1 shows a summary of authors, models, and limitations:
The quantitative and qualitative methods studied show that the issue of thermal comfort has yet to be solved [14]. Even though the adaptive model shows a better answer to the problem when compared with the Fanger model due to its simplicity, its great disadvantage is the variety of intervening domain variables, which have been included in case studies. Some of these have been introduced as background in this paper due to their impact on the studied variable, and they are summarized as follows in Table 2:

3. Problem Statement

As observed in the background, research has been based on the Fanger model, statistical techniques, and/or compared case studies.
Even though qualitative methods hinder generalization, a meta-analysis that statistically combines several studies can be conducted since there is a great amount of data. Additionally, there can be publication bias if studies with negative results or those that could not be published are not considered.
As shown in Table 1 and Table 2 summarizing the current literature, the methods used in the cases presented show limitations for hygrothermal comfort.
If the following aspects are considered, new alternatives are needed to study the complex weave of relationships when determining industrial comfort parameters:
  • concept subjectivity;
  • significance of the topic for health;
  • thermal comfort significance for occupational health and safety and its impact on productivity;
  • model limitations when applied in industries;
  • and energy resource optimization for thermal comfort.
Therefore, previous experiences from studies in western and eastern areas of Argentina [27,28] were capitalized on, and the standards and guidelines regulating thermal comfort [29,30,31,32,33] were analyzed. This study shows the lack of regulations for air conditioning installations in industrial buildings regarding indoor design parameters, in which geographical region, season, time schedule, activity, and subjective value are essential to consider.
As Kralikova and Wessely [34] note, human beings have attempted to create thermally comfortable spaces for many years, and the components of successfully doing so include air temperature, humidity, and air speed inside the space; however, they add that the understanding of what makes a space comfortable is still evolving, and we are discovering that these components only represent a part of the thermal comfort conundrum.
For this issue, and trying to offer a solution for these vacancies, the use of probabilistic techniques is proposed.
To illustrate, a case study performed in the northern area of Argentina, whose mined data are published in ResearchGate, is presented [35,36].

4. Study Case—Northern Area of Argentina

Based on the proposed, the aim was to analyze the behavior of Bayesian techniques for prediction and better result exploitation to prove field experiments. In this case, it is in the northern area of Argentina, where the weather is primarily subtropical, dry, and warm; however, there are some areas with a wet season in which heavier rainfall events occur in the summer, with relative humidity >50%.
The experiment was performed in six companies from different businesses (veneer plants, and textile, metal-mechanic, and tobacco sectors) in the northern area of Argentina by observing and recording:
  • Season of the year (summer/winter);
  • Time schedule.
For the summer season, cooling loads varied according to solar time; so, data mining was performed three times, at 10.00 h, 15.00 h, and 18.00 h, to consider the variable impact.
For the winter season, solar time contributes to heating loads, so data mining was performed only at 10.00 h. Variables included:
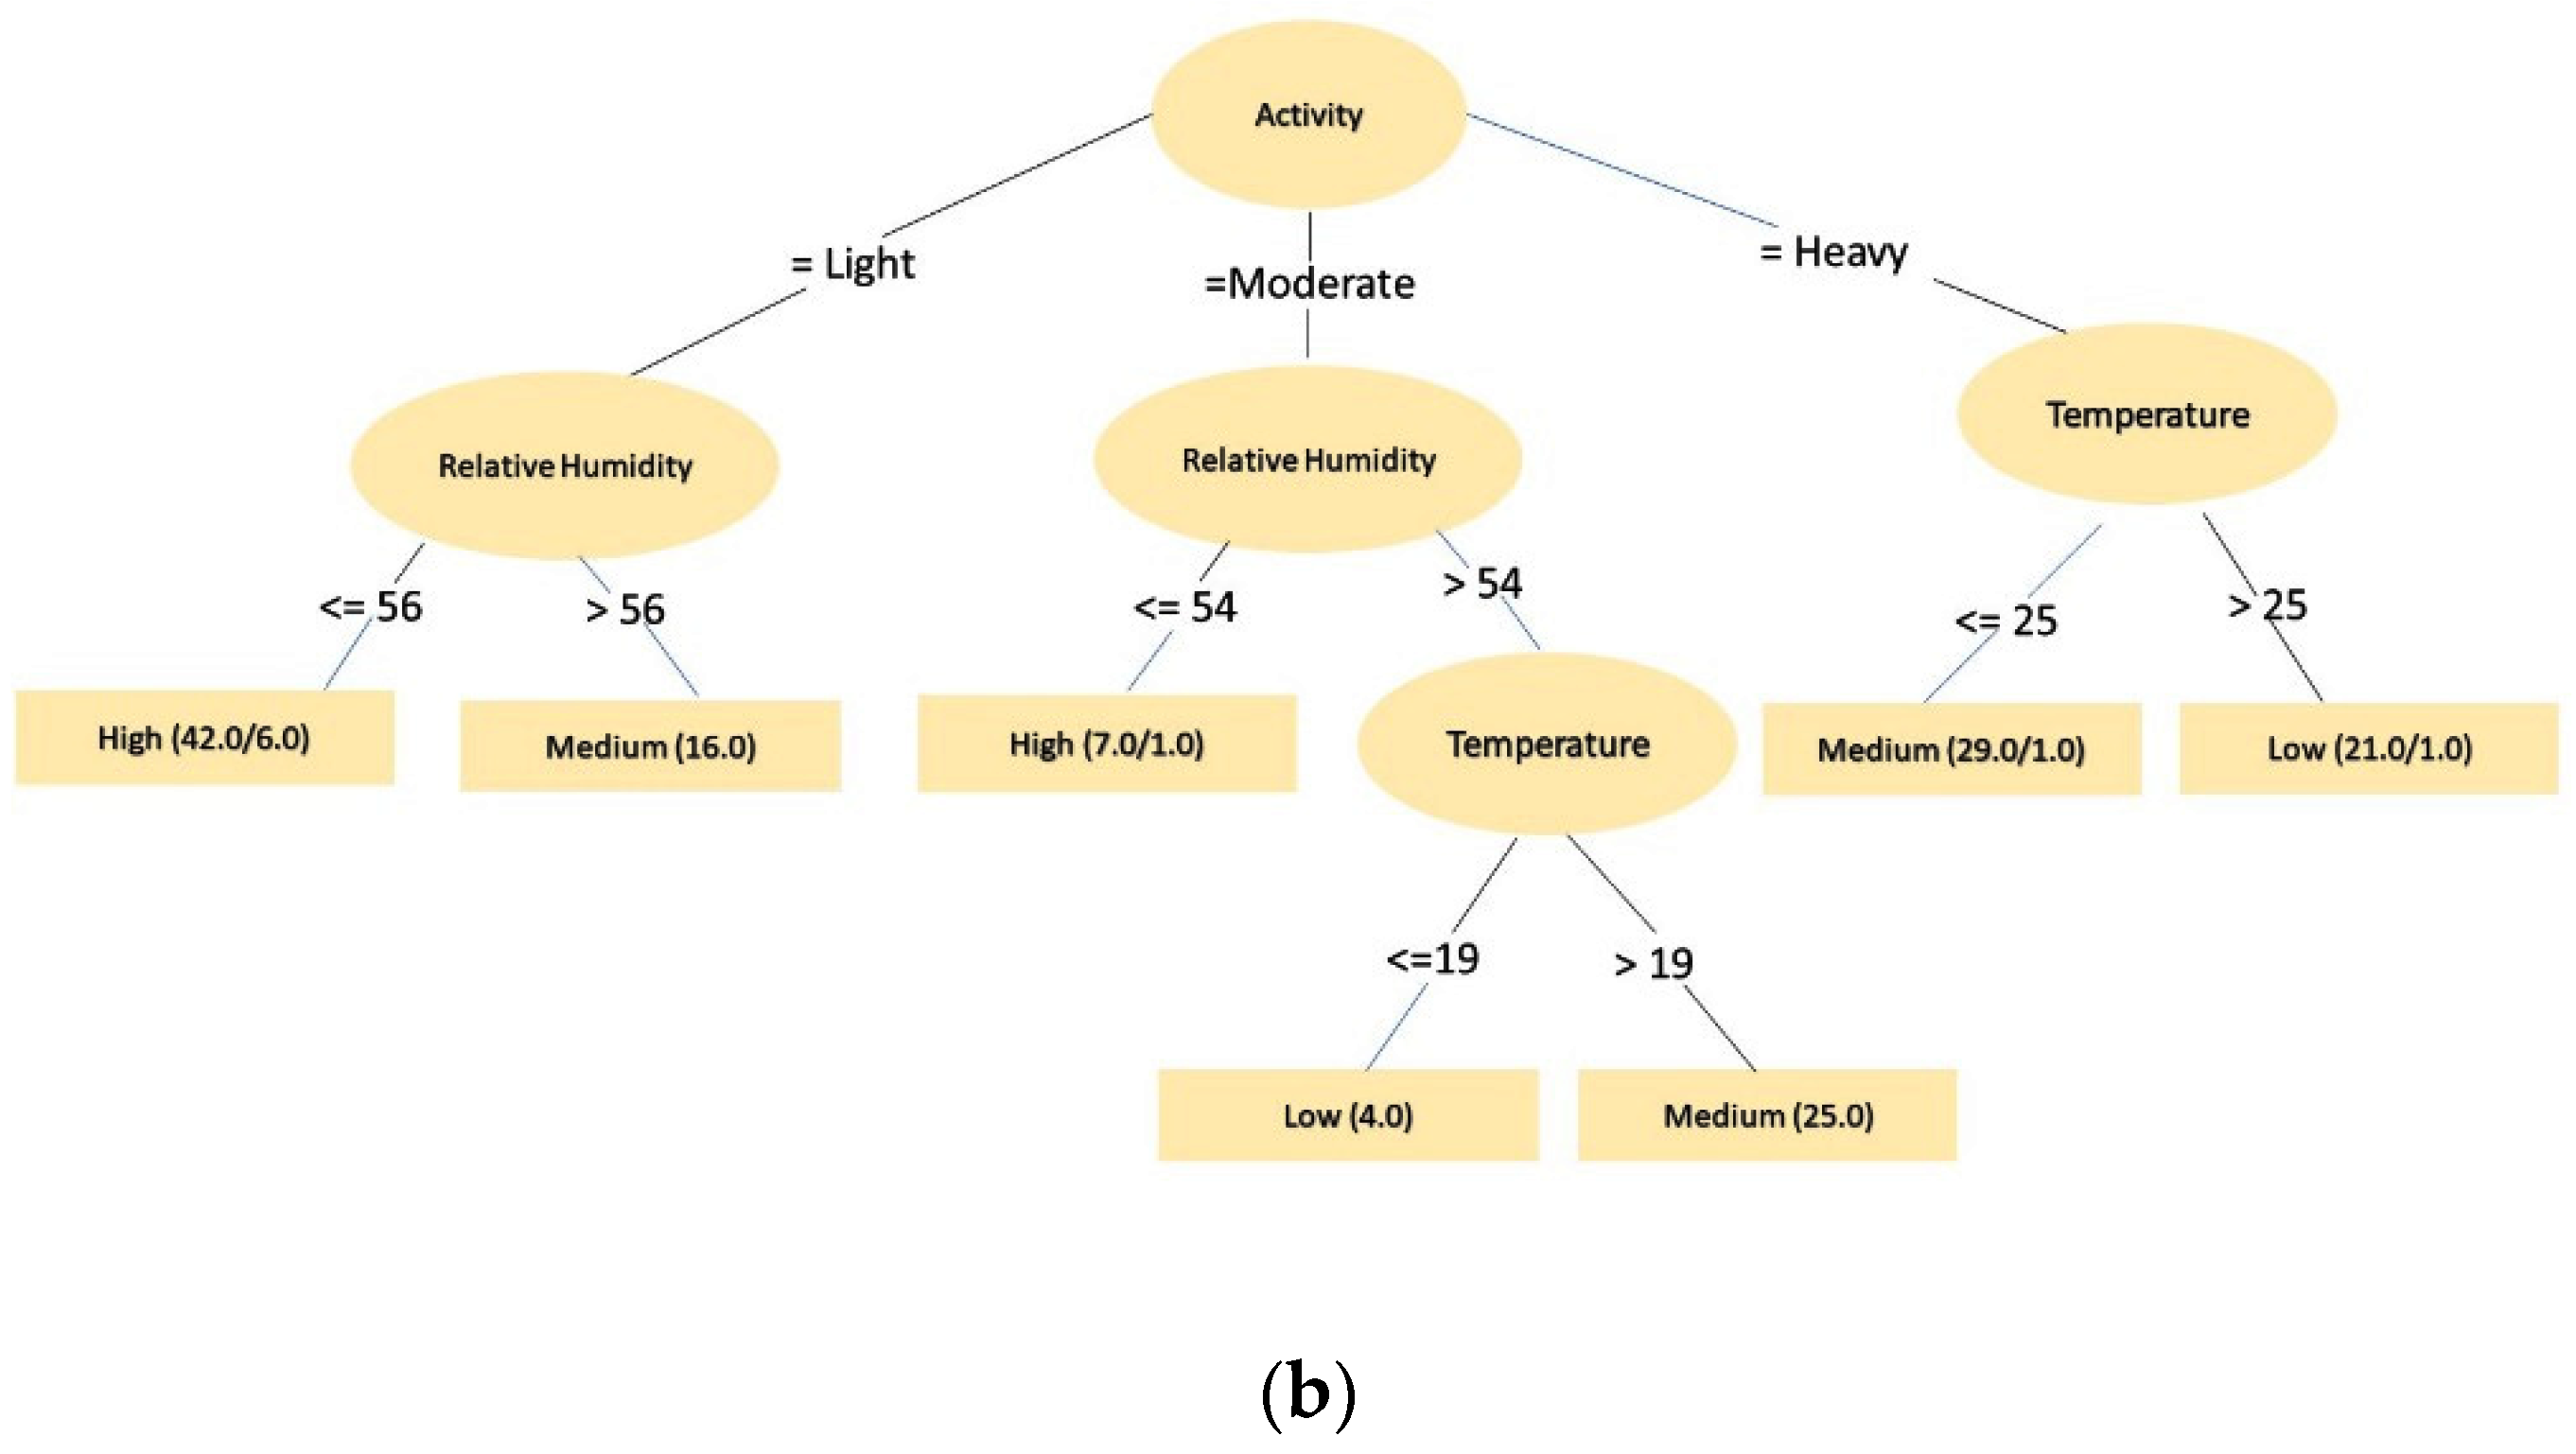
  • Activity (Light-Moderate-Heavy);
  • Indoor Temperature (°C);
  • Indoor Relative Humidity (%);
  • Geographical region;
  • Thermal comfort status—1 to 10 range where:
    • 1: completely uncomfortable;
    • 10: completely comfortable.
Data mining was performed by a simple interview about thermal comfort, with the following form, named Table 3.
Specifications for the survey were as follows:
  • To state, before starting the survey, that the answers are anonymous for employees and company, and that the results are only part of a research;
  • Minimum answering time to not interfere with personal activities;
  • To contemplate that the respondents have similar clothing or wear a uniform;
  • To contemplate that air velocity has no determining influence [8];
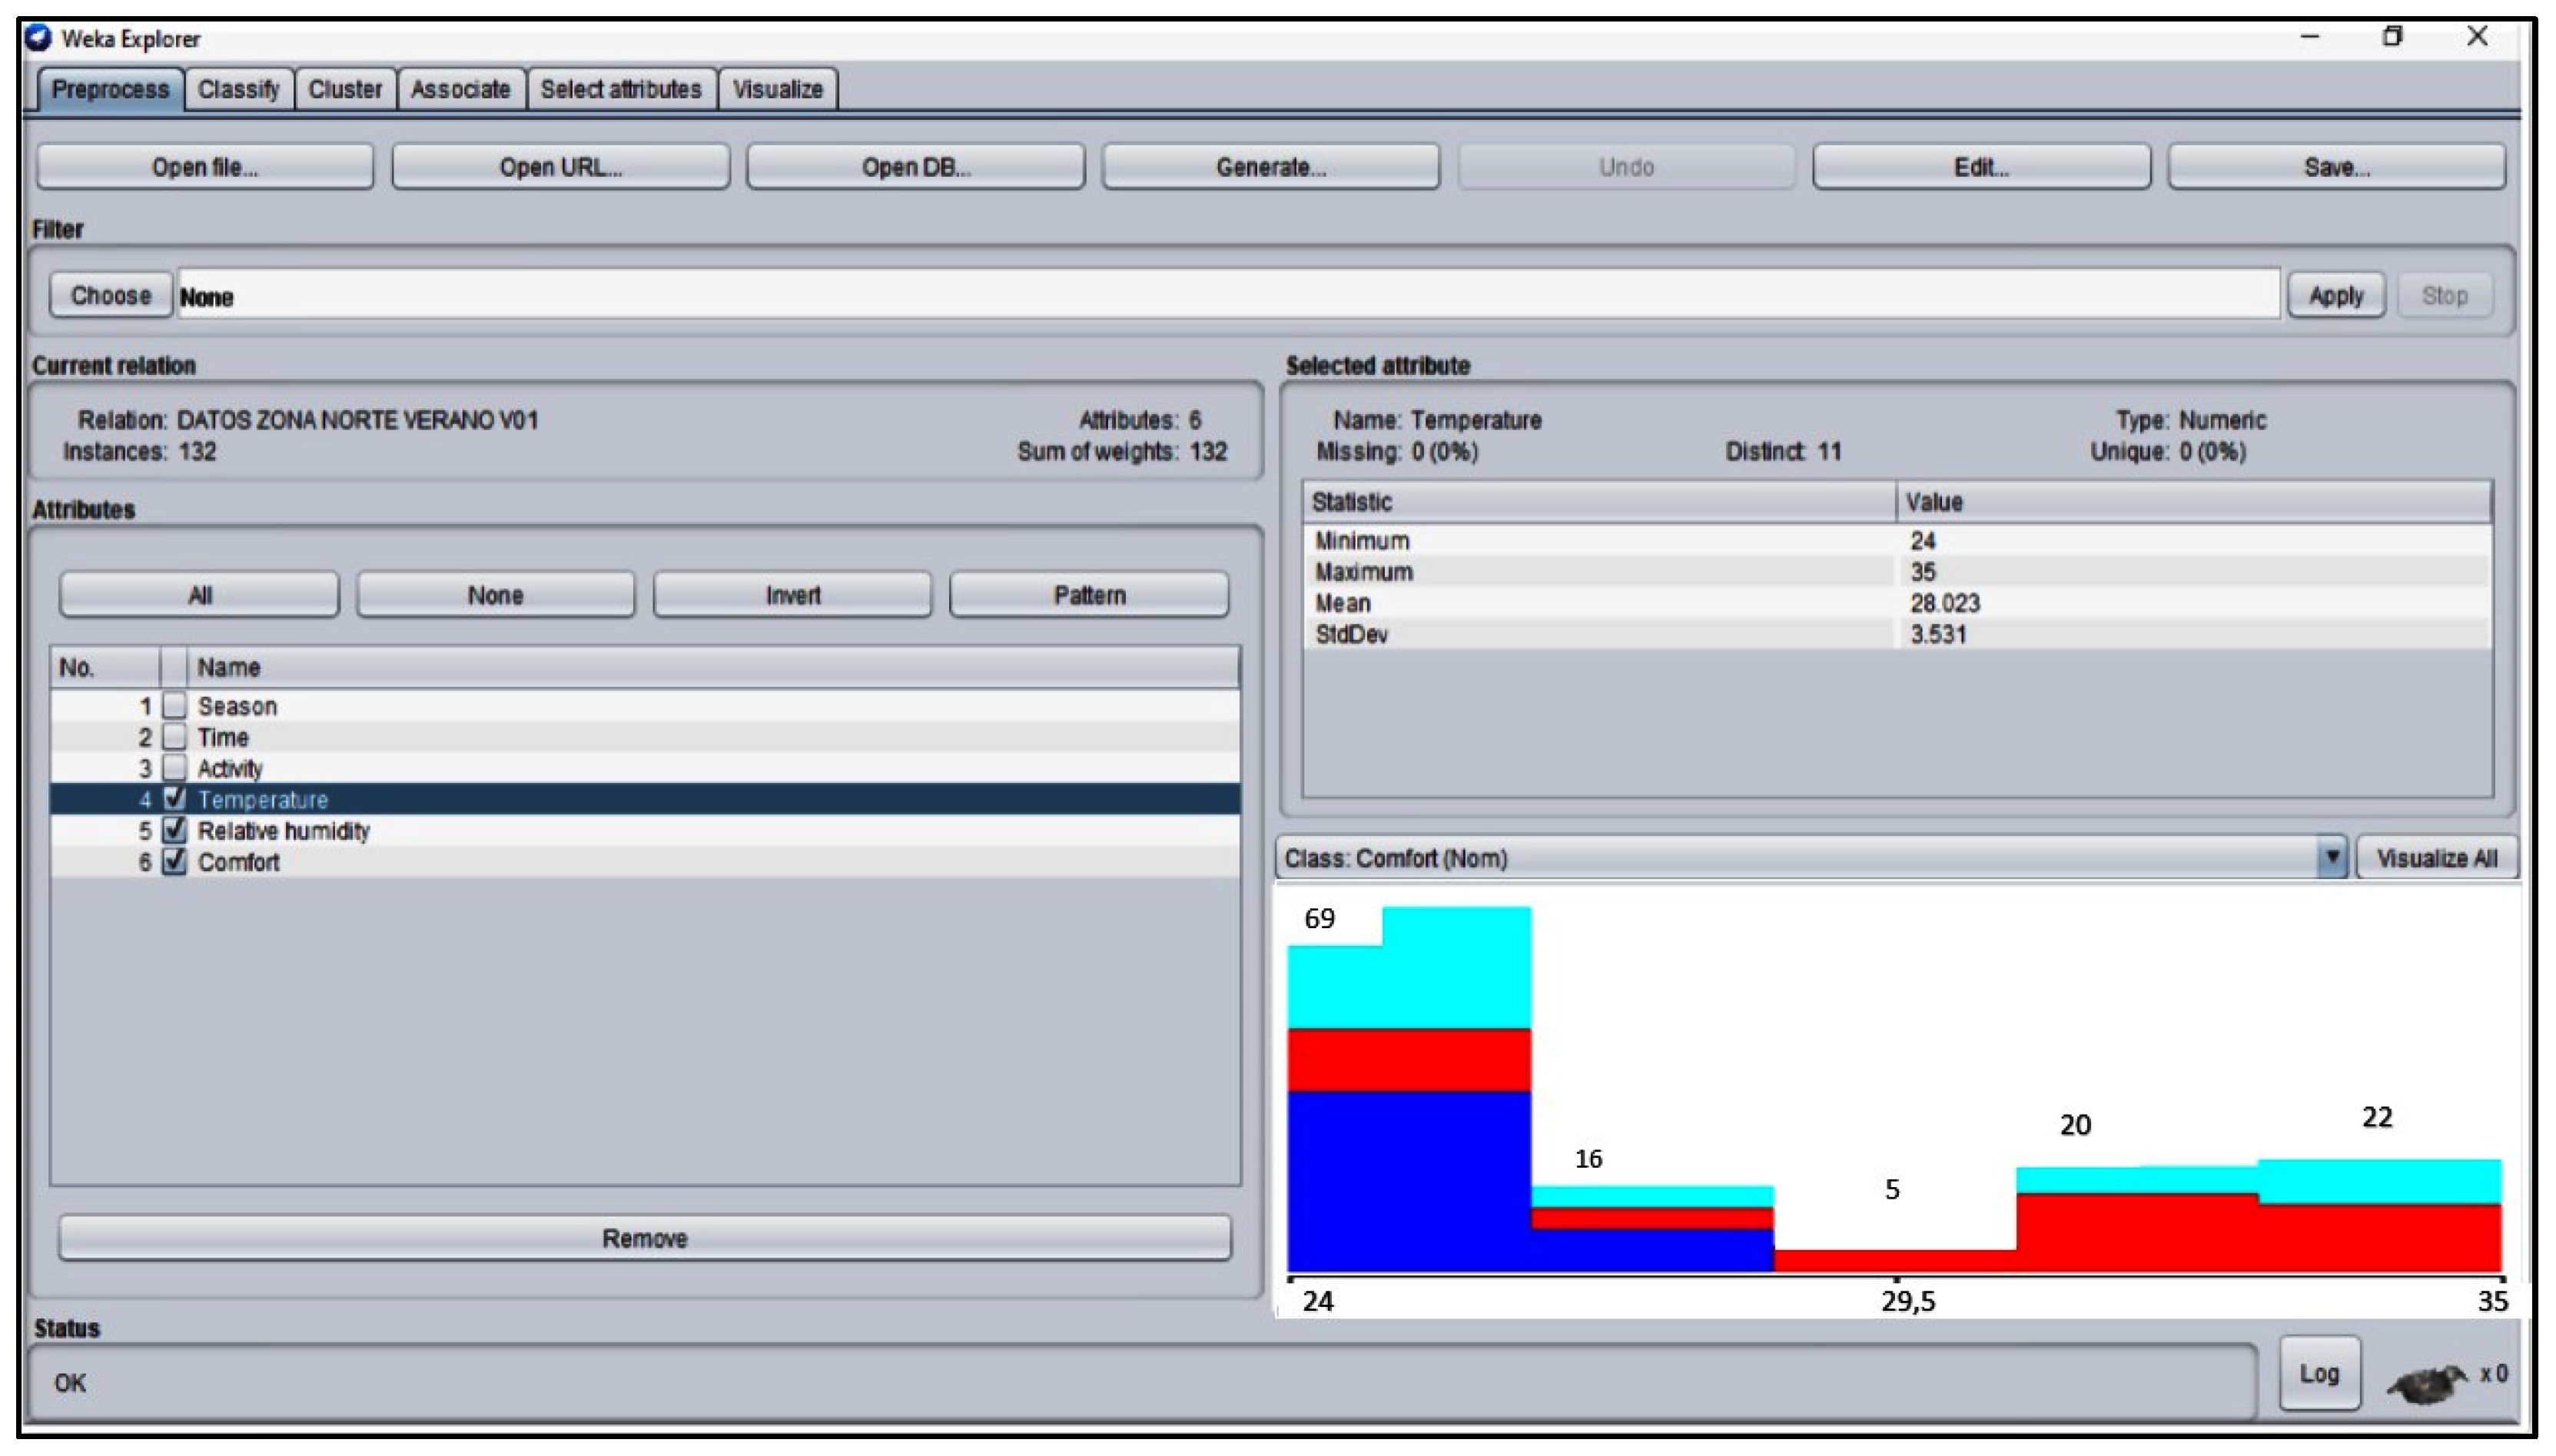
  • Temperature and relative humidity measurements are taken with a hygrometer specially designed for long-term follow-up of indoor climate conditions. This device used for air quality has a temperature sensor with a measuring range of 0–50 °C—resolution 0.1 °C (±0.15 °C from 0 to 20 °C and ±0.1 °C from 20 to 50 °C) and a relative humidity (RH) sensor with a measuring range of 0–100% RH—resolution 0.1% RH (±1.5% RH from 0 to 80% RH).
  • Comfort status is divided into three categories:
    • Low Comfort: Status from 1 to 4;
    • Medium Comfort: Status 5, 6, and 7;
    • High Comfort: Status 8, 9, and 10.
Subsequently, the Bayesian network techniques proposed were applied, with WEKA [37] and ELVIRA [38] tools.
Finally, the results obtained were validated, thus offering thermal comfort recommendations.

5. Materials and Methods

First, data preparation was done, thus creating the files to be exploited by WEKA and ELVIRA [39,40] tools. WEKA is a collection of automated learning and data preprocessing algorithms (Witten, I. et al. [41]) developed by the University of Waikato in New Zealand and has tools for data reprocessing, classification, regression, clustering, association rules, and visualization. It is an open-source software under the general public license of GNU (GPL).
ELVIRA is the result of a project funded by the Interministry Commission of Science and Technology (CICYT) and the Ministry of Science and Technology of Spain, of which researchers from different Spanish universities—the Universidad de Educación a Distancia (UNED) among others—were part. The tool “is used for editing and evaluating probabilistic chart models, specifically Bayesian networks and influence diagrams” (Díez Vegas, F. [42]).
Second, the data analysis was performed using the WEKA tool in Explorer mode, which allows data preprocessing, filter application, classification, clustering, association rule, attribute selection, and data visualization tasks (García Morate, D. [43]). As an example, Figure 1 shows the main window with a data file loaded with summer data. It is later replicated with winter data [39,40].
Third, a classification algorithm, J48 [43], was used to make a decision tree. In this sense, in an ideal situation with an infinite number of cases, predictions on quality measurements of model behavior would be perfect. In all practicality, the data set must be divided. Thus, stratified cross-validation was used. It is used when data are divided in an “n” number of parts and, for each division, the classifier is built with the remaining n−1 parts, and it is tested. The procedure is repeated for each of the parts. A cross-validation is said to be stratified when each of the parts has characteristics of the original sample. The sample attribute is then selected—generally the last one on the list, which is the variable to be determined in the classification. Cross-validation results for the J48 Classifier are available on ResearchGate [39,40].
When finished, a decision tree is shown in the “Visualize tree” option if it was created from the classifier. Figure 2a,b shows the decision trees for summer and winter, respectively.
Fourth, to execute ELVIRA, the data files were built from the WEKA decision trees for the northern area in summer and winter, as mentioned in “Evaluation, using Algorithms, of Thermal Comfort Levels in the Industrial Area of the Region of Buenos Aires, Argentina” [28].
As mentioned, ELVIRA allows editing and assessing probabilistic graphic models—specifically, Bayesian networks [42]. The Bayesian inference is a probabilistic reasoning that spreads the evidence effects through the network to know the “a posteriori” variable probability [17]. Bayesian classifiers can be considered a special case of a Bayesian network, in which there is a specific variable (class) and the rest of the variables are attributes.
Bayesian classifiers are widely used due to the advantages they offer, such as, their simplicity for building and understanding, their reliability when assessing irrelevant attributes, and their pondering of several properties to provide a final prediction.
In this study, data preprocessing was performed, followed by machine learning operations, in which the Naive-Bayes classifier (NBC) was chosen. This simple Bayesian classifier construes attributes as independent (i.e., there are no arches among them), as can be seen in Figure 3, so the probability can be obtained by the product of individual conditional probabilities of each attribute from the class node [17].
Then, in “Inference” mode, ELVIRA shows the networks with a priori probabilities [42]. From these inference networks, by choosing type of activity and time of day, different indoor temperature and relative humidity values can be tested, thus obtaining the thermal comfort level for those parameters.
Even though the simple Bayesian classifier works very well in many fields of knowledge and is very accurate, its performance decreases when attributes are not conditionally independent as expected [17]. This issue has not been shown in this study.

6. Results

The results from thermal comfort levels based on conditioned environment temperature and relative humidity, considering activity, time of day and season variables, are shown in the inference networks in Figure 4 and Figure 5 for the northern area of Argentina, where probability for each value is presented in two forms: (a) by means of a number and (b) by means of a bar proportional to the probability. Since no new data were introduced, the probabilities are a priori (Díez Vegas, F. [42]), where the only probability calculated is thermal comfort. These networks belong to the “initial case”.
From these inference networks, specific temperature, relative humidity, activity, time schedule, and season values were tested to know the predictive value of thermal comfort. Thus, the first evidence case was generated and identified with a color. If another value set were to be introduced, a second evidence case would be generated with a different color. These evidence cases can be filed and affect the network. Figure 6 shows the first evidence case for summer.
Table 4 shows data and probabilities taken from the inference network in Figure 6 for the first evidence case.
Figure 7 shows the first evidence case for winter as example:
With the data mined from the first evidence case for winter, the following information was obtained: at 10.00 h, and with temperatures ranging from 19 °C to 25 °C and relative humidity < 54%, comfort is high for light activities, as shown in Table 5.
It allows “the graphic observation of how each finding’s impact affects the probabilities of other variables, which helps to understand how a Bayesian network works and, if we want to improve net reliability, we can modify the structure or probabilities when the results are not those expected” [42].

7. Discussion

The thermal comfort results from the inference networks were compared with the work environments selected for data mining.
Furthermore, new values obtained from the surveys in different industries of the northern area were tested, thus creating new evidence cases whose results are comparable with those provided by the staff in the working environment, so no correction to the network probabilities was necessary.
It can be noted that, apart from the possible building design optimization, thermal comfort depends on temperature, work type, time of day, season, and relative humidity percentage.
In the northern area of Argentina, due to its warm subtropical climate, staff can endure maximum temperatures of up to 30 °C within humidity limits without their optimal comfort level being affected. It can be concluded that human beings have a certain climate adaptability.
It is also worth noting that comfort parameters are similar for both summer and winter as for the different activities in the northern area. It can be concluded that this characteristic is due to such adaptability.
The J48 WEKA classifier obtained results corresponding to those informed in the study areas and was the basis for the network formulation with ELVIRA software and the result verification.
The use of Bayesian inference techniques reduces error probabilities for the results obtained with statistical analysis and offers a greater number of temperature–humidity relationships based on the variables (activity, time of day, season) to reach a specific comfort level.
To verify what has been previously mentioned, a comparative study between different adaptive models (Gómez-Azpeitia, L. et al. [14]) and the values obtained from the data mined in the study area by using linear regression techniques was performed. In the case of adaptive models, comfort temperature (tn) was calculated based on outdoor mean temperature (tme) [44]. For linear regression technique calculations, a partial data set [45] was used without distinguishing activity type, time schedule, season, or humidity percentage. Table 6 and Table 7 respectively show results for summer and winter.
When analyzing Table 6 and Table 7, it can be noted that the differences between the obtained results are not significantly different between the adaptive models and those obtained from linear regression in our case study [45]. However, it should be considered that results calculated with linear regression were obtained from a partial data set since adaptive models only provide one comfort temperature without considering variables such as time of year, time schedule, or activity in the conditioned industry premises.
If these results are compared with those obtained—for example, with the first evidence case from Bayesian networks (Table 4 and Table 5)—it can be concluded that they are within the same range, yet the network provides more information such as temperature, relative humidity percentage, activity type, time schedule, and time of year for a specific comfort probability.
On the other hand, the Fanger or quantitative method does not consider the actual working conditions since it is based on a static model of heat exchange, nor does it consider human environment adaptability.
The Bayesian inference model’s contribution is offering a variety of design parameter alternatives (indoor temperature/relative humidity percentage relationships) for different working conditions in industries while considering time and season.

8. Conclusions

ICTs, especially those techniques linked to AI use in the Industry 4.0 context, are an opportunity to improve thermal comfort levels—specifically, data analysis and calculated probability prediction algorithms from data mining [1,2].
These analysis techniques can be extended and repeated in any geographical area if the software used are fed with data and characteristics from the area.
Having a work methodology for determining industrial thermal comfort parameters for any geographical area would be an asset for those designing heating, ventilation, and air conditioning (HVAC) installations, thus allowing the use of different temperature/relative humidity pairs to obtain the same hygrothermal comfort level.
According to a research study on energy efficiency conducted by Khalilnejad, A.; French, R.; and Abramson, A. [46], commercial buildings “consumed 36% of electricity, or 1.35 trillion kWh, in the United States in 2017, and almost 30% of that energy was wasted. Much of this loss can be linked to inefficient heating, ventilation, and air conditioning (HVAC) systems. If operational conditions are improved, significant energy savings can be achieved”.
HVAC installation design by using specific parameters as those obtained from the work methodology in our study can imply energy savings since systems would not overwork, thus increasing energy efficiency [47,48].
The National Program of Rational and Efficient Energy Use of Argentina (Decree 140/2007) [49] shares this aim. The decree item related to industries mentions its aim as “contributing to increase the area’s competitiveness by introducing management tools that would reduce costs due to the efficient use of energy and product resources”.
For occupational health and safety professionals, it allows access to tools for improving working positions, which would prevent risks and diseases, to improve the employees’ wellbeing and quality of life and thus boosting performance due to the workers’ hygrothermal comfort [6,7].
The limitations observed while conducting the study are the difficulty of data mining, which was performed with personal interviews, and verification at the workplace, which was very time-consuming. On the other hand, the data mined did not consider the basal physiological factors related to thermal comfort.
Therefore, an interesting line of work to follow is the programming of a mobile application that would allow the recording of indoor temperature, indoor relative humidity of the conditioned premises, and comfort status of a person in their workplace by means of voice command, without conducting personal interviews. It would allow a greater amount of real-time data that could be easily obtained in any workplace.
Another contribution, as a new research line, would be including the records of basal physiological parameters in the inference model.
In the Industry 4.0 context, if an application for interacting with users and working environment conditions and physiological parameters linked to thermal comfort with sensors was integrated with mobile devices, data that could be independently mined with automated learning techniques would be obtained to allow thermal system interaction and control in an intelligent control loop.
Therefore, all devices (air conditioners, enclosures, ventilations, etc.) would be started to modify environmental hygrothermal conditions to achieve comfort status in the Industry 4.0 paradigm.
In this sense, Diogo Cardoso and Luís Ferreira mention that “artificial intelligence tools, specifically automated learning, show great potential for analyzing great amounts of data, now readily available, to reduce upkeeping costs and increase operational performance and decision-making support” [50].
All of what has been previously mentioned would mean industry/company benefits, thus boosting economic growth in line with the environment and supporting sustainable development by improving energy efficiency for thermal comfort.

Author Contributions

Conceptualization, P.I.B.; methodology, P.I.B., M.A.S. and C.G.-G.; investigation, P.I.B., M.A.S. and C.G.-G.; resources, P.I.B.; writing—original draft preparation, P.I.B.; writing—review and editing, P.I.B., M.A.S. and C.G.-G.; supervision, M.A.S. and C.G.-G.; project administration, P.I.B., M.A.S. and C.G.-G. All authors have read and agreed to the published version of the manuscript.

Funding

Universidad Nacional de Educación a Distancia (UNED).

Data Availability Statement

Links to publicly archived datasets: Thermal Comfort—Northern area of Argentina—Summer, ResearchGate, 2021, https://doi.org/10.13140/RG.2.2.28981.60642. https://www.researchgate.net/publication/355651806_Thermal_Comfort_-_Northern_area_of_Argentina-Summer (accessed on 4 November 2021). Thermal Comfort—Northern area of Argentina—Winter, ResearchGate, 2021, https://doi.org/10.13140/RG.2.2.20592.99848. https://www.researchgate.net/publication/355651613_Thermal_Comfort_-_Northern_area_of_Argentina_-_Winter (accessed on 4 November 2021). Thermal Comfort—Northern area of Argentina—Input Data WEKA—Summer, ResearchGate, 2021, https://doi.org/10.13140/RG.2.2.17440.71688. https://www.researchgate.net/publication/356007548_Thermal_Comfort-_Northern_area_of_Argentina-_Input_Data_WEKA_-Summer (accessed on 4 November 2021). Thermal Comfort—Northern area of Argentina—Input Data WEKA—Winter, ResearchGate, 2021, https://doi.org/10.13140/RG.2.2.13043.25125. https://www.researchgate.net/publication/355652295_Thermal_Comfort-_Northern_area_of_Argentina-_Input_Data_WEKA_-_Winter (accessed on 4 November 2021). Dataset—Comfort Temperature—Northern area of Argentina-Linear Regression, ResearchGate, 2021, https://doi.org/10.13140/RG.2.2.35692.49288. https://www.researchgate.net/publication/355652081_Data_set_-_Comfort_Temperature_-_Northern_area_of_Argentina-Linear_Regression (accessed on 4 November 2021).

Acknowledgments

This paper is based on the ongoing research of the lead author’s Ph.D. thesis, under preparation at the Escuela Internacional de Doctorado, Universidad Nacional de Educación a Distancia (UNED); the authors, therefore, wish to express their gratitude for the support from that Institution. Additionally, the authors thank the Secretariat of Science and Technology, Universidad de Morón, for its support through the 2016-PID 01-002 project.

Conflicts of Interest

The authors declare no conflict of interest.

References

  1. Patiño Vengoechea, J.G. The fourth industrial revolution. Ing. USBMed 2019, 10, 1–2. [Google Scholar] [CrossRef] [Green Version]
  2. Montes, R.; Melero, F.J.; Palomares, I.; Alonso, S.; Chiachío, J.; Chiachío, M.; Molina, D.; Martínez-Cámara, E.; Tabik, S.; Herrera, F. Artificial Intelligence and Digital Technologies for the SDGs. Publication of the Royal Academy of Engineering. 2021. Available online: https://issuu.com/raing/docs/ia_y_tecnolog_as_digitales_para_los_ods (accessed on 16 March 2021).
  3. Cotrino, A.; Sebastián, M.A.; Gonzalez-Gaya, C. Industry 4.0 Roadmap: Implementation for Small and Medium-Sized Enterprises. Appl. Sci. 2020, 10, 8566. [Google Scholar] [CrossRef]
  4. ISO. Reference Number ISO 7730: 2005 (E). Third Edition 2005-11-15. Ergonomics of the Thermal Environment: Analytical Determination and Interpretation of Thermal Comfort by Calculating the PMV and PPD Indices and the Local Thermal Comfort Criteria. 2005. Available online: https:/www.iso.org/standard/39155.html (accessed on 29 March 2021).
  5. Picón-Jaimes, Y.A.; Orozco Chinome, J.E.; Molina-Franky, J.; Franky-Rojas, M.P. Central control of body temperature and its alterations: Fever, hypertemia and hypothermia. MedUNAB 2020, 23, 118–130. [Google Scholar] [CrossRef] [Green Version]
  6. Thermal Conditioning of Buildings—Law 13059 Application Manual—Housing Institute—Buenos Aires. Infrastructure-BA. Available online: https://procesosconstructivos.files.wordpress.com/2013/02/ley-13059-manual_ac_higrotermico.pdf (accessed on 27 November 2021).
  7. Occupational Health, Ministry of Health, Argentina. 2020. Available online: https://www.argentina.gob.ar/salud/ocupacional (accessed on 29 March 2021).
  8. Quadri, N. Air Conditioning and Heating Installation, 8th ed.; Editorial Alsina, Buenos Aires: Alsina, Argentina, 2008; Available online: https://www.academia.edu/40005843/Quadri_Instalaciones_de_Aire_Acondicionado_y_Calefaccion (accessed on 27 November 2021).
  9. ASHRAE. Thermal Environmental Conditions for Human Occupancy. ASHRAE Standard 55-2004. 2004. Available online: http://www.ditar.cl/archivos/Normas_ASHRAE/T0080ASHRAE-55-2004-ThermalEnviromCondiHO.pdf (accessed on 11 April 2021).
  10. Fanger, P.O. Assessment of man’s thermal comfort in practice. Br. J. Ind. Med. 2021, 30, 313–324. [Google Scholar] [CrossRef] [Green Version]
  11. Diego-Mas, J.A. Evaluation of thermal comfort with the Fanger method. In Ergonautas; Polytechnic University of Valencia: Valencia, Spain, 2015; Available online: http://www.ergonautas.upv.es/metodos/fanger/fanger-ayuda.php (accessed on 16 April 2021).
  12. Brager, G.; De Dear, R. Thermal adaptation in the built environment: A literature review. Energy Build. 1998, 27, 83–96. [Google Scholar] [CrossRef] [Green Version]
  13. Nicol, J.F.; Humphreys, M.A. Adaptive Thermal Comfort and Sustainable Thermal Standards for Buildings. Energy Build. 2002, 34, 563–572. [Google Scholar] [CrossRef]
  14. Gómez-Azpeitia, L.; Bojorquez, G.; Ruiz Torres, R. Thermal comfort: Two confronted theoretical focuses. J. Sci. Res. Archit. 2007, 2, 45–57. [Google Scholar]
  15. Ma, N.; Chen, L.; Hu, J.; Perdikaris, P.; Braham, W. Adaptive behavior and different thermal experiences of real people: A Bayesian neural network approach to thermal preference prediction and classification. Build. Environ. 2021, 198, 107875. [Google Scholar] [CrossRef]
  16. Skiba, M.; Mrówczyńska, M.; Sztubecka, M.; Bazan-Krzywoszańska, A.; Kazak, J.; Leśniak, A.; Janowiec, F. Probability estimation of the city’s energy efficiency improvement as a result of using the phase change materials in heating networks. Energy 2021, 228, 120549. [Google Scholar] [CrossRef]
  17. Sucar, L. Redes Bayesianas. Chapter 1. INAOE. Available online: https://ccc.inaoep.mx/~esucar/Clases-mgp/caprb.pdf (accessed on 10 September 2021).
  18. Atmaca, I.; Koçak, S. Içletmelerde Farkli. Metabolik Aktivite Düzeylerinde Çaliçanlar Için Isil Konfor Bölgelerinin Tespiti. Mühendis y Makina 2013, 54, 26–32. [Google Scholar]
  19. Sun, C.; Lian, Z.; Lan, L.; Zhang, H. Research on the temperature range for thermal comfort in non-uniform environments. HVAC R Res. 2013, 19, 103–112. [Google Scholar]
  20. Martínez Molina, A.; Boarin, P.; Tort-Ausina, I.; Vivancos, J. Assessing visitors’ thermal comfort in historic museum buildings: Results from a Post-Occupancy Evaluation on a case study. Build. Environ. 2018, 132, 311–322. [Google Scholar] [CrossRef] [Green Version]
  21. Singh, M.K.; Ooka, R.; Rijal, H.B.; Kumar, S.; Kumar, A.; Mahapatra, S. Progress in thermal comfort studies in classrooms over last 50 years and way forward. Energy Build. 2019, 188, 149–174. [Google Scholar] [CrossRef]
  22. Martínez Molina, A.; Boarin, P.; Tort-Ausina, I.; Vivancos, J. Post-occupancy evaluation of a historic primary school in Spain: Comparing PMV, TSV and PD for teachers’ and pupils’ thermal comfort. Build. Environ. 2017, 117, 248–259. [Google Scholar] [CrossRef]
  23. Forgiarini, R.; Ghisi, E. Predicting thermal comfort in office buildings in a Brazilian temperate and humid climate. Energy Build. 2017, 144, 152–166. [Google Scholar] [CrossRef]
  24. Jia, X.; Cao, B.; Zhu, Y.; Liu, B. Thermal comfort in mixed-mode buildings: A field study in Tianjin, China. Build. Environ. 2020, 185, 107244. [Google Scholar] [CrossRef]
  25. Gallardo, A.; Palme, M.; Lobato-Cordero, A.; Beltran, R.; Gaona, G. Evaluation of thermal comfort in a naturally conditioned office in a temperate climate zone. Buildings 2016, 6, 27. [Google Scholar] [CrossRef] [Green Version]
  26. Piasecki, M.; Fedorczak-Cisak, M.; Furtak, M.; Biskupski, J. Experimental Confirmation of the Reliability of Fanger’s Thermal Comfort Model—Case Study of a Near-Zero Energy Building (NZEB) Office Building. Sustainability 2019, 11, 2461. [Google Scholar] [CrossRef] [Green Version]
  27. Benito, P.; Agnoli, D.; Fontela, M.; Murgo, C.; Calivar, L.; Caminos, D.; Sattolo, I. Climate Change, Environment and Biosphere: Thermal Comfort Levels. Rev. De Investig. Científicas De La Univ. De Morón 2018, 2, 45–49. [Google Scholar] [CrossRef]
  28. Benito, P.; González-Gaya, C.; Sebastián Pérez, M.A. Evaluation, using Algorithms, of Thermal Comfort Levels in the Industrial Area of the Region of Buenos Aires. In Proceedings of the ICPME 2020 [172]-32th International Congress on Project Management and Engineering, Alcoi, Spain, 7–10 July 2020; Available online: http://dspace.aeipro.com/xmlui/handle/123456789/2555 (accessed on 5 March 2021).
  29. Argentina. Law 13059/03 Regulated by Decree No. 1030/20. Available online: https://normas.gba.gob.ar/documentos/VGONKpUW.html (accessed on 21 February 2021).
  30. Argentina. Law No. 4458 on Standards of Thermal Conditioning in Building Construction. Available online: http://www2.cedom.gob.ar/es/legislacion/normas/leyes/ley4458.html (accessed on 17 April 2021).
  31. Argentina. Law No. 19587/72 on Occupational Safety and Health. Available online: http://servicios.infoleg.gob.ar/infolegInternet/verNorma.do?id=17612 (accessed on 29 March 2021).
  32. Argentina. Regulatory Decree No. 351/79. Available online: http://servicios.infoleg.gob.ar/infolegInternet/anexos/30000-34999/32030/dto351-1979-anexo1.htm (accessed on 29 March 2021).
  33. Benito, P.; Gonzalez Gaya, C.; Sebastian, M.A. Thermal Industrial Comfort Analysis According to Different Regulations, Chapter 04; DAAAM International Scientific Book; Katalinic, B., Ed.; DAAAM International: Vienna, Austria, 2019; pp. 043–054. Available online: https://www.daaam.info/Downloads/Pdfs/science_books_pdfs/2019/Sc_Book_2019-004.pdf (accessed on 26 March 2021).
  34. Kralikova, R.; Wessely, E. Impact of the Environmental Factors and its Effects on Productivity and Health. In Proceedings of the 29th DAAAM International Symposium, Zadar, Croatia, 24–27 October 2018; Katalinic, B., Ed.; DAAAM International: Vienna, Austria, 2018; pp. 0119–0124. Available online: https://www.daaam.info/Downloads/Pdfs/proceedings/proceedings_2018/016.pdf (accessed on 26 March 2021).
  35. Thermal Comfort—Northern Area of Argentina—Summer, ResearchGate. 2021. Available online: https://www.researchgate.net/publication/355651806_Thermal_Comfort_-_Northern_area_of_Argentina-Summer (accessed on 4 November 2021).
  36. Thermal Comfort—Northern Area of Argentina—Winter, ResearchGate. 2021. Available online: https://www.researchgate.net/publication/355651613_Thermal_Comfort_-_Northern_area_of_Argentina_-_Winter (accessed on 4 November 2021).
  37. WEKA Download and Install. Available online: https://sourceforge.net/projects/weka/ (accessed on 27 November 2021).
  38. Elvira Software Installation. Available online: http://www.ia.uned.es/~elvira/instalar/instalar.html (accessed on 10 January 2021).
  39. Thermal Comfort- Northern Area of Argentina—Input Data WEKA -Summer, ResearchGate. 2021. Available online: https://www.researchgate.net/publication/356007548_Thermal_Comfort-_Northern_area_of_Argentina-_Input_Data_WEKA_-Summer (accessed on 4 November 2021).
  40. Thermal Comfort- Northern Area of Argentina- Input Data WEKA—Winter, ResearchGate. 2021. Available online: https://www.researchgate.net/publication/355652295_Thermal_Comfort-_Northern_area_of_Argentina-_Input_Data_WEKA_-_Winter (accessed on 4 November 2021).
  41. Witten, I.; Frank, E.; Hall, M.; Pal, C. Data Mining: Practical Machine Learning Tools and Techniques, 4th ed.; Morgan Kaufmann: Burlington, MA, USA, 2017; ISBN 9780128042915. [Google Scholar]
  42. Díez Vegas, F. Elvira. Introductory Manual. Version 0.13. Available online: http://www.ia.uned.es/~fjdiez/bayes/elvira/manual/manual.html (accessed on 5 March 2021).
  43. García Morate, D. WEKA Manual. 2004. Available online: https://knowledgesociety.usal.es/sites/default/files/MANUAL%20WEKA.pdf (accessed on 29 March 2021).
  44. AccuWeather. Available online: https://www.accuweather.com/ (accessed on 17 April 2021).
  45. Data Set—Comfort Temperature—Northern Area of Argentina-Linear Regression, ResearchGate. 2021. Available online: https://www.researchgate.net/publication/355652081_Data_set_-_Comfort_Temperature_-_Northern_area_of_Argentina-Linear_Regression (accessed on 4 November 2021).
  46. Khalilnejad, A.; French, R.; Abramson, A. Data-driven evaluation of HVAC operation and savings in commercial buildings. Appl. Energy 2020, 278, 115505. [Google Scholar] [CrossRef]
  47. Malinauskaite, J.; Jouhara, H.; Egilegor, B.; Al-Mansour, F.; Ahmad, L.; Pusnik, M. Energy efficiency in the industrial sector in the EU, Slovenia, and Spain. Energy 2020, 208, 118398. [Google Scholar] [CrossRef] [PubMed]
  48. Directive (EU) 2018/2002 of the European Parliament and of the Council of December 11, 2018 Amending Directive 2012/27/EU on Energy Efficiency. Available online: https://www.boe.es/doue/2018/328/L00210-00230.pdf (accessed on 29 March 2021).
  49. Argentina. Decree 140/2007: National Program for the Rational and Efficient Use of Energy. Available online: http://servicios.infoleg.gob.ar/infolegInternet/anexos/135000-139999/136078/norma.htm (accessed on 18 January 2021).
  50. Cardoso, D.; Ferreira, L. Application of Predictive Maintenance Concepts Using Artificial Intelligence Tools. Appl. Sci. 2021, 11, 18. [Google Scholar] [CrossRef]
Figure 1. Main window of WEKA Explorer with a loaded data file.
Applsci 11 11979 g001
Figure 2. (a) Classifier Tree Visualizer—Summer. (b) Classifier Tree Visualizer—Winter.
Applsci 11 11979 g002aApplsci 11 11979 g002b
Figure 3. Bayesian network.
Applsci 11 11979 g003
Figure 4. ELVIRA—Inference Network—A priori probabilities—Northern area, Summer.
Applsci 11 11979 g004
Figure 5. ELVIRA—Inference Network—A priori probabilities—Northern area, Winter.
Applsci 11 11979 g005
Figure 6. ELVIRA—Inference Network—First evidence case—Northern area, Summer.
Applsci 11 11979 g006
Figure 7. ELVIRA—Inference Network—First evidence case—Northern area, Winter.
Applsci 11 11979 g007
Table 1. Thermal comfort models and their limitations.
AuthorModelMethodTechniquesToolsLimitations
Fanger, P.O. [10]Mathematical/
Analytical
QuantitativeExperimentalLab experiment
Controlled conditions for data collection by means of measurements
Static model of heat exchange
People resting
Mechanically conditioned buildings
Not industry specific
It does not consider human adaptability to the environment
Brager, G. and De Dear, R. [12]
Nicol, F. and Humphreys, M. [13]
AdaptativeQualitativeField ExperimentationStatistical models are used. In general, linear regressionIt is subjective
They consider comfort temperature based on outdoor dry-bulb temperature
They do not consider RH%
Not industry specific
Gomez-Azpeitia, L. et al. [14]
Singh, M.K. et al. [21]
Review papers Data search and location
Decision criteria
Analysis and evaluationThey review and compare the prevailing quantitative and qualitative approachesLiterature review papers show the limitations of the models used, which cannot offer hygrothermal comfort
Table 2. Contributions to the thermal comfort models.
AuthorsCharacteristicsLimitations
Atmaca, I. y Koçak, S. [18]
Sun et al. [19]
Martínez-Molina et al. [20,22]
Forgiarini, R. and Ghisi, E. [23]
Jia, X. et al. [24]
Gallardo, A. et al. [25]
Piasecki, M. et al. [26]
Authors introduce case studies for different building types and/or specific aims, with mechanical conditioning, natural ventilation, or mixed mode.
They use the qualitative and/or quantitative method to determine the thermal comfort level or to compare and/or verify both methods.
From these studies, it can be concluded that there still are many domain areas that are not included in thermal comfort analysis.
The limitations of both the qualitative and quantitative approaches are presented.
Table 3. Thermal Comfort Interview.
Thermal Comfort Form—Summer/Winter
Region:
Company/Institution
Address:
Email Address:
Area:
Activity:
Day and Time:
PersonnelTemperature
(°C)
Relative Humidity (%)Status
(1 to 10)
Table 4. Results from the first evidence case—Summer.
SeasonTimeTemperatureR.H.%ActivityComfort
Summer18.00 h.>25 °C and ≤30 °C>52% and ≤74%Moderate100% Medium
Table 5. Results from the first evidence case—Winter.
SeasonTimeTemperatureR.H.%ActivityComfort
Winter10.00 h>19 °C and ≤25 °C≤54%Light100% High
Table 6. Comfort temperatures (tn) for summer obtained from adaptive models and linear regression.
Authortn = m × (tme)+btem (°C)tn (°C)
Humphreys (1976) [14]tn = 0.534 × (tme) + 11.927.826.7
Auliciems (1981) [14]tn = 0.31 × (tme) + 17.627.826.2
Griffiths (1990) [14]tn = 0.534 × (tme) + 12.127.826.9
Nicol et al. (1993) [14]tn = 0.38 × (tme) + 17.027.827.6
Brager- De Dear (1998) [14]tn = 0.31 × (tme) + 17.827.826.4
Humphreys-Nicol (2000) [14]tn = 0.54 × (tme) + 13.527.828.5
Linear regression-North Zonetn = 0.541 × (tme) + 11.9727.827.0
Table 7. Comfort temperatures (tn) for winter obtained from adaptive models and linear regression.
Authortn = m × (tme) + btem (°C)tn (°C)
Humphreys (1976) [14]tn = 0.534 × (tme) + 11.922.624.0
Auliciems (1981) [14]tn = 0.31 × (tme) + 17.622.624.6
Griffiths (1990) [14]tn = 0.534 × (tme) + 12.122.624.2
Nicol et al. (1993) [14]tn = 0.38 × (tme) + 17.022.625.6
Brager- De Dear (1998) [14]tn = 0.31 × (tme) + 17.822.624.8
Humphreys-Nicol (2000) [14]tn = 0.54 × (tme) + 13.522.625.7
Linear regression-North Zonetn = 0.541 × (tme) + 11.9722.624.2
Publisher’s Note: MDPI stays neutral with regard to jurisdictional claims in published maps and institutional affiliations.

