
Methodology to Optimize Quality Costs in Manufacturing Based on Multi-Criteria Analysis and Lean Strategies


Abstract
:1. Introduction
2. Analytic Hierarchy Process (AHP) Implementation
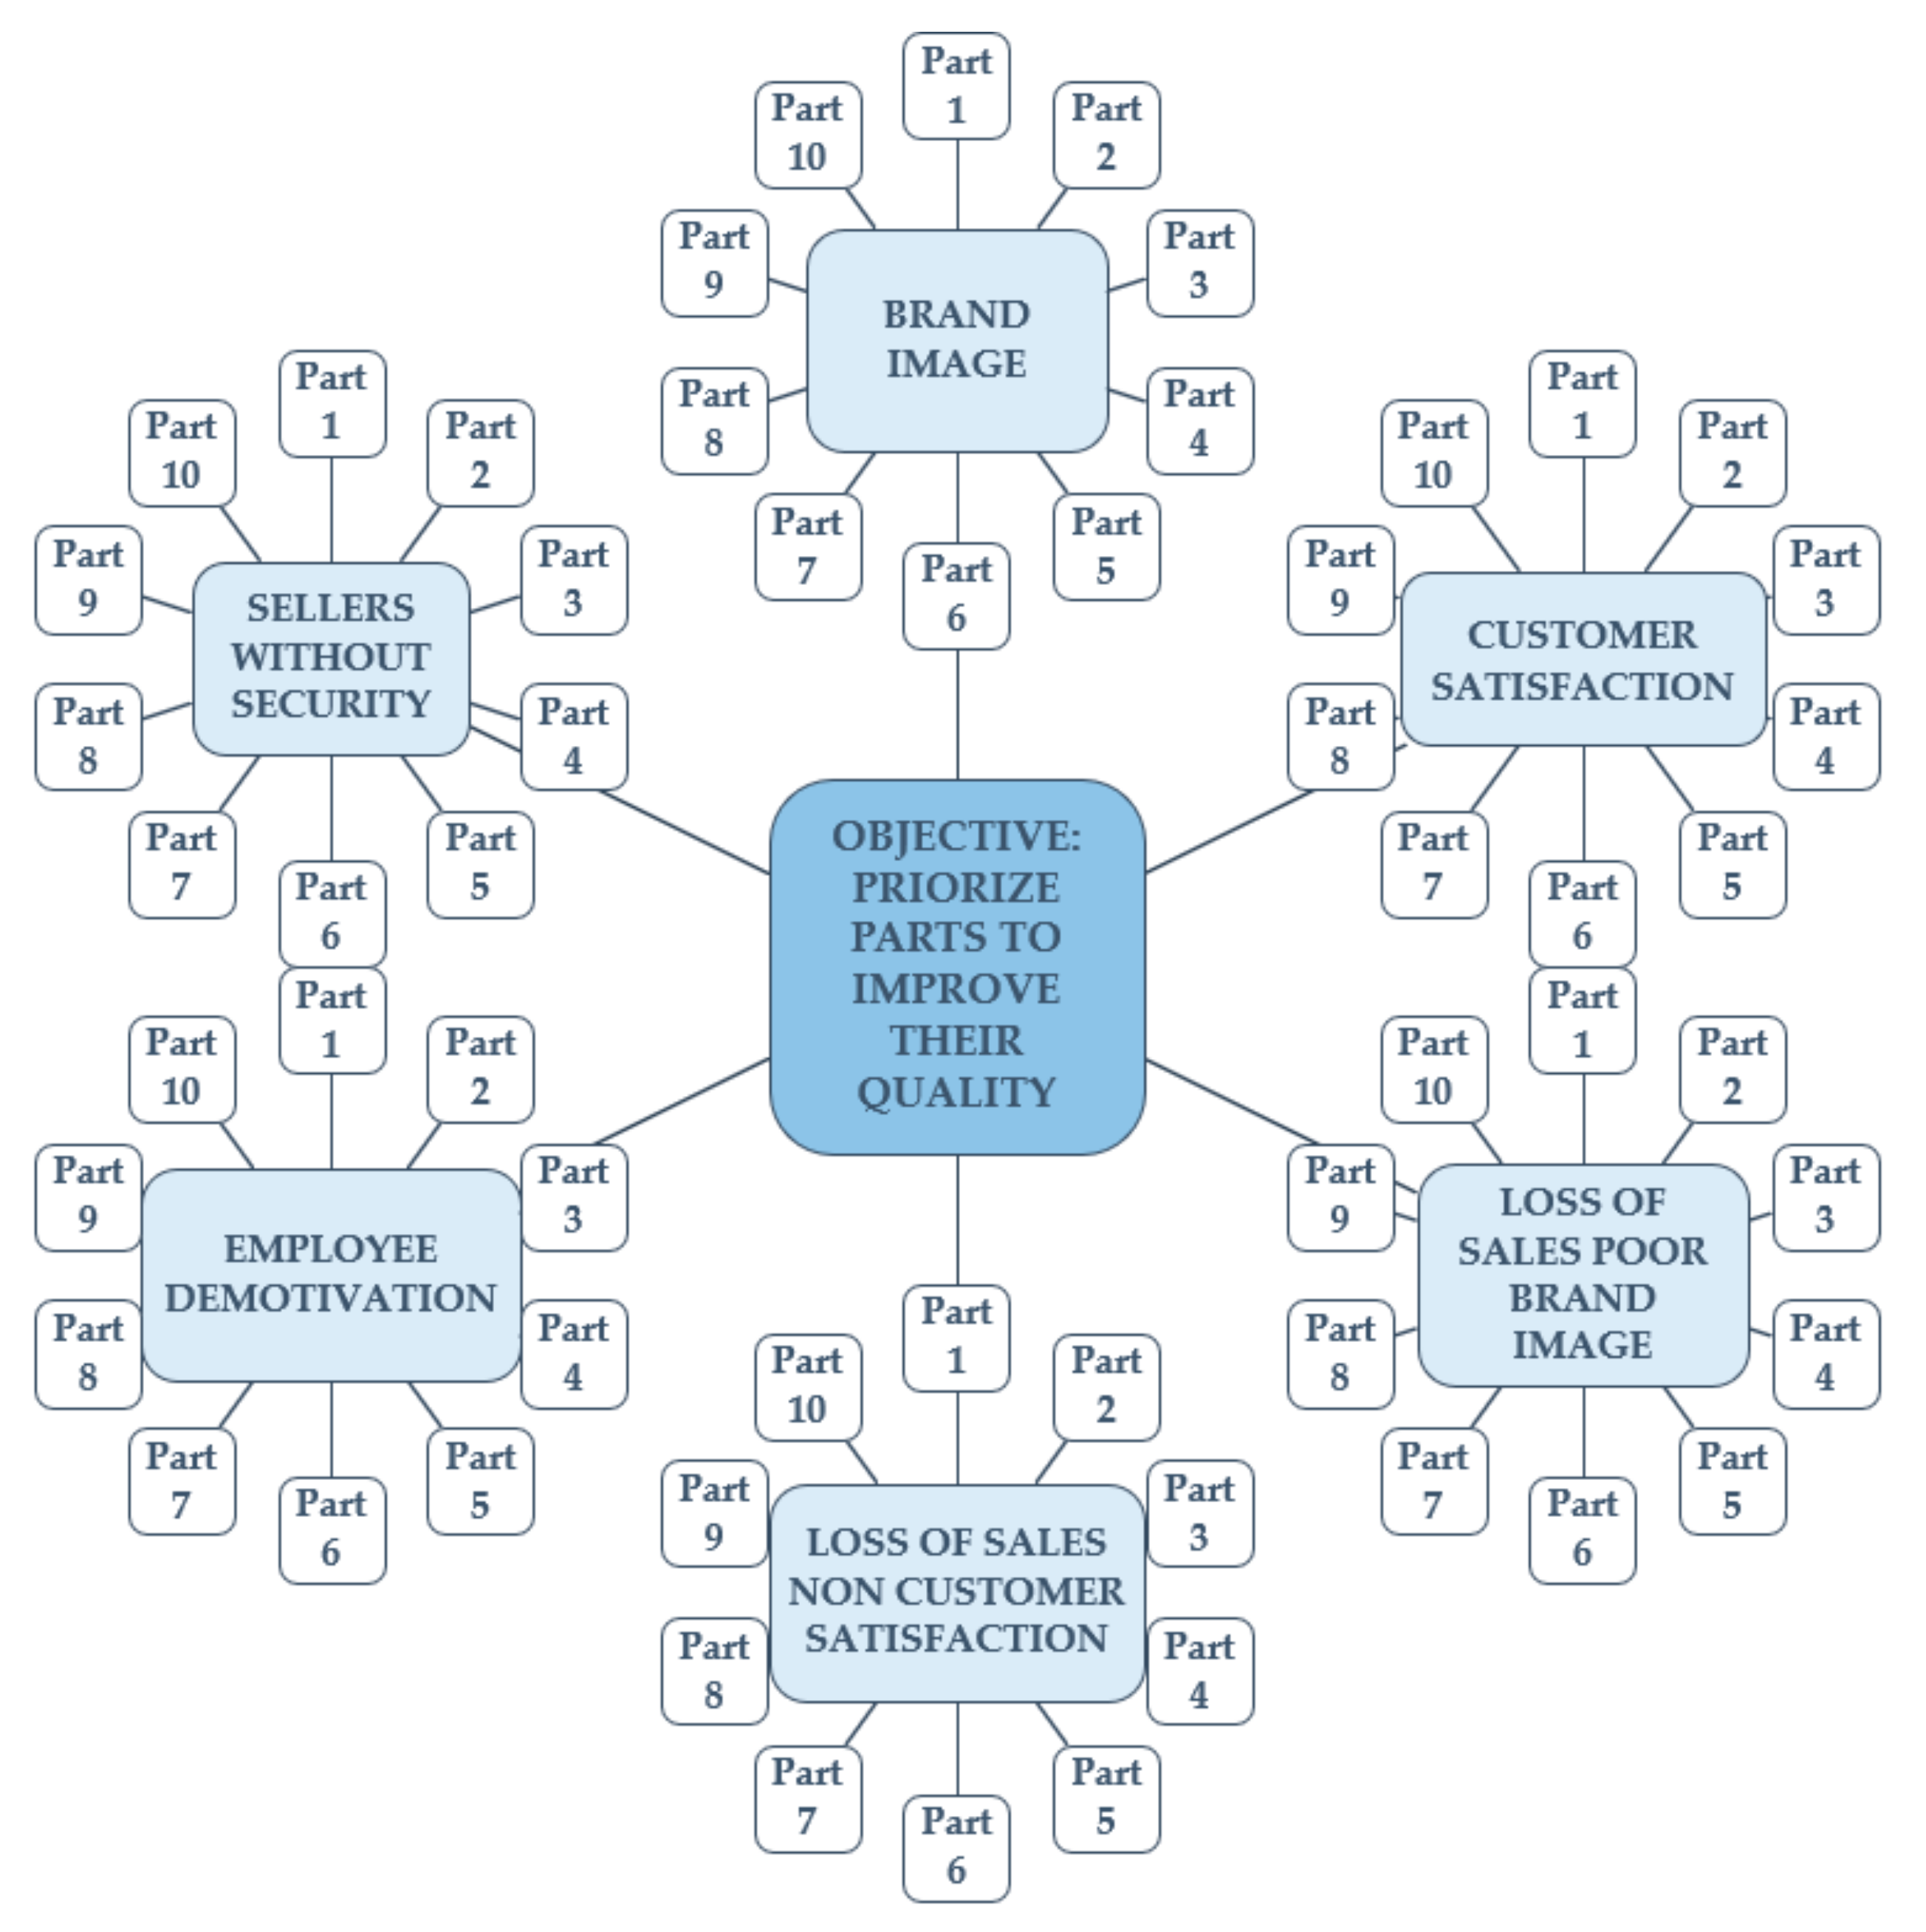
2.1. Structure of the Problem
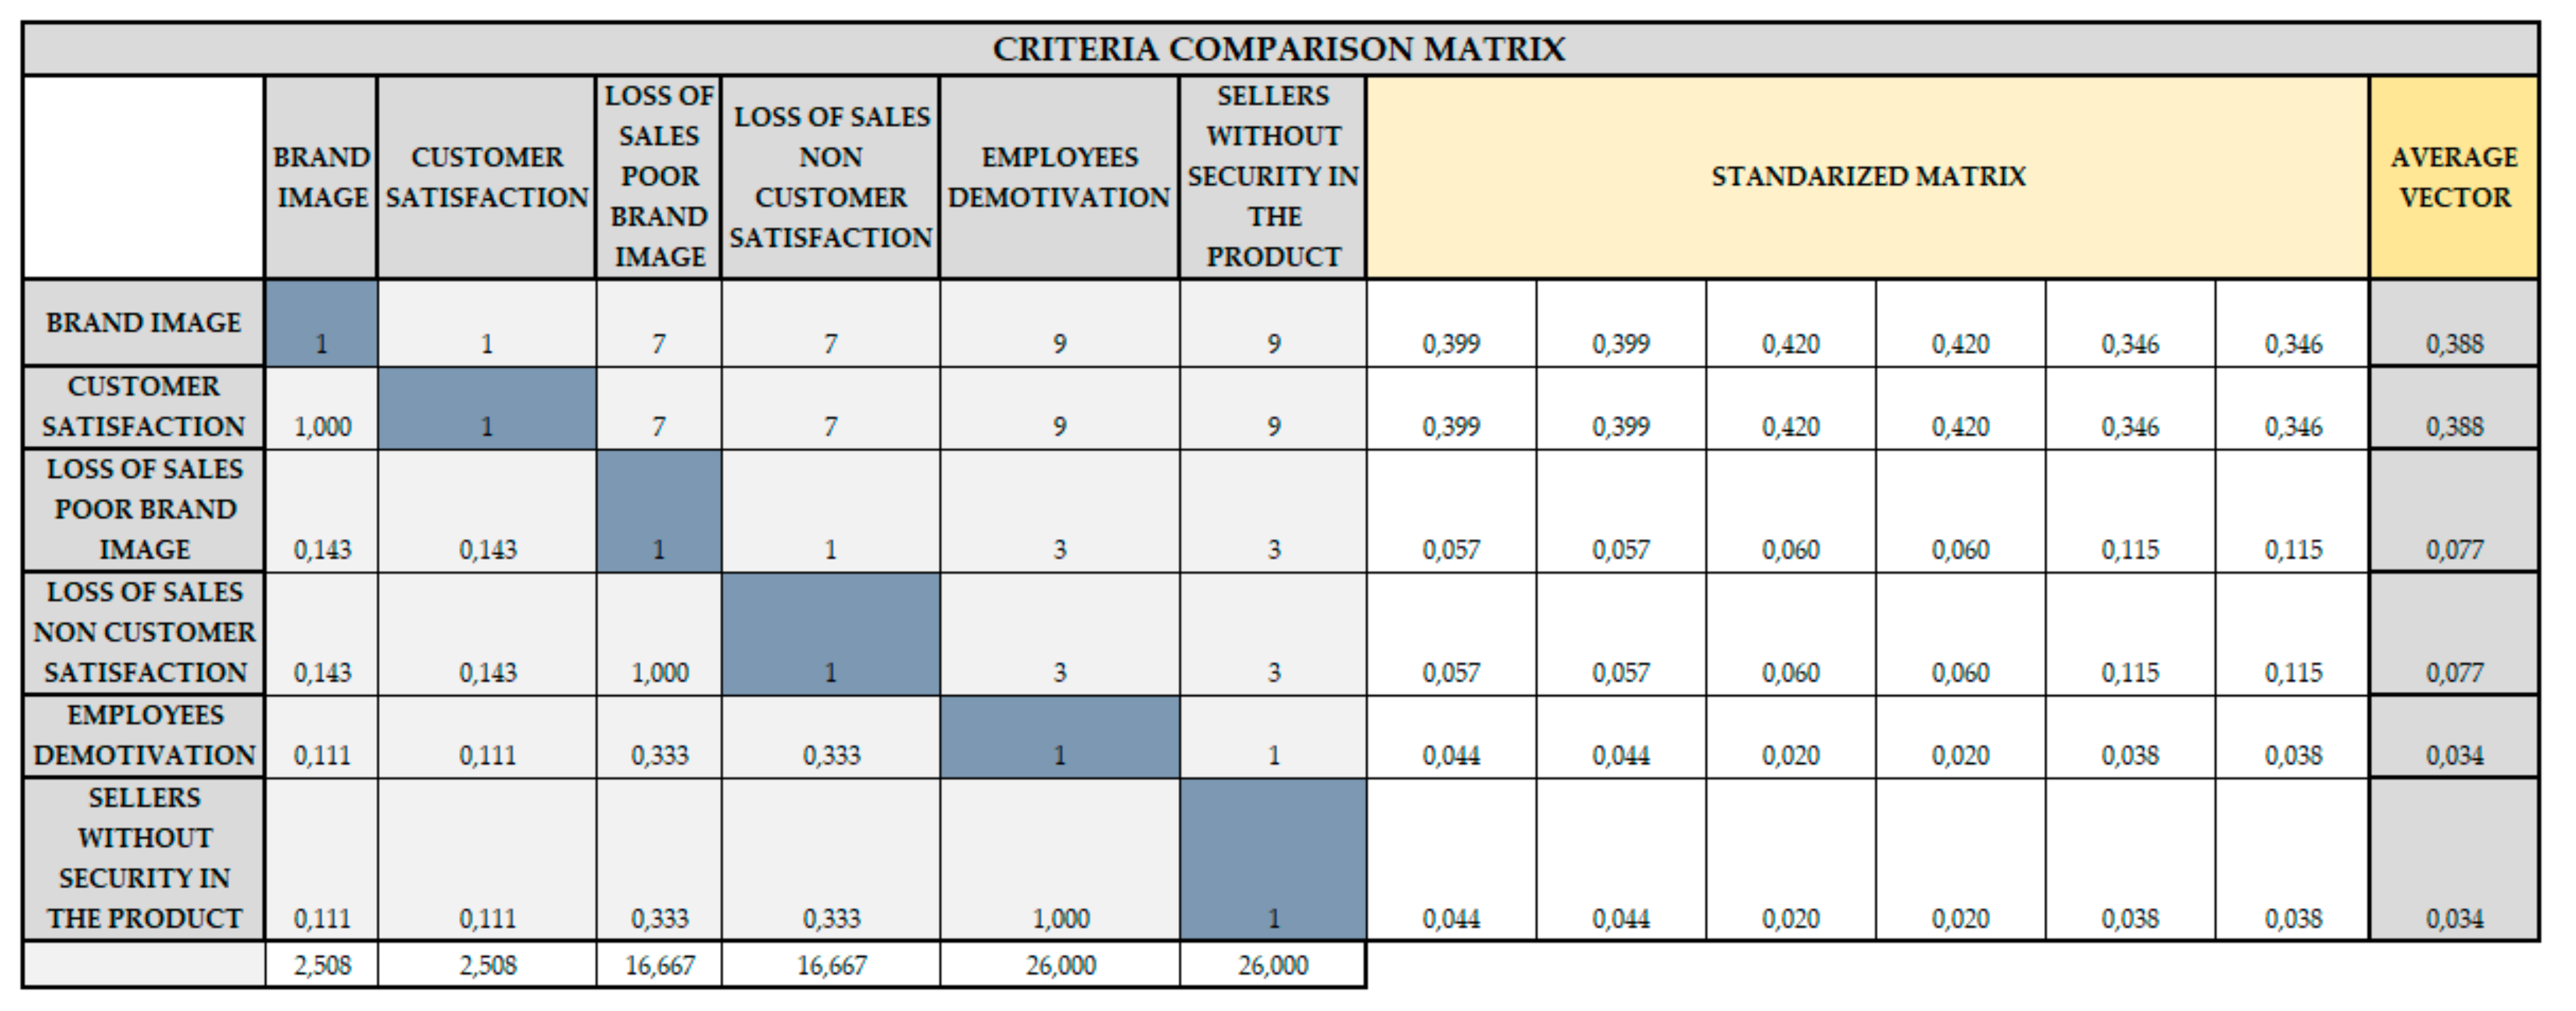
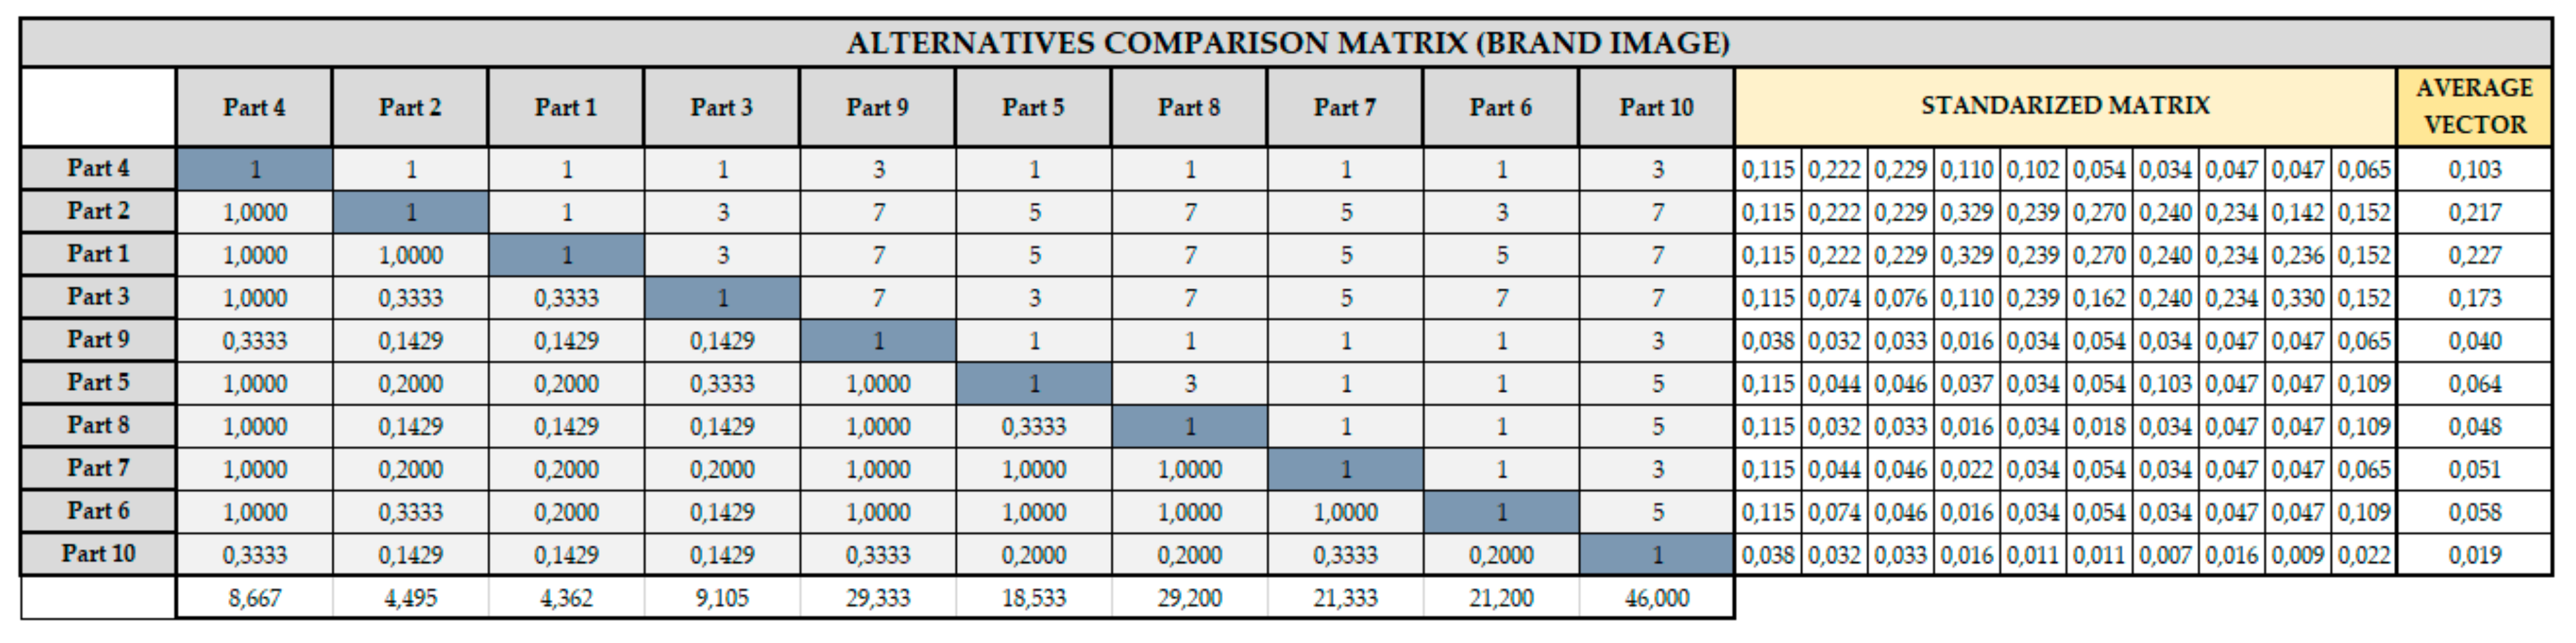
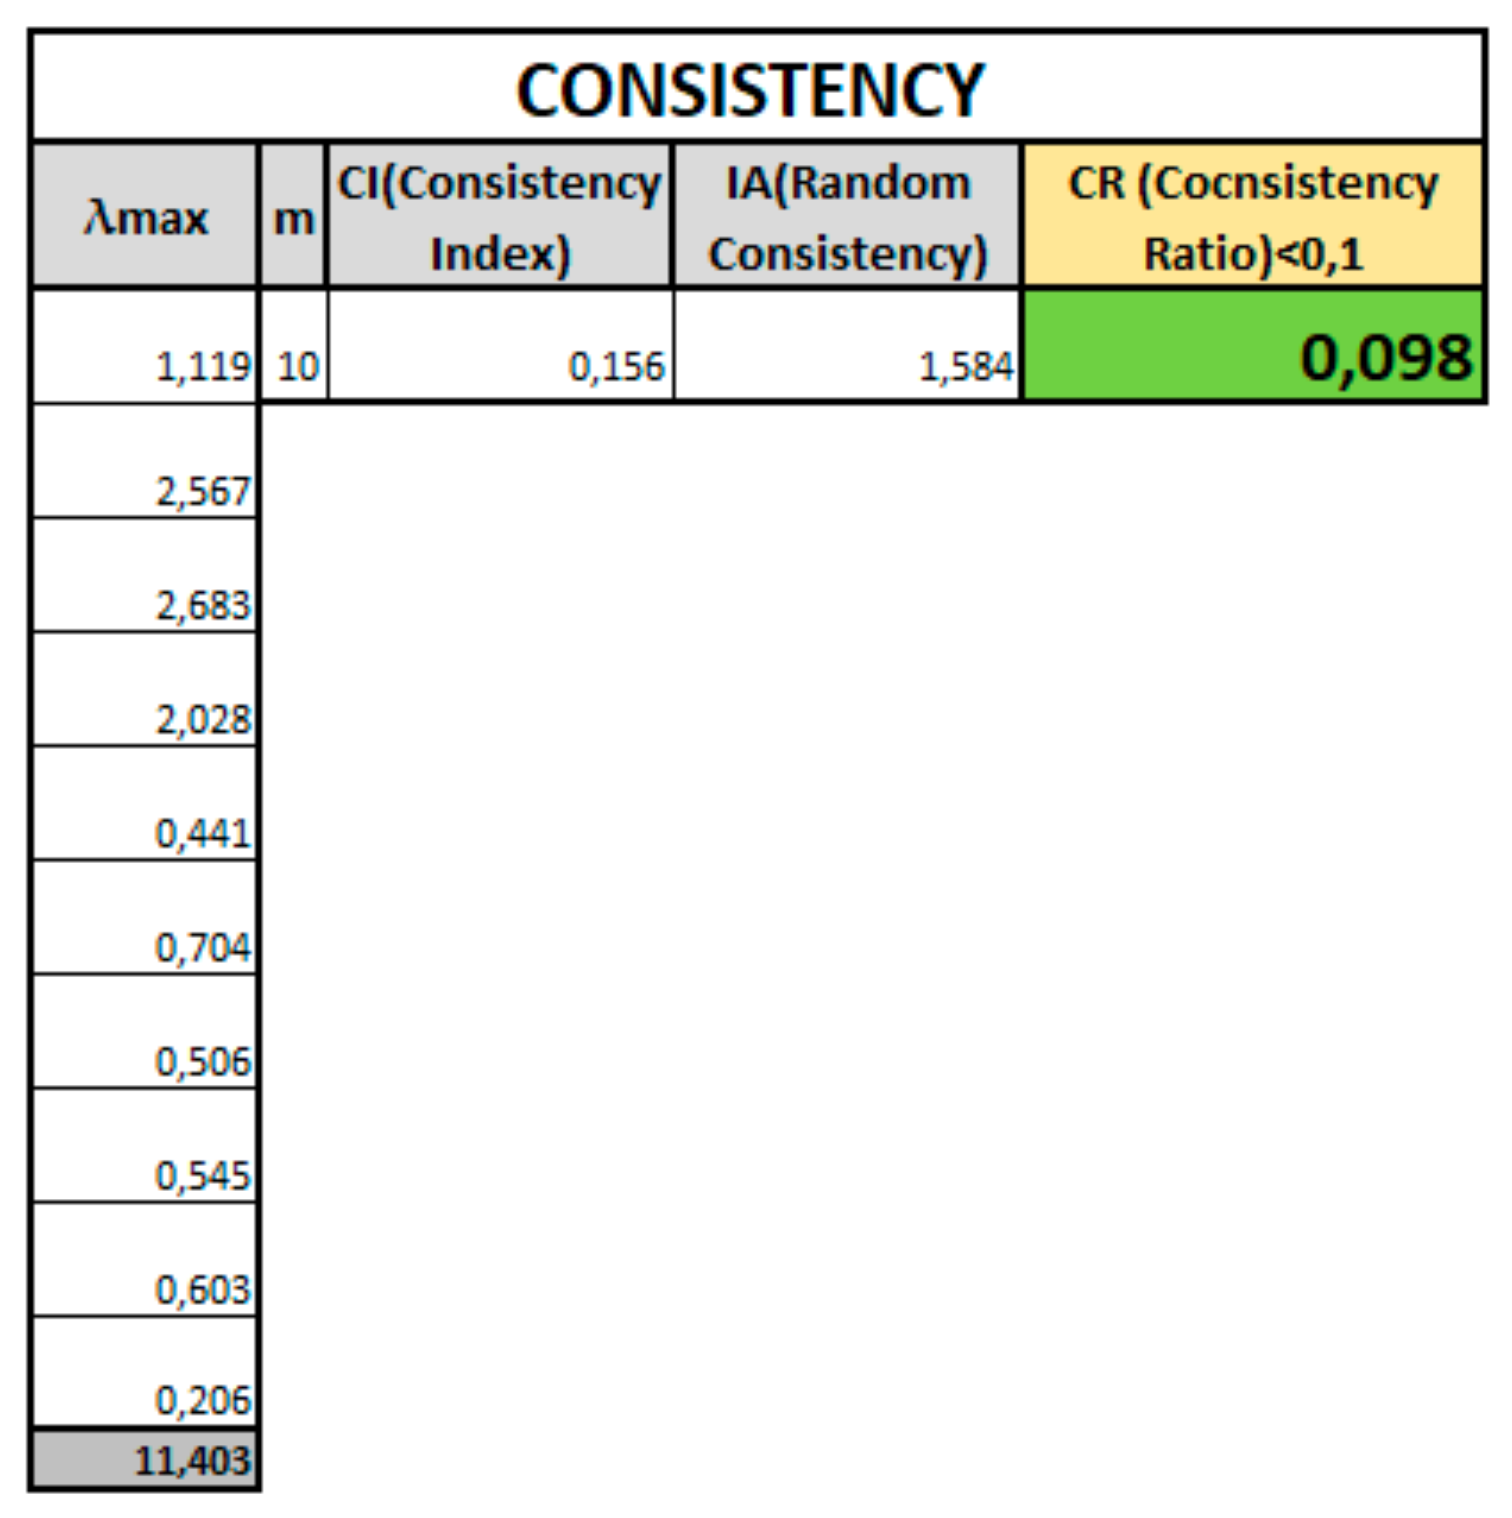
2.2. Determination of Properties and Consistency with an Automatized Computer Application
2.3. Final Result of AHP
3. Analytic Network Process (ANP) Implementation
Application of the ANP Process
- 1.
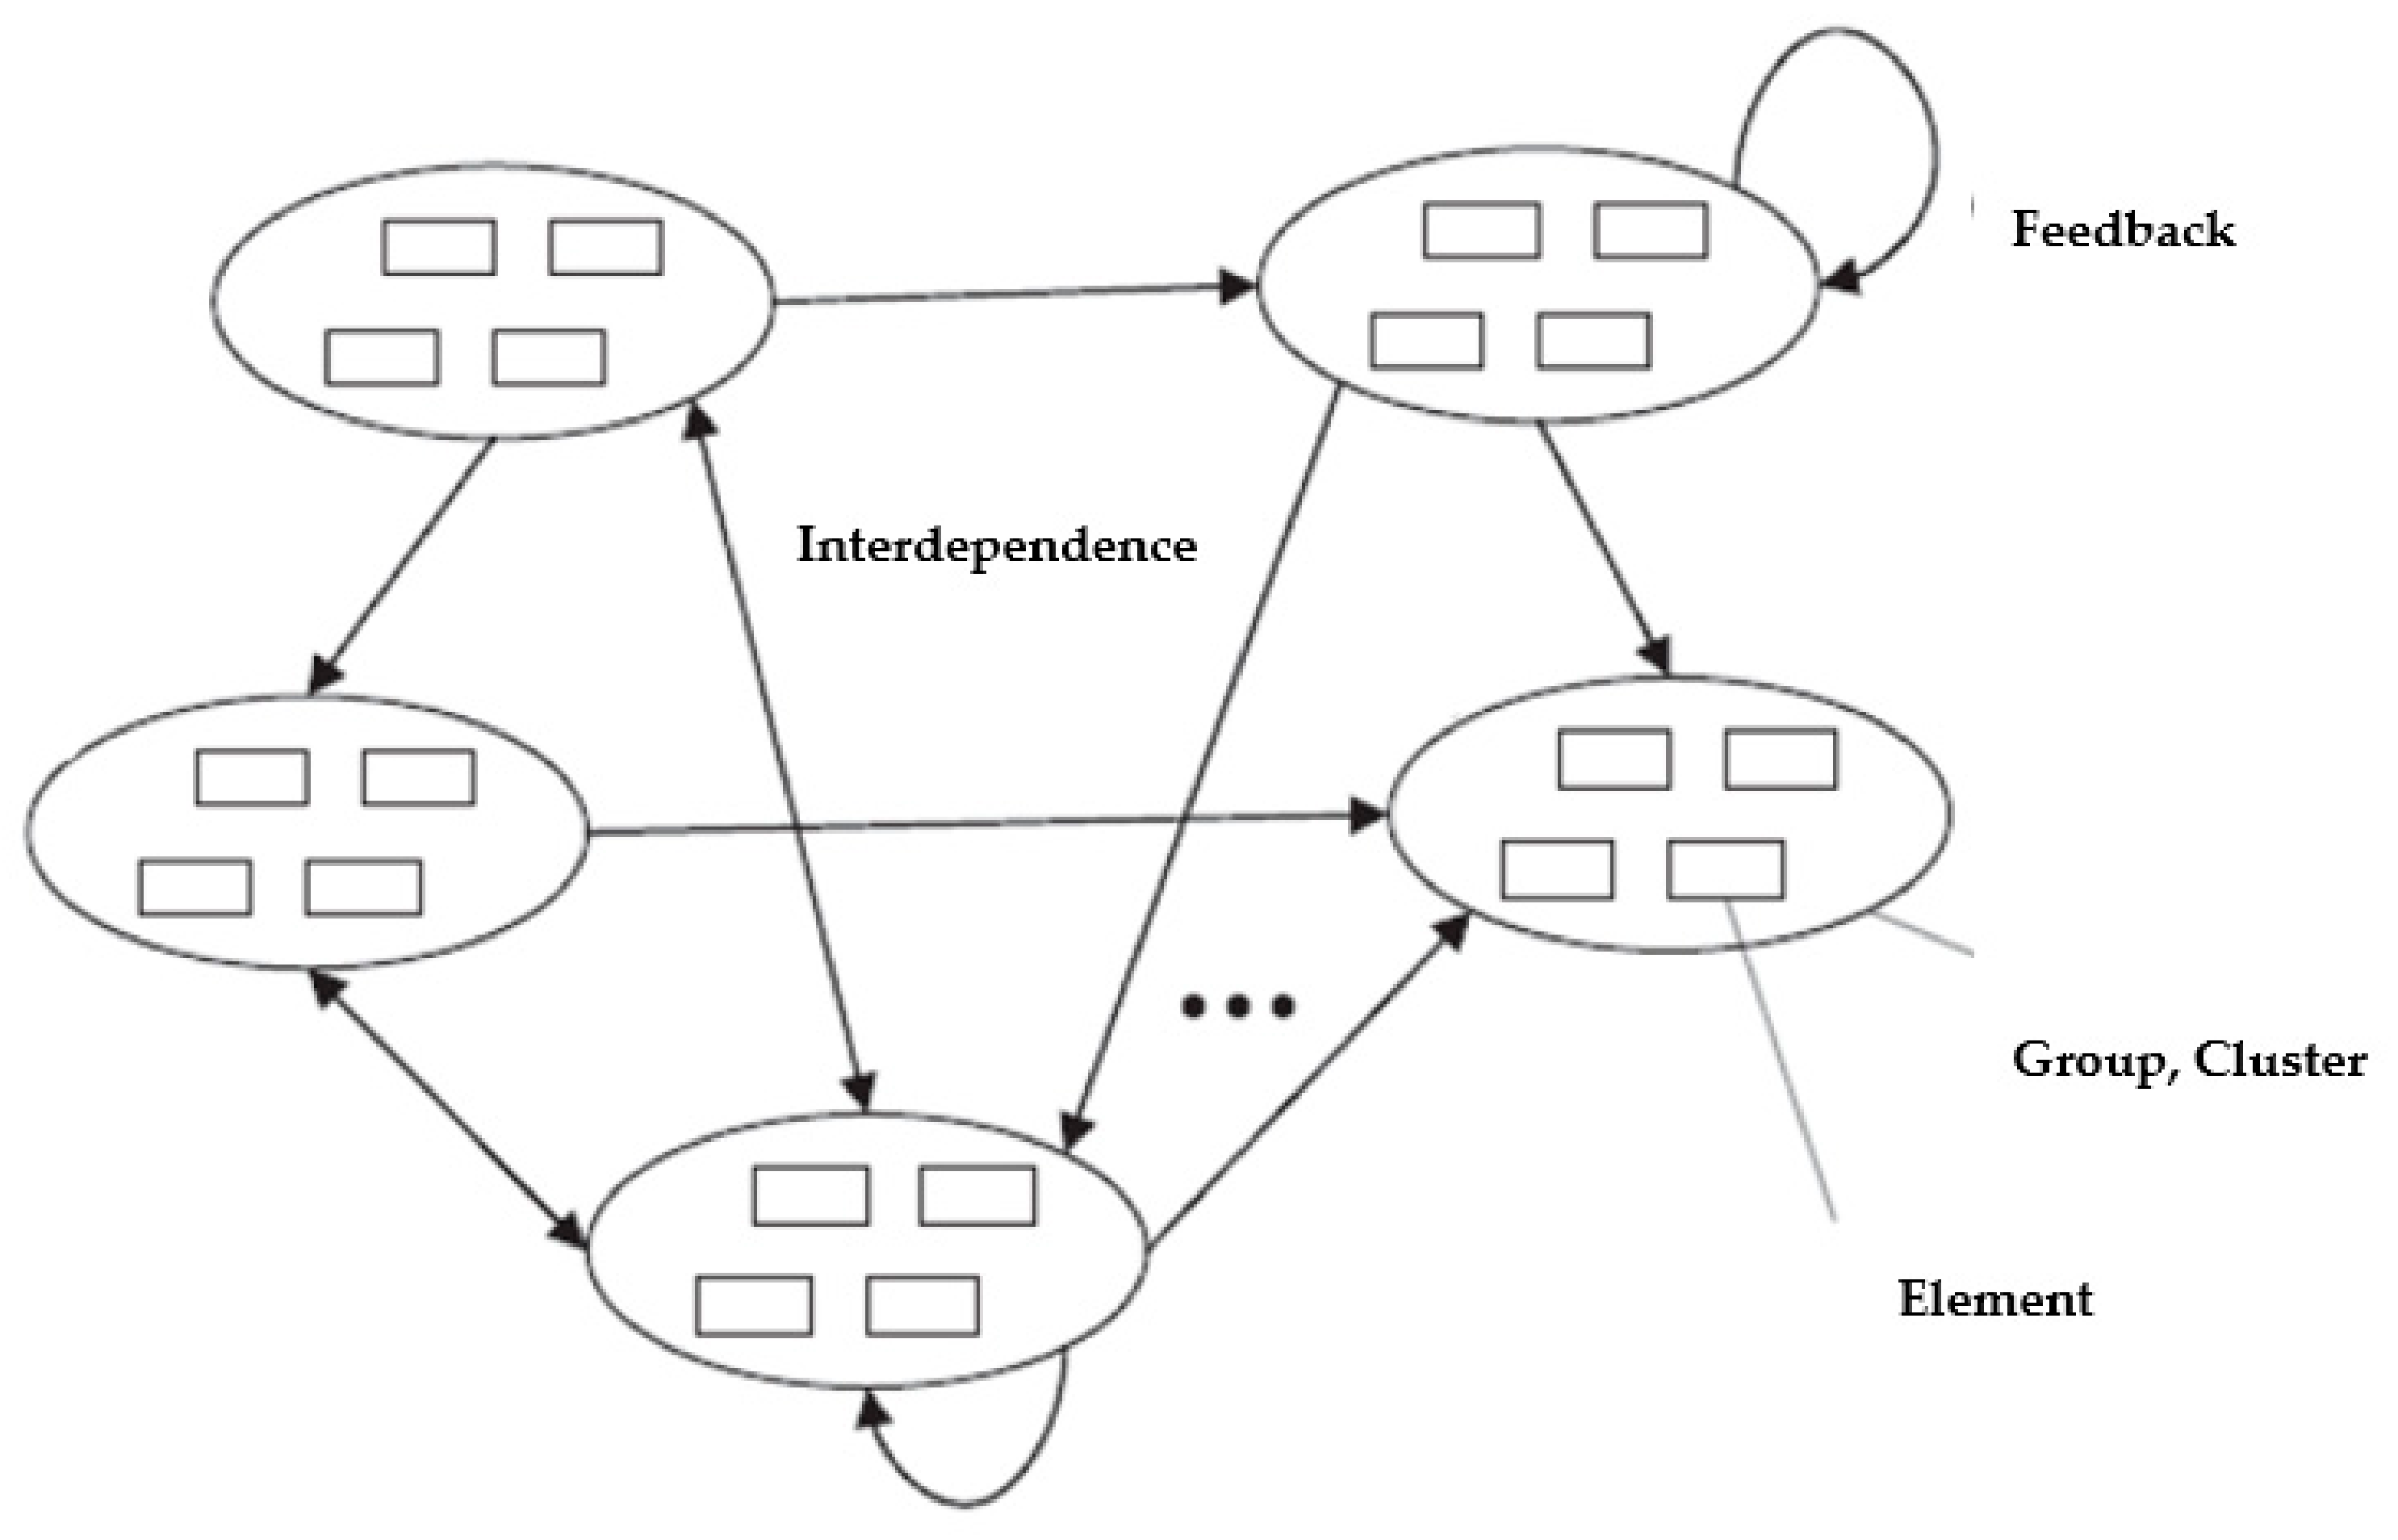
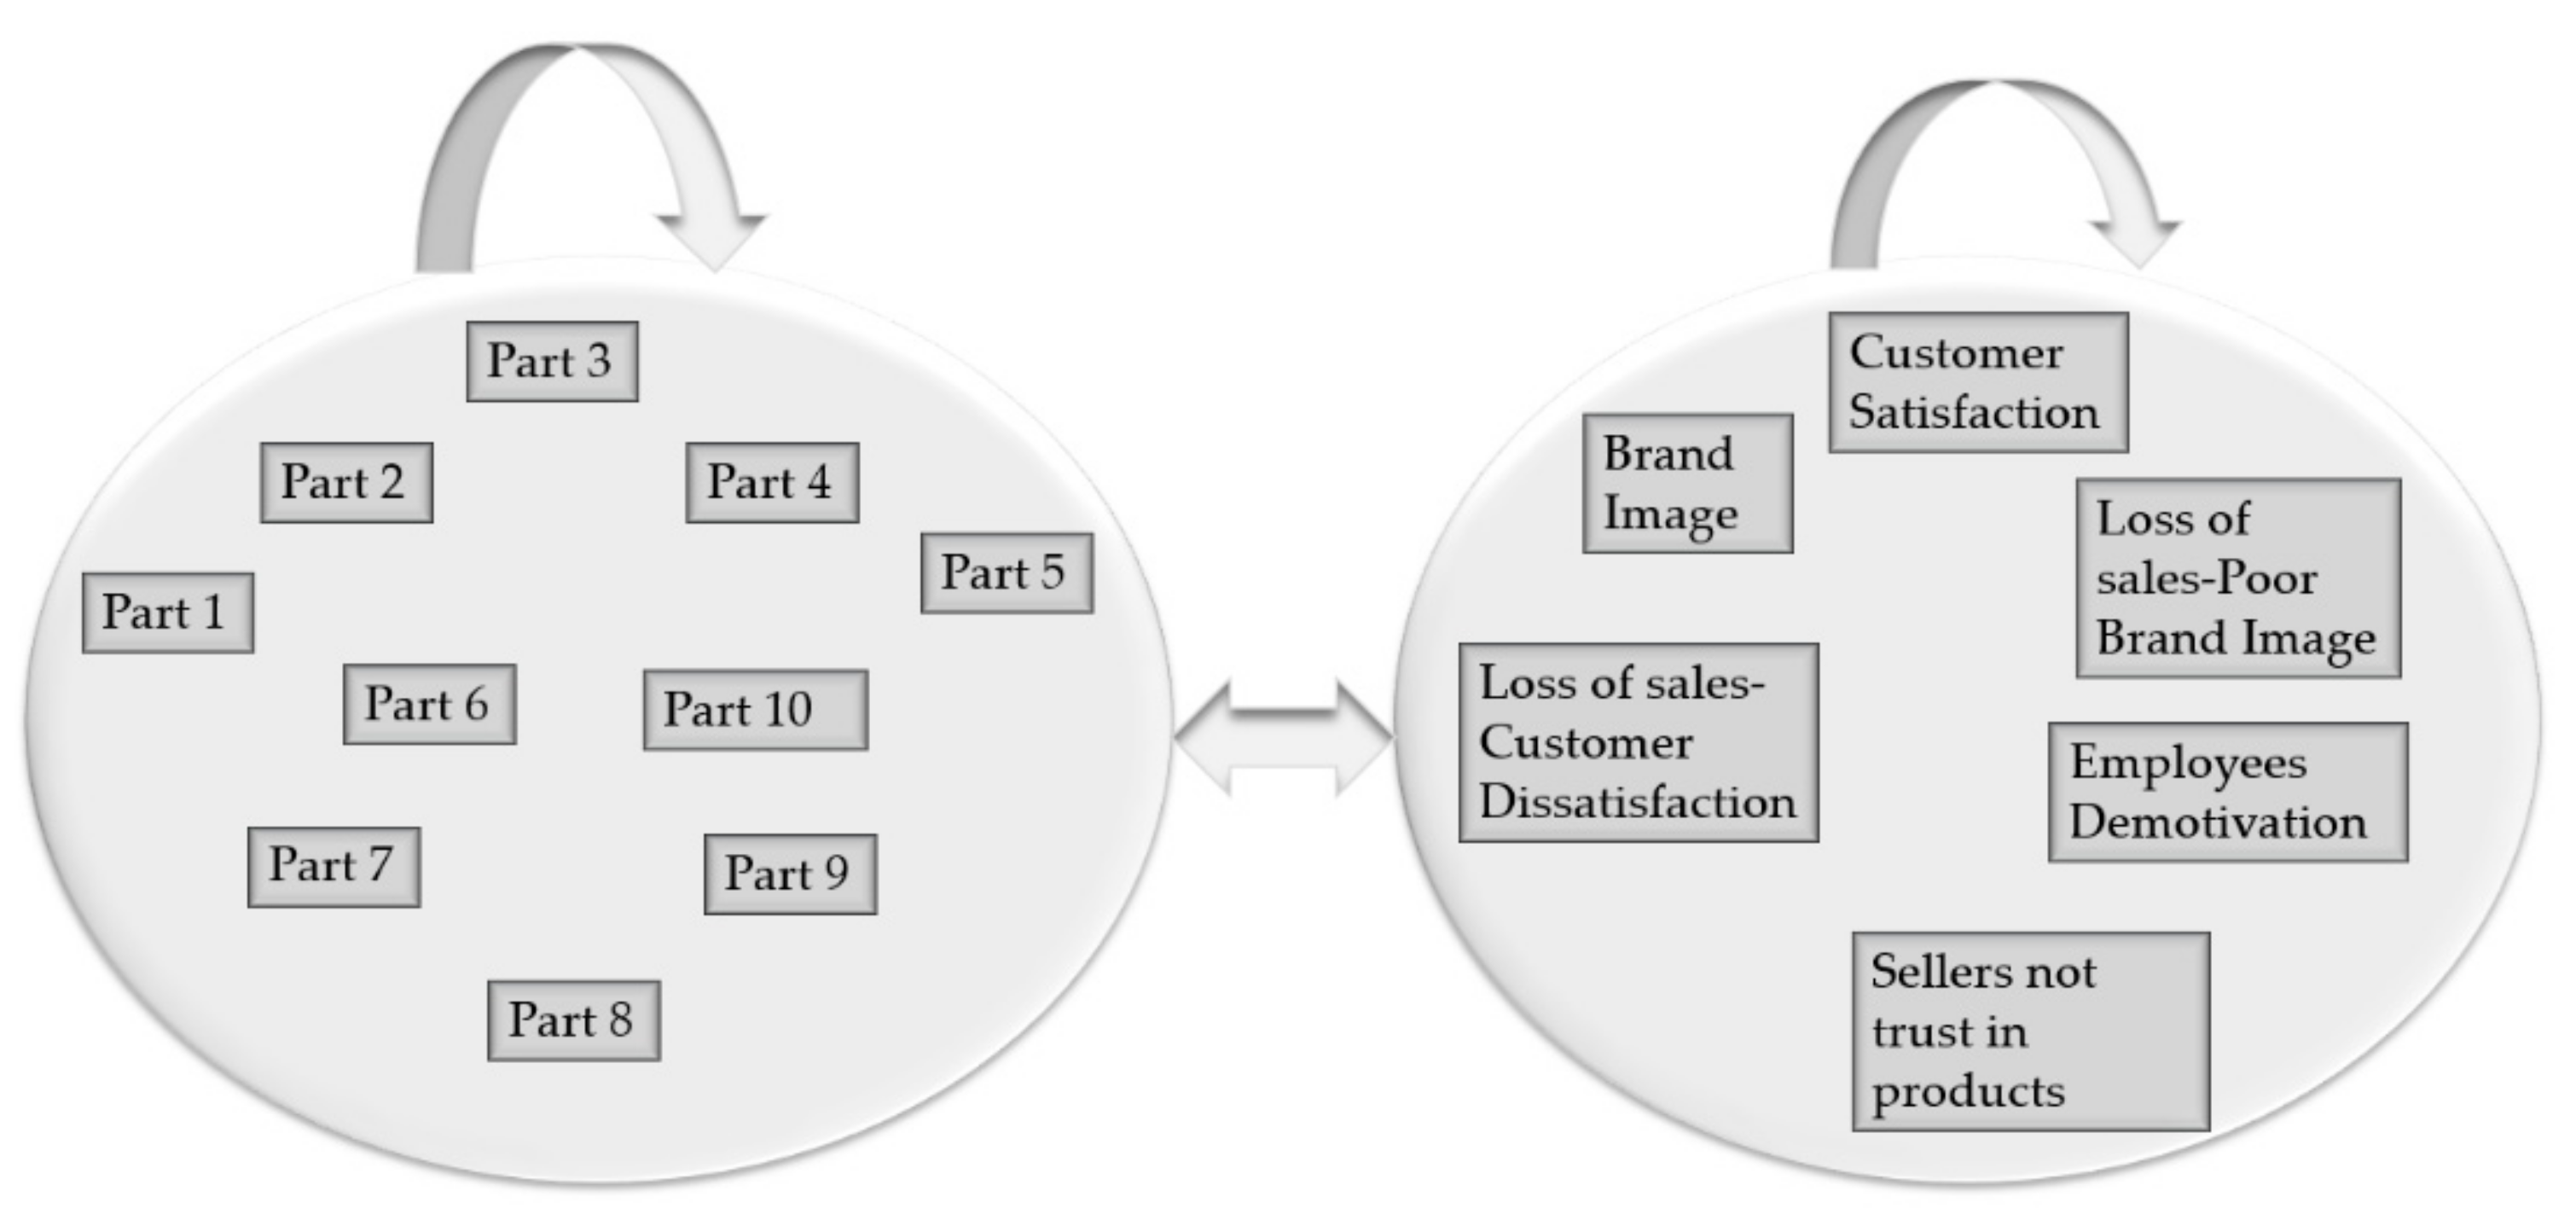
- Alternatives were gathered in a cluster and criteria in another cluster. For building the network, interrelationships between intangible criteria, interdependence between alternatives, and dependance between criteria and alternatives were considered. Once these interrelationships were established, the ANP scheme was implemented and this ANP structure is represented in Figure 8.
- 2.
- The interfactorial dominance matrix shows what elements have a relationship. Interfactorial dominance matrix is shown in Table 7. In this matrix, those elements with a dominance relationship are represented by a “1” and elements with no relationship by a “0”. For instance, if Part 1 has a quality issue, two criteria will be impacted, Customer Satisfaction and Loss of Sales due to Customers Dissatisfaction and may cause failures in Parts 5 and 10. the relationship with itself is always represented by “1”.
- 3.
- The ANP process will have more matrices of paired comparisons than AHP due to the interrelationships between criteria and alternatives.
- 10 matrices of paired comparisons for feedback of alternatives.
- 6 matrices of paired comparisons between criteria and alternatives.
- 6 matrices of paired comparisons between criteria and other criteria.
- 4.
- Supermatrix not weighted or original: represents the related influence of the elements positioned in rows over the elements positioned in columns. Original matrix is represented in Table 8.
- 5.
- Stochastic weighted supermatrix: for calculating this matrix, blocks of the original supermatrix were weighted by applying the weight of each component.
- 6.
- Limit supermatrix: should be calculated by applying the stochastic weighted supermatrix to the power of n until the elements converge and remain stable. All the columns will be equal and their values will indicate the priority of the elements in the ANP network. Limit supermatrix is shown in Table 9.
- 7.
- Any column of the limit supermatrix represents the result of the ANP. The outcome reflects what parts should be a priority to take re-engineering actions for quality improvement. ANP result is shown in Table 10.
4. ANP and AHP Result Comparison
- The AHP prioritization reduces the annual warranty cost (EUR 2.2 M-18.45%) more than ANP (EUR 1.6 M-13.36%).
- The ANP prioritization reduces a greater number of failures (3.189–5.12%) than AHP (1.483–2.83%).
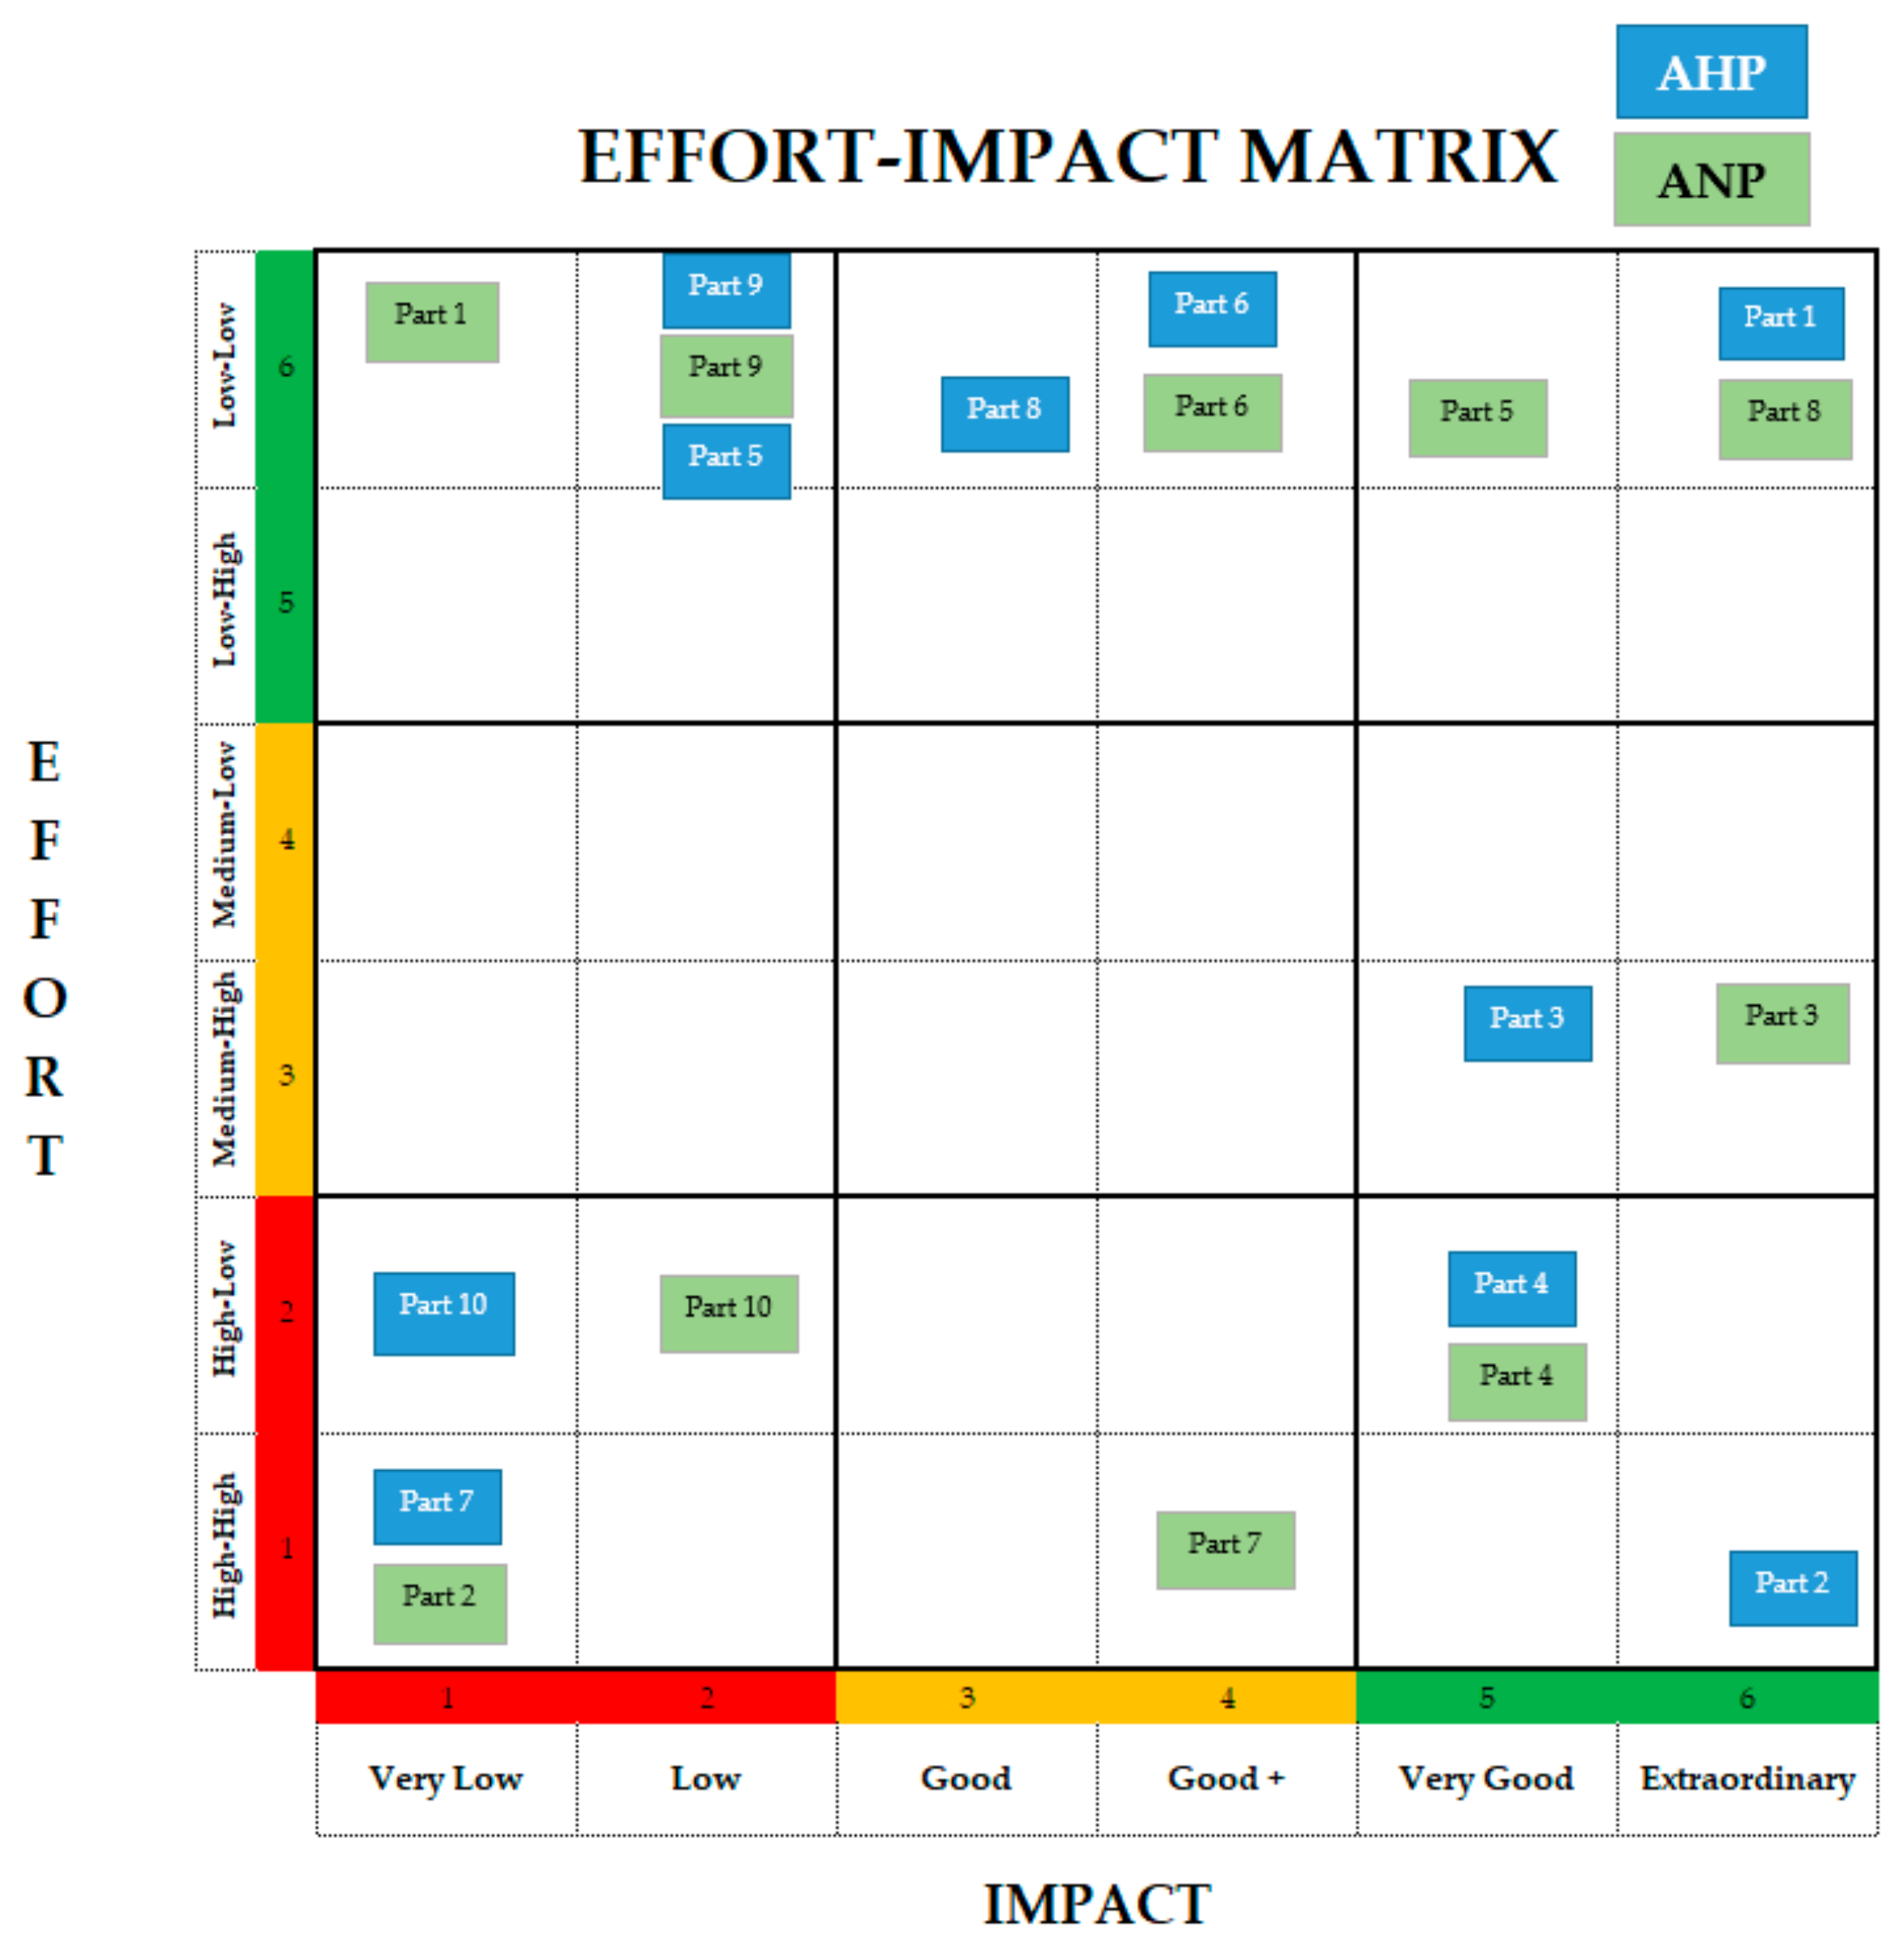
5. Lean Methodology: Effort–Impact Matrix Application for Decision Making
6. Discussion
7. Conclusions
Author Contributions
Funding
Institutional Review Board Statement
Informed Consent Statement
Data Availability Statement
Acknowledgments
Conflicts of Interest
References
- Eleftheriadis, R.; Myklebust, O. A guideline of quality steps towards zero defect manufacturing in industry. In Proceedings of the International Conference on Industrial Engineering and Operations Management, Kuala Lumpur, Malasya, 8–10 March 2016; pp. 332–340. [Google Scholar]
- Psarommatis, F. Product quality improvement policies in Industry 4.0: Characteristics, enabling factors, barriers, and evolution toward Zero Defect Manufacturing. Data-Driven Cognitive Manufacturing-Applications in Predictive Maintenance and Zero Defect Manufacturing. Front. Comput. Sci. 2020, 2, 26. [Google Scholar]
- Psarommatis, F. Zero defect manufacturing: State-of-the-art review, shortcomings and future directions in research. Int. J. Prod. Res. 2020, 58, 1–17. [Google Scholar]
- Ferretti, S. Monitoring systems for zero defect manufacturing. Procedia CIRP 2013, 12, 258–263. [Google Scholar]
- Pérez-Fernández, L.; Sebastián, M.A.; González-Gaya, C. Decision support system to implement quality improvements optimazing tangible and intangible costs in manufacturing. In Proceedings of the 25th International Congress on Project Management and Engineering, Alcoi, Spain, 7–10 July 2020. [Google Scholar]
- Pérez-Fernández, L.; Conde, J.; Sebastián, M.A. Decision support system to decrease warranty and intangible costs in automotive industry. Procedia Manuf. 2017, 13, 1143–1150. [Google Scholar] [CrossRef]
- Dyer, R.F.; Forman, E.H. Group decision support with the Analytic Hierarchy Process. Decis. Support Syst. 1992, 8, 99–124. [Google Scholar] [CrossRef]
- Baccouche, A.; Goren, S.; Huyet, A.L.; Pierreval, H. An approach based on simulation optimization and AHP to support collaborative design: With an application to supply chains. In Proceedings of the 2011 IEEE Workshop on Computational Intelligence in Production and Logistics Systems (CIPLS), Paris, France, 11–15 April 2011. [Google Scholar] [CrossRef]
- Pereira, J.; Fragoso, M.; Todorov, M. Risk Assessment Using Bayesian Belief Networks and Analytic Hierarchy Process Applicable to Jet Engine High Pressure Turbine Assembly; Department of Systems and Control, National Laboratory for Scientific Computing: Petropolis, Brazil, 2016. [Google Scholar]
- Bahurmoz, A.M. The analytic hierarchy process at Dar AlHekma, Saudi Arabia. Interfaces 2003, 33, 70–78. [Google Scholar]
- Bascetin, A. An application of the analytic hierarchy process in equipment selection at Orhaneli open pit coal mine. Technical note. Min. Technol. Trans. Inst. Min. Metall. 2004, 113, 192–199. [Google Scholar]
- Claver, J.; García-Dominguez, A.; Sevilla, L.; Sebastián, M.A. A Multi-Criteria Cataloging of the Immovable Items of Industrial Heritage of Andalusia. Appl. Sci. 2019, 9, 275. [Google Scholar] [CrossRef] [Green Version]
- Beniak, J.; Šooš, L.; Križan, P.; Matúš, M. Implementation of AHP Methodology for the Evaluation and Selection Process of a Reverse Engineering Scanning System. Appl. Sci. 2021, 11, 12050. [Google Scholar]
- Alonso, J.A.; Lamata, M.T. Consistency in the analytic hierarchy process: A new approach. Int. J. Uncertain. Fuzziness Knowl. Based Syst. 2006, 14, 445–459. [Google Scholar] [CrossRef] [Green Version]
- Amenta, P.; Ishizaka, A.; Lucadamo, A.; Marcarelli, G.; Vyas, V. Computing a common preference vector in a complex multi-actor and multi-group decision system in Analytic Hierarchy Process context. Ann. Oper. Res. 2019, 284, 33–62. [Google Scholar] [CrossRef]
- Chen, C.F. Applying the analytical hierarchy process (AHP) approach to convention site selection. J. Travel Res. 2006, 45, 167–174. [Google Scholar] [CrossRef]
- Chow, D.; Smith, S.; Fau-Henwick, S.; Henwick, S. Applying Lean management to automation. MLO 2009, 41, 36–38. [Google Scholar]
- Abdulmalek, E.A. A Classification Scheme for the Process Industry to Guide the Implementation of Lean. Eng. Manag. J. 2006, 18, 15–25. [Google Scholar]
- Bevilacqua, M.; Ciarapica, F.E.; De Sanctis, I.; Mazzuto, G.; Paciarotti, C. A changeover time reduction through an integration of lean practices: A case study from pharmaceutical sector. Assem. Auto. 2015. [Google Scholar] [CrossRef]
- Ballé, M. The Lean Sensei. Go See Challenge; Lean Enterprise Institute, Inc.: Boston, MA, USA, 2019. [Google Scholar]
- Romero, D. Total Quality Management and Quality Circles in the Digital Lean Manufacturing World. In Proceedings of the IFIP International Conference on Advances in Production Management Systems, Austin, TX, USA, 1–5 September 2019. [Google Scholar]
- Kezar, A.; Maxey, D. The Delphi Technique: An Untapped Approach of Participatory Research; University South California: Los Angeles, CA, USA, 2014. [Google Scholar]
- Baviera-Puig, A.; García-Martínez, G.; Gómez-Navarro, T. Propuesta metodológica mediante ANP para la evaluación de las memorias de sostenibilidad del sector agroalimentario español. Econ. Agrar. Y Recur. Nat. 2014, 14, 81–101. [Google Scholar]
- Aznar, J.; Guijarro, F. Nuevos Métodos de Valoración. Modelos Multicriterio, 2nd ed.; Universitat Politècnica de València: Valencia, Spain, 2012. [Google Scholar]
- Hurtado, T.; Bruno, G. El Proceso Analítico Jerárquico (AHP) como Herramienta en la Toma de Decisiones en la Selección de Proveedores: Aplicación en la Selección del Proveedor para la Empresa Gráfica; Universidad Nacional Mayor de San Marcos. Facultad de Ciencias Matemáticas. EAP. Investigación Operativa; MYE S.R.L.: Lima, Perú, 2005. [Google Scholar]


| Numerical Scale | Verbal Scale |
|---|---|
| 1 | Equal Importance |
| 3 | Moderate Importance |
| 5 | Strong Importance |
| 7 | Very Strong Importance |
| 9 | Extreme Importance |
| 2, 4, 6, 8 | Intermediate Values |
| Part Description | Number of Incidents | Amount Spent (EUR) |
|---|---|---|
| Part 1 | 859 | 608.854 |
| Part 2 | 245 | 575.147 |
| Part 3 | 113 | 503.982 |
| Part 4 | 266 | 498.370 |
| Part 5 | 2.535 | 375.083 |
| Part 6 | 267 | 229.793 |
| Part 7 | 1.726 | 209.398 |
| Part 8 | 275 | 205.560 |
| Part 9 | 204 | 195.430 |
| Part 10 | 255 | 157.582 |
| Intangible Cost | Impact |
|---|---|
| Brand image | Products with low quality impact on brand image |
| Customer satisfaction | Customers satisfied are loyal customers to the brand |
| Loss of sales due to poor brand image | Poor brand image provokes a decrease in sales |
| Loss of sales due to poor customer satisfaction | Low customer satisfaction triggers a decrease in sales |
| Employees cease to be brand ambassadors | Lack of quality in the products manufactured provokes lack of motivation in employees. Consequently, lack of performance and abandonment of their role as ambassadors of the brand |
| Sellers without security in the product | A lack of quality of the product creates insecurity in the sellers. Sales decrease |
| Brand Image | Customer Satisfaction | Loss of Sales Poor Brand Image | Loss of Sales Customer Dissatisfaction | Employees Demotivation | Sellers without Security in Product | TOTAL | RANKING | |
|---|---|---|---|---|---|---|---|---|
| Part 1 | 0.227 | 0.227 | 0.260 | 0.260 | 0.246 | 0.220 | 0.232 | 1 |
| Part 2 | 0.217 | 0.217 | 0.198 | 0.198 | 0.187 | 0.193 | 0.212 | 2 |
| Part 3 | 0.173 | 0.173 | 0.163 | 0.163 | 0.158 | 0.167 | 0.171 | 3 |
| Part 4 | 0.103 | 0.103 | 0.117 | 0.116 | 0.104 | 0.097 | 0.105 | 4 |
| Part 5 | 0.064 | 0.064 | 0.058 | 0.058 | 0.084 | 0.086 | 0.064 | 5 |
| Part 6 | 0.058 | 0.058 | 0.049 | 0.047 | 0.063 | 0.076 | 0.057 | 6 |
| Part 7 | 0.051 | 0.051 | 0.049 | 0.051 | 0.049 | 0.047 | 0.051 | 7 |
| Part 8 | 0.048 | 0.049 | 0.044 | 0.044 | 0.047 | 0.044 | 0.048 | 8 |
| Part 9 | 0.040 | 0.036 | 0.034 | 0.034 | 0.038 | 0.047 | 0.038 | 9 |
| Part 10 | 0.019 | 0.022 | 0.029 | 0.029 | 0.023 | 0.022 | 0.022 | 10 |
| WEIGHTED | 0.388 | 0.388 | 0.077 | 0.077 | 0.034 | 0.034 |
| Total Resp. 1 | Total Resp. 2 | Total Resp. 3 | Total Resp. 4 | Total Resp. 5 | Ranking Resp. 1 | Ranking Resp. 2 | Ranking Resp. 3 | Ranking Resp. 4 | Ranking Resp. 5 | |
|---|---|---|---|---|---|---|---|---|---|---|
| Part 1 | 0.227 | 0.227 | 0.260 | 0.260 | 0.246 | 1 | 1 | 1 | 1 | 1 |
| Part 2 | 0.217 | 0.217 | 0.198 | 0.198 | 0.187 | 2 | 3 | 2 | 2 | 2 |
| Part 3 | 0.173 | 0.173 | 0.163 | 0.163 | 0.158 | 3 | 2 | 3 | 3 | 3 |
| Part 4 | 0.103 | 0.103 | 0.117 | 0.116 | 0.104 | 4 | 4 | 4 | 4 | 4 |
| Part 5 | 0.064 | 0.064 | 0.058 | 0.058 | 0.084 | 5 | 8 | 8 | 9 | 7 |
| Part 6 | 0.058 | 0.058 | 0.049 | 0.047 | 0.063 | 6 | 5 | 5 | 5 | 5 |
| Part 7 | 0.051 | 0.051 | 0.049 | 0.051 | 0.049 | 7 | 9 | 9 | 10 | 10 |
| Part 8 | 0.048 | 0.049 | 0.044 | 0.044 | 0.047 | 8 | 7 | 7 | 6 | 6 |
| Part 9 | 0.040 | 0.036 | 0.034 | 0.034 | 0.038 | 9 | 6 | 6 | 7 | 8 |
| Part 10 | 0.019 | 0.022 | 0.029 | 0.029 | 0.023 | 10 | 10 | 10 | 8 | 9 |
| Trimmed Mean | Final Ranking | |
|---|---|---|
| Part 1 | 0.245 | 1 |
| Part 2 | 0.218 | 2 |
| Part 3 | 0.160 | 3 |
| Part 4 | 0.116 | 4 |
| Part 5 | 0.043 | 8 |
| Part 6 | 0.063 | 5 |
| Part 7 | 0.035 | 9 |
| Part 8 | 0.047 | 6 |
| Part 9 | 0.044 | 7 |
| Part 10 | 0.031 | 10 |
| Brand Image | Loss Sales P.B.I. | Cust. Satisf. | Loss Sales C.D. | Emp. Demot. | Sellers No Security | P1 | P2 | P3 | P4 | P5 | P6 | P7 | P8 | P9 | P10 | |
|---|---|---|---|---|---|---|---|---|---|---|---|---|---|---|---|---|
| Brand Image | 1 | 1 | 1 | 1 | 1 | 1 | 0 | 1 | 1 | 1 | 0 | 0 | 0 | 0 | 1 | 0 |
| Loss sales P.B.I. | 1 | 1 | 0 | 1 | 0 | 0 | 0 | 1 | 1 | 1 | 0 | 0 | 0 | 0 | 1 | 0 |
| Customer satisfaction | 1 | 1 | 1 | 1 | 1 | 1 | 1 | 1 | 1 | 1 | 1 | 1 | 1 | 1 | 1 | 1 |
| Loss of sales C.D. | 0 | 0 | 1 | 1 | 0 | 0 | 1 | 1 | 1 | 1 | 1 | 1 | 1 | 1 | 1 | 1 |
| Employees demotivation | 1 | 1 | 0 | 0 | 1 | 1 | 0 | 1 | 1 | 1 | 0 | 0 | 0 | 0 | 1 | 0 |
| Sellers No security | 1 | 1 | 0 | 0 | 1 | 1 | 0 | 1 | 1 | 1 | 0 | 0 | 0 | 0 | 1 | 0 |
| Part 1 | 0 | 0 | 1 | 1 | 0 | 0 | 1 | 0 | 0 | 0 | 1 | 0 | 0 | 0 | 0 | 0 |
| Part 2 | 1 | 1 | 1 | 1 | 1 | 1 | 0 | 1 | 0 | 0 | 0 | 0 | 0 | 0 | 0 | 0 |
| Part 3 | 1 | 1 | 1 | 1 | 1 | 1 | 0 | 0 | 1 | 1 | 0 | 1 | 1 | 1 | 0 | 0 |
| Part 4 | 1 | 1 | 1 | 1 | 1 | 1 | 0 | 0 | 1 | 1 | 0 | 0 | 0 | 1 | 0 | 0 |
| Part 5 | 0 | 0 | 1 | 1 | 0 | 0 | 1 | 0 | 0 | 0 | 1 | 0 | 0 | 0 | 0 | 0 |
| Part 6 | 0 | 0 | 1 | 1 | 0 | 0 | 0 | 0 | 1 | 0 | 0 | 1 | 0 | 0 | 0 | 0 |
| Part 7 | 0 | 0 | 1 | 1 | 0 | 0 | 0 | 0 | 0 | 0 | 0 | 0 | 1 | 0 | 0 | 0 |
| Part 8 | 0 | 0 | 1 | 0 | 0 | 0 | 0 | 0 | 1 | 0 | 0 | 0 | 0 | 1 | 0 | 0 |
| Part 9 | 1 | 1 | 1 | 0 | 0 | 0 | 0 | 0 | 0 | 0 | 0 | 0 | 0 | 1 | 0 | 0 |
| Part 10 | 0 | 0 | 1 | 0 | 0 | 0 | 1 | 0 | 0 | 0 | 0 | 0 | 0 | 0 | 0 | 1 |
| Part 1 | Part 2 | Part 3 | Part 4 | Part 5 | Part 6 | Part 7 | Part 8 | Part 9 | Part 10 | Emp.Dem. | Brand Image | Loss Sales C.D | Loss SalesP.B.I | Cust. Satisf. | Sellers Not Trust | |
|---|---|---|---|---|---|---|---|---|---|---|---|---|---|---|---|---|
| Part 1 | 0.438 | 0.017 | 0.026 | 0.035 | 0.087 | 0.059 | 0.035 | 0.034 | 0.040 | 0.033 | 0.041 | 0.055 | 0.030 | 0.026 | 0.030 | 0.038 |
| Part 2 | 0.034 | 0.467 | 0.030 | 0.033 | 0.019 | 0.044 | 0.032 | 0.034 | 0.037 | 0.032 | 0.135 | 0.172 | 0.142 | 0.134 | 0.141 | 0.161 |
| Part 3 | 0.034 | 0.112 | 0.317 | 0.243 | 0.023 | 0.171 | 0.155 | 0.110 | 0.045 | 0.047 | 0.216 | 0.187 | 0.272 | 0.255 | 0.201 | 0.207 |
| Part 4 | 0.069 | 0.125 | 0.151 | 0.300 | 0.024 | 0.190 | 0.118 | 0.110 | 0.037 | 0.035 | 0.132 | 0.123 | 0.115 | 0.121 | 0.110 | 0.109 |
| Part 5 | 0.248 | 0.023 | 0.023 | 0.060 | 0.479 | 0.044 | 0.032 | 0.089 | 0.097 | 0.130 | 0.018 | 0.015 | 0.014 | 0.014 | 0.014 | 0.015 |
| Part 6 | 0.035 | 0.062 | 0.141 | 0.101 | 0.024 | 0.208 | 0.061 | 0.034 | 0.040 | 0.035 | 0.071 | 0.096 | 0.076 | 0.066 | 0.064 | 0.104 |
| Part 7 | 0.035 | 0.042 | 0.098 | 0.061 | 0.079 | 0.059 | 0.383 | 0.034 | 0.040 | 0.033 | 0.037 | 0.053 | 0.016 | 0.022 | 0.041 | 0.058 |
| Part 8 | 0.035 | 0.099 | 0.170 | 0.096 | 0.091 | 0.133 | 0.119 | 0.487 | 0.142 | 0.143 | 0.088 | 0.076 | 0.054 | 0.049 | 0.064 | 0.065 |
| Part 9 | 0.035 | 0.036 | 0.022 | 0.033 | 0.084 | 0.048 | 0.032 | 0.034 | 0.483 | 0.032 | 0.215 | 0.167 | 0.264 | 0.285 | 0.301 | 0.207 |
| Part 10 | 0.035 | 0.016 | 0.021 | 0.037 | 0.087 | 0.044 | 0.032 | 0.034 | 0.037 | 0.480 | 0.045 | 0.054 | 0.017 | 0.027 | 0.033 | 0.035 |
| Emp. Dem. | 0.000 | 0.000 | 0.000 | 0.000 | 0.000 | 0.000 | 0.000 | 0.000 | 0.000 | 0.000 | 0.039 | 0.121 | 0.066 | 0.051 | 0.056 | 0.022 |
| Brand Image | 0.000 | 0.000 | 0.000 | 0.000 | 0.000 | 0.000 | 0.000 | 0.000 | 0.000 | 0.000 | 0.419 | 0.000 | 0.282 | 0.433 | 0.315 | 0.373 |
| Loss Sales C.D. | 0.000 | 0.000 | 0.000 | 0.000 | 0.000 | 0.000 | 0.000 | 0.000 | 0.000 | 0.000 | 0.091 | 0.050 | 0.000 | 0.028 | 0.037 | 0.052 |
| Loss Sales P.B.I. | 0.000 | 0.000 | 0.000 | 0.000 | 0.000 | 0.000 | 0.000 | 0.000 | 0.000 | 0.000 | 0.118 | 0.053 | 0.031 | 0.027 | 0.030 | 0.068 |
| Cust. Satisf. | 0.000 | 0.000 | 0.000 | 0.000 | 0.000 | 0.000 | 0.000 | 0.000 | 0.000 | 0.000 | 0.304 | 0.534 | 0.482 | 0.302 | 0.456 | 0.327 |
| Sellers not trusted | 0.000 | 0.000 | 0.000 | 0.000 | 0.000 | 0.000 | 0.000 | 0.000 | 0.000 | 0.000 | 0.028 | 0.241 | 0.139 | 0.159 | 0.107 | 0.157 |
| Part 1 | Part 2 | Part 3 | Part 4 | Part 5 | Part 6 | Part 7 | Part 8 | Part 9 | Part 10 | Emp. Dem. | Brand Image | Loss Sales C.D | Loss Sales P.B.I | Cust. Satisf. | Sellers Not Trust | |
|---|---|---|---|---|---|---|---|---|---|---|---|---|---|---|---|---|
| Part 1 | 0.069 | 0.069 | 0.069 | 0.069 | 0.069 | 0.069 | 0.069 | 0.069 | 0.069 | 0.069 | 0.069 | 0.069 | 0.069 | 0.069 | 0.069 | 0.069 |
| Part 2 | 0.057 | 0.057 | 0.057 | 0.057 | 0.057 | 0.057 | 0.057 | 0.057 | 0.057 | 0.057 | 0.057 | 0.057 | 0.057 | 0.057 | 0.057 | 0.057 |
| Part 3 | 0.137 | 0.137 | 0.137 | 0.137 | 0.137 | 0.137 | 0.137 | 0.137 | 0.137 | 0.137 | 0.137 | 0.137 | 0.137 | 0.137 | 0.137 | 0.137 |
| Part 4 | 0.122 | 0.122 | 0.122 | 0.122 | 0.122 | 0.122 | 0.122 | 0.122 | 0.122 | 0.122 | 0.122 | 0.122 | 0.122 | 0.122 | 0.122 | 0.122 |
| Part 5 | 0.130 | 0.130 | 0.130 | 0.130 | 0.130 | 0.130 | 0.130 | 0.130 | 0.130 | 0.130 | 0.130 | 0.130 | 0.130 | 0.130 | 0.130 | 0.130 |
| Part 6 | 0.073 | 0.073 | 0.073 | 0.073 | 0.073 | 0.073 | 0.073 | 0.073 | 0.073 | 0.073 | 0.073 | 0.073 | 0.073 | 0.073 | 0.073 | 0.073 |
| Part 7 | 0.084 | 0.084 | 0.084 | 0.084 | 0.084 | 0.084 | 0.084 | 0.084 | 0.084 | 0.084 | 0.084 | 0.084 | 0.084 | 0.084 | 0.084 | 0.084 |
| Part 8 | 0.185 | 0.185 | 0.185 | 0.185 | 0.185 | 0.185 | 0.185 | 0.185 | 0.185 | 0.185 | 0.185 | 0.185 | 0.185 | 0.185 | 0.185 | 0.185 |
| Part 9 | 0.072 | 0.072 | 0.072 | 0.072 | 0.072 | 0.072 | 0.072 | 0.072 | 0.072 | 0.072 | 0.072 | 0.072 | 0.072 | 0.072 | 0.072 | 0.072 |
| Part 10 | 0.071 | 0.071 | 0.071 | 0.071 | 0.071 | 0.071 | 0.071 | 0.071 | 0.071 | 0.071 | 0.071 | 0.071 | 0.071 | 0.071 | 0.071 | 0.071 |
| Emp. Dem. | 0.000 | 0.000 | 0.000 | 0.000 | 0.000 | 0.000 | 0.000 | 0.000 | 0.000 | 0.000 | 0.000 | 0.000 | 0.000 | 0.000 | 0.000 | 0.000 |
| Brand Image | 0.000 | 0.000 | 0.000 | 0.000 | 0.000 | 0.000 | 0.000 | 0.000 | 0.000 | 0.000 | 0.000 | 0.000 | 0.000 | 0.000 | 0.000 | 0.000 |
| Loss Sales C.D. | 0.000 | 0.000 | 0.000 | 0.000 | 0.000 | 0.000 | 0.000 | 0.000 | 0.000 | 0.000 | 0.000 | 0.000 | 0.000 | 0.000 | 0.000 | 0.000 |
| Loss Sales P.B.I. | 0.000 | 0.000 | 0.000 | 0.000 | 0.000 | 0.000 | 0.000 | 0.000 | 0.000 | 0.000 | 0.000 | 0.000 | 0.000 | 0.000 | 0.000 | 0.000 |
| Cust. Satisf. | 0.000 | 0.000 | 0.000 | 0.000 | 0.000 | 0.000 | 0.000 | 0.000 | 0.000 | 0.000 | 0.000 | 0.000 | 0.000 | 0.000 | 0.000 | 0.000 |
| Sellers not trusted | 0.000 | 0.000 | 0.000 | 0.000 | 0.000 | 0.000 | 0.000 | 0.000 | 0.000 | 0.000 | 0.000 | 0.000 | 0.000 | 0.000 | 0.000 | 0.000 |
| Alternatives | Total | Normal | Ideal | Ranking |
|---|---|---|---|---|
| Part 1 | 0.0694 | 0.0694 | 0.3750 | 9 |
| Part 2 | 0.0567 | 0.0567 | 0.3060 | 10 |
| Part 3 | 0.1375 | 0.1375 | 0.7424 | 2 |
| Part 4 | 0.1218 | 0.1218 | 0.6578 | 4 |
| Part 5 | 0.1296 | 0.1296 | 0.7000 | 3 |
| Part 6 | 0.0727 | 0.0727 | 0.3929 | 6 |
| Part 7 | 0.0841 | 0.0841 | 0.4540 | 5 |
| Part 8 | 0.1852 | 0.1852 | 1.0000 | 1 |
| Part 9 | 0.0721 | 0.0721 | 0.3895 | 7 |
| Part 10 | 0.0709 | 0.0709 | 0.3826 | 8 |
| Top 4 Result AHP | Top 4 Result ANP | |
|---|---|---|
| Part 1 | Part 8 | |
| Part 2 | Part 5 | |
| Part 3 | Part 3 | |
| Part 4 | Part 4 | |
| Annual warranty cost reduction | EUR 2.186.353 | EUR 1.582.996 |
| % Annual warranty cost reduction | 18.45% | 13.36% |
| Number of parts with failure reduction | 1.483 | 3.189 |
| % parts failure decrease | 2.83% | 5.12% |
| Part Description | Re-Engineering Cost | AHP Result | ANP Result |
|---|---|---|---|
| Part 1 | 357.000 | 1 | 9 |
| Part 2 | 2.380.000 | 2 | 10 |
| Part 3 | 595.000 | 3 | 2 |
| Part 4 | 1.700.000 | 4 | 4 |
| Part 5 | 357.000 | 8 | 3 |
| Part 6 | 350.000 | 5 | 6 |
| Part 7 | 2380.000 | 9 | 5 |
| Part 8 | 357.000 | 6 | 1 |
| Part 9 | 140.000 | 7 | 7 |
| Part 10 | 1.700.000 | 10 | 8 |
| Parts Prioritized | Re-Engineering Cost | Warranty Spend (EUR) | Number of Incidents |
|---|---|---|---|
| Part 1 | 357.000 | 608.854 | 859 |
| Part 8 | 357.000 | 205.560 | 275 |
| Part 5 | 357.000 | 375.083 | 2.535 |
| Part 3 | 595.000 | 503.982 | 113 |
| Part 4 | 1.700.000 | 498.370 | 266 |
| Total | 3.332.000 | 2.191.850 | 4.048 |
Publisher’s Note: MDPI stays neutral with regard to jurisdictional claims in published maps and institutional affiliations. |
© 2022 by the authors. Licensee MDPI, Basel, Switzerland. This article is an open access article distributed under the terms and conditions of the Creative Commons Attribution (CC BY) license (https://creativecommons.org/licenses/by/4.0/).
Share and Cite
Pérez-Fernández, L.; Sebastián, M.A.; González-Gaya, C. Methodology to Optimize Quality Costs in Manufacturing Based on Multi-Criteria Analysis and Lean Strategies. Appl. Sci. 2022, 12, 3295. https://doi.org/10.3390/app12073295
Pérez-Fernández L, Sebastián MA, González-Gaya C. Methodology to Optimize Quality Costs in Manufacturing Based on Multi-Criteria Analysis and Lean Strategies. Applied Sciences. 2022; 12(7):3295. https://doi.org/10.3390/app12073295
Chicago/Turabian StylePérez-Fernández, Lorena, Miguel A. Sebastián, and Cristina González-Gaya. 2022. "Methodology to Optimize Quality Costs in Manufacturing Based on Multi-Criteria Analysis and Lean Strategies" Applied Sciences 12, no. 7: 3295. https://doi.org/10.3390/app12073295
APA StylePérez-Fernández, L., Sebastián, M. A., & González-Gaya, C. (2022). Methodology to Optimize Quality Costs in Manufacturing Based on Multi-Criteria Analysis and Lean Strategies. Applied Sciences, 12(7), 3295. https://doi.org/10.3390/app12073295