Article

A Preliminary Experimental Study on the Workers’ Workload Assessment to Design Industrial Products and Processes

by
Agnese Brunzini
1,
Margherita Peruzzini
2,*,
Fabio Grandi
2,
Riccardo Karim Khamaisi
2 and
Marcello Pellicciari
3
1
Department of Industrial Engineering and Mathematical Sciences, Università Politecnica delle Marche, 60121 Ancona, Italy
2
Department of Engineering “Enzo Ferrari”, University of Modena and Reggio Emilia, 41121 Modena, Italy
3
Department of Sciences and Methods for Engineering, University of Modena and Reggio Emilia, 42124 Reggio Emilia, Italy
*
Author to whom correspondence should be addressed.
Appl. Sci. 2021, 11(24), 12066; https://doi.org/10.3390/app112412066
Submission received: 15 November 2021 / Revised: 13 December 2021 / Accepted: 15 December 2021 / Published: 17 December 2021

Abstract

:
The human-centered design (HCD) approach places humans at the center of design in order to improve both products and processes, and to give users an effective, efficient and satisfying interactive experience. In industrial design and engineering, HCD is very useful in helping to achieve the novel Industry 5.0 concept, based on improving workers’ wellbeing by providing prosperity beyond jobs and growth, while respecting the production limits of the planet as recently promoted by the European Commission. In this context, the paper proposes an ergonomic assessment method based on the analysis of the workers’ workload to support the design of industrial products and processes. This allows the simultaneous analysis of the physical and cognitive workload of operators while performing their tasks during their shift. The method uses a minimum set of non-invasive wearable devices to monitor human activity and physiological parameters, in addition to questionnaires for subjective self-assessment. The method has been preliminarily tested on a real industrial case in order to demonstrate how it can help companies to support the design of optimized products and processes promoting the workers’ wellbeing.

1. Introduction

The modern industrial scenario is looking for sustainable and resource-efficient flexible production models, based on optimized interactions between people, machines, and products [1]. In this context, machines, products, and people are required to support each other in task execution and decision-making. Therefore, the role of human work is changing; today humans can be easily supported by machines in physically intensive or dangerous tasks, while they need to control the processes and face high-level tasks (e.g., problem-solving, abstraction, managing) by increasing the cognitive load [2]. Tasks will become increasingly shared between humans and machines, requiring not only new models to manage and control the processes [3], but also to understand and consider the users’ needs [4], according to human-centered approaches adopted to both processes [5] and products [6].
In this context, the European Commission has recently promoted a complementary new approach, called Industry 5.0, where “the wellbeing of the worker is placed at the centre of the production process and uses new technologies to provide prosperity beyond jobs and growth while respecting the production limits of the planet” [7]. Such an approach focuses on promoting a more sustainable vision in industry to ensure a win-win for both companies and society. Specifically, Industry 5.0 aims at a more human-centric, resilient and sustainable approach to the design of industrial operations systems, including production, logistics, and maintenance.
Designing human-centric products and processes is an already known practice, however it is one that is still poorly used within industry. Human-centered design (HCD) is a design method based on an iterative process that systematically involves the users during all product/process development phases; this has been successfully applied since its early conception, emphasizing the humanistic approach and the way in which products, workplaces, devices and technology are designed [8,9,10]. HCD is intrinsically related to the human pillar of sustainability, which focuses on the importance of involving users in the making of products or services [11]. The role of HCD has been widely exploited, however it is becoming more and more significant today in the definition of modern workplaces and smart, assistive products, with the final aim being to support operators so they can achieve higher levels of performance, to assure comfort and safety, and to enable a more efficient human-machine interaction. This fact implies the rethinking of factory processes from a human perspective, integrating human factors in system design and development. The so-called human factors integration (HFI) technique [12] pushed to adopt the most suitable technologies necessary to validate the new processes and create new interaction product features and interfaces to valorize human capabilities [13]. This consists of applying the existing knowledge about users’ needs and limitations, as well as ergonomics within engineering process design to optimize the workers’ wellbeing and to finally improve working conditions and results. Nevertheless, today the main challenge is to understand how to effectively realize HFI by selecting the most suitable techniques required to evaluate the user experience (UX) and the human-machine interaction according to the specific context of application, in order to mutually enhance the system performance and the workers’ wellbeing [14,15]. The user experience refers to the user’s perceptions and responses that result from the use of a system, product, or service; this includes users’ emotions, perceptions, comfort, and behaviors [16]. However, the human factors assessment in the automotive industry has, to date, mainly focused on physical ergonomics, analyzing the risks related to incongruous postures and the handling of loads, without considering the cognitive and emotional aspects [17]. Human factors have been introduced in engineering that consider the physical risks that correlate with possible musculoskeletal disorders, and that concurrently assess the psychological, social, and cultural needs of human beings [16], in order to guarantee human comfort and safety, and consequently to improve user performance. Indeed, for human performance optimization, it is fundamental to avoid stressful physical and mental conditions, cognitive under- and over-loads. For this reason, the analysis of physical and cognitive ergonomics is becoming more and more indispensable, even in the industrial sector.
In this context, this paper proposes an ergonomic method to assess the operator’s experience in terms of physical and cognitive workload, trying also to distinguish between cognitive demand and stress, to support the design of industrial products and processes. The paper’s main contributions are:
  • The definition of a novel holistic ergonomic assessment method, which includes both physical and cognitive ergonomic evaluations, and that can easily be adopted during workers’ shifts within industrial environments;
  • An improved analysis of human cognitive conditions that represents the most critical aspect in the modern industrial scenario, where interaction is more complex, mentally demanding, and potentially stressful;
  • A focus on industrial task analysis, as the majority of the existing literature is aimed towards other domains (e.g., healthcare, aviation).
The paper is structured as follows: Section 2 presents the research background; Section 3 describes the proposed assessment method in detail; Section 4 describes the experimental study; Section 5 discusses the achieved results; and finally Section 6 is about the conclusions and recommendations for future work.

2. Research Background

Ergonomics is an applied science concerned with designing things (i.e., products, processes, tasks, environments) to make with the aim being that people use them efficiently and safely, thus improving the system performance and overall worker satisfaction [18]. For years physical ergonomics has been recognized as an area that focuses on physical and musculoskeletal aspects, however there has been a realization that cognitive ergonomics also plays a fundamental role, and in order to improve human performance and satisfaction, cognitive ergonomics must be taken into account. This was first demonstrated in the design of nuclear power plants and air traffic control systems. In the last 5–6 years, cognitive workload assessment has also spread into industrial sectors, from process manufacturing to transport, construction, and energy [17]. The main objective of cognitive ergonomics is to improve the performance of human tasks in complex, dynamic and technologically advanced environments, through the design of effective support, understanding the fundamental principles of human activities associated with the principles of engineering design and development. As such, it has been demonstrated that the optimization of physical and mental workload, comfort, and perceived effort is necessary to prevent disorders and stressful conditions, assuring the best human performances [19]. This would consequently lead to systems and environments optimal design, product, and process quality enhancement and, at last, industrial cost reduction. The physical and cognitive factors that can affect the users’ performance and the quality of human-machine interaction are several: from the level of the perceived workload to task complexity, the overload of information, or time pressure.

2.1. Physical Comfort Evaluation

Physical effort assessment mainly refers to the study of the postures assumed by the operators during the work shift and the efforts in handling of loads, tools, and equipment, depending on the features of the operating spaces and the workstation layout. Postural risk generally considers manual handling of loads and repetitive movements, favoring the onset of muscle–skeletal disorders and pathologies, the so-called work-related musculoskeletal disorders (WMSDs) [20]. For these reasons, many methods have been developed to assess the factors related to physical risk exposure. Among these factors, we can find the frequency of movements and their duration, use of tools, awkward postures, postural loading, effect of vibration, and so on [21]. The reference legislation for assessing the risk related to the assumption of incongruous postures is wide and includes different aspects [22,23,24,25]. Among the several available, the most applied methods are the Rapid Upper Limb Analysis (RULA, which includes particular attention to the neck, trunk, shoulders, arms and wrists) [26], the Rapid Entire Body Assessment (REBA, that considers all the body parts, included the inferior ones) [27], the Ovako Working posture Analysis System (OWAS, which consists of a four-digit number, representing the: (1) back; (2) arms; (3) lower limbs; and (4) handled load classification) [28]. Also, the Occupational Repetitive Actions (OCRA) analysis considers the frequency and repetitiveness of movements, use of force, type of posture, recovery period distribution and additional factors, and provides two separate indices (shoulder and elbow/wrist/hand) for each of the right and left sides of the body [29]. The NIOSH equation allows the assessment of the risks involved in material handling tasks (for loads ≥ 3kg) [30]. The acquisition of the data necessary to perform the analysis has been based, for decades, on the direct observation of the operator during the execution of a specific task, by an experienced ergonomist. The spread of motion capture devices has then been exploited to automate this phase, with considerable benefits in terms of time, costs, and accuracy of results [31].

2.2. Cognitive Evaluation

Cognitive assessment involves the analysis of psychological processes such as awareness, understanding, human information elaboration, reasoning, and the use of knowledge, as it concerns human interaction with other system components. The analysis of the Mental Workload (MWL) is one of the most widely studied topics; it “emerges from the interaction between the requirements of a task, the circumstances under which it is performed, and the skills, behaviors, and perceptions of the operator” [32]. MWL assumes that each person has a relatively limited cognitive capacity that deals with auditory, verbal, and visual material; this capacity is likened to a pool from which resources can be drawn to meet the demands of ongoing tasks [33]. Moreover, the response to the same stimuli differs among users, being different in the capabilities of everyone. MWL can positively or negatively affect human performances; in this direction, measuring the MWL means to quantify the mental “cost” of performing a task in order to predict the performances [34]. In the design of industrial systems, measuring the MWL can help to identify sources of errors and understand the complexity of a task as perceived by workers. According to [35] the MWL assessment methods are classified into four main broad categories: performance assessment method, self-assessment (or subjective scaling) method, physiological measurements method, and job and task analysis. Examples of common performance parameters are response, reaction time, accuracy, error rate, estimation time, and objective speed [36]. The combination of different methods is necessary to have a clearer picture of the perceived workload, due to the complexity of cognitive processes. Self-assessment measures allow the user to subjectively evaluate the perceived workload needed to accomplish a task, using questionnaires or psychometric scales. This evaluation is based on the personal experience of the interaction with the system and is obtained from the direct estimation of task difficulty. The most used tool for workload subjective assessment, applied in several research studies, is the multidimensional questionnaire NASA Task Load Index (NASA-TLX) that allows the assessment of six different domains (mental, physical, and temporal demands, performance, effort, and frustration) [37,38,39]. Such data can be used to understand how the workload varies over time or to compare the operators’ perceived workload (e.g., with and without a particular tool, or between different systems). Physiological measures consider physiological responses of the human body that are believed to be correlated with MWL. Indeed, changes in specific parameters, such as heart rate (HR), heart rate variability (HRV), eye activity (like pupil diameter, gaze entropy, and eye movements’ velocity), brain activity (EEG), breathing rate (BR), galvanic skin response or electrodermal activity (GSR or EDA), can be indirect indicators of mental workload [40,41,42]. However, all the mentioned physiological parameters can be easily influenced by external factors such as physical activity, environment, and psychological elements (such as emotional involvement) that are not related to the analyzed activity [43], so the analysis has to be properly tailored to the specific context. Also, high levels of inter- and intra-individual variability of biometric indices exist, and sometimes it could be difficult to distinguish MWL from stress or mental fatigue.

2.3. Stress Evaluation

Stress is a concept that includes a wide spectrum of variables and cognitive processes and, for this reason, can be misinterpreted or confused with other kinds of negative emotions. Stress can be described as two general types of response: anxiety or frustration, and the physiological response of the sympathetic nervous system, which emerges after a challenge or threat. As for the mental workload, even stress can affect human performance. Even if the multimodal dimension of stress makes the research field very broad, according to [35], stress can be detected through four main criteria: physiological; behavioral; psychological; and biochemical. The most common analyses typically include the subjective assessment method based on self-report, such as the State-Trait Anxiety Inventory (STAI) [44] or the Numerical Analogue Scale (NAS) [45]. Diversely, mental fatigue is defined as the loss of work capacity triggered by prolonged periods of demanding cognitive activity [46], due to technical complications, time pressure, distractions, interruptions, errors, or increased workload [47]. According to [48], psychological stress is the effect of all conditions with a mental impact on a subject, either cognitive or emotional. As such, it emerges when the perceived demands of the environment exceed a person’s ability to cope with these demands [49]. Stress is also defined as a “state of high general arousal and negatively tuned but unspecific emotion, which appears as a consequence of stressors acting upon individuals” [50]. Reactions caused by stress such as changes in skin conductance (sweating), heart rate (tachycardia), blood pressure (increase), during and immediately after performing a stressful task, have been demonstrated. However, physiological reactions emerge while experiencing both negative stress and positive stress [50], and, through the monitoring of physiological signals, only the intensity can be assessed, not the valence. For this reason, studies found that the reliability of stress measurement can be improved by combining physiological and psychological, subjective measures [51].
The main limitations of the current research are related to the lack of structured, ready to use methodologies for the assessment of the operator’s workload in industrial contexts, considering the different perspectives. Indeed, even if several studies exist regarding the workers’ physical ergonomics, and recent studies are emerging about the analysis of the operators’ cognitive load, a comprehensive assessment method, suitable also for on-field analysis, is still missing. For this reason, the aim of the paper is to design and develop a holistic workload assessment method, considering the physical and mental efforts that the operator feels and perceives during the work shift, supported by preliminary experimental evidence. The proposed method also tries to distinguish between the mental workload and stress related to the task activities.

3. The Proposed Method for Operators’ Workload Assessment

The proposed assessment method has been designed to support the design of every kind of industrial product, process, or environment: it allows the simultaneous analysis of both the physical and cognitive workload of operators while performing habitual tasks during the work shift. The method has been defined to be cause the minimum amount of intrusion as possible for the operator: this involves a minimum set of non-invasive wearable devices for the monitoring of motions and physiological parameters, and only two questionnaires for the subjective self-assessment of cognitive conditions. In fact, if the set-up is not properly defined, this may influence the physical and cognitive perception, altering the overall user experience of the operator.
The user is asked to wear a set of trackers to enable motion capture for postural and activity analysis, together with an eye-tracker device for eye activity monitoring, and a bracelet for biometric monitoring. Motion capture allows a physical workload analysis, while the two latter devices (i.e., eye tracking and bracelet) are able to collect different kinds of physiological parameters, such as heart rate (HR), inter-beat interval (IBI, RR), electrodermal activity (EDA), pupil diameter (PD), that can be properly combined to monitor the cognitive workload, and to detect eventual mental overload and stressful conditions. To strengthen the reliability of the cognitive assessment, the method also includes the administration of questionnaires (NAS and NASA-TLX) for the self-assessment of the perceived cognitive and emotional conditions, before and after the execution of the tasks. NAS is a unidimensional scale that consists of a line divided into 10 intervals, numbered from 0 to 10, where 0 indicates the absence of perceived stress, and 10 the presence of a very strong stress. The worker is asked to select the whole number (0–10 integers) that best reflects the intensity of the perceived stress immediately after the tasks’ execution. Also, the scale must be answered before starting the tasks to record the basal level of perceived stress, and at the end of the procedure, after a brief period of rest to verify that the stress perception came back to the basal level. The NAS questionnaire has been selected among other questionnaires as studies suggest it as a valid, effective, and easy-to-implement tool for the rapid assessment of perceived stress in the industrial environment. On the other side, the multidimensional NASA-TLX has been chosen to discriminate between different cognitive and emotional states. Indeed, through the six items, it is possible to evaluate not only the perceived mental demand, but also the feelings of frustration, effort, and the performance. The worker is asked to fulfil the questionnaire at the end of the task execution. Moreover, the assessment method includes the analysis of the performances to be correlated with the cognitive conditions. By video recording and reporting the actions of the operators, it is possible to analyze the execution times and the committed errors, which may derive from unbalanced mental workload.
The proposed assessment method is based on the combined analysis referring to the postural risk, the mental workload, and the stress. Different classes of parameters are considered:
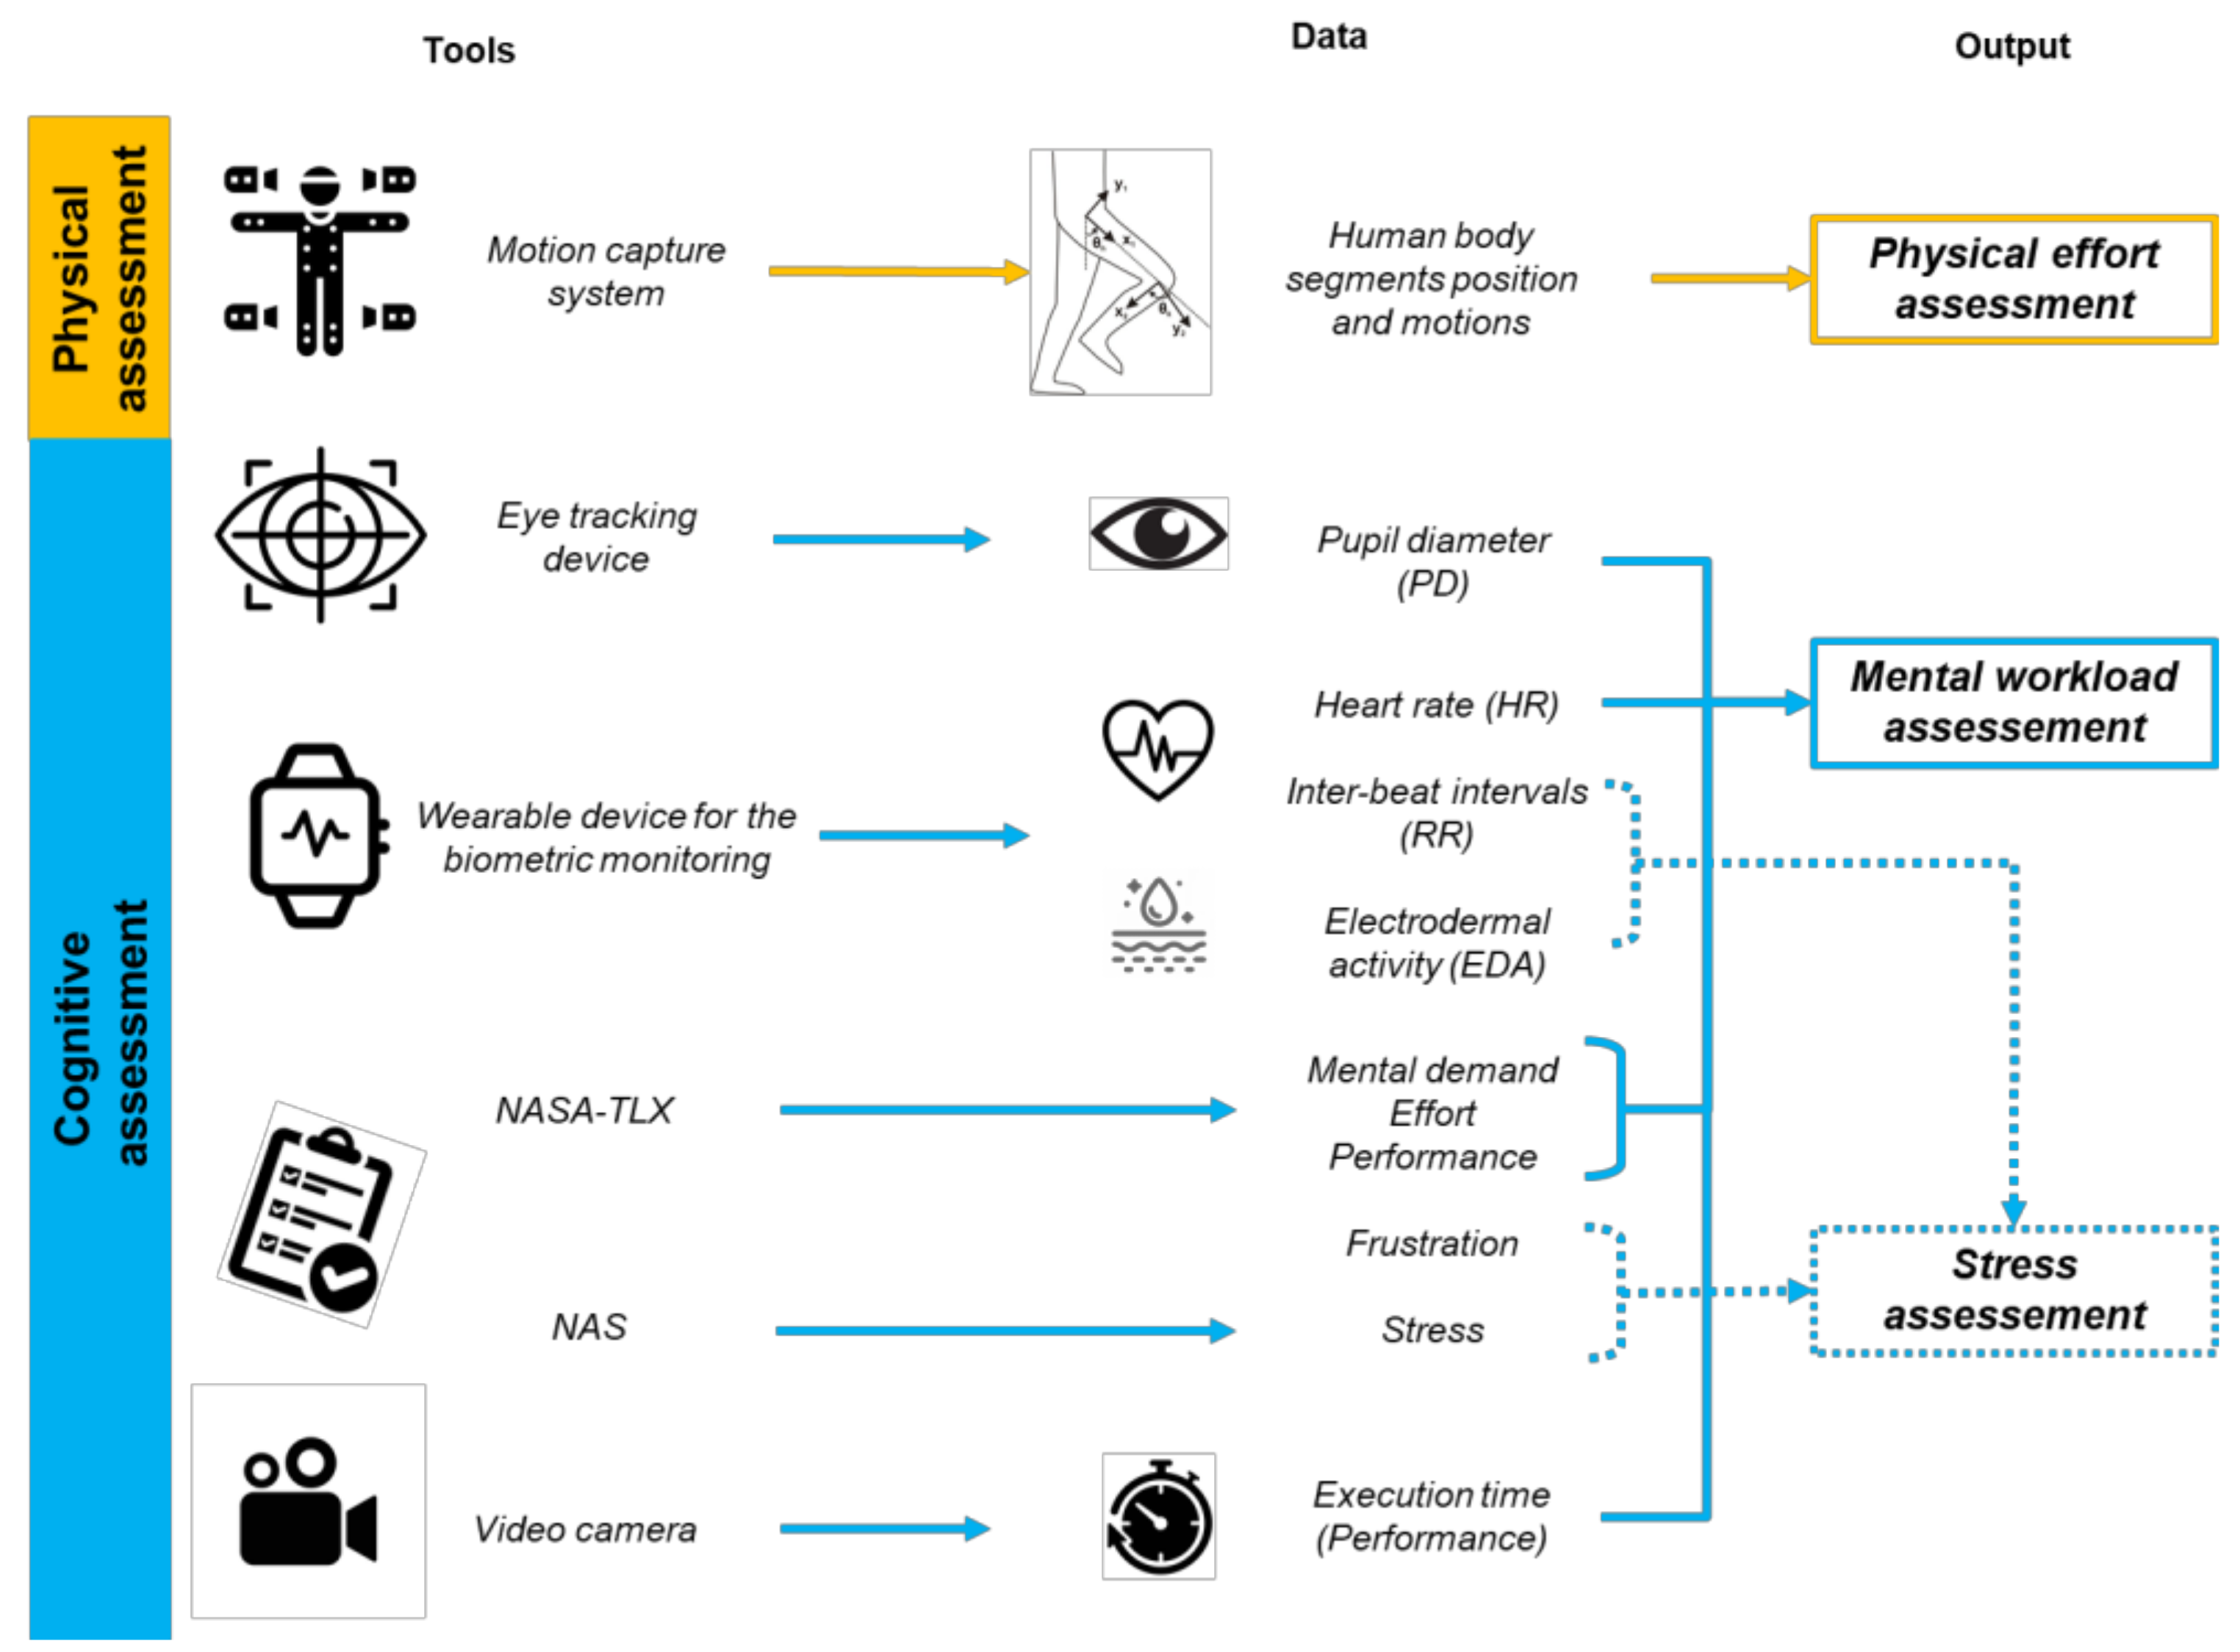
  • Human body segment position and motions into the three-dimensional space, collected by the motion capture systems;
  • Pupil diameter collected by the eye tracking system;
  • Physiological parameters referring to the user’s cardiovascular activity (i.e., HR and RR) and skin conductance (i.e., EDA), collected by the biometric wearable device;
  • Subjective assessment based on NAS and NASA-TLX questionnaires;
  • Performance data like execution time, collected by video analysis.
A proper integration and processing of such parameters can provide an early assessment of the physical effort, the mental workload and the perceived stress. In particular, physical effort is usually assessed by ergonomic indexes, such as RULA or REBA. The general score of a posture obtained by the use of these indexes indicates the potential risk of development of musculoskeletal disorders, according to different scales. Usually the higher the score, the higher the degree of risk. For the assessment of the cognitive conditions, scientific studies have proved that HR increases as MWL increases, and HRV decreases with increasing mental demand [52]. These cardiovascular parameters may change if the measurements are taken after, and not during, the stressful or mentally demanding event. They could also vary consistently with different levels of stress [53]. For this reason, it is essential to monitor the physiological parameters for the entire duration of the activity to be analyzed. With regard to the eye-related metrics, variations due to a high level of MWL are present in pupil diameter (increment), fixation frequency (decrement), and saccadic frequency (decrement). Opposing results about fixation duration, blink duration and frequency are available in the literature [54,55,56]. For this reason, in this work, the focus is on the pupil diameter. Furthermore, some studies have highlighted the relationship between the electrodermal activity (EDA) and mental states such as stress, anxiety, fatigue, emotional involvement, mental load, and the level of the excitement caused by the perceived emotion [57]. However, electrodermal activity is considered “one of the most sensitive psychophysiological indicators of stress” [50]. Generally the eye-related parameters are used to evaluate the mental workload, while the cardiovascular parameters, along with the electrodermal activity being monitored, are exploited to assess the human stress [58]. Moreover, the performance analysis should be considered in the workload assessment. Indeed, a lowered and/or irregular performance may indicate that the user is reaching unacceptable levels of MWL. Through the secondary task method, it is possible to calculate the mental load associated with the primary one [59].
Figure 1 shows the proposed technological set-up and the related collected data to provide the assessment of workers’ physical effort, mental workload, and stress.
The proposed assessment method is based on a previous study [60] focused on the definition of a unique UX index to be used during virtual task execution to support the design of assembly human tasks. The previous method has been refined in order to be more robust and general-purpose, and properly extended to better discriminate the cognitive assessment between mental workload and stress.
The physical assessment is calculated using the motion capture system. Using the position of body segment trackers, the instant RULA score of operators performing the task for each body side (right and left) can be extracted. The RULA subtask score is calculated as the maximum value reached during the sub-task execution between right and left side, as follows:
R U L A   s u b t a s k = R U L A   m a x   ( R U L A   r i g h t   ,   R U L A   l e f t   )
From physiological data analysis, a set of parameters are defined as follows. Heart activity parameter (HA) is calculated as:
H A = H R   m e a n H R   b a s e l i n e H R   m a x H R   b a s e l i n e
where HR mean is the mean value of the specific user’s HR as collected during the task execution, HR baseline is the mean HR value as recorded during the user’s baseline phase, and HR max is the maximum HR value reached during the task execution for each user.
Similarly, RR variability (RR) is calculated as follows:
R R = R R   m e a n R R   b a s e l i n e R R   m a x R R   b a s e l i n e
where RR mean and RR max are calculated in the same manner as the previous parameter during the task execution, while RR baseline is the mean RR value as recorded during the user’s baseline phase.
Similarly, pupil activity parameter (PA) is calculated as follows:
P A = P D   m e a n P D   b a s e l i n e P D   m a x P D   b a s e l i n e  
where PD user is defined as the mean value of the specific user’s PD as recorded during the task execution, PD baseline is the mean PD value as recorded during the user’s baseline phase, and PD max is the maximum PD value as recorded for each user during the task performance.
With the same approach, electrodermal activity (EDA) is calculated as follows:
E D A = E D A   m e a n E D A   b a s e l i n e E D A   m a x E D A   b a s e l i n e
where EDA mean and EDA max are calculated in the same manner as the previous parameters during task performance while EDA baseline is the mean EDA value as recorded during the user’s baseline phase.
Performance analysis is mainly based on the time taken to accomplish the task, collecting data from video analysis. With regard to performance analysis, the User Time (UT) parameter is calculated considering the user time performance. The time to accomplish the task is clocked for each user (T) and compared with the time employed by the user who took less time (T min) and the time employed by the user who took the longest time (T max), as shown in the following equation:
U T = T T   m i n   T   m a x T   m i n  
The subjective assessment is used to weight the calculated physiological parameters, to include the operator’s perceptions. The NASA-TLX assesses the perceived workload according to six questions for each user on a 100-graduations scale: for this study we considered the Mental Demand judgment to weight the PD parameter, the Frustration Level judgment to weight the RR parameter, the Effort Level judgment to weight the HA parameter, and finally the Overall Performance judgment to weight the UT parameter. Each judgment is then normalized to a 5-point scale. According to this, a set of weights ranging from 1 to 5 can be defined to consider the user’s subjective experience. Similarly, from NAS questionnaires, this score (structured on a 1 to 10 scale and normalized to a 5-point scale) has been considered to weight the EDA parameter.
The above-mentioned parameters, properly weighted as described, are used to generate three workload metrics: the Postural Workload (PW), the Mental Workload (MW) and Stress (S). The PW is calculated as follows, considering the mean value of RULA score during the task:
P W = m e a n   ( R U L A   s u b t a s k )  
while the MW one is computed as:
M W = ω 1 P A + ω 3 H A + ω 5 U T
where ω1 is the Mental Demand weight, ω3 is the Effort weight (since it also considers the mental effort) and ω5 is the Performance weight (since the scientific literature relates it to the mental demand), and finally the S is defined as follows:
S = ω 2 R R + ω 4 E D A
where ω2 is Frustration weight and ω4 is NAS derived weight.

4. Experimental Study

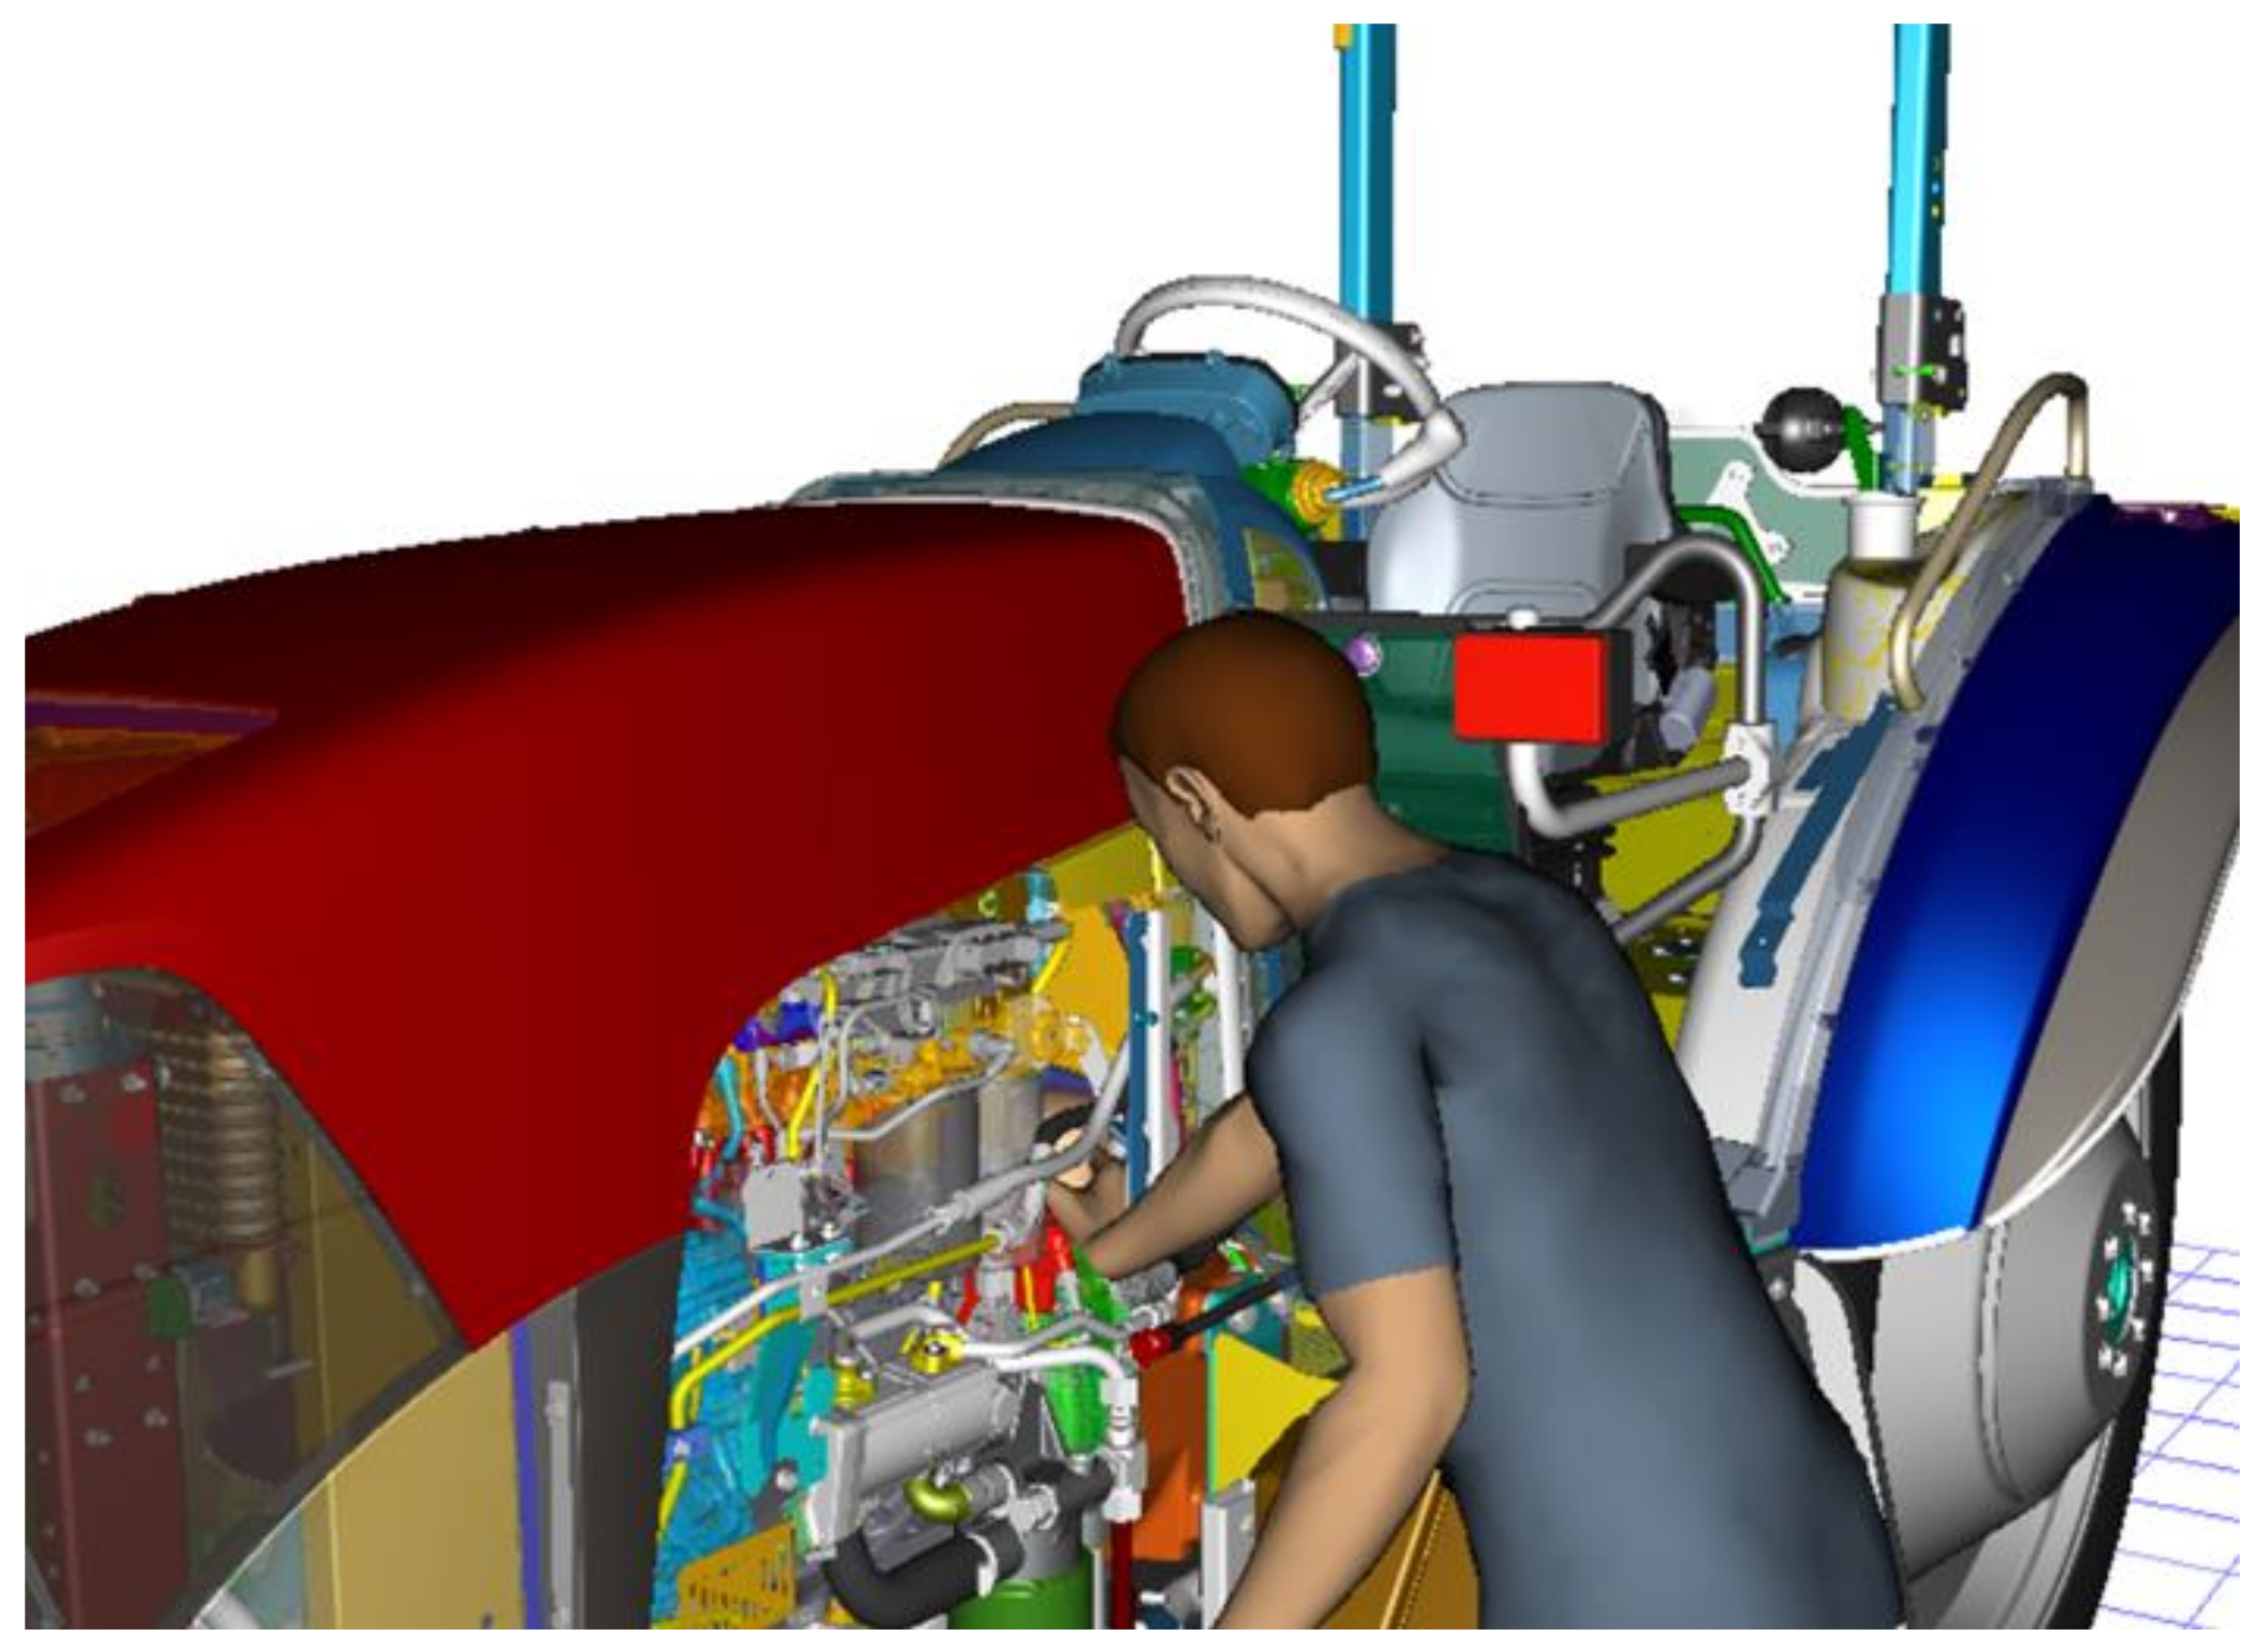
4.1. The Industrial Case Study

The industrial case study has been developed in collaboration with CNH Industrial (CNHi), a global leader in the design and development of a wide range of vehicles, from agricultural to construction machinery, industrial and commercial vehicles, buses and special vehicles, as well as the relative engines and transmissions. In particular, the case study in the tractor field focuses on a set of maintenance tasks to be carried out on tractors during their life. This case is particularly interesting since it involves both product and process design; indeed, the final task sequence and working environment result from the combination of the product design, affecting the set of actions for product disassembly and assembly to intervene during the maintenance, and the process design, linked to the ideal sequence that users have to follow to accomplish each specific task. Moreover, tractor maintenance can be both physically and mentally demanding, depending on the tractor layout and task complexity. In addition, serviceability has a crucial role in the daily use of the tractor and highly influences the product sales. For these reasons, the company decided to push the design for serviceability of its products and further investigate how maintenance activities are accomplished in order to enhance the product quality.
The selected case study addresses one of the most frequent and time-consuming maintenance tasks: the engine oil filter replacement. This activity is usually carried out by the farmer or the tractor owner, and rarely by the CNHi service workers, and is very frequent since this is required after approximately 600 working hours, which corresponds to about 75 working days (considering a working day of 8 h). The workflow consists of disassembling of a set of machine parts to access the filter, the replacement of the exhausted oil filter with a new one, and the reassembly of the product parts. Contextually with the engine oil filter replacement, the temperature sensor of the pre-fuel filter is usually controlled and eventually replaced, as also suggested by the tractor maintenance handbook.
The current process for the engine oil filter replacement presents some critical issues, as reported by users over the years, mainly related to the oil filter accessibility. Indeed, the filter is actually positioned beyond the power steering tubes and other components that are hard to remove, meaning that the entire process is quite challenging if one is to avoid any damage to the tractor components during the disassembly and reassembly sequence. However, CNHi engineers and designers do not have exact knowledge of the users’ workload in order to guide the product redesign.
The current task sequence for the engine oil filter replacement is shown in Table 1. For each subtask, the last column indicates if any tool is required. If the subtask requires no tools, it means that it can be executed using bare hands. Figure 2 represents the location where this task is executed on the tractor, using a virtual representation of the entire product and a virtual mannequin.
The case study was executed in the XiLab laboratory of the University of Modena and Reggio Emilia, in order to easily apply the proposed protocol analysis as defined for the research. In order to replicate the desired task with high fidelity, a physical mock-up of the tractor engine part involved in the process was recreated in the laboratory, as shown in Figure 3. This was built using some original parts of the tractor, such as the filters (e.g., oil filter, fuel filter), the supports, the fuel pipes and the cover bracket. These parts were mounted on a wooden structure supported by a metallic stand. Electrical wires were replicated using plastic pipes similar to the original ones for size and shape, in order to have the same encumbrance. Moreover, the electrical wire brackets and the electrical connectors were printed using a 3D printer, as the original parts were not available.
Near to the mock-up, a table was positioned to offer the users the tools needed for the maintenance task and to position the unmounted parts as they would usually appear in the repair shop and workshops. For the research purposes, such a table was also used to position a laptop used to administer the questionnaires when needed.

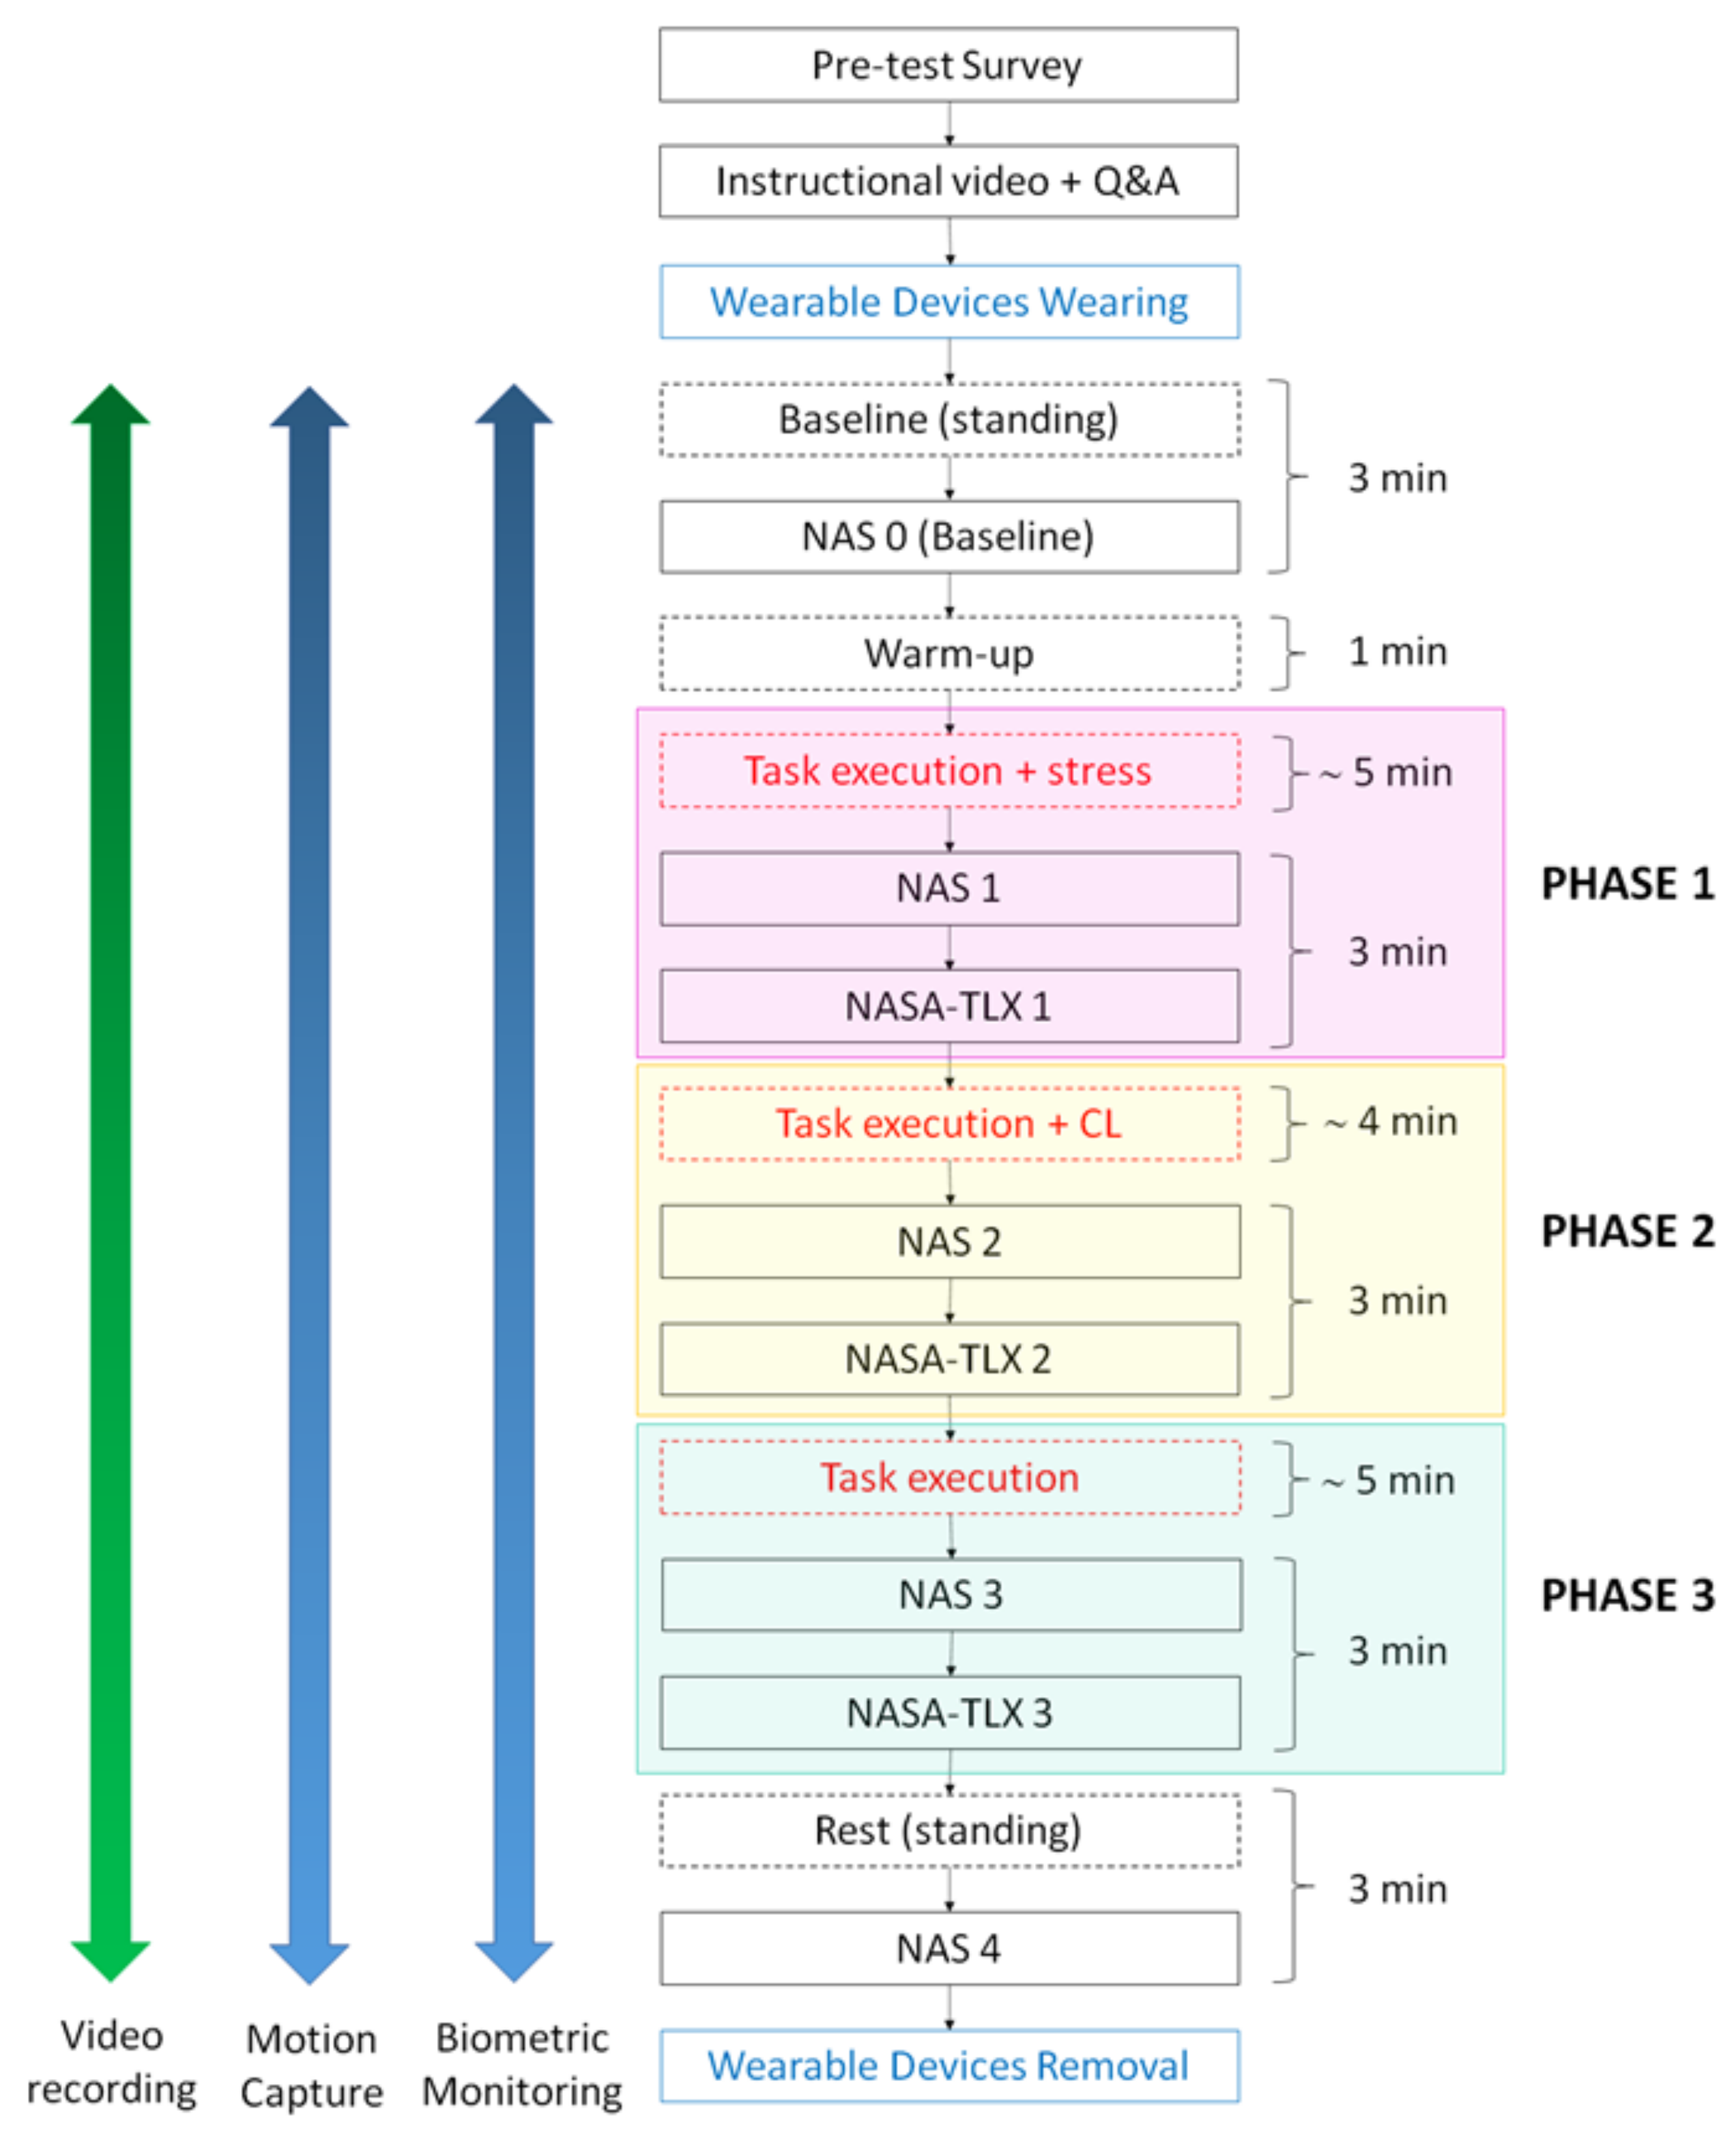
4.2. The Experimental Protocol for User Testing

The proposed method for the ergonomic assessment as described in Section 3 has been adjusted to match the needs of the specific case study. A detailed assessment protocol has been defined to successfully apply the proposed method to the selected case and to make data collection feasible.
Tests were executed involving one user at a time. Firstly, a brief pre-test questionnaire had been defined and administered to the user to collect demographic information and to understand the familiarity with devices and operations performed during the test. A specific code had been assigned to each participant to keep the data anonymous. In particular, the survey allowed the analysis of:
  • Demographic data such as gender, age, weight, height, educational qualification, occupational role;
  • Previous experience with manual working tasks like the ones performed during the trial (e.g., use of wrenches, screwing, working with electrical wires, etc.);
  • Familiarity with the use of wearable devices (e.g., activity trackers, smartwatches, sensorised t-shirts, etc.).
After the demographic survey, an instructional video was shown to the user in order to carefully explain the sequence of tasks that must be fulfilled during the trial. After that, the assessment protocol was presented, as shown in Figure 4, followed by a Q&A session to clarify any eventual doubts on the various testing phases. In order to better discriminate between different levels of stress and cognitive load that may be experienced during the task execution, the protocol was organized into three different phases, dividing the entire task sequence into three parts. Each part provided a different level of cognitive workload, in order to test the human parameters variation and to check the robustness of the task design. Users were not aware of the improved or reduced level of workload created during each phase: only the researchers knew. When the procedure was clear and understood, the test could begin.
Subsequently, each participant was assisted in wearing the smart devices for the motion capture and monitoring of human physiological parameters. The motion capture was used to track the user’s full-body movements during the execution of all subtasks to analyze the physical risk and detect any improper and dangerous postures. Biometric monitoring was performed from the beginning until the end of the test, both during the tasks execution and while answering the questionnaires, to support the objective analysis of physical and cognitive conditions. The overall duration of the test for each user was about thirty minutes, and the temporal length of the experimental procedure was similar to the one needed for the engine oil filter replacement at the shop floor. The entire procedure was video-recorded using two cameras: an external camera in a fixed position, which provided an observer’s viewpoint, and the eye-tracking camera mounted on eye-tracking glasses, which provided the users’ viewpoint.
Three-minutes of signal recording from the wearable sensors (i.e., ECG data, EDA, eye-tracking data) in resting condition (upright, being still) were established at the beginning and at the end of the task execution to, respectively, analyze the baseline and the supposed variations in physiological signals, before and after performing the tasks. Also, in these two slots, the NAS assessment was requested about the level of perceived stress. NAS 0 is the assessment at the beginning, collected during the baseline before any task execution, while NAS 4 is the assessment at the end during resting after the entire task execution. Such NAS measures are useful when evaluating the trend of the perceived stress before, during, and after the execution of the different tasks, and thus to compare the perceived stress between restful and stressful conditions. After NAS 0, a 1-min warm-up session was scheduled to help the participant to become familiar with the use of the tools, the primary tasks, and the interfering task for the analysis of the cognitive load.
The protocol divides the entire tasks sequence into three different phases:
  • Phase 1—task execution with increased stress: in the first phase the participant has to remove the electrical wires bracket, the cover bracket, unplug the electrical switch, unscrew the engine oil filter with tools, unscrew the engine oil filter manually, disconnect the power steering pipes, unplug the gasoline pipe, and unplug the temperature sensor electrical switch. The expected duration is about five minutes. For this reason, to increment the stress, a 4-min countdown is shown to the participant introducing time pressure.
  • Phase 2—task execution with increased cognitive load (dual task): in the second phase the participant has to unscrew the pre-fuel filter with tools, finalize to unscrew the pre-fuel filter manually, unscrew the temperature sensor from the pre-fuel filter, screw the new temperature sensor on the pre fuel filter, screw the pre-fuel filter manually, finalize to screw the pre-fuel filter with tools, plug the temperature sensor electrical switch, plug the gasoline pipe, pump the gasoline into the filters, connect the power steering pipes manually, and then with tools. To increase the cognitive load, a secondary task has been inserted. The participant, while performing the main task in the most accurate manner, must count backward from 874, with steps of 7, until the completion of the main task. The backward counting task is often chosen as an interfering task as it involves multiple cognitive resources without requiring visual processing.
  • Phase 3—task execution in standard conditions: in the third part the participant has to fill the new filter with oil, screw the engine oil filter manually, and then with tools, plug the electrical switch, mount the cover bracket, and then the electrical wires bracket. In this phase, the steps are executed in normal conditions, without adding any stressful or mentally demanding events.
After each phase, each participant was asked to complete NASA-TLX and NAS to self-assess the perceived level of workload and stress. Thus, after phase 1, NASA-TLX 1 and NAS 1 were collected and so on, according to the protocol phases. Thus, the NASA-TLX and the NAS are, respectively, answered three and five times. Since NASA-TLX refers to the workload related to the execution of a specific task, it cannot be used to record a baseline at rest.

4.3. Experimental Data Monitoring

The experimental set-up involved a set of hardware and software tools to collect the necessary data to properly apply the proposed method.
About the hardware, the case study involved the use of the following tools, as shown in Figure 5:
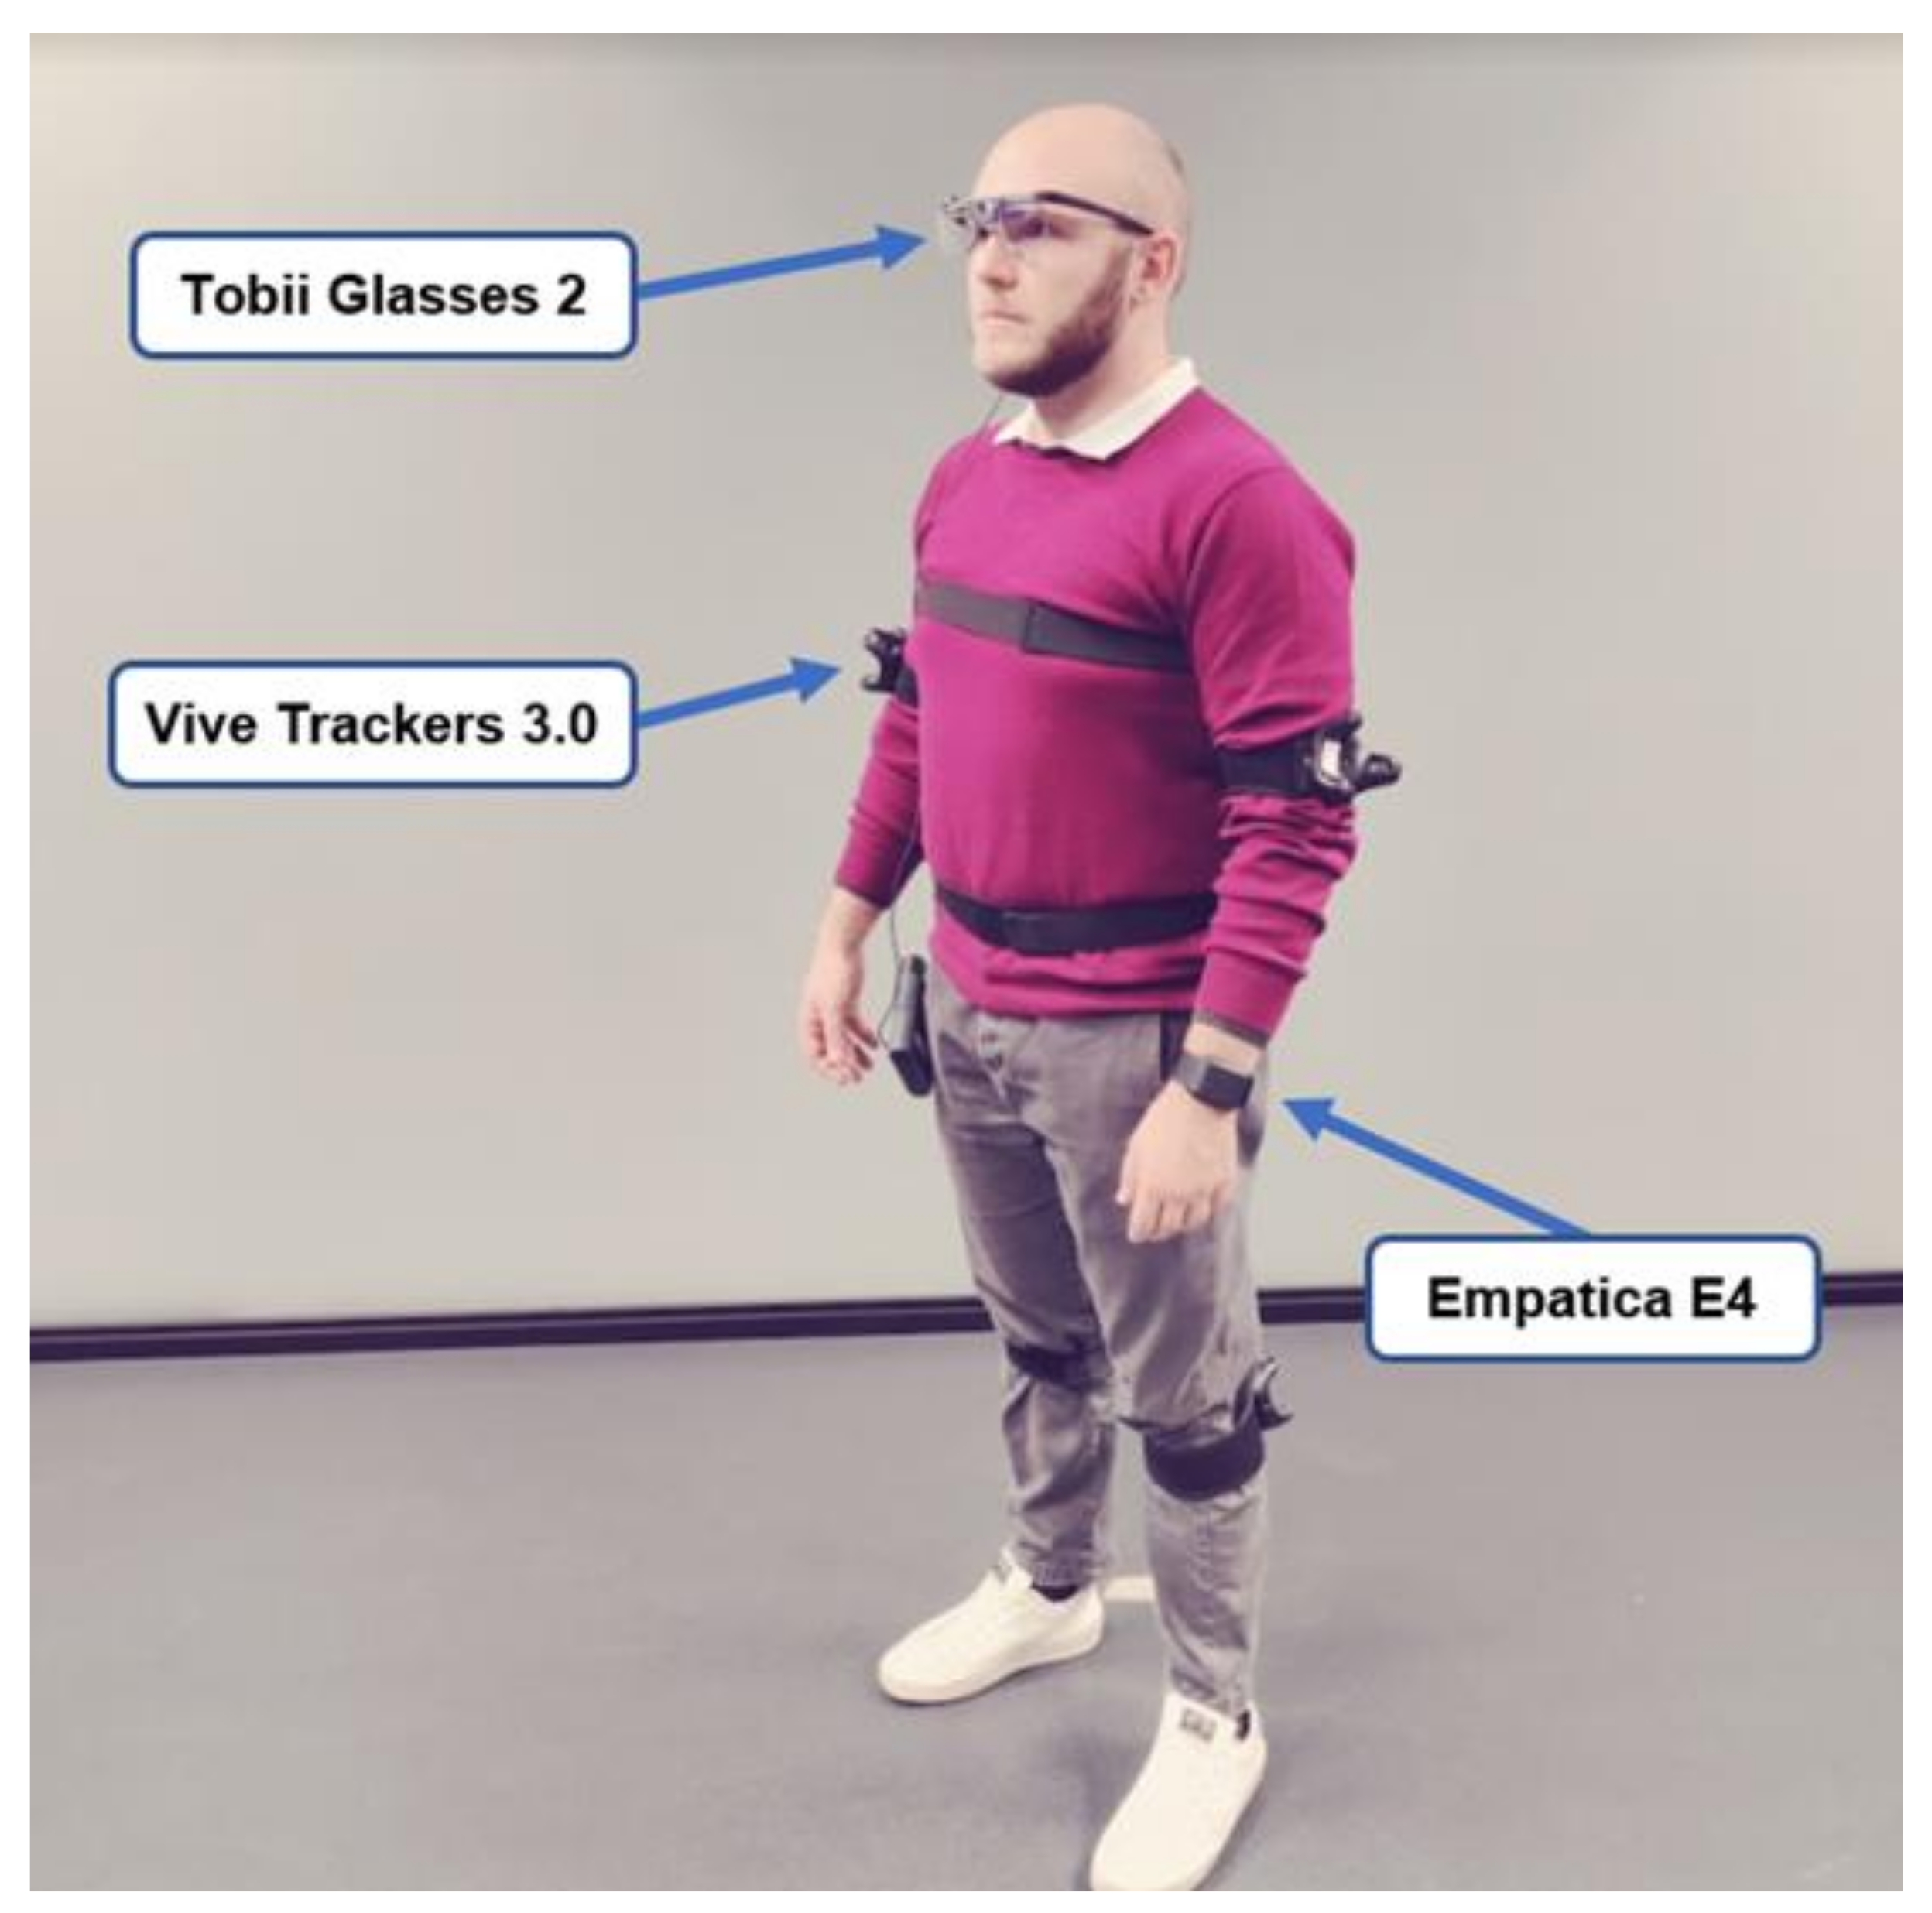
  • HTC Vive Trackers 3.0: they are small, interchangeable motion tracking accessories that can be attached to any part of the body, by proper straps, in order to achieve the motion capture of a joint or a body segment. Each tracker calculates its position based on the infrared signals emitted from a set of base stations that have to be properly positioned in the space. In this specific case, the user wears the trackers, according to a predefined configuration (i.e., two trackers on the arms, one on the belt and two on the legs).
  • Empatica E4: it is a wrist-wearable device able to record a set of physiological data of the user, using different types of sensors. In particular, the photoplethysmogram (PPG) sensor measures the Blood Volume Pulse (BVP), from which the heart rate (HR) and inter beat interval (IBI) can be derived. Moreover, the electrodermal activity (EDA) sensor measures the changes in skin conductance resulting from the sympathetic nervous system activity. The device also has a 3-axis accelerometer and an infrared thermopile.
  • Tobii Pro Glasses 2: this is a mobile, wearable eye tracking system that looks like a pair of glasses, equipped with four infrared cameras (two cameras for each eye) that records eye movements. The system consists of the head unit (glasses) and the recording unit, in which are stored batteries, and an SD memory card that is usually hung on the belt. A full HD camera in the head unit provides the user point of view. Glasses are also equipped with a microphone, accelerometers, and gyroscopes to track the head movements.
  • External camera: this provides the video recording of the user and the workspace environment from a fixed position.
Furthermore, the case study exploits different tools:
  • XRErgo: a standalone application developed in Unity 3D, which allows the evaluation of the users’ postures and working conditions in both real environments and virtual simulations with motion capture. In the case study, it exploits the HTC Vive trackers as the motion capture system to create a digital twin of the operator, animated in real-time, and assesses postural risk by RULA method.
  • Steam VR: software that streams the real time position of the Vive Trackers in XRErgo attached to arms, legs and back in XRErgo in order to perform the ergonomic analysis.
  • E4 realtime: an application for the real time streaming of data from Empatica to a smartphone or a tablet. This is used to control Empatica E4 calibration and data recording. The application automatically uploads to the cloud the data collected during the tests, to be further analyzed and processed.
  • Kubios HRV Standard: this tool provides a detailed HRV analysis to calculate RR data from HR and HRV data collected during the tests.
The temperature in the room was measured and was constant at 24 °C, thanks to the air conditioning system. The room does not have windows and during the task execution the doors were closed so the light sources are totally artificial, provided by neon lamps positioned on the ceiling. During task execution in the laboratory there was silence, and there were no other sources of noise.

4.4. Participants Involved in the Preliminary User Testing

The preliminary user testing involved eight participants with a mean age of 25.6 years old (SD = 2.236). Participation in the test was voluntary and no reward was given. All participants signed an informed consent before the test. All of them presented normal vision and did not need corrective lenses, and none of the participants had heart conditions. The demographic survey provided us with information about users’ gender, age, height and weight, level of experience in engine maintenance tasks, familiarity with the use of mechanical tools and with the use of monitoring devices. User data is summed up in Table 2.

5. Results and Discussion

For each operator and each phase of the experimental testing, the PW, MW and S metrics are calculated according to the equations described in Section 3.

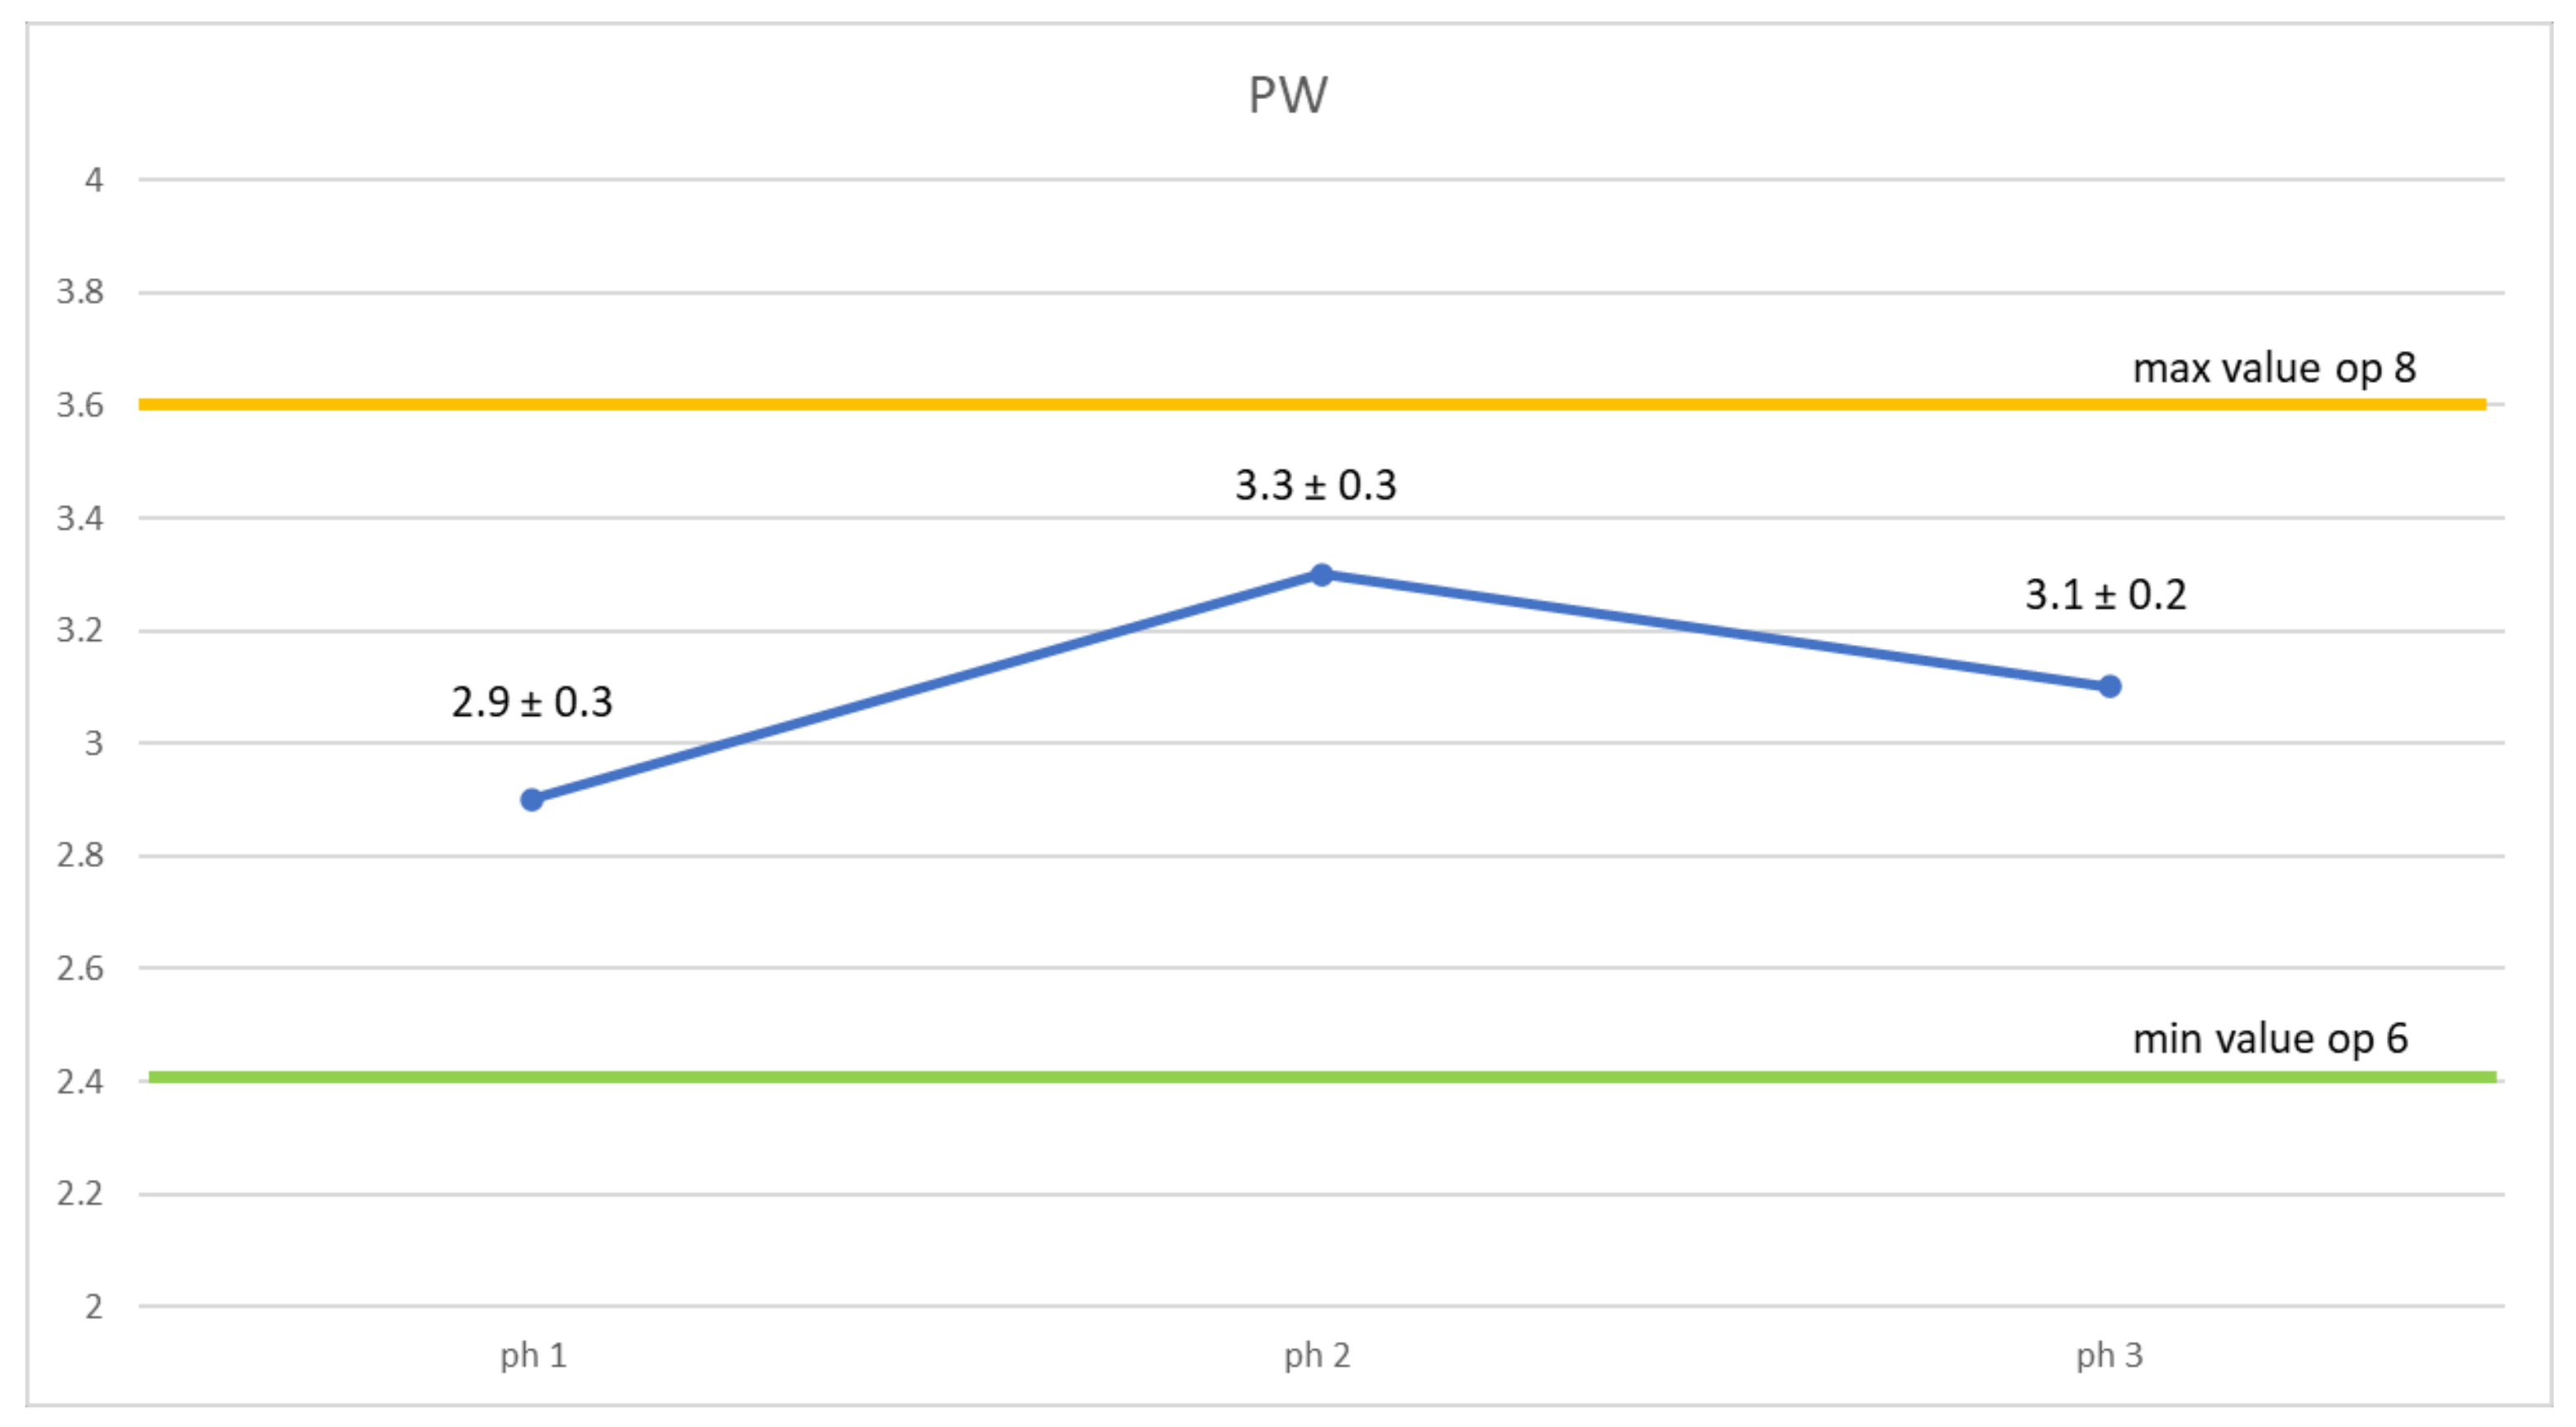
5.1. Physical Assessment

As detailed in Section 3, the physical workload assessment is mainly based on motion capture and RULA index calculation, to allow the calculation of the PW metric. During testing, the user’s actions were monitored and collected by full body motion capture and properly elaborated to provide a real-time RULA score for each sub-task. Table 3 synthesizes the results collected about the PW, grouped for users and for phases. In particular, the last row of the table shows the PW average score for each operator on all phases, while the last two columns report the average PW score for each sub-task and for each phase, respectively. From the analysis of the results, we can notice that Op8 (99p) and partially Op5 (85p) scores are higher than the other operators in most of the sub-tasks, probably due to the greater height that forces them to stay bent forward to reach the components. The more critical sub-task that reached the maximum PW average score is the manual connection of the power steering pipes, followed by the plug of the temperature sensor switch. The former is critical in terms of arms position and duration, while the latter is critical due to the low position of the temperature sensor, which forces the operator to bend down to assure the correct visibility to properly insert the connector. Anyway, the average PW score for each phase did not highlight relevant differences, even if phase 2 collected a generally higher PW score, as shown in Figure 6.

5.2. Cognitive Assessment

As detailed in Section 3, the cognitive workload assessment combines the operators’ perceived evaluation with the biometric monitoring. This allows a more reliable assessment to be obtained, based on both subjective and objective measures, in order to avoid partial and untrustworthy considerations. For this reason, the methodology weighs the collected physiological parameters with the results of the self-assessment questionnaires, for each phase.
The first analysis focused on the results of the subjective evaluations, through NAS and NASA-TLX, to understand the perceived workload related to the different phases of the trials independently by the variations in their physiological parameters during the execution of the tasks.
The NAS scale has been answered before the execution of the tasks (NAS0) to record the basal level of perceived stress, immediately after each of the three different test phases (NAS1, NAS2, NAS3) to distinguish between eventual different stress levels, and at the end of the test, after a restful period (NAS4) to verify that the perceived stress came back to the basal level. Notably, the first trial phase involves a more stressful execution forced by a time limit, and in the second phase an increased mental effort is compelled by the secondary task (i.e., counting backward), while in the third phase the tasks are executed without additional stressors. In Figure 7 the trend of the perceived stress by NAS, averaged over all the operators, is shown. The perceived stress increases from the beginning of phase 1 to the end of phase 2, and then decreases until the end of phase 3. Even if the protocol supposed that the first phase is the most stressful one in a technical sense, operators on average felt more stressed during the second one. This is probably due to the weak border, from a user perspective, between stress and mental load. Indeed, the need to correctly perform two different operations (instead of one), leads to an increment of the mental demand, as well as of stress and fatigue contemporarily. Consequently, stress perception decreases in phase 3 (NAS3 is lower than NAS1) and drops down under the initial basal level at the end of phase 3 (NAS4 < NAS0 likely due to the fact that performance anxiety is perceived at the beginning of testing).
Similarly, the results from NASA-TLX were analyzed as average values on all operators, for each phase and for the six different domains within the NASA-TLX, as shown in Figure 8.
The mental demand, as expected, is widely higher in phase 2. Moreover, phase 2 also showed higher perceived effort and frustration with respect to the other phases. Therefore, the cognitive and emotional involvements are higher when a dual task (i.e., executing the task and counting) is asked to be executed. However, the necessity to obtain a good performance is greater in phase 3, probably as the final result of the engine oil filter replacement is fulfilled in this phase. Concerning frustration, this is higher in phase 1 due to the countdown, while the perceived effort is greater in phase 3 probably as a result of an accumulation effect. Similarly, even the physical demand constantly increases from phase 1 to phase 3, due to the passing of time doing similar actions. The highest perception of temporal demand during phase 1 is obviously due to the imposed time limit for task execution.
Figure 9 shows the S and MW metrics, computed with the physiological parameters as presented in Section 3.
As foreseen by the protocol, a higher stress level should be measured in phase 1, and a greater mental workload in phase 2. Instead, the algorithm reveals that both stress and mental workload are comparable in phases 1 and 3, while they are both higher in phase 2, during the execution of the dual task. Indeed, the physiological response to a stimulus does not have a univocal meaning. This result confirms what we found in the literature: the biometric measures reflect different internal states (e.g., variations in the arousal, the valence, the level of stress, or mental workload) during the execution of a task [54]. In particular, the proposed method concretely distinguishes between the mental effort and the emotional involvement of the operator during working activities. Even if the experimental protocol is thought to increase the stress by providing a time limit, and to increase the mental load by adding a secondary task, results show that the countdown does not impact on the user’s emotional involvement, while a greater stress is experienced during the dual activity as experienced in phase 2. Moreover, Figure 9 allows two further considerations:
  • The mental workload slightly changes in the range of 25–33% among the different phases, confirming that the operator keeps the attention and concentration constant during the trial;
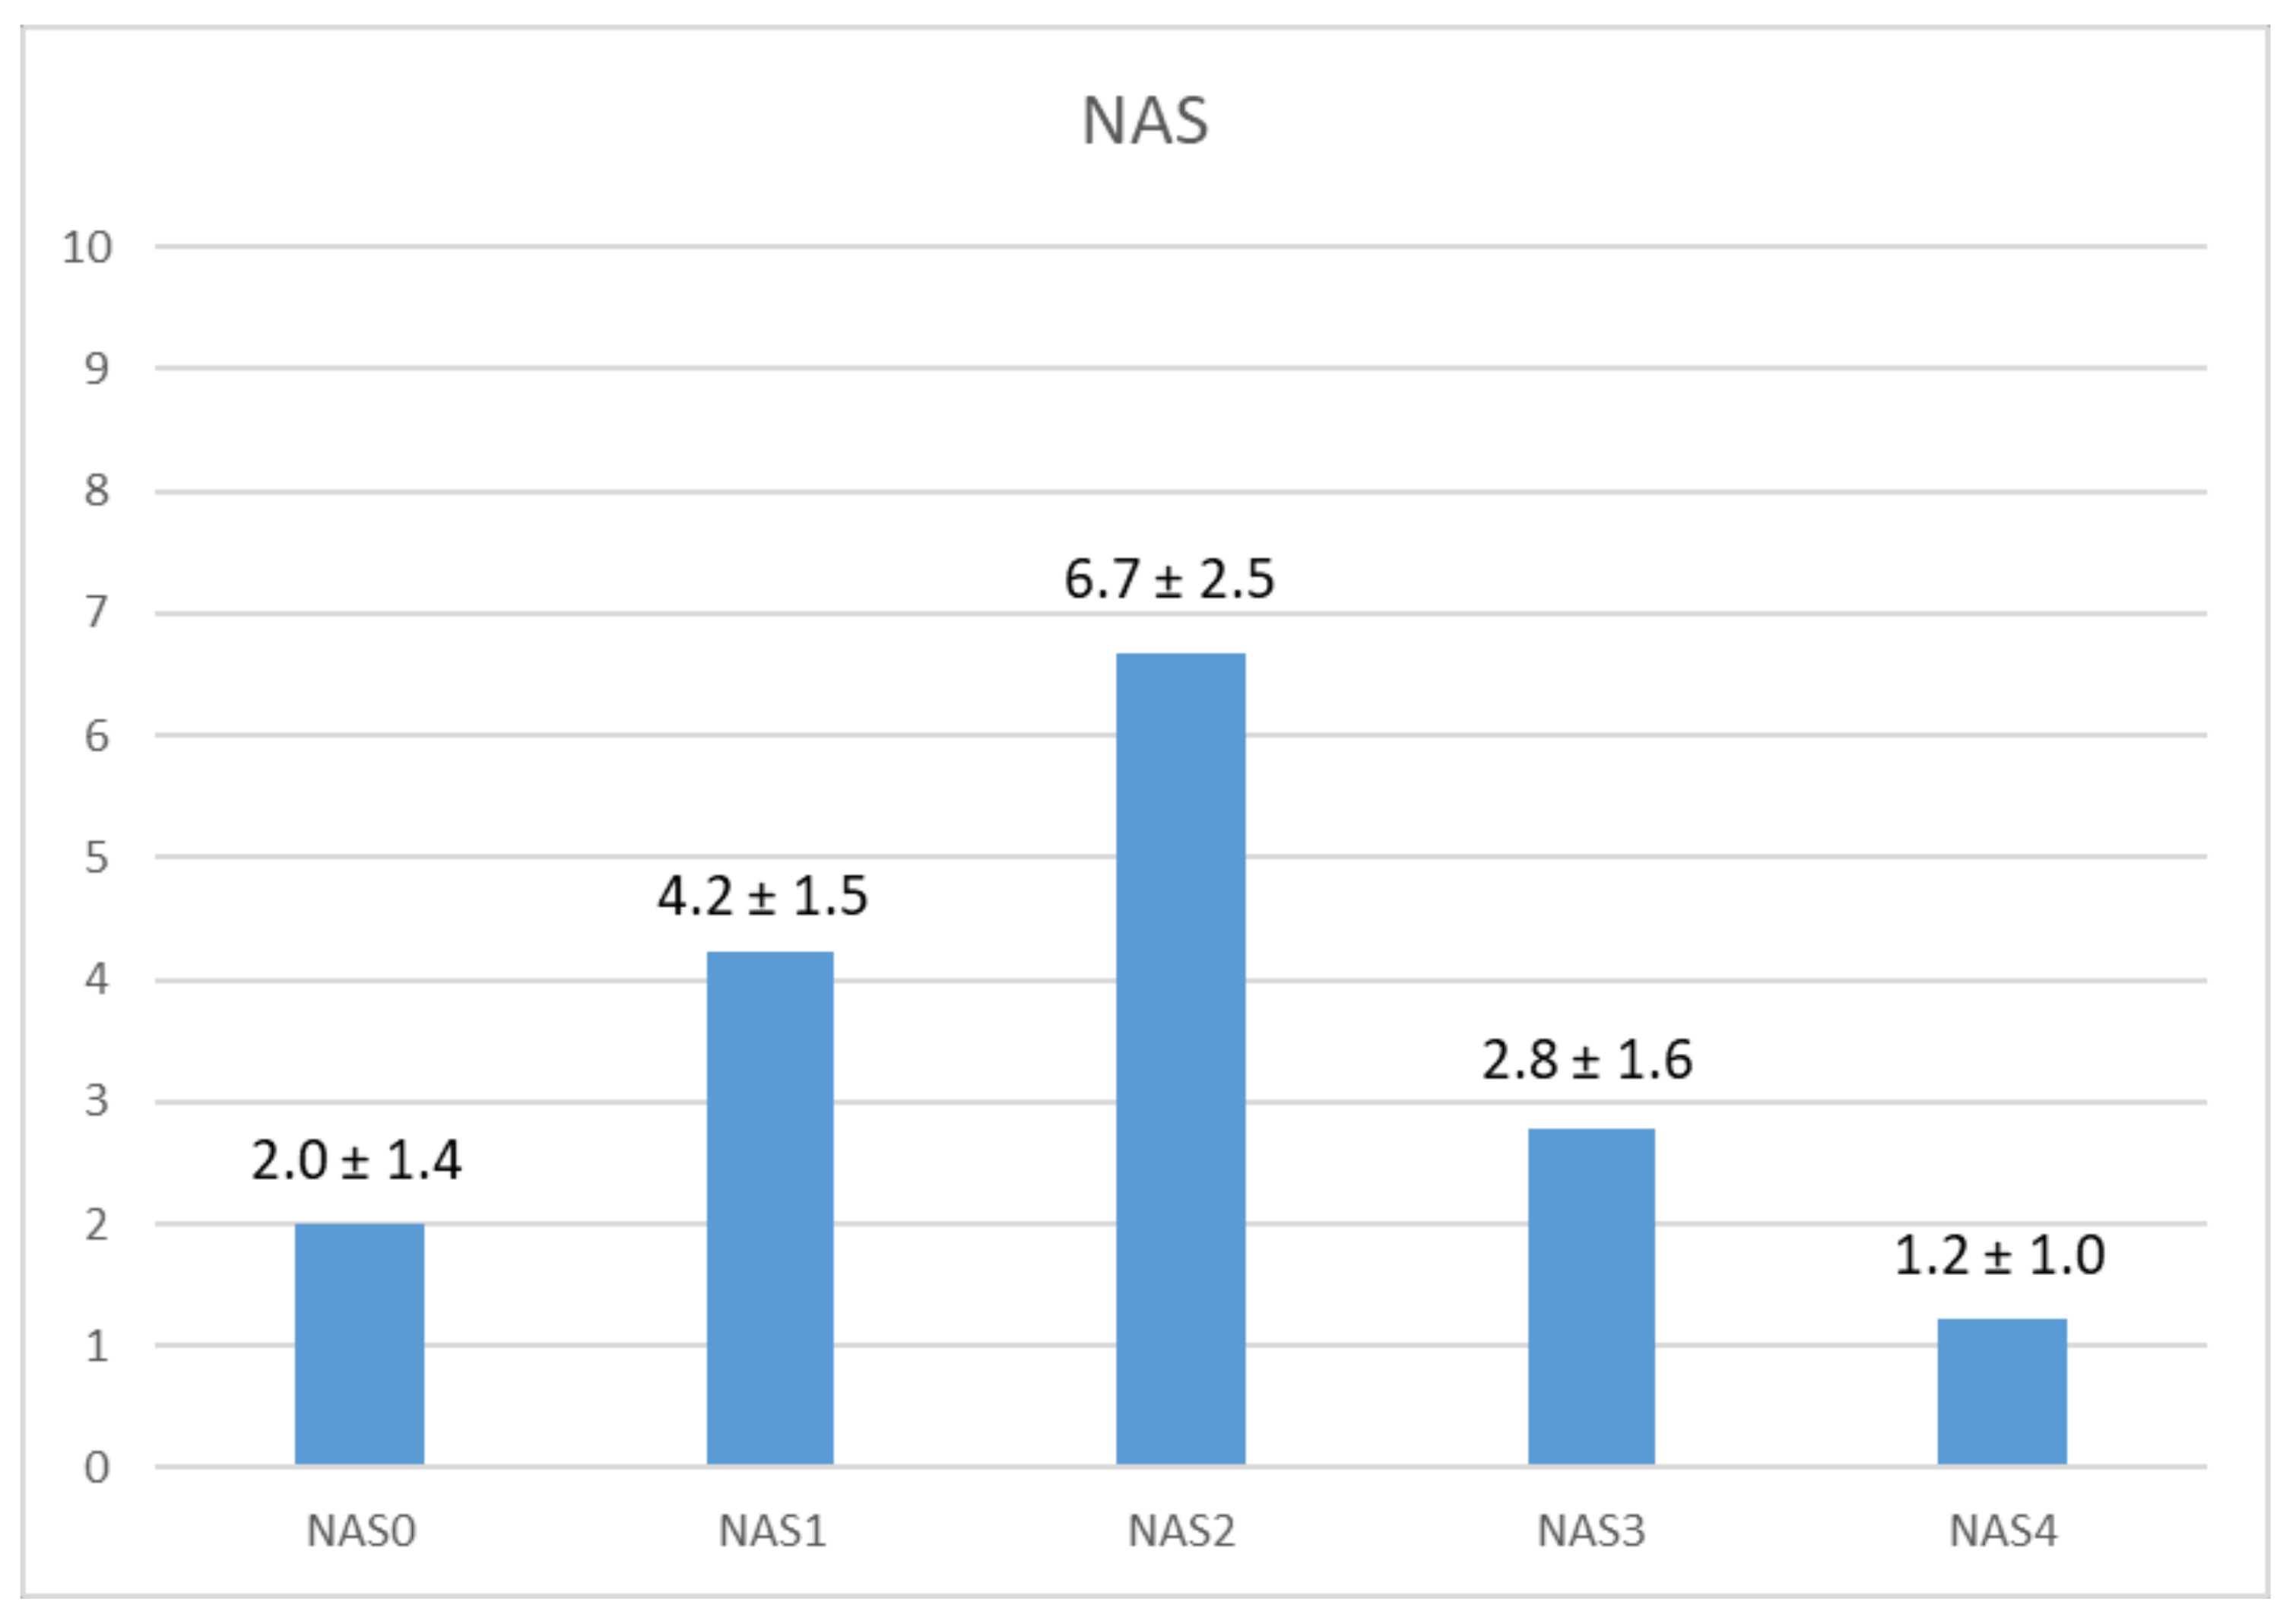
  • The stress level had minor variation (3–5%) during phase 1 and 3, while it showed a greater variation (54%) during phase 2. This means that the secondary task has a higher impact on the feeling of stress and frustration rather than on the mental effort. This is probably related to the fact that the manual operations needed to replace the engine oil filter do not require a high cognitive load.
  • The experimental study also presented several limitations, especially related to:
  • The limited number of users involved in the testing that do not allow a statistical relevance;
  • Some technical issues related to the devices used for human monitoring, in particular the lack of data during the collection of RR signals from EMPATICA E4 and of PD variations in the data from the Tobii Glasses were observed by some users.

6. Conclusions

The main purpose of this paper is to propose a holistic, experimental method for the assessment of operators’ workload, including physical and cognitive ergonomics, suitable for application in an industrial environment. In this work, a specific protocol for the analysis of physical effort, mental workload, and stress level is proposed, based on a preliminary numerical–experimental model. The proposed model has been validated in a laboratory on an industrial case study by experimental user testing, involving eight users. An ad hoc experimental set-up has been defined and developed to be as minimally invasive as possible for the operator, while at the same time being as complete as possible for the workload assessment.
From the analysis of the results, it can be stated that the provided workload assessment can help designers and engineers to highlight the most critical issue in a specific task sequence in order to redesign the process or the product preventing work related diseases. In particular, the physical workload data obtained by motion capture has allowed us to highlight the most uncomfortable and risky actions or sub-tasks, the main visibility or reachability issues, or eventual product layout criticalities. Moreover, such analysis is combined with the assessment of the cognitive workload, organized between mental effort and perceived stress. Such a model suggests a moving toward a more human-centric approach in the industrial design of products and processes, contemporarily considering physical and mental users’ demands in system design. Indeed, only with a careful analysis of the entire human-machine interaction and all the working conditions that may generate excessive demanding activities and/or stressful events, would it be possible to improve the human performance, and consequently, the industrial outcomes. The experimental study finally showed some limitations, mainly due to the small sample of participants and to the quality of collected data. Future works will involve different kinds of devices to collect the same physiological parameters, to define the most robust technological set-up. Moreover, a greater number of test users will be enrolled in the study to statistically validate the workload assessment method.

Author Contributions

Conceptualization, M.P. (Margherita Peruzzini) and A.B.; methodology, F.G. and A.B.; investigation, F.G. and R.K.K.; resources, F.G.; data curation, F.G. and R.K.K.; writing—original draft preparation, M.P. (Margherita Peruzzini), A.B., F.G. and M.P. (Marcello Pellicciari); writing—review and editing, M.P. (Margherita Peruzzini), A.B. and F.G.; visualization, M.P. (Margherita Peruzzini), A.B. and F.G.; supervision, M.P. (Marcello Pellicciari). All authors have read and agreed to the published version of the manuscript.

Funding

This research received no external funding.

Institutional Review Board Statement

Ethical review and approval were not required for this study, because the ethical risk was minimal. The study was conducted in the university laboratory using only commercial, non-invasive devices. Participants were carefully informed about the collected data, used commercial devices, and eventual shortcomings available in the devices’ manuals. All the collected data have been anonymized. All participants signed the informed consent before taking part in the study.

Informed Consent Statement

Informed consent was obtained from all subjects involved in the study.

Data Availability Statement

Data was archived in University datasets and managed according to MDPI Research Data Policies.

Conflicts of Interest

The authors declare no conflict of interest.

Abbreviations

BRbreathing rate
BVPblood volume pulse
EDAelectrodermal activity
EEGelectroencephalography
GSRgalvanic skin response
HRheart rate
HRVheart rate variability
IBIinter-beat interval
MWmental workload parameter
MWLmental workload
NASnumerical analog scale
NASA-TLXNASA task load index
PApupil activity parameter
PDpupil diameter
PPGphotoplethysmography
PWpostural workload parameter
REBArapid entire body assessment
RRbeat-by-beat variations
RULArapid upper limb assessment
STAIstate trait anxiety inventory
UTuser time parameter

References

  1. Zhou, K.; Liu, T.; Zhou, L. Industry 4.0: Towards future industrial opportunities and challenges. In Proceedings of the 2015 12th International Conference on Fuzzy Systems and Knowledge Discovery (FSKD), Zhangjiajie, China, 15–17 August 2015; pp. 2147–2152. [Google Scholar] [CrossRef]
  2. Kong, F. Development of metric method and framework model of integrated complexity evaluations of production process for ergonomics workstations. Int. J. Prod. Res. 2018, 57, 2429–2445. [Google Scholar] [CrossRef]
  3. Cimini, C.; Pirola, F.; Pinto, R.; Cavalieri, S. A human-in-the-loop manufacturing control architecture for the next generation of production systems. J. Manuf. Syst. 2020, 54, 258–271. [Google Scholar] [CrossRef]
  4. Pacaux-Lemoine, M.-P.; Trentesaux, D.; Rey, G.Z.; Millot, P. Designing intelligent manufacturing systems through Human-Machine Cooperation principles: A human-centered approach. Comput. Ind. Eng. 2017, 111, 581–595. [Google Scholar] [CrossRef]
  5. Longo, F.; Nicoletti, L.; Padovano, A. Smart operators in industry 4.0: A human-centered approach to enhance operators’ capabilities and competencies within the new smart factory context. Comput. Ind. Eng. 2017, 113, 144–159. [Google Scholar] [CrossRef]
  6. Grandi, F.; Zanni, L.; Peruzzini, M.; Pellicciari, M.; Campanella, C.E. A Transdisciplinary digital approach for tractor’s human-centred design. Int. J. Comput. Integr. Manuf. 2019, 33, 377–397. [Google Scholar] [CrossRef]
  7. European Commission. Industry 5.0. Available online: https://ec.europa.eu/info/research-and-innovation/research-area/industrial-research-and-innovation/industry-50_en (accessed on 5 November 2021).
  8. Peruzzini, M.; Pellicciari, M. A framework to design a human-centred adaptive manufacturing system for aging workers. Adv. Eng. Inform. 2017, 33, 330–349. [Google Scholar] [CrossRef]
  9. Papetti, A.; Ciccarelli, M.; Brunzini, A.; Germani, M. Design of ergonomic manufacturing equipment by a human-centered methodology. Int. J. Interact. Des. Manuf. (IJIDeM) 2020, 15, 107–111. [Google Scholar] [CrossRef]
  10. Gasson, S. Human-centered vs. user-centered approaches to information system design. J. Inf. Technol. Theory Appl. 2003, 5, 29–46. [Google Scholar]
  11. Benn, S.; Edwards, M.; Williams, T. Organizational Change for Corporate Sustainability; Routledge: London, UK, 2014. [Google Scholar] [CrossRef]
  12. Waterson, P.; Kolose, S.L. Exploring the social and organisational aspects of human factors integration: A framework and case study. Saf. Sci. 2010, 48, 482–490. [Google Scholar] [CrossRef] [Green Version]
  13. Zolotová, I.; Papcun, P.; Kajáti, E.; Miškuf, M.; Mocnej, J. Smart and cognitive solutions for Operator 4.0: Laboratory H-CPPS case studies. Comput. Ind. Eng. 2018, 139, 105471. [Google Scholar] [CrossRef]
  14. Longo, F.; Nicoletti, L.; Padovano, A. Modeling workers’ behavior: A human factors taxonomy and a fuzzy analysis in the case of industrial accidents. Int. J. Ind. Ergon. 2018, 69, 29–47. [Google Scholar] [CrossRef]
  15. Papetti, A.; Gregori, F.; Pandolfi, M.; Peruzzini, M.; Germani, M. A method to improve workers’ well-being toward human-centered connected factories. J. Comput. Des. Eng. 2020, 7, 630–643. [Google Scholar] [CrossRef]
  16. ISO 9241-210:2010, Ergonomics of Human-System Interaction—Part 210: Human-Centred Design for Interactive Systems; ISO: Geneva, Switzerland, 2010.
  17. Dadashi, N.; Lawson, G.; Marshall, M.; Stokes, G. Cognitive and metabolic workload assessment techniques: A review in automotive manufacturing context. Hum. Factors Ergon. Manuf. 2021, 32, 20–34. [Google Scholar] [CrossRef]
  18. ISO 26800:2011, Ergonomics—General Approach, Principles and Concepts; ISO: Geneva, Switzerland, 2011.
  19. Pheasant, S. Body Space: Anthropometry, Ergonomics, and the Design of Work; Taylor & Francis: Abingdon, UK, 1999; pp. 121–123. [Google Scholar] [CrossRef]
  20. Lasota, A.M. A New Approach to Ergonomic Physical Risk Evaluation in Multi-Purpose Workplaces. Teh. Vjesn.-Tech. Gaz. 2020, 27, 467–474. [Google Scholar] [CrossRef]
  21. Joshi, M.; Deshpande, V. A systematic review of comparative studies on ergonomic assessment techniques. Int. J. Ind. Ergon. 2019, 74, 102865. [Google Scholar] [CrossRef]
  22. ISO/TR 12295: Ergonomics-Document for the Application of ISO Standards to Manual Handling of Loads (ISO 11228) and Evaluation of Static Work Postures (ISO 11226); ISO: Geneva, Switzerland, 2014.
  23. ISO 11226:2000: Ergonomics-“Evaluation of Static Work Postures”; ISO: Geneva, Switzerland, 2000.
  24. Part 1: “Terms and definitions”, Part 2: “Manual handling of machinery and parts of machinery”, Part 3: “Recommended force limits for the use of machinery”, Part 4: “Evaluation of postures and work movements in relation to machinery”, Part 5: “Risk assessment related to high frequency repetitive handling”. In UNI EN 1005:2009: Machine Safety-Human Physical Performance; UNI EN: Milan, Italy, 2009.
  25. Part 1: “Lifting and Moving”. Part 2: “Pushing and Pulling”. Part 3: “Handling of Small Loads with Great Frequency”. In ISO 11228-1,2,3: Ergonomics-Manual Handling; ISO: Geneva, Switzerland, 2021.
  26. McAtamney, L.; Corlett, E.N. RULA: A survey method for the investigation of work-related upper limb disorders. Appl. Ergon. 1993, 24, 91–99. [Google Scholar] [CrossRef]
  27. Hignett, S.; McAtamney, L. Rapid Entire Body Assessment (REBA). Appl. Ergon. 2000, 31, 201–205. [Google Scholar] [CrossRef]
  28. Karhu, O.; Härkönen, R.; Sorvali, P.; Vepsäläinen, P. Observing working postures in industry: Examples of OWAS application. Appl. Ergon. 1981, 12, 13–17. [Google Scholar] [CrossRef]
  29. Occhipinti, E. OCRA: A concise index for the assessment of exposure to repetitive movements of the upper limbs. Ergonomics 1998, 41, 1290–1311. [Google Scholar] [CrossRef]
  30. Dempsey, P.G. Usability of the revised NIOSH lifting equation. Ergonomics 2002, 45, 817–828. [Google Scholar] [CrossRef]
  31. Peruzzini, M.; Grandi, F.; Cavallaro, S.; Pellicciari, M. Using virtual manufacturing to design human-centric factories: An industrial case. Int. J. Adv. Manuf. Technol. 2020, 115, 873–887. [Google Scholar] [CrossRef]
  32. Hart, S.G. Nasa-Task Load Index (NASA-TLX); 20 Years Later. Proc. Hum. Factors Ergon. Soc. Annu. Meet. 2006, 50, 904–908. [Google Scholar] [CrossRef] [Green Version]
  33. Wickens, C.D.; Gordon, S.E.; Liu, Y. An Introduction to Human Factors Engineering; Pearson Prentice Hall: Upper Saddle River, NJ, USA, 2004; pp. 64–90. [Google Scholar]
  34. Cain, B. A Review of the Mental Workload Literature; RTO-TR-HFM-121-Part-II; Defence Research and Development Canada: Toronto, Canada, 2007.
  35. Part 3: Principles and Requirements Concerning Methods for Measuring and Assessing Mental Workload. In ISO 10075-3:2004, Ergonomic Principles Related to Mental Workload; ISO: Geneva, Switzerland, 2004.
  36. Karwowski, W. International Encyclopedia of Ergonomics and Human Factors; CRC Press: Boca Raton, FL, USA, 2006. [Google Scholar] [CrossRef]
  37. Hart, S.G.; Staveland, L.E. Development of NASA-TLX (Task Load Index): Results of Empirical and Theoretical Research. In Advances in Psychology; Hancock, P.A., Meshkati, N., Eds.; Human Mental Workload: North-Holland, The Netherlands, 1988; Volume 52, pp. 139–183. [Google Scholar] [CrossRef]
  38. La Bara, L.; Meloni, L.; Giusino, D.; Pietrantoni, L. Assessment Methods of Usability and Cognitive Workload of Rehabilitative Exoskeletons: A Systematic Review. Appl. Sci. 2021, 11, 7146. [Google Scholar] [CrossRef]
  39. Pilco, H.; Sanchez-Gordon, S.; Calle-Jimenez, T.; Pérez-Medina, J.L.; Rybarczyk, Y.; Jadán-Guerrero, J.; Maldonado, C.G.; Nunes, I.L. An Agile Approach to Improve the Usability of a Physical Telerehabilitation Platform. Appl. Sci. 2019, 9, 480. [Google Scholar] [CrossRef] [Green Version]
  40. Tao, D.; Tan, H.; Wang, H.; Zhang, X.; Qu, X.; Zhang, T. A Systematic Review of Physiological Measures of Mental Workload. Int. J. Environ. Res. Public Health 2019, 16, 2716. [Google Scholar] [CrossRef] [Green Version]
  41. Debie, E.; Rojas, R.F.; Fidock, J.; Barlow, M.; Kasmarik, K.; Anavatti, S.; Garratt, M.; Abbass, H.A. Multimodal Fusion for Objective Assessment of Cognitive Workload: A Review. IEEE Trans. Cybern. 2019, 51, 1542–1555. [Google Scholar] [CrossRef]
  42. Charles, R.L.; Nixon, J. Measuring mental workload using physiological measures: A systematic review. Appl. Ergon. 2019, 74, 221–232. [Google Scholar] [CrossRef]
  43. Lee, B.C.; Chung, K.; Kim, S.-H. Interruption Cost Evaluation by Cognitive Workload and Task Performance in Interruption Coordination Modes for Human–Computer Interaction Tasks. Appl. Sci. 2018, 8, 1780. [Google Scholar] [CrossRef] [Green Version]
  44. Spielberger, C.D.; Gorsuch, R.L. State-Trait Anxiety Inventory for Adults: Sampler Set, Manual, Test, Scoring Key; Mind Garden: Redwood City, CA, USA, 1983. [Google Scholar]
  45. Brunzini, A.; Papetti, A.; Germani, M.; Barbadoro, P.; Messi, D.; Adrario, E. Mixed Reality Simulation for Medical Training: How It Affects Learners’ Cognitive State. In Advances in Simulation and Digital Human Modeling; AHFE 2021; Lecture Notes in Networks and Systems; Springer: Berlin/Heidelberg, Germany, 2021; Volume 264. [Google Scholar] [CrossRef]
  46. Plechawska-Wójcik, M.; Tokovarov, M.; Kaczorowska, M.; Zapała, D. A Three-Class Classification of Cognitive Workload Based on EEG Spectral Data. Appl. Sci. 2019, 9, 5340. [Google Scholar] [CrossRef] [Green Version]
  47. Arora, S.; Sevdalis, N.; Nestel, D.; Woloshynowych, M.; Darzi, A.; Kneebone, R. The impact of stress on surgical performance: A systematic review of the literature. Surgery 2010, 147, 318–330.e6. [Google Scholar] [CrossRef] [PubMed]
  48. Part 1: General Issues and Concepts, Terms and Definitions. In ISO 10075-1:2017, Ergonomic Principles Related To Mental Workload; ISO: Geneva, Switzerland, 2017.
  49. Lazarus, R.S.; Folkman, S. Stress, Appraisal, and Coping; Springer: Berlin/Heidelberg, Germany, 1984. [Google Scholar]
  50. Boucsein, W. Electrodermal Activity; Springer: Berlin/Heidelberg, Germany, 2012. [Google Scholar] [CrossRef]
  51. Waller, L.; Reitz, M.; Poole, E.; Riddell, P.M.; Muir, A. Experiential learning as preparation for leadership: An exploration of the cognitive and physiological processes. Leadersh. Organ. Dev. J. 2017, 38, 513–529. [Google Scholar] [CrossRef]
  52. Luque-Casado, A.; Perales, J.C.; Cárdenas, D.; Sanabria, D. Heart rate variability and cognitive processing: The autonomic response to task demands. Biol. Psychol. 2016, 113, 83–90. [Google Scholar] [CrossRef] [PubMed]
  53. Castaldo, R.; Melillo, P.; Bracale, U.; Caserta, M.; Triassi, M.; Pecchia, L. Acute mental stress assessment via short term HRV analysis in healthy adults: A systematic review with meta-analysis. Biomed. Signal Process. Control 2015, 18, 370–377. [Google Scholar] [CrossRef] [Green Version]
  54. Mingardi, M.; Pluchino, P.; Bacchin, D.; Rossato, C.; Gamberini, L. Assessment of Implicit and Explicit Measures of Mental Workload in Working Situations: Implications for Industry 4.0. Appl. Sci. 2020, 10, 6416. [Google Scholar] [CrossRef]
  55. Stawarczyk, D.; François, C.; Wertz, J.; D’Argembeau, A. Drowsiness or mind-wandering? Fluctuations in ocular parameters during attentional lapses. Biol. Psychol. 2020, 156, 107950. [Google Scholar] [CrossRef] [PubMed]
  56. Bommer, S.C.; Fendley, M. A theoretical framework for evaluating mental workload resources in human systems design for manufacturing operations. Int. J. Ind. Ergon. 2018, 63, 7–17. [Google Scholar] [CrossRef] [Green Version]
  57. Yang, E.; Dorneich, M.C. The Emotional, Cognitive, Physiological, and Performance Effects of Variable Time Delay in Robotic Teleoperation. Int. J. Soc. Robot. 2017, 9, 491–508. [Google Scholar] [CrossRef]
  58. Leone, A.; Rescio, G.; Siciliano, P.; Papetti, A.; Brunzini, A.; Germani, M. Multi sensors platform for stress monitoring of workers in smart manufacturing context. In Proceedings of the 2020 IEEE International Instrumentation and Measurement Technology Conference (I2MTC), Dubrovnik, Croatia, 25–28 May 2020; pp. 1–5. [Google Scholar] [CrossRef]
  59. Blanco, M.; Biever, W.J.; Gallagher, J.P.; Dingus, T.A. The impact of secondary task cognitive processing demand on driving performance. Accid. Anal. Prev. 2006, 38, 895–906. [Google Scholar] [CrossRef] [PubMed]
  60. Grandi, F.; Peruzzini, M.; Cavallaro, S.; Prati, E.; Pellicciari, M. Creation of a UX index to design human tasks and workstations. Int. J. Comput. Integr. Manuf. 2021, 1–17. [Google Scholar] [CrossRef]
Figure 1. The proposed framework for the operators’ workload assessment.
Applsci 11 12066 g001
Figure 2. Product layout and tractor engine part involved in the case study.
Applsci 11 12066 g002
Figure 3. Case study mock-up replicated in lab and testing workstation.
Applsci 11 12066 g003
Figure 4. Workload assessment protocol.
Applsci 11 12066 g004
Figure 5. Human monitoring devices used during user testing.
Applsci 11 12066 g005
Figure 6. Physical Workload scores for test phases (with SD).
Applsci 11 12066 g006
Figure 7. NAS average results (with SD).
Applsci 11 12066 g007
Figure 8. NASA-TLX average results.
Applsci 11 12066 g008
Figure 9. Mental workload and Stress average scores on test phases.
Applsci 11 12066 g009
Table 1. Engine oil filter replacement sequence of task.
No.SubtaskAdopted Tools
1Remove electrical wiresbracketWrench
2Remove cover bracketSocket wrench
3Unplug electrical switchNone
4Unscrew engine oil filter with toolsStrap wrench
5Unscrew engine oil filter manuallyNone
6Disconnect power steering pipes (n.2)Wrench
7Unplug gasoline pipeNone
8Unplug temperature sensor electrical switchNone
9Unscrew pre-fuel filter with toolsStrap wrench
10Finalize to unscrew pre-fuel filter manuallyNone
11Unscrew temperature sensor from pre-fuel filterNone
12Screw the new temperature sensor on the pre-fuel filterNone
13Screw the pre-fuel filter manuallyNone
14Finalize to screw the pre-fuel filter with toolsStrap wrench
15Plug temperature sensor into electrical switchNone
16Plug gasoline pipeNone
17Pump the gasoline into the filtersNone
18Connect power steering pipes (n.2) manuallyNone
19Connect power steering pipes (n.2) with toolsWrench
20Fill new filter with oilNone
21Screw engine oil filter manuallyNone
22Screw engine oil filter with toolsStrap wrench
23Plug electrical switchNone
24Mount cover bracketSocket wrench
25Mount electrical wiresbracketWrench
Table 2. User data.
Table 2. User data.
Demographic InfoPhysical DataPrevious Experience
(5-Points Likert Scale)
Operator CodeGenderAgeHeightANSUR Height PercentileWeightANSUR Weight PercentileIn Maintenance TasksIn Using Mechanical ToolsIn Using Monitoring Devices
Op1M2817865p655p131
Op2M2618075p7420p245
Op3F2716775p5410p355
Op4M3116815p8040p355
Op5M2318285p6710p132
Op6M2717340p7115p454
Op7M2517230p625p134
Op8M2519399p8555p123
Table 3. Results about Physical Workload (PW).
NumberTaskop1 (65p)op2 (75p)op3 (75p)op4 (15p)op5 (85p)op6 (40p)op7 (30p)op8 (99p)PW Sub-TaskPW Phase
Phase 11Remove electrical wires bracket133331332.52.9
2Remove cover bracket333341353.1
3Unplug electrical switch333351353.3
4Unscrew engine oil filter with tools333331332.8
5Unscrew engine oil filter manually433331332.9
6Disconnect power steering pipes (n.2)433331543.3
7Unplug gasoline pipe323331352.9
8Unplug temperature sensor electical switch334331332.9
Phase 29Unscrew pre-fuel filter with tools333333333.03.3
10Finalize to unscrew pre-fuel filter manually233333433.0
11Unscrew temperature sensor from pre-fuel filter333333433.1
12Screw the new temperature sensor on the pre fuel filter333333423.0
13Screw the pre-fuel filter manually334343343.4
14Finalize to screw the pre-fuel filter with tools333333333.0
15Plug temperature sensor electical switch434343343.5
16Plug gasoline pipe333443343.4
17Pump the gasoline into the filters333343353.4
18Connect power steering pipes (n.2) manually434343553.9
19Connect power steering pipes (n.2) with tools333343343.3
Phase 320Fill new filter with oil333333333.03.1
21Screw engine oil filter manually333343333.1
22Screw engine oil filter with tools333333322.9
23Plug electrical switch333333333.0
24Mount cover bracket333333533.3
25Mount electrical wires bracket343333343.3
PW operator333.233.42.43.43.6
Publisher’s Note: MDPI stays neutral with regard to jurisdictional claims in published maps and institutional affiliations.

