Article

Effect of Parameters on Lumbar Compressive Force during Patient Transfer

Department of Mechanical Systems Engineering, Nagoya University, Furo-Cho, Chikusa-ku, Nagoya 4648603, Japan
*
Author to whom correspondence should be addressed.
Appl. Sci. 2021, 11(24), 11622; https://doi.org/10.3390/app112411622
Submission received: 30 September 2021 / Revised: 26 November 2021 / Accepted: 1 December 2021 / Published: 7 December 2021

Abstract

:
Patient transfer (PT) tasks are a significant cause of low back pain (LBP) in caregivers. Adopting proper motion strategies is an effective and inexpensive approach to reduce the risk of LBP. However, since the standardization of PT tasks is not specified in ISO 11228, there is an increasing need to develop a quantitative assessment method for the lumbar safety of caregivers. Therefore, we aim to determine the effect of representative factors, extracted from caregivers’ movements and of external force, on peak compressive force (CF) in patient transfer tasks using the lumbar compressive force as a criterion. The CF at the lumbar region is estimated using a biomechanical simulator, and regression analysis is performed between the estimated CF and representative factors. The results imply that peak CF occurs in the incipience of transfer and occurs after the occurrence of the peak trunk angle. The results also indicate that the peak CF can be reduced by preventing the representative factors from simultaneously reaching the maximum values. In this study, we provide a method of reducing peak CF by estimating the timing and magnitude of the peak to help caregivers assess the severity of LBP risk in actual PT, which is expected to contribute to the standardization of PT tasks.

1. Introduction

Caregivers suffer from a higher risk of developing work-related low back pain (LBP) compared to people in most other occupations [1]. Further, patient transfer (PT) is an important task in caregiving and hence a significant cause of LBP [2]. Therefore, an effective and inexpensive solution to prevent LBP caused by PTs to adopt a proper motion strategy [3,4]. Thus, there is an increasing need to develop a quantitative method based on biomechanics for reducing LBP risk among caregivers performing PT tasks.
The National Institute for Occupational Safety and Health (NIOSH) has proposed a lumbar compressive strength (CS) equal to 3.4 kN, as obtained from human cadavers, as the biomechanical criterion for LBP [5]. In a series of associated experiments using cadavers, the CS was obtained at the maximum compressive force (CF) that causes vertebral fracture, where CF is defined as the force acting perpendicular to the mid-plane of the lumbar disc [6,7]. Thus, monitoring the peak CF during back-straining tasks while referring to the CS can help prevent LBP effectively.
The peak CF for a manual lifting task can be estimated using several dominant factors. Potvin et al. reported the dominant factors for the peak CF by extracting factors associated with the CF in the NIOSH manual lifting equation [5,8]. The factors were the external load, body weight, and horizontal/vertical distance between the external load and human body. Merryweather et al. proposed a quasi-static model that uses body height, body weight, trunk flexion angle, external load, and the horizontal distance between the external load and body to estimate the static CF [9]. Further, the dynamics of motion influence the CF, and the static method underestimates 11–38% of the lumbar load during lifting [10]. A dynamic CF can be obtained by modifying the static CF with a constant coefficient [9]. Xiang et al. validated Merryweather’s model using the in vivo measurements performed by Nachemson, Wilke, Sato, and Takahashi [11,12,13,14,15]. These studies suggest that the flexion angle, external mass, and moment arm of the load are positively associated with the CF under 2D conditions.
However, the relationship between the CF and the aforementioned factors are limited in the 2D movement because the recruitment of trunk muscles is different under 2D and 3D conditions. For 2D lifting, the maximum normalized activity of the erector spinae is 61%, which is considerably larger than that of the other muscles. Forexample, the maximum normalized activity of the latissimus dorsi is 13% [16]. Thus, the resultant trunk muscular force is considered the erector spinae force under 2D conditions [17,18].
The CF is more difficult to obtain under 3D conditions. The activation of other trunk muscles cannot be omitted when considering 3D movement. For example, in the PT task from the bed to the wheelchair, the maximum normalized activities reported between the erector spinae and latissimus dorsi were 34% and 24%, respectively [19]. Therefore, the resultant trunk muscular force needs to be a redundancy problem of the co-activation of the trunk muscles on the estimated lumbar moment. Trunk muscle activation can be estimated by analyzing EMG data, minimizing the summation of the n-th power of trunk muscle stresses, or conducting regression analysis [20,21,22,23]. However, these methods require expensive devices to obtain motion and dynamic data, which is problematic in terms of application in hospitals or homes. Therefore, there is a practical need to determine the pattern of the dominant factors affecting peak CF in PT tasks.
To this end, many studies have investigated the dominant factors that affect the peak CF. Further, several methods have been developed to prevent the peak CF from exceeding the biomechanical criterion. Marras et al. showed that the peak CF generally exceeds 3.4 kN in PT tasks [22]. Therefore, several transfer strategies have been proposed to reduce the burden on the lumbar spine to decrease the peak CF. Schibye et al. asked the care-receivers to lean forward when they were about to be transferred, which helped decrease the peak CF from 4132 to 2708 N [24]. Jäger et al. observed a decrease in the peak CF when the caregiver was requested to hold the care-receiver firmly or with the least change in the upper body posture during the transfer. Further, they explained that this method can reduce the asymmetric load and frictional force, which decreases the peak CF [25]. This understanding can help minimize the lumbar burden. In addition, a group of studies, including the abovementioned studies, have specified the timing of the peak CF occurring around the initial point of lifting [20,22,24,25]. Further quantitative investigation into whether the peak CF always appears at an incipience point in time, and the mechanism of the CF attaining the peak, considering other factors such as the points of loading and body posture of the caregivers, can help improve our expertise not only for practical PT tasks but also in other fields wherein the back pain seems to be a problem for the workers in the industry.
The peak CF can be obtained either using the existing 2D analytical models or 3D numerical biomechanical models such as AnyBody and OpenSim [8,9,26,27]. Numerical 3D models require large motion and force data through a complete transfer motion reconstruction and a complex dynamic analysis. Analytical 2D models can only be used for 2D static or quasi-static conditions. These shortcomings make the models unfit to provide caregivers with a method for reducing peak compressive force in a specific actual site. It is difficult for caregivers to use the existing models to assess their lumbar safety in a specific actual site. Thus, there is an increasing need to develop a quantitative assessment method for the lumbar safety of caregivers.
In this study, we aimed to reveal the effect of motion factors on peak CF. We conducted experiments of various manual handling tasks using dumbbells and by simulating PT tasks to validate if the dominant factors are correlated to the peak CF appearing at the incipient timing of lifting motions. Determining the characteristic of the peak CF occurrence would allow us to train caregivers such that they can transfer patients without exceeding the biomechanical criterion. It would also allow us to develop engineering devices that can alert the caregivers about their body postures to help prevent LBP.
The organization of this paper is as follows. First, we developed a 3D dynamic simulator based on inverse dynamics and McGill’s regression model for estimating caregivers’ lumbar CF during the transfer tasks. An inertial measurement unit (IMU) motion capture system and four force plates obtained the motion and force data. Second, we conducted the PT experiment to discuss the effect of the dominant factors on peak CF. We also conducted the dumbbell lifting (DL) experiment to investigate the influence of primitive motions on peak CF. Third, we developed a regression model for estimating the peak CF by using the dominant factors. Finally, we discussed the influence of the PT speed on peak CF by comparing the CF estimated by the regression model and Merryweather’s analytical model.

2. Method

2.1. Experiment

2.1.1. Subjects

The Institutional Review Board at Nagoya University (Department of Engineering, No. 20-18) approved this project. Five healthy male subjects (mean and standard deviation 27 ± 2.2 years; height: 176 ± 2.5 cm; body mass: 65 ± 8.2 kg) participated in the study as caregivers. One subject (age: 24 years, height: 173 cm; body mass: 65 kg) was recruited as the patient/care-receiver. Unless otherwise specified, the labels “caregivers” and “patient” are used to represent subjects who played the roles of caregivers and the patient, respectively. All subjects were healthy and had no history of LBP. We selected the participants from among the university students as the transfer task had a high risk of lower back pain. Moreover, being young, they could tolerate relatively high lumbar loads.

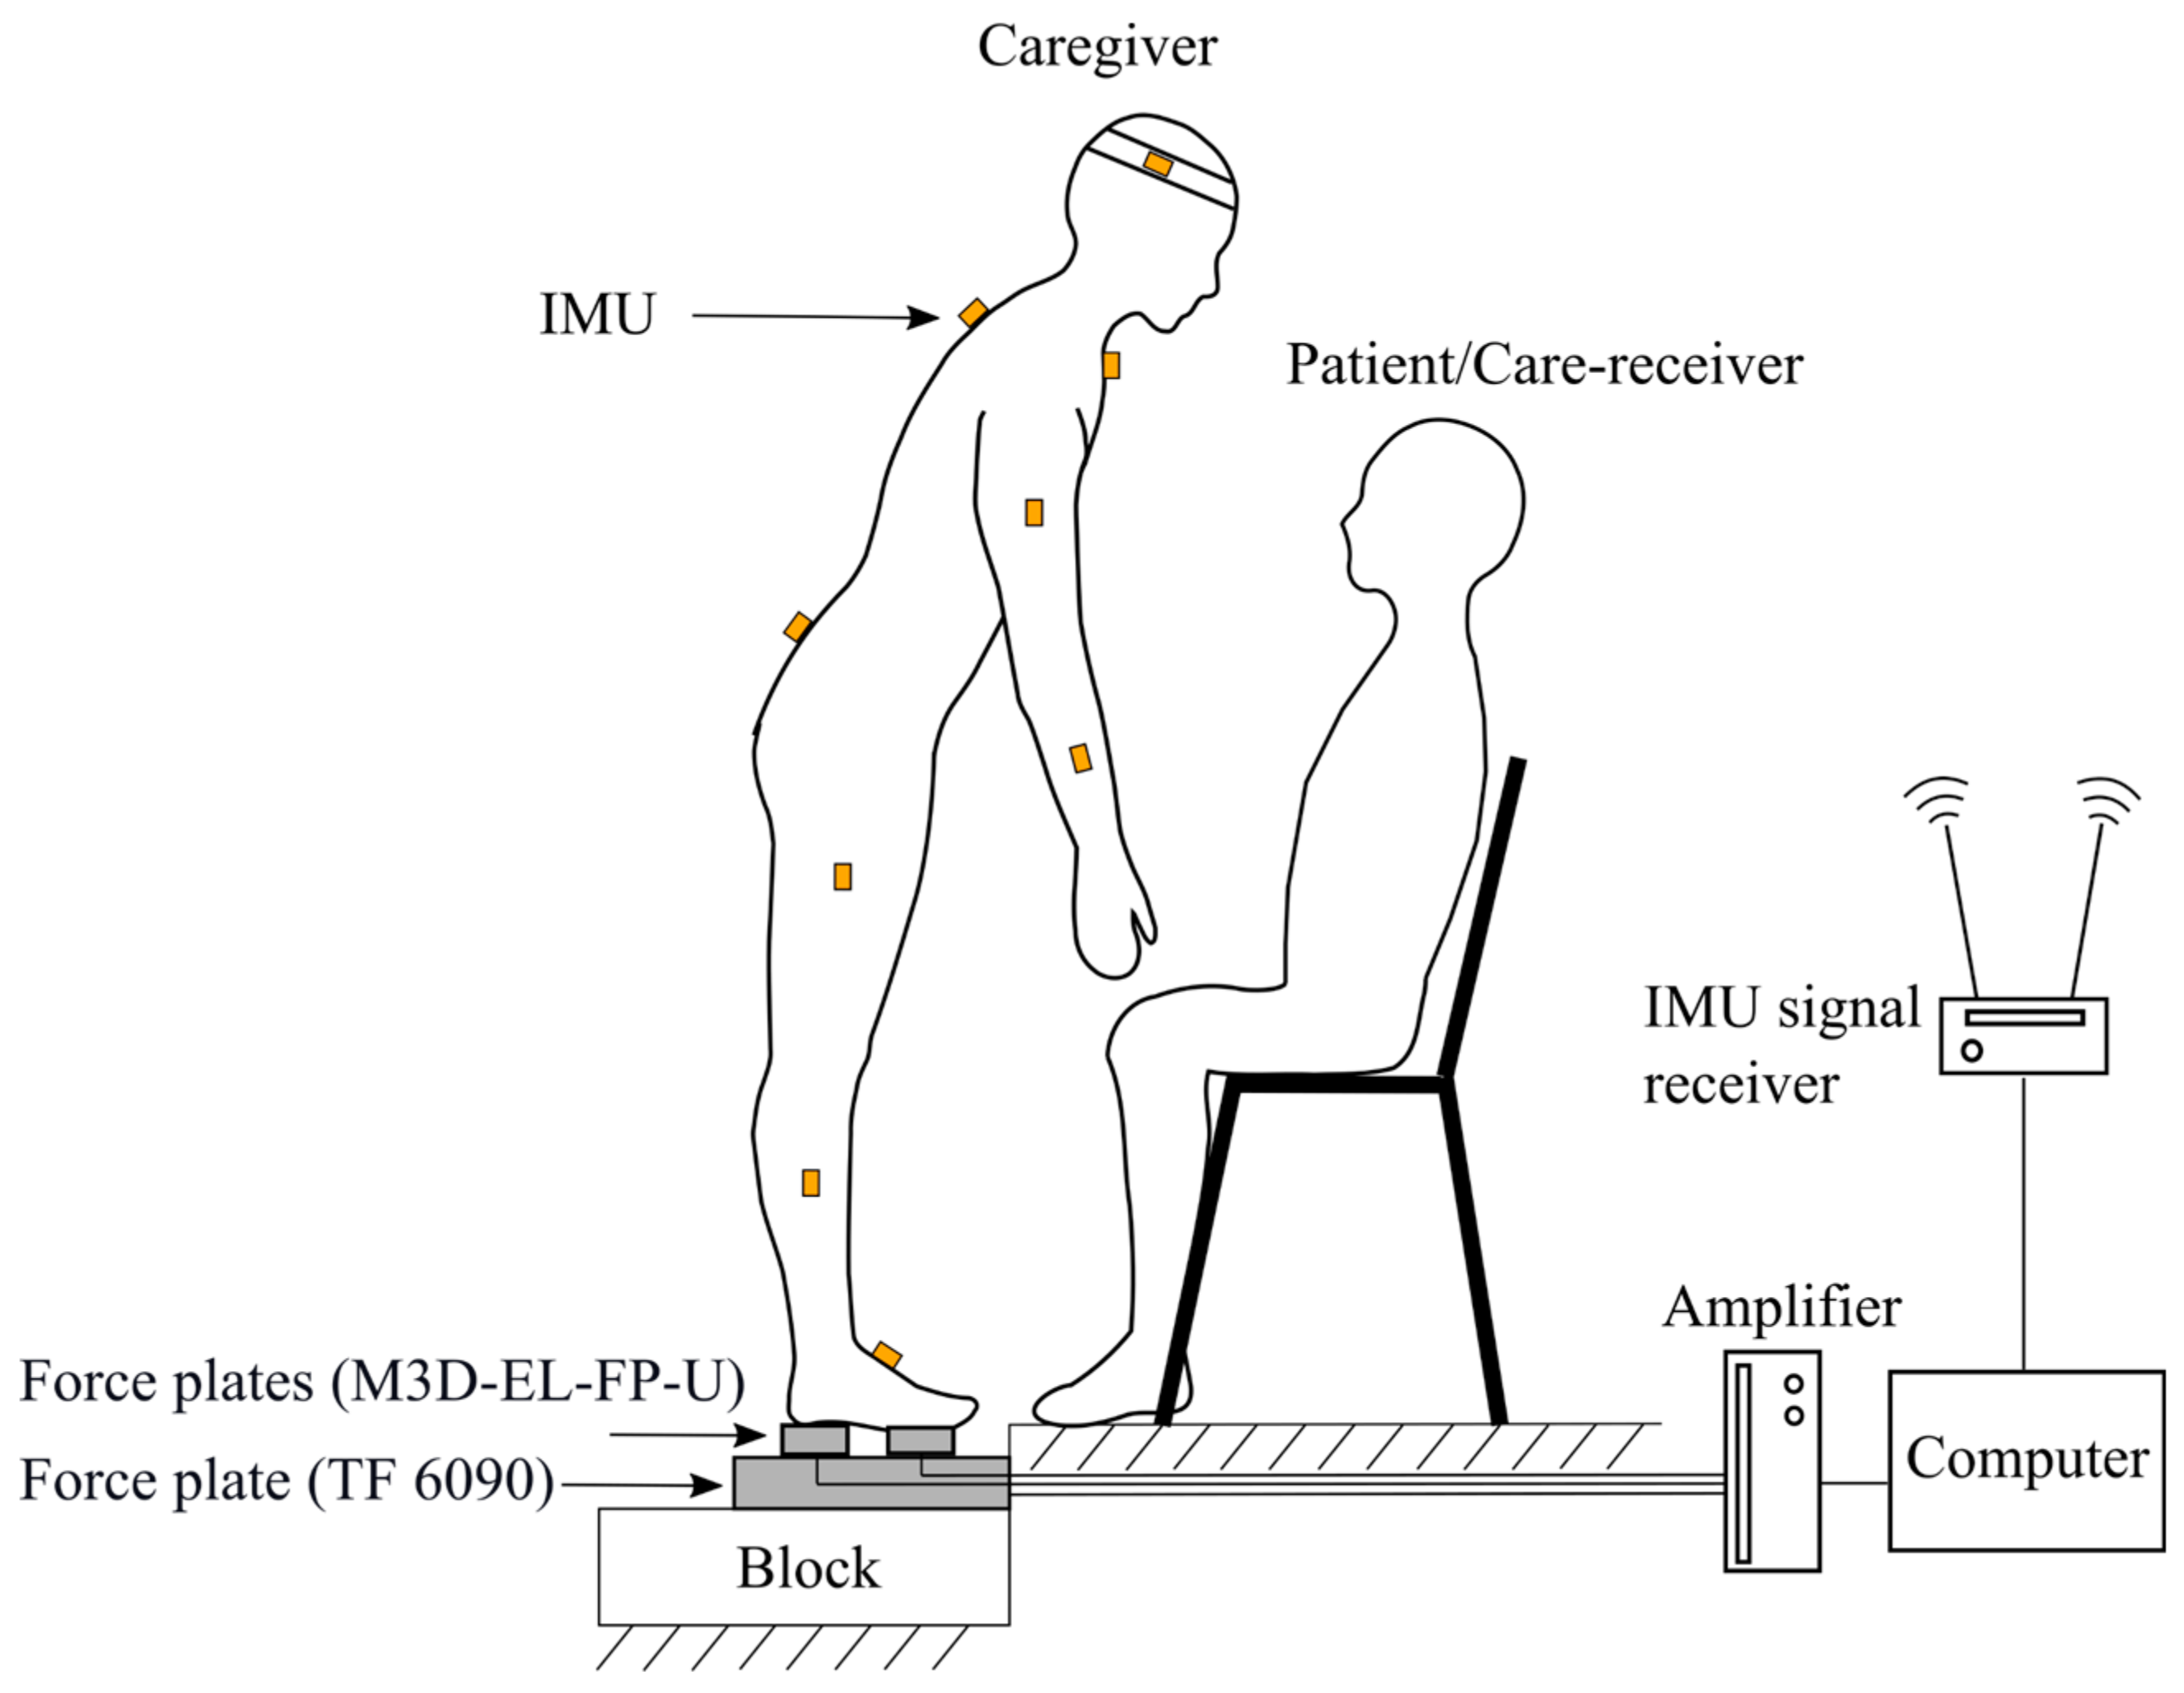
2.1.2. Instrumentation

As shown in Figure 1, a motion capture system based on an IMU system Xsens MVN Analyze (Xsens, Inc., Enschede, The Netherlands) reconstructed the motion. A total of 15 IMUs were attached to the head, shoulders, L5/S1 (part between the fifth lumbar segment and first sacrum segment), upper arms, forearms, thighs, shanks, and feet. Four force plates (M3D-EL-FP-U, Tec Gihan Co., Ltd., Kyoto, Japan) were used to measure the ground reaction force (GRF) at the balls of both feet and at the heels of each caregiver. A large force plate (TF 6090 type, Tec Gihan Corporation, Kyoto, Japan) placed on the feet of each caregiver was used to monitor and control the total load for the safety of the caregivers. The maximum acceptable load for a caregiver was defined as a total of the weight of the caregiver and an external load of 15 kgf. We calibrated the maximum acceptable load for each caregiver by asking him to stand still with a 15 kgf dumbbell. Then, for the training of the PT task, the patient was asked to support more of his body weight on his feet when the total load recorded by the large force plate exceeded the maximum acceptable load for the caregiver. We started the experiment with the subjects accustomed to performing the PT tasks with an external load of less than 15 kgf.
The data recorded at 60 Hz were filtered by a low-pass filter with a cut-off frequency of 4 Hz. The relationship between the peak CF and the dominant factors in this study was not appropriate for an external load larger than 15 kgf because we limited the external load to less than 15 kgf. In the actual case of an external force exceeding 15 kgf, caregivers need to use assisting devices for the transfer.

2.1.3. Tasks for Transfer Motion

Task (a) was conducted to investigate how the CF varied when using different lifting strategies, and Task (b) was conducted to obtain the peak CF in the actual PT task. As shown in Figure 2a, the transfer tasks (a and b) included two parts:
The caregivers lifted a 15 kg dumbbell from 70 cm to 130 cm within 2 s with a twisting angle of 60° (the angle between O P and the sagittal plane (X-Z plane)). Twisting and extension were considered the two primitive motions in the transfer tasks. The DL task was performed from the left side to the sagittal plane in three patterns. These three patterns were combination (com)––defined as diagonal lifting with simultaneous extension and twisting motions combined, twisting-extension (t-e), and extension-twisting (e-t).
The caregivers performed the PT task in 10 s, as shown in Figure 2b. They performed the task by transferring the patient from the sagittal plane (X-Z plane) to a wheelchair on the right side, and the angle between the chair and the wheelchair was 90°.
Before the experiment, all caregivers were trained in the PT motions to ensure their approach to transfer the patient was similar to that performed at actual clinical sites.
The objective of the DL task was to investigate whether the transfer trajectories affected the peak CF. The objective of the PT task was to investigate how the peak CF was affected by the dominant factors. We selected these tasks because transfer tasks are risky to human lumbar under the criterion of the CF limit (3.4 kN) as proposed by NIOSH. Marras et al. (1998) reported that the peak CF increases by 17% with an asymmetric angle of 60° compared to the symmetric box lifting, and that most asymmetric transfer tasks could result in exceeding the CF limit (3.4 kN) proposed by NIOSH [5,16]. Therefore, it implies that there would also be a high risk of LBP in PT tasks because of this aspect. Furthermore, previous studies have reported that caregivers would probably experience a peak CF exceeding NIOSH’s CF limit by 1–2 kN [21] [24] if the transfer strategy was not adopted in the PT tasks. Thus, we need to investigate the characteristics of the peak CF occurrence.

2.2. CF Estimation

2.2.1. Inverse Dynamic Computation

Assume that the body is a link chain with 24 segments in total. The segments include the left forearm, left upper arm, right forearm, right upper arm, head and neck, upper thoracic (between the seventh cervical segment and the seventh thoracic segment), thoracic to the sacrum (from the eighth thoracic segment to the first sacrum segment), pelvis, left thigh, left shank, right thigh, right shank, left foot, and right foot [28].
The Newton–Euler method estimates the joint moment at L5/S1 (between the fifth lumbar and first sacrum)—denoted as M L 5 / S 1   —by inputting the movement and the GRF [29]. The components of M L 5 / S 1   in the coronal (Y-Z), sagittal (X-Z), and transverse (X-Y) planes are represented as M L 5 / S 1   x , M L 5 / S 1   y , and M L 5 / S 1   z , respectively (Figure 2). The joint locations and orientations were estimated using the virtual markers of the human model established in the Xsens software. Keller’s magnetic resonance imaging (MRI) analysis helps correct the virtual markers between the thoracic and lumbar for L5/S1 [30]. The GRF was obtained at both feet, and the locations of the force plates were fixed before the transfer. Thus, the caregivers were not allowed to move their feet during the experiment.

2.2.2. McGill’s Compressive Force Model (McGM)

A polynomial regression model was proposed by McGill et al. to represent the CF [23]. Based on this, the CF can be estimated in a 3D space as
CF = 1067.6 + 1.219 F + 0.083 F 2 0.0001 F 3 + 3.229 B + 0.119 B 2 0.0001 B 3 + 0.862 T + 0.393 T 2 0.0001 T 3
where F denotes the M L 5 / S 1   y extension moment, where negative values correspond to flexion (N·m), B denotes M L 5 / S 1   x lateral bending moment where bending to the right is positive (N·m), and T denotes M L 5 / S 1   z axial twisting moment where the counter-clockwise twist is positive (N·m), respectively. Further, the constant term is   1067.6 .

2.3. Dominant Factors of Peak CF

We used five representative factors to estimate the peak CF: trunk flexion angle ( θ ), trunk flexion angular velocity ( ω ), angular acceleration ( α ), horizontal distance between the wrist and lumbar ( H ), and GRF ( GRF ). The wrist position was determined based on the center of the left and right wrist markers. The definitions of θ , and the determination of ω and α are illustrated in Figure 3, wherein θ represents the trunk angle formed by vectors V 1 and V 2 . Vector V 2 was obtained by translating V 2 from S1′ to S1. The locations of the virtual marker of the first segment of the sacrum and the seventh segment of the cervical are denoted by S1 and C7 in the upright posture, and by S1′ and C7′ in the flexed posture, respectively. Further, we define V 1 = S 1 C 7 and V 2 = S 1 C 7 . 0 , 1 , and 2 represent the global coordinate system, local coordinate system of the first segment of the sacrum in the upright posture, and local coordinate system of the first segment of the sacrum in the flexed posture, respectively. 0 R 1 and 0 R 2 represent the rotational matrix for a vector present in 0 from 1 and 2 .
The definitions of t 0 , t 1 , t 2 , and t 3 are explained in Figure 4. The period t of CF, θ , ω , α , G R F , and H ( t C F p , t θ p , t ω p , t α p , t G R F p , and t H p ) is from t 1 to the timing of the maximum t p for CF, θ , ω , α , G R F , and H ( t p C F p , t p θ p , t p ω p , t p α p , t p G R F p , and t p H p ). The period t of each factor was normalized by the duration of the entire PT task ( t 3 t 1 ), and it is defined as φ (%), where φ = t / t 3 t 1 . The normalized period φ for CF, θ , ω , α , G R F , and H are denoted as φ C F p , φ θ p , φ ω p , φ α p , φ G R F p , and φ H p , respectively.

2.4. Statistical Analysis

In all trials of the DL tasks, the Kruskal–Wallis test was used to compare the magnitude of peak CF and its timing among the e-t, com, and t-e patterns. In all trials of the PT tasks, the Mann-Whitney test was used to compare the magnitude of the maximum CFs under the following two conditions: at the beginning of lifting and the end of lowering. The Kruskal–Wallis test and Dunn–Bonferroni post-hoc test revealed a significant difference (at the 0.05 level with a corresponding 95% confidence interval) among the time lags of the maximum achieved by the different variables ( C F p , θ p , ω p , α p , G R F p , H p , where subscript p represents the peak value) in the PT tasks. The Pearson correlation coefficient was used in the PT tasks to determine the correlation between the peak CF timing and the representative factors. A 3D dynamic regression model was established using θ , ω , α , G R F , and H to estimate the peak CF in the PT tasks.

2.5. Model Implementation and Comparison with State of the Art

McGill’s model (3D dynamic regression model) was compared with AnyBody modeling system and Merryweather’s 2D quasi-static model, respectively [9,23,26], to understand that the AnyBody modeling system uses inverse dynamic computation and a detailed muscle model, while Merryweather’s model is an analytical model used for the 2D case. Merryweather model is given as
C F M = k × 0.0167 B W H sin β + 0.145 L H B + 0.8 B W / 2 + L + 23 × g
where k, BW, β , H, HB, L, b, and g represent the speed-related coefficients (slow = 1.15, moderate = 1.3, and fast = 1.4), body weight (kg), height (cm), horizontal distance between the wrist and the lumbar (cm), load carried by the subjects (kg), angle between the trunk in different positions and the vertical direction (rad), and gravitational constant, respectively. k = 1.15 was determined by us, and we projected the 3D motion into the sagittal plane to use Merryweather’s model in a 3D case.
The results show that the values of R-squares between McGill-AnyBody and McGill-Merryweather are 0.83 and 0.92, respectively. In addition, the differences of estimation were 2% and 5% for AnyBody’s result and Merryweather’s result, respectively, compared with McGill’s result.

3. Result

3.1. Patient Transferring Task

3.1.1. Peak CF Timing and Peak CF in the Patient Transferring Tasks

The peak CFs estimated during lifting and lowering are listed in Table 1. The mean value and the standard deviation of the peak CFs in all trials at the beginning of lifting and at the end of lowering were 2141 N (301 N) and 1968 N (396 N), respectively. The results of the Mann-Whitney test indicate that the peak CF in the lifting phase is significantly greater than that in the lowering phase. Therefore, we consider that the peak CF always occurs during lifting.
The mean values and standard deviations of each variable are shown in Table 2 Note that e % is defined as the error between the φ of each factor and the φ of the peak CF. Based on the investigations of the Kruskal-Wallis test and Dunn-Bonferroni post-hoc test, the difference between the time lag of the peak value of different factors in the PT tasks are summarized in Table 3.

3.1.2. Multiple Linear Regression Equation for Peak CF

R i 2 represents the coefficient of determination ( R 2 ) obtained by regressing the i -th factor related to the remaining factors. In Table 4, there was no multicollinearity because all variance inflation factors (VIFs) < 10. We applied multiple linear regression analysis for all factors concerning peak CF. The R-squared value was 0.46. The coefficient of each parameter is given by
C F p = 13.61 θ + 31.30 ω + 1.15 α + 0.10 G R F + 38.67 H 1205

3.1.3. Comparison between the 3D Regression and Merryweather Models

The peak CF obtained from the 3D regression model was moderately correlated with Merryweather’s model, with an R-square equals to 0.63 (at a level of 0.05, p-value < 0.001). The fitted slope between the 3D regression and Merryweather’s models was 1.07, and the estimated CF in the 3D regression model was slightly lower than that of Merryweather’s model.

3.2. Dumbbell Lifting Task

Peak CF Timing and Peak CF in the Dumbbell Lifting Tasks
The peak CF, as obtained in the DL experiment, is shown in Table 5. In the analysis of the Kruskal-Wallis test, no significant difference (p = 0.057) was observed among the peak CFs under the various conditions during the DL tasks, nor in the timing of the peak CF.

4. Discussion

4.1. Lag of Peak CF with Respect to the Initiation

The estimated peak CF at the beginning of lifting was significantly (p = 0.025) greater than that at the end of lowering. This implies that the peak CF occurs in the lifting phase of the PT task, which is supported by previous studies [20,22,24].
As shown in Figure 4, the peak CF occurs at the incipience of lifting and between the factors whose peak value occurs the earliest and the latest. Previous studies have described the peak CF that appears only at the beginning of lifting, However, they have not provided any determinations of the “beginning” [20,22]. For example, whether the peak CF occurs at the initiation or lags a little from the initiation is unclear.
Therefore, it is difficult to determine when caregivers should apply an optimization strategy. The results for the normalized time error presented in Table 2 indicate that caregivers should adopt transfer strategies at the maximum trunk angle and trunk angular acceleration. The trunk angle can be considered the trigger to imply the arrival of the peak CF because of the difficulty in obtaining trunk angular acceleration.
According to Equation (3), the most severe condition is when all factors reach the maximum simultaneously such that the estimated peak CF is greater than that in ordinary scenarios. The caregivers’ lumbar will endure a greater peak CF if more factors reach the peak values simultaneously. Therefore, we need to prevent factors that have the greatest impact on the peak CF from reaching the peak values simultaneously. According to Table 3, preventing ω p and H p from occurring simultaneously is a solution for reducing C F p because both factors have a considerable impact on the peak CF compared to the other factors θ p , α p , and G R F p . We need to adopt a strategy to change the timing of H p as ω p will be generated at the beginning of the lifting. Further, considering the space restriction of the chair, the maximum H occurs when the patient is sitting. Thus, it is preferable to let H p occur before ω p . To allow H p to occur before ω p , a caregiver needs to pull the patient in the direction of the caregiver at the incipience of lifting. Thus, the strategy of preventing the representative factors from achieving maximum values close to one another effectively reduces peak CF.

4.2. Effect of Primitive Motion on Peak CF

Table 5 indicates that the integration of primitive motions did not significantly influence the peak CF in the DL experiment. In Plamondon’s study, the extension, as well as the lateral and twisting peak lumbar movement, showed no difference among the trajectories when the subject lifted an 11.6 kgf box from a low shelf (22 cm from the ground) to a high shelf (80 cm from the ground) with a twisting angle of 90 [31]. Based on the relationship between the lumbar movement and CF reported by McGill, we can infer that the peak CF in Plamondon’s experiment did not show any difference in different lifting trajectories [23]. Further, Table 5 implies that the peak CF of all lifts occurs in the incipience of lifting. This means the direction of lifting in the incipience does not affect peak CF. The 2D Merryweather model, having validation in lifting tasks, is inappropriate for 3D PT tasks [9]. However, based on the results of DL, it is possible to obtain the peak CF of the PT task using the 2D human model. The PT task in the incipience is considered as an integration of primitive motions. Thus, we assume that the PT task starts from the extension and ends with twisting. Since the caregiver starts transferring from the sagittal plane, the PT task incipience can be considered as sagittal lifting.

4.3. Incipience of Patient Transfer and Sagittal Lifting

According to the Newton-Euler equation and McGill’s model, the representative factors can be divided into the effects of dynamics (trunk angular velocity and trunk angular acceleration) and statics (trunk angle, GRF, and horizontal distance between wrist and lumbar) on the CF, respectively. Excluding the components of the trunk angular velocity and trunk angular acceleration, Equation (3) underestimates 12.2–33.7% of the peak CF in the incipience of lifting. This result is similar to that reported in a previous study wherein the static model caused an 11–38% underestimation of the lumbar load in sagittal lifting, which supports the assumption that the incipience of lifting is sagittal lifting [10].

4.4. Merryweather’s Model vs. 3D Regression Model

Thus, as indicated in Section 4.3, it is appropriate to use Merryweather’s 2D model to estimate the peak CF at the incipience of lifting. Since Merryweather determined the effect of dynamics as a speed-related factor k and based on the selection of the participants, k has not been determined quantitatively. Further, k cannot represent various speeds but only slow (k = 1.15), moderate (k = 1.3), and fast (k = 1.4) levels. A comparison between our regression model and Merryweather’s model indicates that the estimated error of peak CF is 7%, or 150 N. This error implies that Merryweather’s quasi-static model overestimates the peak CF. Therefore, the speed-related factor k obtained by the regression model proposed in this study is smaller than that in the slowest condition determined by Merryweather’s model. The k estimated in the regression model should be approximately 1.07, with a significant difference (p < 0.001) in the PT tasks.

4.5. Benefits of This Study

The existing biomechanical simulators require bulky devices to obtain a large amount of motion data and dynamic data [20,21,22]. Some analytical models cannot appropriately calculate the results of the dynamic effect on peak CF [8,9]. Thus, we proposed a model to simplify the calculations and present the dynamic effect using the trunk flexion angle, angular velocity, angular acceleration, GRF, and horizontal distance between lumbar and wrist. These factors can be measured or estimated using three inertial measurement unit (IMU) sensors (i.e., MTi 1-seires, Xsens Inc., Enschede, The Netherlands), two for the left and right wrist, and the other one for the lumbar instead of using a motion capture system. Meanwhile, the change of these factors is easily felt and controlled by caregivers in real-life scenarios. In addition, since the external load in this study was controlled and did not exceed 15 kgf, the external load only caused a small effect on peak CF in Equation (3). In the actual case, the GRF can be simplified as GRF = mg + 15 × g, where m represents body mass (kg), g represents gravitational constant 9.8 m / s 2 , and 15 (kg) is the maximum of external load controlled in this study. Thus, in the actual case, the GRF need not necessarily be measured. The reason to control the external load at 15 kgf is to protect the caregivers’ lumbar safety.
The suggestion of reducing H in this study is similar to that adopted by Schibye et al., who asked the patient to lean forward at the beginning of lifting. The results showed that the caregiver’s peak CF could be reduced by approximately 1400 N or 34.5% of that obtained in the conventional transfer method [24]. However, the authors did not show the quantitative relationship between the distance and peak CF. In this study, we determined that changing the H, trunk angle, and angular velocity was more significant than the other factors in reducing the peak CF, as shown in Equation (3). In addition, Equation (3) can estimate the acceptable values of each factor (of course including H) without exceeding the CF limit (3.4 kN). Thus, Equation (3) also provides insight into the safety assessment for caregivers.
The proposed model also provides insight into the effectiveness of the assistive product (i.e., lifting slings). By comparing the peak CF obtained with and without the assistive device, the effectiveness of the assistive device can be evaluated. In addition, the factor by which the assistive device must be optimized so as to reduce the peak CF can be intuitively presented owing to the model’s simplicity.

4.6. Application of the Regression Model in Other Scenarios

This model can be used for scenarios that include the sitting transfer process. Based on the investigation of Skotte et al. (2002), there are 10 primitive handling tasks in caregiving motions [20]. The conventional caregiving scenarios can be considered as one of these tasks or a combination of several of these tasks. The peak CF of these scenarios mainly occurs in the sitting transfer task. Thus, it is necessary to estimate the peak compressive force during the transfer phase from sitting on one seat to another. For example, transferring a patient from one bed to another bed requires three tasks. The caregiver is “elevating the patient from a supine position on the bed to sitting on the edge of the bed” (Task E), “transferring the patient from sitting on the bed to sitting on another bed” (Task T), and “moving the patient from sitting on the bed to supine position on the bed” (Task M). In this case, this model can be used for task T. Usually, task T is the worst case of all three tasks. Thus, task T can be selected as the representative task of the whole scenario whose peak compressive force can be estimated by the model proposed in this study.

4.7. Limitations

There are some limitations to our study.
  • This experiment did not include a considerable weight and age group or a large number of subjects because of the massive number of tasks and large analysis, which is a reason the R-square value was not high in the regression analysis. In addition, it is unclear to what extent the small sample can explain the peak CF timing when considering the individual differences requires validation in the real transfer tasks.
  • The subjects were college students who could not perform the tasks as professional caregivers or patients with physical constraints. Usually, well-trained caregivers will start at a lower speed than those without experience in transfer. It will take away the peak timing of all the factors, thereby causing a reduction of the peak CF. If we use well-trained caregivers, we can observe the difference among the peak CF timing, peak angular velocity timing, and peak H timing. We can probably use peak angular velocity or peak H to estimate the timing of peak CF instead of using peak trunk angle or angular acceleration.
  • The peak trunk flexion angle in the PT task was 48.5°, which is greater than 31° as reported by Marras et al. [32], but smaller than 84.1° as demonstrated by Hodder et al. [33]. Different trunk angles result in errors in the CF estimation. There are three possible reasons for the difference between trunk angles in our study and other studies. The first reason is the knee angle. In lifting, an increase of knee angle leads to a decrease of trunk angle and a decrease of peak CF. A lifting sample is provided in ISO 11228-1, which states that the caregivers need to perform a larger trunk flexion when they keep their legs straight compared to when they bend their knee, and the peak CF in the latter is much smaller than the former. The second reason is the location where the caregiver holds the patient. As the caregivers support the patients at their hip, waist, and underarm, the peak trunk angles of the caregivers vary. Third, the experimental setup also affects the peak trunk angle. For example, using a taller chair leads to a smaller peak trunk angle.
  • For the safety of the lumbar, this study referred to the description of the acceptable external load in the international standard for manual lifting ISO 11228-1, which states, “In order to lower the risk for people at work, particularly those with less physical capability, the recommended limit for mass should not exceed 15 kg” [34]. Therefore, the maximum change in the G R F on the caregivers was limited to 150 N in the experiment. When the external force exceeds 15 kgf, assisting devices should be used to facilitate the transfer.
  • Not controlling the knee angle is a limitation of this study because the knee angle could affect the upper trunk angle, resulting in a variation in the estimation of the CF. In our study, the Kruskal-Wallis test showed that both the left and right knee angles varied among subjects (p < 0.001), while the trunk angle did not (p = 0.1754). One possible explanation is that the posture of each subject was well coordinated to maintain the trunk angle. This posture may have been similar among all subjects, with each subject adjusting their hip and knee angles at the same time. Therefore, a change in knee angle did not lead to a large variance of trunk angle in this study.
Since this relationship between the peak CF and the simple factors has not been reported in the literature, we needed to investigate this relationship under known safety conditions. Thus, we conducted the experiment with healthy students with a limited lumbar burden instead of actual tasks conducted by real caregivers and care-receivers.
Although this study has several limitations, we provide a quantitative estimation method for the peak CF in PT tasks, which is expected to contribute to the standardization of PT tasks. Furthermore, we can recruit more caregivers and care-receivers to improve the estimation method of peak CF after the data obtained under various PT conditions are abundant and a safe environment is ensured.

5. Conclusions

This study investigated the relationship between the peak CF at the lumbar and the caregivers’ motion strategies in chair-to-chair PT tasks. At the incipience of transfer, the factors with greatest effect on peak CF were the trunk angular velocity ( ω ) and horizontal distance between the wrist and lumbar ( H ). However, the peak CF was not significantly affected by the direction at the incipience of transfer. To reduce the peak CF, caregivers should adopt a proper motion strategy at the instance of the maximum trunk flexion angle ( θ p ), which implies the arrival of the peak CF. The strategy should be adopted to reduce the maximum values of the dominant factors and prevent the dominant factors from reaching the maximum values simultaneously. The findings in this study are expected to contribute to the standardization of PT tasks.

Author Contributions

Conceptualization, X.X. and Y.Y.; Data curation, X.X. and H.N.; Funding acquisition, Y.Y.; Investigation, X.X.; Methodology, X.X., Y.A. and N.K.; Project administration, Y.Y.; Software, H.N.; Visualization, X.X.; Writing—original draft, X.X.; Writing—review and editing, Y.Y. and Y.A. All authors have read and agreed to the published version of the manuscript.

Funding

This research was funded by the Japan Agency for Medical Research and Development (AMED), Japan, grant number hJP16he1202004.

Institutional Review Board Statement

The Institutional Review Board at Nagoya University (Department of Engineering, No. 20-18) approved this project.

Informed Consent Statement

Informed consent was obtained from all subjects involved in the study.

Data Availability Statement

Not applicable.

Acknowledgments

The authors would like to thank Kenji Kato and others at the National Center.

Conflicts of Interest

The authors declare no conflict of interest.

References

  1. Davis, K.G.; Kotowski, S.E. Prevalence of musculoskeletal disorders for nurses in hospitals, long-term care facilities, and home health care: A comprehensive review. Hum. Factors 2015, 57, 754–792. [Google Scholar] [CrossRef] [PubMed]
  2. Knibbe, J.J.; Friele, R.D. Prevalence of back pain and characteristics of the physical workload of community nurses. Ergonomics 1996, 39, 186–198. [Google Scholar] [CrossRef]
  3. Waters, T.R.; Rockefeller, K. Safe patient handling for rehabilitation professionals. Rehabil. Nurs. 2010, 35, 216–222. [Google Scholar] [CrossRef] [PubMed]
  4. Yassi, A.; Lockhart, K. Work-relatedness of low back pain in nursing personnel: A systematic review. Int. J. Occup. Environ. Health 2013, 19, 223–244. [Google Scholar] [CrossRef]
  5. Waters, T.R.; Putz-Anderson, V.; Garg, A.; Fine, L.J. Revised NIOSH equation for the design and evaluation of manual lifting tasks. Ergonomics 1993, 36, 749–776. [Google Scholar] [CrossRef] [PubMed]
  6. Adams, M.A.; McNally, D.S.; Chinn, H.; Dolan, P. The clinical biomechanics award paper 1993 posture and the compressive strength of the lumbar spine. Clin. Biomech. 1994, 9, 5–14. [Google Scholar] [CrossRef]
  7. Genaidy, A.M.; Waly, S.M.; Khalil, T.M.; Hidalgo, J. Spinal compression tolerance limits for the design of manual material handling operations in the workplace. Ergonomics 1993, 36, 415–434. [Google Scholar] [CrossRef]
  8. Potvin, J.R. Use of NIOSH equation inputs to calculate lumbosacral compression forces. Ergonomics 1997, 40, 691–707. [Google Scholar] [CrossRef]
  9. Merryweather, A.S. Model Development for the Estimation of Back Compressive Force and Subsequent Low Back Disorder Risk. Doctoral Dissertation, Department of Mechanical Engineering, University of Utah, Salt Lake City, UT, USA, 2007. [Google Scholar]
  10. van Dieën, J.H.; Faber, G.S.; Loos, R.C.; Kuijer, P.P.F.; Kingma, I.; van der Molen, H.F.; Frings-Dresen, M.H. Validity of estimates of spinal compression forces obtained from worksite measurements. Ergonomics 2010, 53, 792–800. [Google Scholar] [CrossRef] [PubMed]
  11. Xiang, X.; Yamada, Y.; Akiyama, Y.; Tao, Z.; Kudo, N. Validation of lumbar compressive force simulation in forward flexion condition. Appl. Sci. 2021, 11, 726. [Google Scholar] [CrossRef]
  12. Nachemson, A.L.F.; Morris, J.M. In vivo measurements of intradiscal pressure: Discometry, a method for the determination of pressure in the lower lumbar discs. J. Bone Jt. Surg. 1964, 46, 1077–1092. [Google Scholar] [CrossRef]
  13. Wilke, H.J.; Neef, P.; Caimi, M.; Hoogland, T.; Claes, L.E. New in vivo measurements of pressures in the intervertebral disc in daily life. Spine 1999, 24, 755–762. [Google Scholar] [CrossRef] [PubMed]
  14. Sato, K.; Kikuchi, S.; Yonezawa, T. In vivo intradiscal pressure measurement in healthy individuals and in patients with ongoing back problems. Spine 1999, 24, 2468. [Google Scholar] [CrossRef] [PubMed]
  15. Takahashi, I.; Kikuchi, S.I.; Sato, K.; Sato, N. Mechanical load of the lumbar spine during forward bending motion of the trunk—A biomechanical study. Spine 2006, 31, 18–23. [Google Scholar] [CrossRef] [PubMed]
  16. Marras, W.S.; Davis, K.G. Spine loading during asymmetric lifting using one versus two hands. Ergonomics 1998, 41, 817–834. [Google Scholar] [CrossRef] [PubMed]
  17. Chaffin, D.B.; Andersson, G.B.; Martin, B.J. Occupational Biomechanics; John Wiley & Sons: Chicago, IL, USA, 2006; pp. 133–134. [Google Scholar]
  18. Nussbaum, M.A.; Chaffin, D.B.; Rechtien, C.J. Muscle lines-of-action affect predicted forces in optimization-based spine muscle modeling. J. Biomech. 1995, 28, 401–409. [Google Scholar] [CrossRef]
  19. Keir, P.J.; MacDonell, C.W. Muscle activity during patient transfers: A preliminary study on the influence of lift assists and experience. Ergonomics 2004, 47, 296–306. [Google Scholar] [CrossRef] [PubMed]
  20. Skotte, J.H.; Essendrop, M.; Hansen, A.F.; Schibye, B. A dynamic 3D biomechanical evaluation of the load on the low back during different patient-handling tasks. J. Biomech. 2002, 35, 1357–1366. [Google Scholar] [CrossRef]
  21. Jäger, M.; Jordan, C.; Theilmeier, A.; Wortmann, N.; Kuhn, S.; Nienhaus, A.; Luttmann, A. Lumbar-load analysis of manual patient-handling activities for biomechanical overload prevention among healthcare workers. Ann. Occup. Hyg. 2013, 57, 528–544. [Google Scholar] [PubMed] [Green Version]
  22. Marras, W.S.; Davis, K.G.; Kirking, B.C.; Bertsche, P.K. A comprehensive analysis of low-back disorder risk and spinal loading during the transferring and repositioning of patients using different techniques. Ergonomics 1999, 42, 904–926. [Google Scholar] [CrossRef] [PubMed]
  23. McGill, S.M.; Norman, R.W.; Cholewicki, J. A simple polynomial that predicts low-back compression during complex 3-D tasks. Ergonomics 1996, 39, 1107–1118. [Google Scholar] [CrossRef] [PubMed]
  24. Schibye, B.; Hansen, A.F.; Hye-Knudsen, C.T.; Essendrop, M.; Böcher, M.; Skotte, J. Biomechanical analysis of the effect of changing patient-handling technique. Appl. Ergonom. 2003, 34, 115–123. [Google Scholar] [CrossRef]
  25. Theilmeier, A.; Jordan, C.; Luttmann, A.; JäGer, M. Measurement of action forces and posture to determine the lumbar load of healthcare workers during care activities with patient transfers. Ann. Occup. Hyg. 2010, 54, 923–933. [Google Scholar]
  26. Damsgaard, M.; Rasmussen, J.; Christensen, S.T.; Surma, E.; De Zee, M. Analysis of musculoskeletal systems in the AnyBody Modeling System. Simul. Model. Pract. Theory 2006, 14, 1100–1111. [Google Scholar] [CrossRef]
  27. Delp, S.L.; Anderson, F.C.; Arnold, A.S.; Loan, P.; Habib, A.; John, C.T.; Thelen, D.G. OpenSim: Open-source software to create and analyze dynamic simulations of movement. IEEE Trans. Biomed. Eng. 2007, 54, 1940–1950. [Google Scholar] [CrossRef] [PubMed] [Green Version]
  28. Roetenberg, D.; Luinge, H.; Slycke, P. Xsens MVN: Full 6DOF human motion tracking using miniature inertial sensors. Xsens Motion Technol. BV Tech. Rep. 2009, 1–9. [Google Scholar]
  29. Winter, D.A. Biomechanics and Motor Control of Human Movement; John Wiley & Sons: Hoboken, NJ, USA, 2009. [Google Scholar]
  30. Keller, T.S.; Colloca, C.J.; Harrison, D.E.; Harrison, D.D.; Janik, T.J. Influence of spine morphology on intervertebral disc loads and stresses in asymptomatic adults: Implications for the ideal spine. Spine J. 2005, 5, 297–309. [Google Scholar] [CrossRef] [PubMed]
  31. Plamondon, A.; Gagnon, M.; Gravel, D. Moments at the L5/S1 joint during asymmetrical lifting: Effects of different load trajectories and initial load positions. Clin. Biomech. 1995, 10, 128–136. [Google Scholar] [CrossRef]
  32. Marras, W.S.; Lavender, S.A.; Leurgans, S.E.; Rajulu, S.L.; Allread, S.W.G.; Fathallah, F.A.; Ferguson, S.A. The role of dynamic three-dimensional trunk motion in occupationally-related. Spine 1993, 18, 617–628. [Google Scholar] [CrossRef] [PubMed]
  33. Hodder, J.N.; Holmes, M.W.; Keir, P.J. Continuous assessment of work activities and posture in long-term care nurses. Ergonomics 2010, 53, 1097–1107. [Google Scholar] [CrossRef] [PubMed]
  34. ISO. 11228-1:2003 Ergonomics. Anthropometry and Biomechanics. Ergonomics—Manual Handling—Part 1: Lifting and Carrying; International Organization for Standardization: Geneva, Switzerland, 2003; p. 33. [Google Scholar]
Figure 1. Schematic of the experimental setup for obtaining the ground reaction force and motions. A block was used to ensure the caregiver and patient were on the same horizontal level.
Applsci 11 11622 g001
Figure 2. Transfer tasks with (a) a 15 kg dumbbell and (b) a patient. Point P represents the projection of the center of mass of the dumbbell. In the PT tasks, a mat was placed between the chair and the wheelchair to prevent the subject from falling on the ground. The mat also ensured the wheelchair and the chair aligned with the front plane and right-side plane, respectively.
Applsci 11 11622 g002
Figure 3. Trunk flexion angle θ represents the angle between the trunk vector at the stand-still posture and flexed posture, which starts from the first sacrum segment to the seventh cervical segment. The peak trunk angle, peak trunk angular velocity ( ω p ), and peak trunk angular acceleration ( α p ) are determined from Steps 1 to 3.
Applsci 11 11622 g003
Figure 4. Time lags of the peak CF and representative factors to the initiation ( t 1 ) in the PT tasks. The initiation timing of transfer is defined as the timing at the beginning of lifting which exhibits the lowest wrist speed ( v 1 ). The end timing of transfer is denoted by t 2 , at which the lowest wrist speed ( v 3 ) was observed. Wrist speed ( v ) is defined as the magnitude of the translation motion of the middle point between two left and right markers, each of which is attached to the corresponding wrist. Standing and recovery timings represented by t 0 and t 3 , respectively. v 2 represents the maximum wrist speed.
Applsci 11 11622 g004
Table 1. Maximum of the CF in the beginning of lifting and the end of lowering of the PT task (Mann-Whitney test shows p-value = 0.025).
ConditionsBeginning of LiftingEnd of Lowering
C F m a x   ( N ) 2141   ±   301 1968   ±   396
Table 2. Time lag t , normalized time lag φ % , and normalized time error (e   % ) of each factor.
Variables C F p θ p ω p α p G R F p H p
Mean 2141 ± 301 N 49 ± 6 ° 32 ± 6 ° / s 57 ± 7 ° / s 2 771 ± 84   N 57 ± 3 cm
t ( s) 0.65 ± 0.49 0.30 ± 0.28 0.97 ± 0.46 0.25 ± 0.22 1.33 ± 0.48 0.75 ± 0.66
φ % 15.5 ± 12.3 % 7.1 ± 7.0 % 23.1 ± 12 %5.9 ± 5.5 % 31.7 ± 12.0 % 17.9 ± 16.5 %
e % 0−8.4%+7.6%−10.5%+14.2%−2.4%
Table 3. The p-values of multiple comparisons (Kruskal-Wallis test and Dunn-Bonferroni correction) of φ for each parameter. The Kruskal-Wallis test shows p = 0.06, which rejects the hypothesis that φ of each parameter is the same.
φ o f C F p
%
φ o f θ p
%
φ o f ω p
%
φ o f α p
%
φ o f G R F p
%
φ o f H p
%
φ of C F p % 0.020.2570.0010.0011
φ of θ p % 0.00110.0010.006
φ of ω p % 0.0010.3220.634
φ of α p % 0.0010.001
φ   of G R F p % 0.001
φ of H p %
Table 4. Multicollinearity test for all factors.
FactorVIF
θ 1.17
ω 1.34
α 1.52
G R F 1.10
H 1.03
Table 5. Peak CF and time lag to the initiation timing of the transfer ( t 1 ) that are estimated for 3 DL patterns (15 kg dumbbell under com/t-e/e-t conditions).
ConditionsComt-ee-tMean
C F p D L lag (s)0.21 ± 0.170.31 ± 0.320.34 ± 0.380.29
C F p D L (N)2387 ± 3892451 ± 1542324 ± 2462387
Publisher’s Note: MDPI stays neutral with regard to jurisdictional claims in published maps and institutional affiliations.

