Article

Biochar Amended Soils and Water Systems: Investigation of Physical and Structural Properties

by
Giorgio Baiamonte
1,
Giuseppina Crescimanno
1,
Francesco Parrino
2 and
Claudio De Pasquale
1,*
1
Dipartimento di Scienze Agrarie, Forestali, Alimentari ed Ambientali, Università degli Studi di Palermo, Viale delle Scienze ed 4, 90128 Palermo, Italy
2
Dipartimento di Ingegneria Industriale, Università di Trento, Via Sommarive 9, 38123 Trento, Italy
*
Author to whom correspondence should be addressed.
Appl. Sci. 2021, 11(24), 12108; https://doi.org/10.3390/app112412108
Submission received: 19 November 2021 / Revised: 11 December 2021 / Accepted: 16 December 2021 / Published: 19 December 2021
(This article belongs to the Special Issue Novel Growing Media, Soilless Culture and Sustainable Agriculture)

Abstract

:
There are significant regional differences in the perception of the problems posed by global warming, water/food availability and waste treatment recycling procedures. The study illustrates the effect of application of a biochar (BC) from forest biomass waste, at a selected application rate, on water retention, plant available water (PAW), and structural properties of differently standard textured soils, classified as loamy sand, loam and clay. The results showed that soil water retention, PAW, and aggregate stability were significantly improved by BC application in the loamy sand, confirming that application of BC to this soil was certainly beneficial and increased the amount of macropores, storage pores and residual pores. In the loam, BC partially improved water retention, increasing macroporosity, but decreased the amount of micropores and improved aggregate stability and did not significantly increase the amount of PAW. In the clay, the amount of PAW was increased by BC, but water retention and aggregate stability were not improved by BC amendment. Results of the BET analysis indicated that the specific surface area (BET-SSA) increased in the three soils after BC application, showing a tendency of the BET-SSA to increase at increasing PAW. The results obtained indicated that the effects of BC application on the physical and structural properties of the three considered soils were different depending on the different soil textures with a BET-SSA increase of 950%, 489%, 156% for loamy sand, loam and clay soil respectively. The importance of analysing the effects of BC on soil water retention and PAW in terms of volumetric water contents, and not only in terms of gravimetric values, was also evidenced.

1. Introduction

Meeting increasing global demand for food in the context of constrained resources and changing climate means that our agricultural systems must be both more productive and resilient. From 2009 to 2020 FAO’s climate change portfolio has expanded and more than 300 programs and projects addressed the problems caused by climate variability and extremes in the agriculture sectors were developed in response to increasing demands [1]. Innovative tools are required to help deal with these complex challenges, which have increase interest in biochar as a potential soil amendment to improve soil quality and crop productivity [2].
Using thermal decomposition of plant-derived biomass in partial or total absence of oxygen it is possible to obtain biochar (BC). BC is a C-rich organic material characterized by a stability in soil environments has well known up to 1000 years [3,4]. Since the organic carbon produced in biochar is very stable, addition of BC to the soil has the potential to improve soil quality. Considering variations in key BC properties such as pH, electrical conductivity, bulk density, and surface area, those depending on the feedstocks and production conditions, BC increased soil pH and improved its electrical conductivity, aggregate stability, water retention, micronutrient contents and also sequester carbon, which is important for mitigation of excessive carbon dioxide in the atmosphere [5,6]. Scientific literature [7,8,9] fully revised the impacts of biochar amendments in soil. Yield crop increase has been demonstrated by the increasing of soil pH [10] nutrient use efficiency [11], and enhanced soil hydraulic properties [4,12] due to the BC application in different environments.
The use of BC to ameliorate soil physical properties has emerged after identifying its general high porosity [13] and large inner surface area [14]. The improved physical properties in BC amended soils have been related to the lower particle density of BC, compared to that of soil minerals, and to the prevalence of micro-pores [15,16]. BC can contribute to improving water storage in soil modifying a specific portion of the pore size distribution associated with aggregation and water storage in soil systems [17]. Porosity (P), soil water retention (SWR), and plant available water (PAW) are all fundamental soil physical properties and the latter, being the amount of water between the water content at the field capacity and at the wilting point, can be improved.
BC physico-chemical properties delineate its structural influence on the soil and are related to the feedstock material and pyrolysis thermal parameters like as final pyrolysis temperature and heat rate ramps [18,19,20]. BC produced by using high pyrolysis temperature (≥500 °C) is more expected to increase soil physical properties considering the higher aromaticity, surface area, pH, and ash contents [21,22,23]. Lower pyrolysis temperature (<500 °C) during the BC production will contribute to the changes of nutrient status and bioavailability in soil systems [21,23,24].
Overall, most of the improvements of biochar-amended soils principally depend on the modifications of pore configuration, aggregate and surface properties in the amended biological systems [25,26,27,28]. Given the high stability of BC in soils [29], long-term effects are expected in the context of soil water holding capacity and other physical properties. However, BC amelioration effects on soils can vary depending on soil C content [30], on soil textural differences [31], as well as on the rate of amendment.
BC amendment has been found to improve the amount of PAW in coarse textured soils [31], or in soils with large amounts of macropores [22,28]. Baiamonte et al. [31] reported positive effects of a biochar from forest biomass, pyrolyzed at 450 °C, on the soil retention and structural properties of a desert sandy soil, indicating that BC significantly decreased bulk density, improved water retention, and increased the amount of PAW of the BC amended sand, by increasing the amount of storage pores. They also found that BC improved soil aggregate stability [32], and the specific surface (BET-SSA) of the BC amended soil.
With reference to medium and/or to fine textured soils (i.e., soil containing clay), mixed and sometimes contrasting effects of BC on soil-water retention, on the amount of PAW and on soil hydraulic conductivity have been published.
Burrell et al. [33] compared the effect of BC on three differently textured soils, i.e., a sandy-loam, a silt-loam and a clay loam. They found that BC had a clear positive effect on the PAW only for the sandy soil, concluding that sandy soils have the most to gain from BC amendment, as previously suggested also by Jeffery et al. [34]. Ouyang et al. [35] found that BC applications increased the saturated water content and decreased the residual water content of a silty clay soil and of a sandy loam soil, indicating that BC increased macroporosity and decreased microporosity. Baiamonte et al. [36] recognized that BC improved aggregate stability and water retention of a sandy-clay soil, increasing inter-aggregate porosity at the highest application rates. Sun and Lu [27] reported significant positive changes in aggregate stability, water retention and pore-size distribution after addition of biochar to a clay soil, but only at the larger BC dose (90–135 tons ha−1). Instead, Castellini et al. [37] did not find clear positive effects of BC on soil hydraulic conductivity of a clay soil and showed that significant increases of soil water retention were detected only close to water saturation (0 < |h| < 10 cm) and only at the highest BC concentration. Herath et al. [38] also reported almost non-significant increases in the PAW of a silt-loam amended with BC. Obia et al. [39] also found non-significant effects of BC on field capacity and PAW of a heavy clay soil.
A comparison between the different research results is difficult because different soils, different BC and different BC application rates have been used in published papers. The analysis above shows that contrasting results on the effect of BC on the physical and structural soil properties have been found, thus this issue needs to be further investigated.
The objective of this study was to investigate the effects of amending three differently standard textured soils (LUFA) classified as loamy sand, loam and clay, with a BC from forest biomass waste produced in Italy, pyrolyzed at 450 °C, having distinct soil physical and chemical properties. The effects of BC, at a selected application rate (fBC = 0.091), on soil water retention, plant available water (PAW), aggregate stability, and specific surface area (BET-SSA) of the soil-BC mixtures were evaluated.

2. Materials and Methods

2.1. Physical and Chemical Characteristics of Soils and Biochar

Three standard soils from LUFA Speyer (Germany) were used for the experiments. These soils are natural standard soils of from selected areas in Germany, which have been under agricultural use but without the application of pesticides, biocidal fertilizers, or organic manure for at least 5 years before being sampled. This makes these soils suitable to attribute the effect of different amendments, such as BC, to soil texture, and for future investigation aimed at testing the effects of different BCs on the soil physical and structural properties.
The soils were stored at 4 °C to prevent microbial activity. A pyrolysis temperature of 450 °C for 48 h was used to produce BC derived from waste biomass forest material mechanically chipping trunks and large branches of Abies alba M., Larix decidua Mill., Picea excelsa L., Pinus nigra A. and Pinus sylvestris L. This BC was selected because of the wide distribution of forest trees and the subsequent availability of forest waste in Italy [31]. The main chemical characteristics of the tested biochar (BC) are reported in Table 1 and also the three considered soils, classified as loamy sand (2.1), loam (3A) and clay (6S), according to USDA [40].

2.2. Soil-Biochar Samples Preparation

Air-dried soil, Ps (g), crushed to pass a 2 mm sieve, with a selected amount of biochar, PBC (g) were mixed to prepare soil-biochar samples, and packed at the bulk density values, ρb, reported in Table 1. A biochar fraction, fBC, equal to 0.091, equivalent to 91 g/Kg, was selected to carry out the measurements, with fBC defined as:
f B C = P B C P s + P B C
Soil samples of 5 cm diameter and 4.5 cm height were used for the pressure plate measurements. For the sample bulk volume (Vb) of 88.4 cm3, the Ps value corresponding to the fixed fBC was determined as:
P s = ρ b , s ρ b , B C V b ( 1 f B C ) ρ b , s f B C + ρ b , B C ( 1 f B C )
where the dry soil bulk density and the dry biochar bulk density are respectively ρb,s and ρb,BC. The soil-BC mixtures were denoted as loamy sand + BC, loam + BC and clay + BC.

2.3. Soil-Water Retention, Plant Available Water, and Aggregate Stability

Three replicated air-dried soil samples for each soil and for the chosen BC rate, prepared as described above, were placed in stainless steel rings (5 cm diameter, 4.5 cm height, 88.4 cm3 volume) and saturated, placed into the pressure plate apparatus [41], and then subjected to pneumatic potentials equal to 10.2, 102, 337, 1020, 3059 and 15,296 cm.
The weight of the soil samples was determined at each equilibrium pressure and the sample height was also measured to check if shrinkage occurred at increasing pressure head, |h|, during the experiments in the pressure-plate apparatus [42].
U (g/g) and |h|, corresponding respectively to the gravimetric water contents and pressure heads at equilibrium with the pneumatic potentials, were determined as:
U = W w W d W d
Volumetric water content, θ (cm3/cm3), was determined considering the wet soil sample, Ww (g), and the weight of the dry soil sample, Wd (g):
θ = W w W d W d ρ b ρ w = U ρ b ρ w
where ρb (g/cm3) is the soil dry bulk density and ρw (g/cm3) is density of water. Plant available water, PAW (cm3/cm3), was calculated as:
PAW = ( θ f c θ w p )
PAW was also calculated as the difference between the gravimetric field capacity and wilting point, and indicated as PAWU (g/g), where θfc is field capacity (cm3/cm3), i.e., the θ value measured at |h| = 336 cm, and θwp (cm3/cm3) is the wilting point, i.e., the θ value measured at |h| = 15,296 cm. The two-tailed t-test was used to test the significance of differences between treatment means, and for the separation of the means a least significant difference test (significance level p = 0.05) was used.
The van Genuchten (VG) retention function [43]:
U = U r + U s U r ( 1 + ( α | h | ) n ) m
the (U, |h|) experimental pairs was fitted by using in Equation (6) in which the saturated water content (g/g) is Us, the residual water content (g/g) is Ur, the pressure head (cm) is |h|, and the empirical parameters are expressed by α (cm−1), n, and m = 1 − 1/n [36]. The RETC code was used to estimate the VG parameters Us, Ur, α and n [44].
The pore diameter, D (μm), corresponding to (|h|) (kPa), was estimated according to the Young-Laplace equation [37], which restrictively agrees with the assumption that pores are perfectly cylindrical, uniform and equally drained, as D = 300/|h|.
The differential water capacity curve was provided by the van Genuchten first derivative retention function that whose maximum is centred on the pressure head value associated to the modal suction, |τd|, and to the most common pore size diameter, D(τd):
d U d h = α ( U s U r ) ( 1 n ) ( α | h | ) n 1 ( 1 + ( α | h | ) n ) ( 1 + m )
Moreover, |τd| (cm), represented as modal suction, was determined per Baiamonte et al. [36]:
| τ d | = 1 α ( n 1 1 + m n ) 1 / n
The soil structural index (SI, g/g cm−1) was calculated per Collis-George and Figueroa [45]:
SI = Δ U g | τ d |
where ΔUg (g/g) is the volume of drainable pores, calculated as Us − Ur.

2.4. BET Analysis and Adsorption/Desorption Isotherms of N2

The oven-dried soil-BC samples, previously subjected to the water retention measurements, were used to evaluate the adsorption of nitrogen by a Micromeritics ASAP 2020 (Norcross, GA, USA) apparatus. High-purity grade silica gel, purchased by Sigma-Aldrich (MI, Italy), was used to carry out the instrument calibration procedure. 0.5 g of each sample were degassed below to a pressure of 1.3 Pa at 473 K prior to the measurement procedure. The physisorption of nitrogen measurements was performed at 77 K.
The amount of the adsorbed N2, q, was considered as a function of relative pressure according to Brunauer et al. [46]:
q = q m ( C ( p p 0 ) [ 1 p p 0 + C ( p p 0 ) ] [ 1 ( p p 0 ) ] )
where the BET monolayer capacity is qm values and the dimensionless BET parameter are represented by C values, calculated by the ratio between the adsorption constants of the first and second and further layers, E1 and E2, respectively. Moreover, the gas pressure is p and the gas saturation pressure is p0. Therefore, the interval of 0.05–0.33, relative pressure (p/p0,) was used for the interpretation isotherm data [47]. The BET-SSA (m2 g−1), specific surface area, was also calculated:
BET - SSA = q m ρ S T P v a p N A A c s M N 2
where the density of nitrogen vapour at standard temperature and pressure is (STP), the Avogadro’s constant is NA, the molar mass of N2 is MN2, and the cross-sectional area of a nitrogen molecule is ACS. All measurements were performed by assuming a current standard value of ACS equal to 0.162 nm2 [47].

3. Results and Discussion

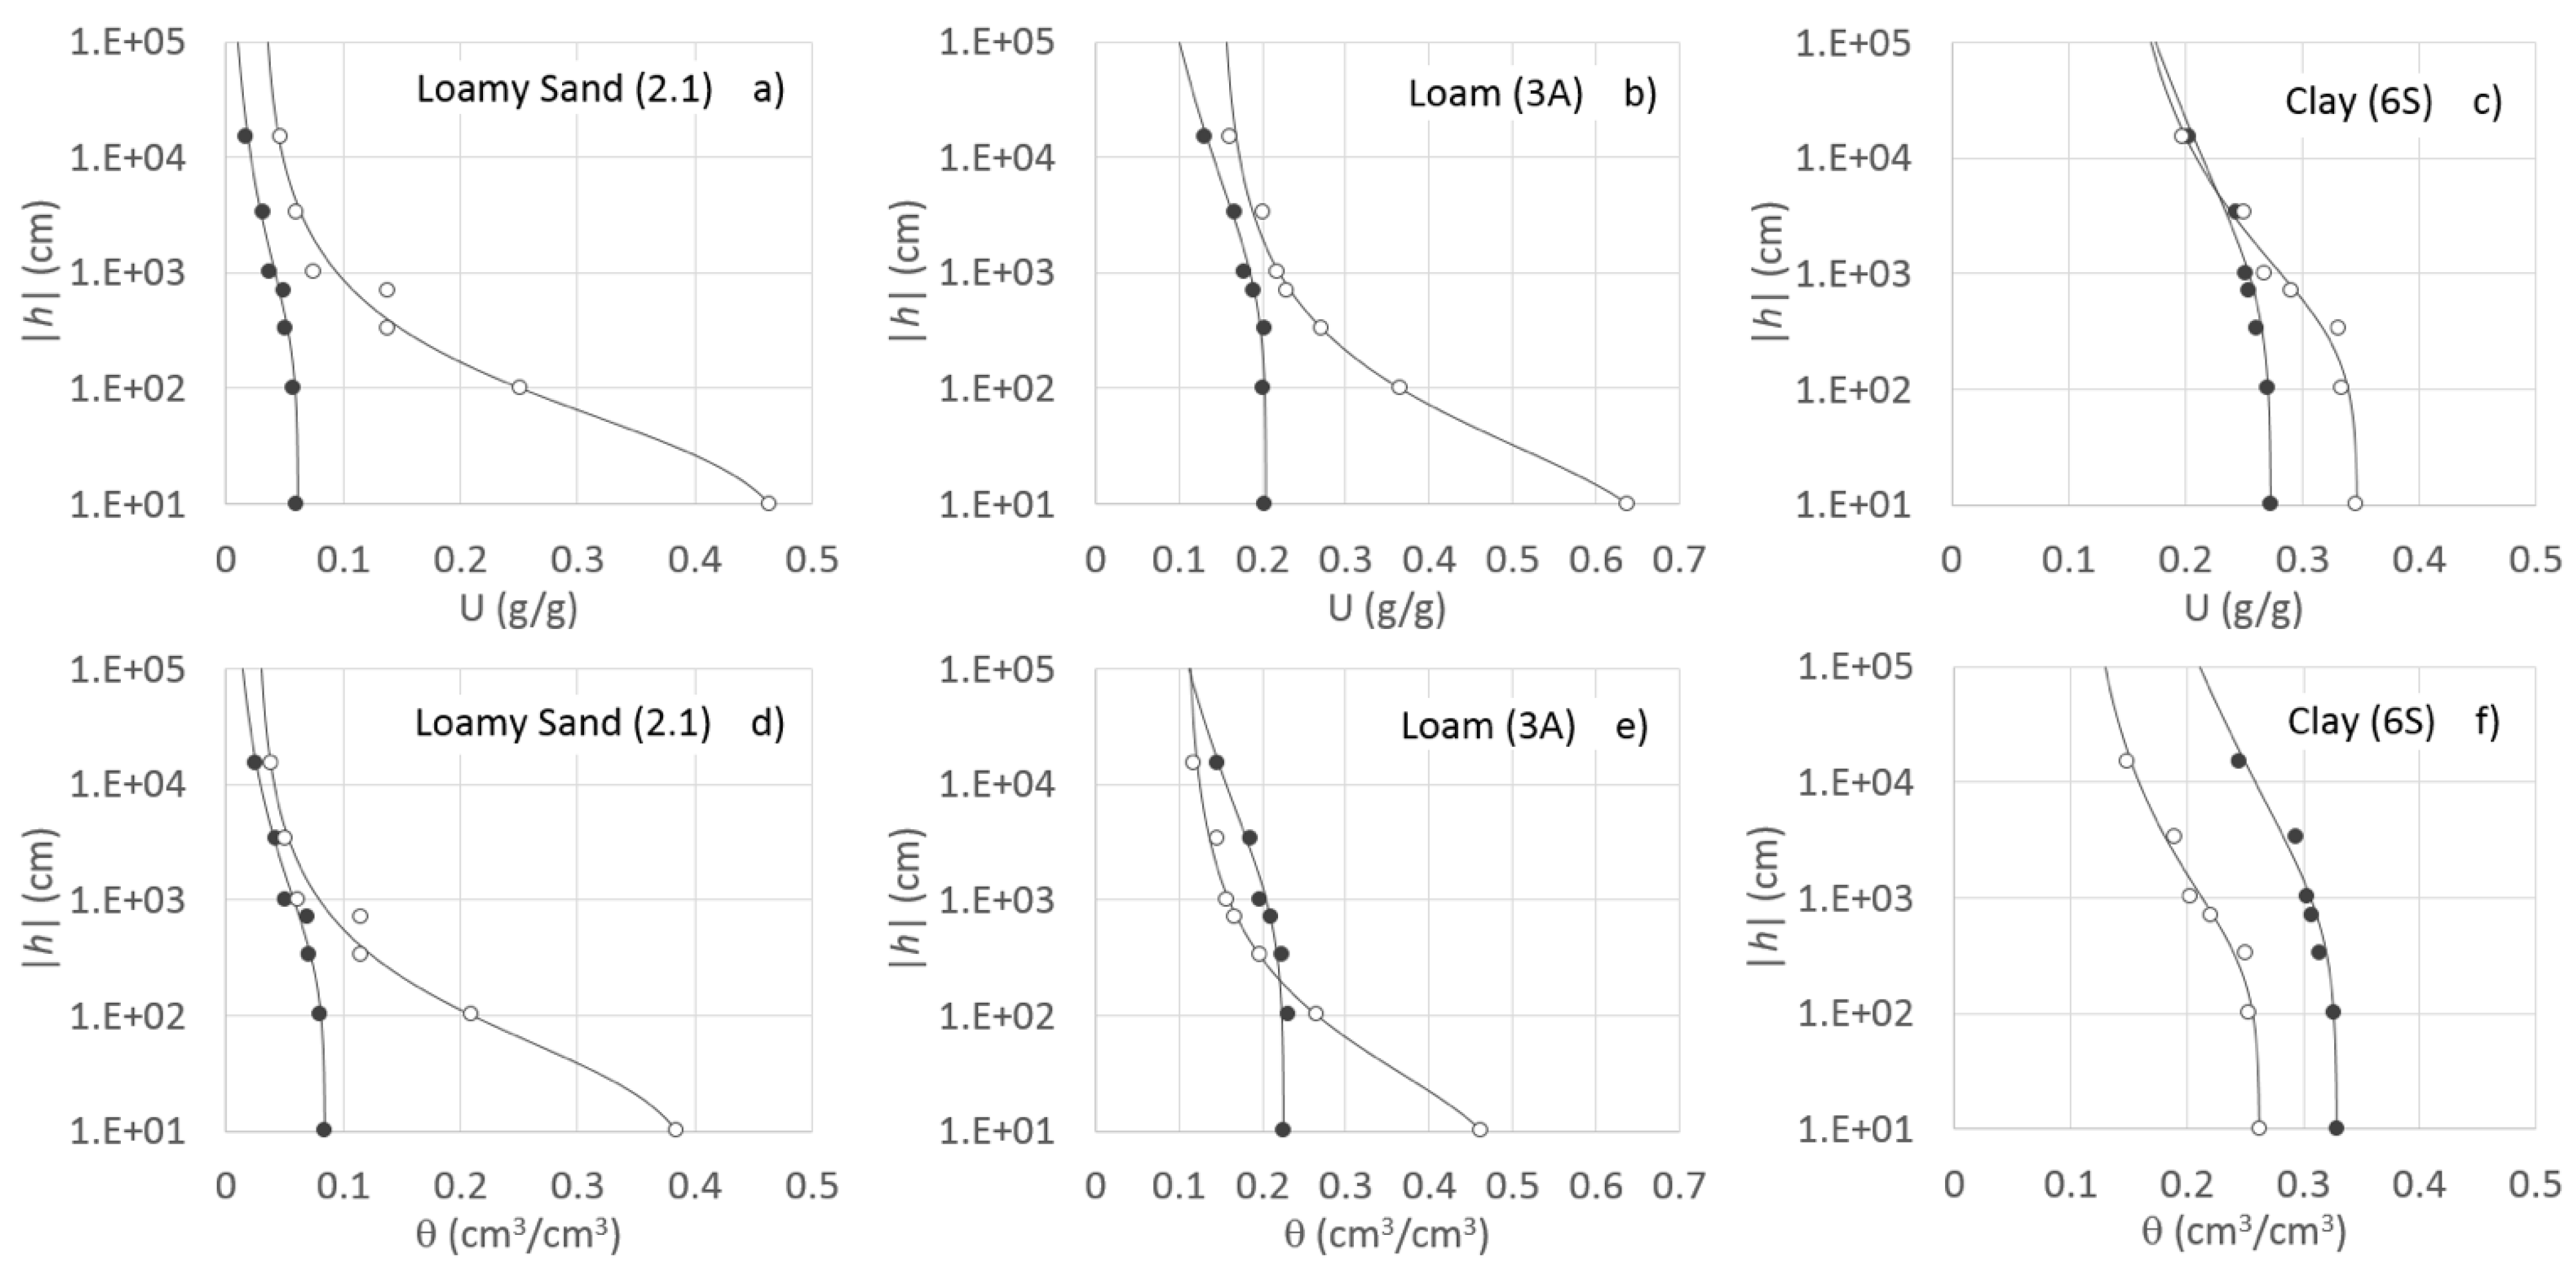
3.1. Bulk Density, Soil Water Retention and Plant Available Water

The U value measured at the considered |h| values increased when BC was added to the three soils, with the differences being significantly different (p < 0.05), except for the U values measured for the clay soil at |h| ≥ 1020 cm. The average gravimetric water contents, U (g/g), corresponding to the applied pressure head values, |h|, for the soils loamy sand, loamy sand + BC, loam, loam + BC, clay and clay + BC has been evaluated (Table 2).
For the three soils, BC significantly increased both the water content at saturation (Us) and the residual water content (Ur), also increasing α and n. The Mualem-van Genucthen parameters obtained by fitting Equation (6) to the (U, |h|) pairs of the three BC-amended and non-amended soils were considered to explain the BC activities (Table 3).
PAWU (g/g) significantly increased from 0.033 to 0.092 for the loamy sand, from 0.0705 to 0.109 for the loam and from 0.0573 to 0.133 for the clay, after BC application (Table 4). Differences (%) between the PAW measured in the BC amended soils and in the original soils were equal to 178%, 54.7% and 131.6% for the loamy sand, loam and clay respectively, showing that the effect of BC was in the order loamy sand > clay > loam. The bulk density, ρb obtained for the non-amended and for the BC amended soils shows has the values of bulk density is a multivariate parameter affect by the mineral and organic material in which no linear definition is considerable (Table 4). The lower bulk densities in clay + BC originate from mixing the lower density material in the clayey soil, is consistent with a no significant changes in aggregate structure. The phenomenon has been previously reported in a field study conducted by Sonnie et al. [48] on clay soil also by using forest biomass BC. Therefore, appear more considerable from the reported laboratory experiment result that demonstrate as changes in the soil’s physical properties due to BC addition depend on soil type, instead of BC’s capacity to store water in its internal structure is immutable parameter.
The ρb measured for the BC, equal to 0.173 g/cm3 (Table 1) was considerably lower than that measured in the non-amended soils, equal to 1.38 g/cm3, 1.11 g/cm3 and 1.20 g/cm3 for the loamy sand, for the loam and for the clay, respectively. As a consequence of BC addition, ρβ (g/cm3) significantly decreased from 1.38 to 0.828 in the loamy sand + BC, from 1.11 to 0.726 in the loam + BC, and from 1.208 to 0.757 in the clay + BC, with ratios equal to 1.67, 1.53 and 1.60, respectively, between the ρβ of the non-amended soils and the ρβ of the BC-amended soils.
The decrease in ρβ due to BC application [47] agrees with the results of previous investigations [31,49,50,51], and it is due to a mixing or dilution effect [51] determined by the difference between the ρβ of the non-amended soils and of BC.
The soil water retention curves, expressed as |h| vs. the gravimetric water content U (g/g), evidencing that the considered standard soils were characterized by a very poor water retention before BC application (Figure 1a–c).
Soil water retention curves represented as |h| vs. θ were also represented (Figure 1d–f). Since the measured soil shrinkage was negligible both in the BC amended soils and in the soils without BC, constant ρβ values (Table 4) were used to convert U into θ (Equation (4)). The θ values of the loamy sand + BC retention curve were systematically higher than those obtained for the loamy sand, with significant differences in the θ values that increased at the lowest |h| and at saturation (Figure 1d). This indicated that BC improved the soil water retention at all the considered |h|.
Instead, the θ values of the loam + BC retention curve (Figure 1e) were lower than those obtained for the loam, except for the θ values measured at |h| > 180 cm as well as for θs, (Table 4), indicating an increase in the amount of macropores, and a decrease in the amount of micropores. This result indicated a partial improvement in the retention properties of the loam after BC addition.
The θ values of the clay + BC (Figure 1f) were significantly lower than those obtained for the clay, indicating a non-positive effect of BC, due to formation of a larger number of aggregates or particles leading to smaller inter-aggregate pores than the original ones. Also, the saturated water content, θs obtained for the clay + BC was significantly lower than that obtained for the clay, indicating a decrease in the amount of macropores.
Comparing the θ and the U values measured at the fixed |h|, (Figure 1) it appears evident that for the clay, the U values measured after BC addition were higher than those measured before BC addition (Figure 1c), but the opposite was found in terms of θ values (Figure 1f).
The loam shows the same trend, except for the θ values at |h| ≤ 180 cm (Figure 1b,e). The loamy sand, instead, the same behaviour can be observed between the U(h) and the θ(h) functions before and after BC addition (Figure 1a,d), with both the pairs (U, h) and (θ, h) increasing after BC addition, mainly near the low matric potentials (|h|).
Reductions in the dry bulk density, ρβ, of the soil + BC mixtures, obtained for the loamy sand, for the loam and for the clay, expressed as ratios ρb,soil/ρb,soil+BC, were equal to 1.67, 1.53 and 1.60, respectively.
However, the ρb reduction did not determine an increase the θ values in the BC-amended loam (except for the θ values at |h| ≤ 180 cm) and in the BC-amended clay, compared to the increase observed on the U values, because for these two soils the ratios Usoil+BC/Usoil (average ratio Usoil+BC/Usoil = 1.33 for the loam and 1.11 for the clay) were lower than the ratios ρb,soil/ρb,soil+BC. (1.53 and 1.60). Instead, for the loamy sand, the ratio Usoil+BC/Usoil was higher (average ratio = 2.73) than the ratio ρb,soil/ρb,soil+BC, (1.67), and therefore the θ values obtained after BC addition were higher than those measured in the non-amended loamy sand. This explains why BC had the effect of increasing the θ values in the loamy sand, whereas θ values lower than those obtained before BC addition were obtained for the clay and, partially, for the loam.
This suggests that in clay soils higher BC amounts might improve the soil water retention [29] by determining Usoil+BC/Usoil ratios higher than the ρb,soil/ρb,soil+BC, and positive differences between the θ values of the BC-amended soils and the θ of the soils without BC.
Herath et al. [38] also reported more evident effects of BC on the total soil porosity when a higher difference occurred between the ρb of BC and the ρb of the soil. This suggests that an excessive reduction in the ρb of the soil mixtures is not always beneficial in terms of water retention, confirming that positive effects of BC application are to be expected in soils having high initial ρb values, such as the coarse textures soils, and not in soils with lower initial ρb, such as the fine textured ones.
In conclusion, BC certainly improved water retention of the loamy sand, confirming the results of previous investigations on coarse textured soils [31,33,34] partially improved water retention of the loam, increasing macroporosity, as also reported by Ouyang et al. [27], but did not determine positive effects on water retention of the clay soil, as also found in previous investigations [22,37,38].
The differences obtained in our soil water retention curves obtained before and after BC addition by expressing the soil water content in terms of U or in terms of θ values, also explain why some contrasting results have been found when the effect of BC on fine textured soils has been investigated. Of the previously mentioned papers, those reporting positive effect of BC based their conclusions considering the measured U values [19,28], whereas those reporting no effects, or negative BC effects, based their analyses and conclusions considering the θ values [36,37,38,39].
Both θfc and θwp significantly increased in the loamy sand, but significantly decreased in the loam and in the clay after BC addition. Values of the saturated water content, θs, the measured field capacity, θfc, the measured wilting point, θwp, obtained for the three soils amended and not amended with BC, are reported in Table 4.
D values (μm) pore diameter corresponding to the |h| values at which θfc and θwp were measured, i.e., |h| = 330 cm and 15,300 cm, respectively, were equal to 9.09 μm and 0.2 μm. The amount of pores with D = 9.09 μm was classified as storage pores (0.5–50 μm), and the amount of pores with D = 0.2 μm, called residual pores (D < 0.5 μm) [52] increased after BC application in the loamy sand, but decreased in the loam + BC as well as in the clay + BC. The amount of pores corresponding to θs, indicated as macropores, significantly increased in the loamy sand + BC and in the loam + BC, but decreased in the clay + BC.
Plant available water, PAW (cm3/cm3), calculated on the basis of the θ values reported in significantly increased from 0.046 to 0.076 for the loamy sand + BC, non-significantly increased from 0.078 to 0.079 in the loam + BC, and significantly increased from 0.069 to 0.104 in the clay + BC (Table 4). The increase in PAW was equal to 66.1% and to 45.7% for the loamy sand and for the clay, respectively. These results indicated that BC positively affected the PAW of the loamy sand and of the clay but did not determine any significant increase in the PAW of the loam.
PAW values, calculated based on the θ values, were lower than those obtained on the basis of the U values, PAWU (Table 4), as a consequence of the reduced ρb in the soils + BC mixtures, but the trend was the same, with the highest increment in the PAW values obtained for loamy sand + BC, followed by the increment observed on the clay + BC. Instead, in the loam + BC, there was a non-significant increase in the PAW, expressed based on θ, compared to the previously found significant increase obtained by considering the U values.
This means that in some cases analysis of the effect of BC on PAW might lead to different conclusions if carried out using the U or the θ values and could not be in agreement with the results obtained in terms of water retention curve. For the clay soil, our results indicated an increase in the PAW, even if the θ(h) functions obtained on the clay + BC mixture showed a decrease in the θ values, at fixed h, a decrease in the pore-size, as well as a reduction in the macroporosity, expressed by θs.
Considering applications related to irrigation scheduling, in the loamy sand and in the clay soil the increased PAW may be important to the enhancement of plant productivity as well as to the reduction of irrigation amounts and/or frequency, while no improvements are to be expected for the loam in terms of irrigation scheduling. However, applications carried out with physically based models considering soil water retention and hydraulic conductivity [52,53] should be carried out to evaluate how the hydraulic characteristics of the three soils after BC addition would affect water flow and crop water uptake, with effects on irrigation scheduling that could be quantified by simulating management scenarios [54,55].

3.2. Aggregate Stability Index

Volume of drainable pores, ΔUg, the modal suction, |τd|, and the SI values obtained for the three BC amended and non-amended soils. ΔUg significantly increased in the loamy sand + BC and in loam + BC compared to the soils without BC but decreased in the clay + BC compared to the clay (Table 5).
The modal suction, |τd|, describing the water potential corresponding to the liquid constrained in the most common pore size diameter, significantly decreased in the loamy sand + BC and in the loam + BC soil, indicating an increase in the most frequent pore diameter, D, and thus a pores’ enlargement, but significantly increased in the clay + BC, indicating a reduction in the most frequent D.
Compared to the original soils, the SI values increased by about 60 times in both the loamy sand + BC and the loam + BC, but decreased by 0.48 times for the clay + BC, indicating an improvement in the aggregate stability condition for the loamy sand and for the loam, but not for the clay.
The diameter, D (μm), corresponding to |τd|, increased from 25 to 200 for the loamy sand, and from 20 to 433 for the loam and, according to the Greenland classification, shifted from the range of storage pores (0.5 μm < D < 50 μm) to the range of transmission pores (D ≥ 50 μm), showing that BC induced formation of water stable macro-aggregates, which stored more water than small aggregates, as also shown by the increased ΔUg. Similar results were reported by Baiamonte et al. and by Herath et al. [31,38], for a desert sandy soil. Instead, for the clay, D (μm) decreased from 39 to 24, falling in the range of storage pores, and indicating that BC induced formation of aggregates characterized by smaller inter-aggregate pores than in the original soil, as also shown by the decreased ΔUg.
These results indicated that BC did not improve the aggregate stability condition of the clay soil, appearing consistent with those obtained by analysing the θ(h) functions obtained before and after BC addition.

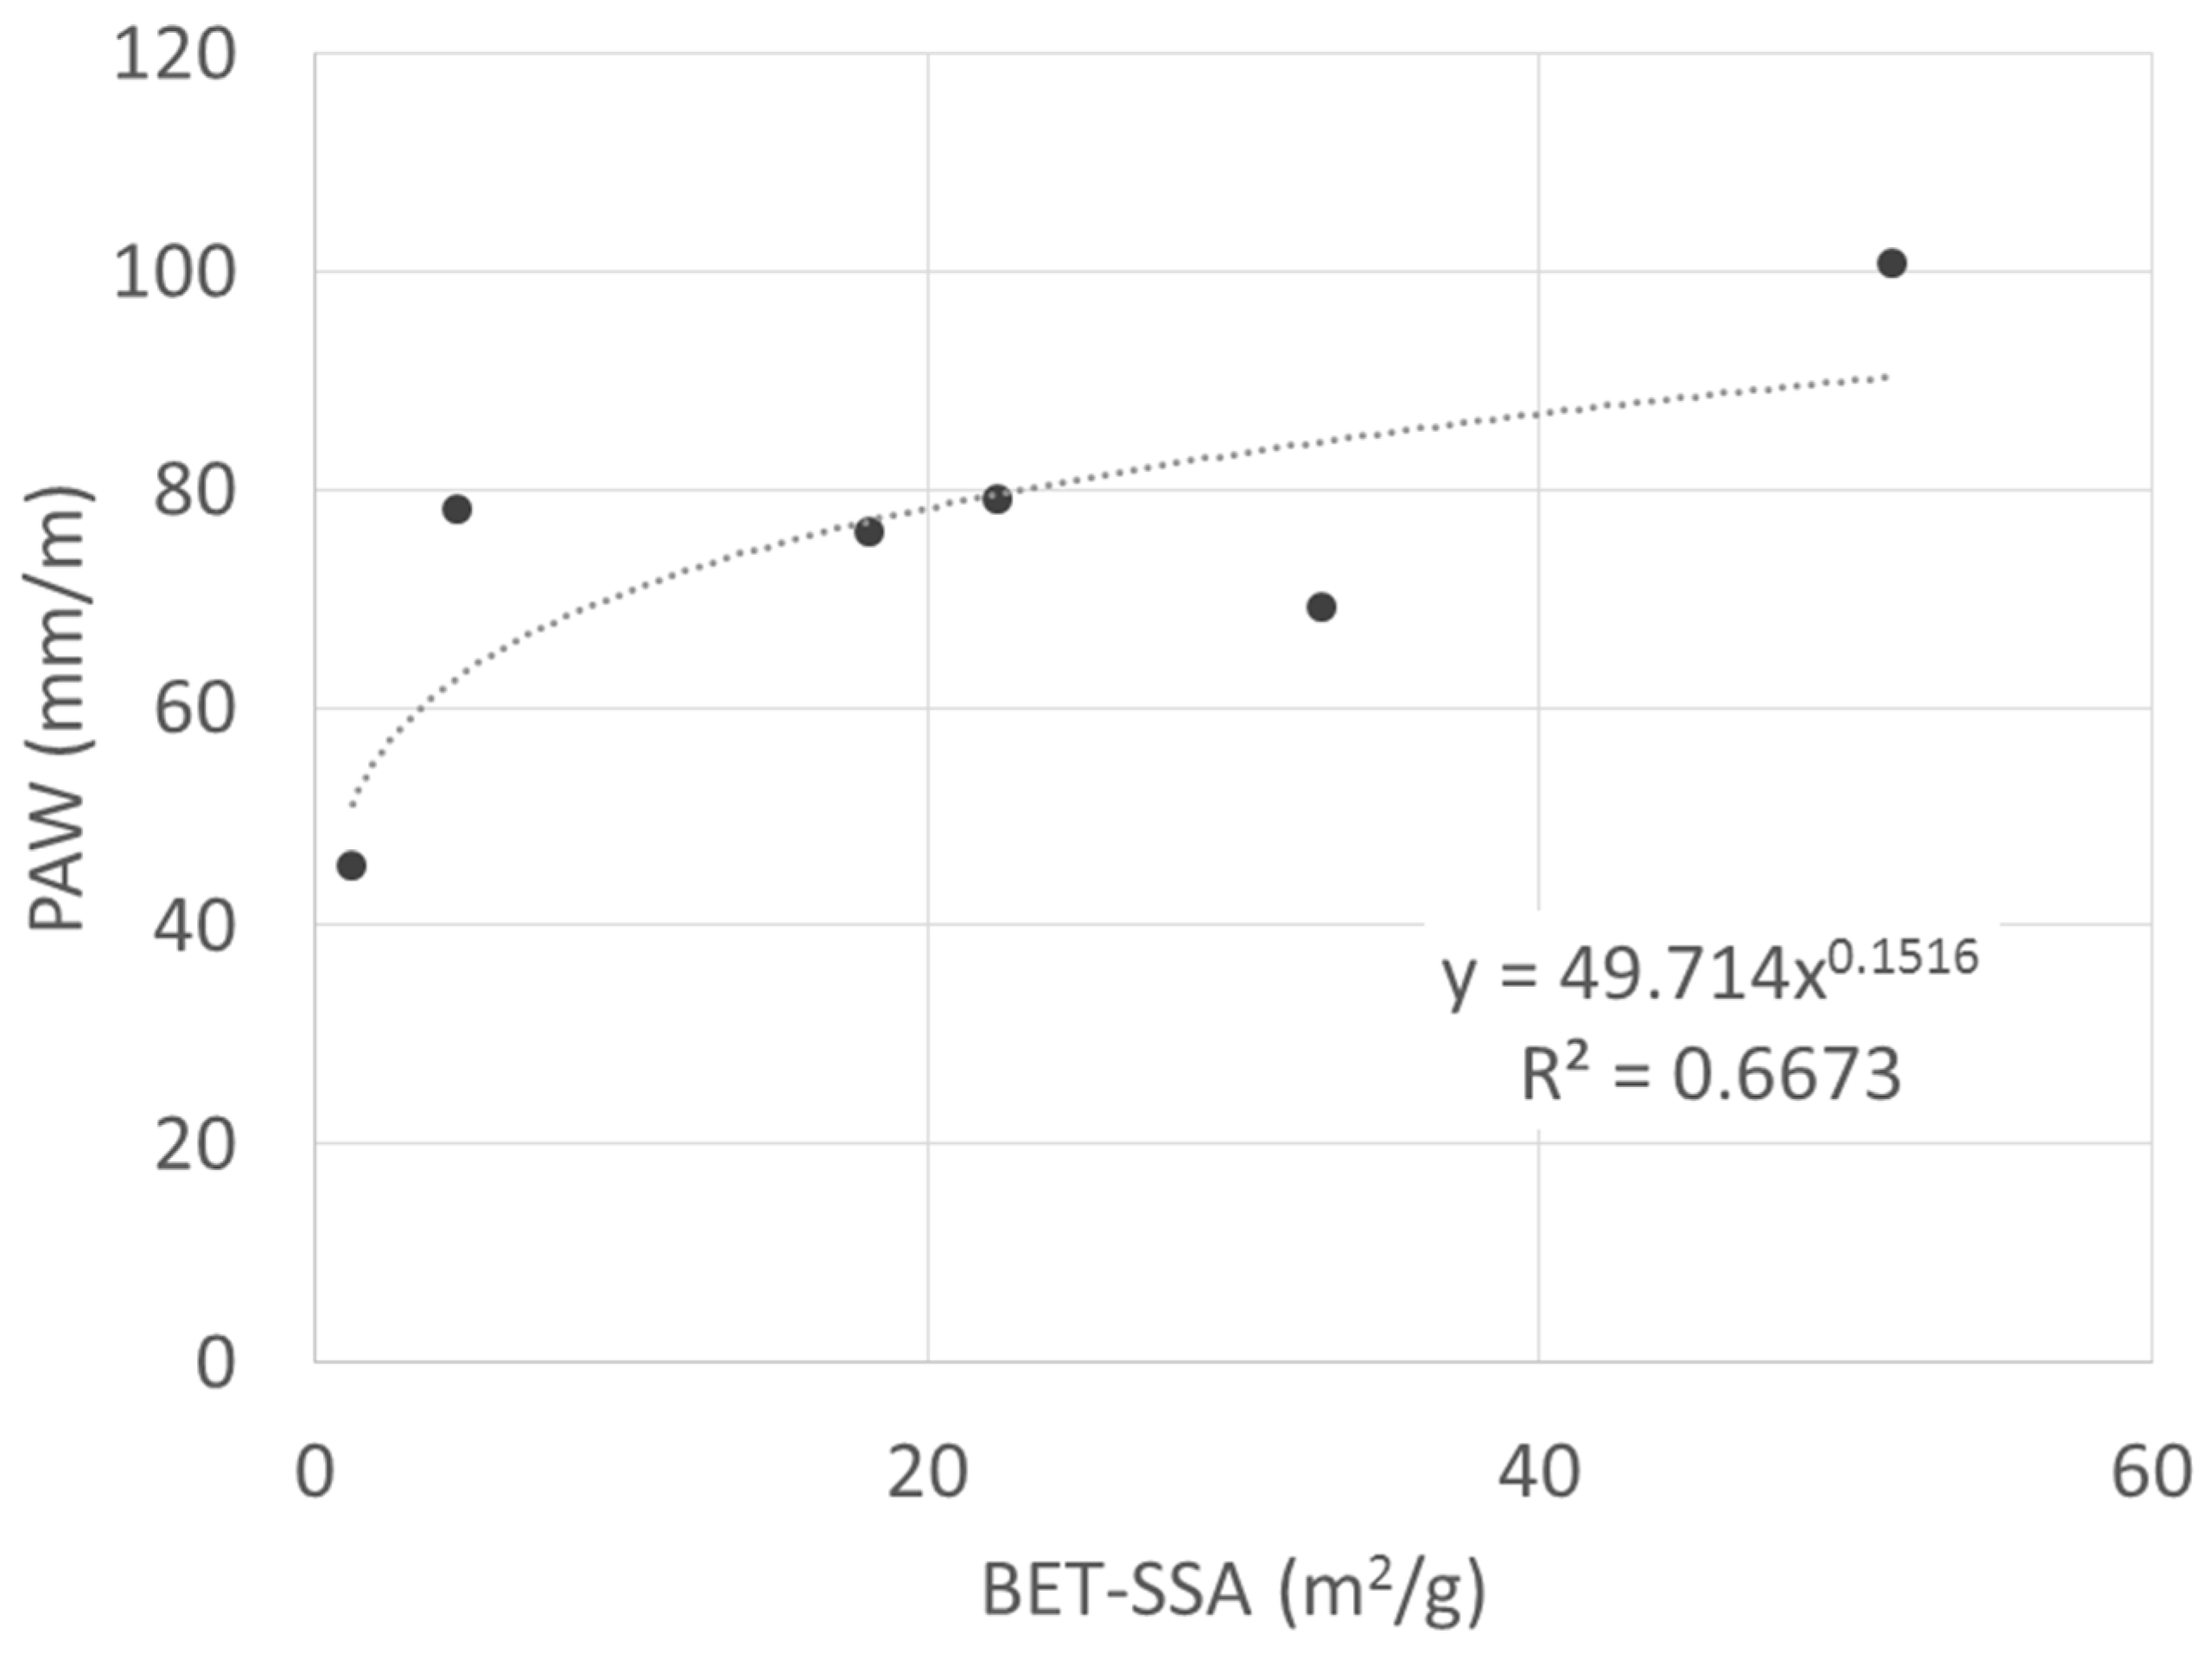
3.3. Specific Surface Area (BET-SSA)

Values of total specific surface area (BET-SSA), obtained per Equation (11) for the loamy sand, for the loam and for the clay soils and for the soils amended with BC was also considered (Table 6).
The BET-SSA (m2/g) obtained for the loamy sand, for the loam and for the clay increased with the increasing clay percentage and decreasing size of particles, with values equal to 1.19, 4.6 and 32.89, respectively. The BET-SSA values of the non-amended soils were consistent with ranges of specific surface areas for soils belonging to different textural classes [51] and showed a satisfactory agreement with the BET-SSA values reported by Leao and Tuller [56] for soils with different textures. The BET-SSA obtained for the sole BC was equal to 280.7 m2/g, agreed with that reported by Uras et al. [57] for one of their considered BC, and was close to that (244.0 m2/g) measured by Ajayi and Horn [58]. The SSA obtained by the BET analysis can be considered reliable, because the technique seems capable of yielding sensible estimates of SSA when applied to nitrogen sorption by systems in which there are few micropores, i.e., <0.002 um [59]. These micropores are out of the range of pore diameters explored in the soil water retention, as matric potentials lower than −15 bar (wilting point) are not considered.
The BET-SSA (m2/g) increased for the three BC amended soils up to 18.1, 22.5 and 51.4, becoming 15.2, 4.8 and 1.6 times higher than those measured in the original loamy sand, loam and clay soils, respectively. These results demonstrated that in terms of specific surface area, the highest effect of BC was detected on the loamy sand, and the minimum effect was on the clay, with the loam in between. Increases in the BET-SSA due to BC addition to a fine sand and to a sandy loam were also reported by Ajayi and Horn [47].
These results were consistent with those obtained in terms of aggregate stability and of water retention, which indicated an improvement due to BC addition in the order sandy loam > loam> clay. However, an increase in the BET-SSA, although slighter than that in the loamy sand and in loam, was observed in the clay soil that was consistent with the increase in the PAW. Figure 2 shows the tendency of the PAW to increase at increasing BET-SSA. Although referred to different textured soils and to different measurement techniques, a dependency can be recognized between the measured PAW and the measured total BET-SAA, as previously found by Baiamonte et al. [31] for a desert sandy soil.

4. Conclusions

The selected biochar (BC), obtained in Italy from forest biomass waste material, improved the quality of soil classified as loamy sand, by considering water retention increase, plant available water (PAW), aggregate stability (SI), and specific surface area (BET-SSA). Macropores, mesopores and micropores were increased by BC in the loamy sand. Instead, BC partially improved the soil physical properties of the loam, increasing the amount of macropores as well as the aggregate stability condition, but decreasing the amount of micropores, and did not determine any significant increase in the amount of PAW. With reference to the clay, BC did not determine any improvement in the soil water retention, expressed in terms of volumetric water contents, determining a reduction in the amount of macropores, mesopores and micropores probably from the hash deposited by the BC that reduced the pore space and volume. BC did not improve the aggregate stability condition, but increased the amount of PAW, expressed in terms of volumetric field capacity and wilting point. The measured surface area, BET-SSA, was increased by BC application, with more evident effects in the loamy sand and in the loam than in the clay [57]. A tendency of the measured BET-SSA values to increase at increasing PAW was found. This investigation confirmed that BC modified the pores configuration, affecting water retention, aggregate and surface properties of soil, but with different effects, related to the different soil textures. The results also demonstrate as the BC application and interaction with soil have significant effects of hydraulic parameters due to the structural change of the mixture. Nevertheless, the effects of biochar amendment require additional research by considering other variations of soil parameters and BC nature, also in view of environmental holistic considerations of world circular economy implementation.

Author Contributions

Conceptualization, G.B., G.C., C.D.P., methodology, G.B., G.C., C.D.P. and F.P.; data analysis, G.B. and C.D.P.; writing—original draft preparation, G.B., G.C., C.D.P.; writing—review and editing, G.B., G.C., C.D.P. and F.P.; supervision, G.B., G.C., C.D.P. All authors have read and agreed to the published version of the manuscript.

Funding

This research received no external funding.

Institutional Review Board Statement

Not applicable.

Informed Consent Statement

Not applicable.

Data Availability Statement

Not applicable.

Conflicts of Interest

The authors declare no conflict of interest.

References

  1. Shukla, P.R.; Skea, J.; Calvo Buendia, E.; Masson-Delmotte, V.; Pörtner, H.-O.; Roberts, D.C.; Zhai, P.; Slade, R.; Connors, S.; van Diemen, R.; et al. Climate Change and Land: An IPCC Special Report on Climate Change, Desertification, Land Degradation, Sustainable Land Management, Food Security, and Greenhouse Gas Fluxes in Terrestrial Ecosystems; Intergovernmental Panel on Climate Change (IPCC); IPCC: Geneva, Switzerland, 2019. [Google Scholar]
  2. Lehmann, J.; Gaunt, J.; Rondon, M. Bio-char sequestration in terrestrial ecosystems—A review. Mitig. Adapt. Strateg. Glob. Chang. 2006, 11, 403–427. [Google Scholar] [CrossRef]
  3. Sohi, S.P.; Krull, E.; Lopez-Capel, E.; Bol, R. A review of biochar and its use and function in soil. Adv. Agron. 2010, 105, 47–82. [Google Scholar]
  4. Kamalia, M.; Sweygersa, N.; Salemb, S.A.; Appelsa, L.; Aminabhavic, T.M.; Dewila, R. Biochar for soil applications-sustainability aspects, challenges and future prospects. Chem. Eng. J. 2022, 428, 131189. [Google Scholar] [CrossRef]
  5. Randolph, P.; Bansode, R.R.; Hassan, O.A.; Rehrah, D.; Ravella, R.; Reddy, M.R.; Watts, D.W.; Novak, J.M.; Ahmedna, M. Effect of biochars produced from solid organic municipal waste on soil quality parameters. J. Environ. Manag. 2017, 192, 271–280. [Google Scholar] [CrossRef]
  6. McHenry, M.P. Agricultural bio-char production, renewable energy generation and farm carbon sequestration in Western Australia: Certainty, uncertainty and risk. Agric. Ecosyst. Environ. 2009, 129, 1–7. [Google Scholar] [CrossRef] [Green Version]
  7. Atkinson, C.J.; Fitzgerald, J.D.; Hipps, N.A. Potential mechanisms for achieving agricultural benefits from biochar application to temperate soils: A review. Plant. Soil 2010, 337, 1–18. [Google Scholar]
  8. Kavitha, B.; Reddy, P.V.L.; Kim, B.; Lee, S.S.; Pandey, S.K.; Kim, K.H. Benefits and limitations of biochar amendment in agricultural soils: A review. J. Environ. Manag. 2018, 227, 146–154. [Google Scholar] [CrossRef]
  9. Palansooriya, K.N.; Wong, J.T.F.; Hashimoto, Y.; Huang, L.; Rinklebe, J.; Chang, S.X.; Bolan, N.; Wang, H.; Ok, Y.S. Response of microbial communities to biochar-amended soils: A critical review. Biochar 2019, 1, 3–22. [Google Scholar] [CrossRef] [Green Version]
  10. Vaccari, F.P.; Baronti, S.; Lugato, E.; Genesio, L.; Castaldi, S.; Fornasier, F.; Miglietta, F. Biochar as a strategy to sequester carbon and increase yield in durum wheat. Eur. J. Agron. 2011, 34, 231–238. [Google Scholar] [CrossRef]
  11. Chan, K.Y.; Van Zwieten, L.; Meszaros, I.; Downie, A.; Joseph, S. Using poultry litter biochars as soil amendments. Aust. J. Soil Res. 2008, 46, 437–444. [Google Scholar] [CrossRef]
  12. Laird, D.A.; Fleming, P.; Davis, D.D.; Horton, R.; Wang, B.; Karlen, D.L. Impact of biochar amendments on the quality of a typical Midwestern agricultural soil. Geoderma 2010, 158, 443–449. [Google Scholar] [CrossRef] [Green Version]
  13. Hina, K.; Bishop, P.; Arbestain, M.C.; Calvelo-Pereira, R.; Macia-Agullo, J.A.; Hindmarsh, J.; Hanly, J.A.; Macias, F.; Hedley, M.J. Producing biochars with enhanced surface activity through alkaline pretreatment of feedstocks. Aust. J. Soil Res. 2010, 48, 606–617. [Google Scholar] [CrossRef]
  14. Van Zwieten, L.; Singh, B.P.; Joseph, S.; Kimber, S.; Cowie, A.; Chan, K.Y. Biochar reduces emissions of non-CO2 GHG from soil. In Biochar for Environmental Management; Lehmann, J., Joseph, S., Eds.; Earthscan: London, UK, 2009; pp. 227–249. [Google Scholar]
  15. Lehmann, J.; Rillig, M.C.; Thies, J.; Masiello, C.A.; Hockaday, W.C.; Crowley, D. Biochar effects on soil biota—A review. Soil Biol. Biochem. 2011, 43, 1812–1836. [Google Scholar] [CrossRef]
  16. Abel, S.; Peters, A.; Trinks, S.; Schonsky, H.; Facklam, M.; Wessolek, G. Impact of biochar and hydrochar addition on water retention and water repellency of sandy soil. Geoderma 2013, 202–203, 18–191. [Google Scholar] [CrossRef]
  17. Downie, A.; Crosky, A.; Munroe, P. Physical properties of biochar. In Biochar for Environmental Management: Science and Technology; Lehmann, J., Joseph, S., Eds.; Earthscan: London, UK, 2009. [Google Scholar]
  18. Lei, O.; Zhang, R. Effects of biochars derived from different feedstock and pyrolysis temperatures on soil physical and hydraulic properties. J. Soils Sediments 2013, 13, 1561–1572. [Google Scholar] [CrossRef]
  19. Yuan, H.; Lu, T.; Huang, D.Z.H.; Noriyuki, K.; Chen, Y. Influence of temperature on product distribution and biochar properties by municipal sludge pyrolysis. J. Mater. Cycles Waste Manag. 2013, 15, 357–361. [Google Scholar] [CrossRef]
  20. Zheng, H.; Wang, Z.; Deng, X.; Xing, B. Impact of pyrolysis temperature on nutrient properties of biochar. In Functions of Natural Organic Matter in Changing Environment; Xu, J., Wu, J., He, Y., Eds.; Springer: Berlin/Heidelberg, Germany, 2013; pp. 975–978. [Google Scholar]
  21. Busscher, W.J.; Novak, J.M.; Evans, D.E.; Watts, D.W.; Niandou, M.A.S.; Ahmedna, M. Influence of pecan biochar on physical properties of a Norfolk loamy sand. Soil Sci. 2010, 175, 10–14. [Google Scholar] [CrossRef] [Green Version]
  22. Mukherjee, A.; Lal, R. Biochar impacts on soil physical properties and greenhouse gas emissions. Agronomy 2013, 3, 313–339. [Google Scholar] [CrossRef] [Green Version]
  23. Spokas, K.A.; Cantrell, K.B.; Novak, J.M.; Archer, D.W.; Ippolito, J.A.; Collins, H.P.; Boateng, A.A.; Lima, I.M.; Lamb, M.C.; McAloon, A.J.; et al. Biochar: A synthesis of its agronomic impact beyond carbon sequestration. J. Environ. Qual. 2012, 41, 973–989. [Google Scholar] [CrossRef] [PubMed]
  24. Piccolo, A.; Pietramellara, G.; Mbagwu, J.S.C. Use of humic substances as soil conditioners to increase aggregate stability. Geoderma 1997, 75, 267–277. [Google Scholar] [CrossRef]
  25. Oguntunde, P.G.; Fosu, M.; Ajayi, A.E.; Van de Giesen, N. Effects of charcoal production on maize yield, chemical properties and texture of soil. Biol. Fert. Soils. 2004, 39, 295–299. [Google Scholar]
  26. Kameyama, K.; Miyamoto, T.; Shiono, T.; Shinogi, Y. Influence of sugarcane bagasse-derived biochar application on nitrate leaching in calcaric dark red soil. J. Environ. Qual. 2012, 41, 1131–1137. [Google Scholar] [CrossRef] [PubMed]
  27. Sun, F.; Lu, S. Biochars improve aggregate stability, water retention, and pore-space properties of clayey soil. J. Plant Nutr. Soil Sci. 2014, 177, 26–33. [Google Scholar] [CrossRef]
  28. Lehmann, J.; Czimczik, C.; Laird, D.; Sohi, S. Stability of biochar in soil. In Biochar for Environmental Management: Science and Technology; Lehmann, J., Joseph, S., Eds.; Earthscan: London, UK, 2009; pp. 183–205. [Google Scholar]
  29. Kimetu, J.M.; Lehmann, J. Stability and stabilization of biochar and green manure in soil with different organic carbon contents. Aust. J. Soil Res. 2010, 48, 577–585. [Google Scholar] [CrossRef]
  30. Yeboah, E.; Ofori, P.; Quansah, G.W.; Dugan, E.; Sohi, S.P. Improving soil productivity through biochar amendments to soils. Afr. J. Environ. Sci. Technol. 2009, 3, 34–41. [Google Scholar]
  31. Baiamonte, G.; Crescimanno, G.; Parrino, F.; De Pasquale, C. Effect of biochar on the physical and structural properties of a sandy soil. Catena 2019, 175, 294–303. [Google Scholar] [CrossRef]
  32. Pierson, F.B.; Mulla, D.J. An improved method for measuring aggregate stability of a weakly aggregated loessial soil. Soil Sci. Soc. Am. J. 1989, 53, 1825–1831. [Google Scholar] [CrossRef]
  33. Burrell, L.D.; Zehetner, F.; Rampazzo, N.; Wimmer, B.; Soja, G. Long-term effects of biochar on soil physical properties. Geoderma 2016, 282, 96–102. [Google Scholar] [CrossRef]
  34. Jeffery, S.; Verheijen, F.G.A.; Van der Velde, M.; Bastos, A.C. A quantitative review of the effects of biochar application to soils on crop productivity using meta-analysis. Ecosyst. Environ. 2011, 144, 175–187. [Google Scholar] [CrossRef]
  35. Ouyang, L.; Wang, F.; Tang, J.; Yu, L.; Zhang, R. Effects of biochar amendment on soil aggregates and hydraulic properties. J. Soil Sci. Plant. Nutr. 2013, 13, 991–1002. [Google Scholar] [CrossRef] [Green Version]
  36. Baiamonte, G.; De Pasquale, C.; Marsala, V.; Cimò, G.; Alonzo, G.; Crescimanno, G. Structure alteration of a sandy-clay soil by biochar amendments. J. Soil. Sediment. 2015, 15, 816–824. [Google Scholar] [CrossRef]
  37. Castellini, M.; Giglio, L.; Niedda, M.; Palumbo, A.D.; Ventrella, D. Impact of biochar addition on the physical and hydraulic properties of a clay soil. Soil Till. Res. 2015, 154, 1–13. [Google Scholar] [CrossRef]
  38. Herath, H.M.S.K.; Camps-Arbestain, M.; Hedley, M. Effect of biochar on soil physical properties in two contrasting soils: An Alfisol and an Andisol. Geoderma 2013, 209–210, 188–197. [Google Scholar]
  39. Obia, A.; Mulder, J.; Martinsen, V.; Cornelissen, G.; Borresen, T. In situ effects of biochar on aggregation, water retention and porosity in light-textured tropical soils. Soil Till. Res. 2016, 155, 35–44. [Google Scholar] [CrossRef]
  40. Soil Survey Division Staff. Soil Survey Manual; Soil Conservation Service; USDA: Washington, DC, USA, 1993; Volume 18.
  41. Richards, L.A.; Ogata, G. Psychrometric measurements of soil samples equilibrated on pressure membranes. Proc. Soil Sci. Soc. Am. 1961, 25, 456–459. [Google Scholar]
  42. Crescimanno, G.; Provenzano, G. Soil Shrinkage Characteristic Curve in Clay Soils: Measurement and Prediction. Soil Sci. Soc. Am. J. 1999, 63, 25–32. [Google Scholar] [CrossRef]
  43. Van Genuchten, M.T. A closed-form equation for predicting the hydraulic conductivity of unsaturated soils. Soil Sci. Soc. Am. J. 1980, 44, 892–898. [Google Scholar]
  44. Van Genuchten, M.T.; ThLeij, F.J.; Yates, S.R. The RETC Code for Quantifying the Hydraulic Functions of Unsaturated Soils; U.S. Salinity Laboratory; U.S. Department of Agriculture; Agricultural Research Service: Riverside, CA, USA, 1991.
  45. Collis-George, N.; Figueroa, B.S. The use of soil moisture characteristics to assess soil stability. Aust. J. Soil Res. 1984, 22, 349–356. [Google Scholar] [CrossRef]
  46. Brunauer, S.; Emmett, P.H.; Teller, E. Adsorption of gases in multimolecular layers. J. Am. Chem. Soc. 1938, 60, 309–319. [Google Scholar] [CrossRef]
  47. De Lange, M.F.; Vlugt, T.J.H.; Gascon, J.; Kapteijn, F. Adsorptive characterization of porous solids: Error analysis guides the way. Micropor. Mesopor. Mat. 2014, 200, 199–215. [Google Scholar] [CrossRef]
  48. Soinne, H.; Keskinen, J.; Heikkinen, R.; Hyväluomac, J.; Uusitalo, R.; Peltoniemi, K.; Velmala, S.; Pennanena, T.; Fritzea, H.; Kaseva, J.; et al. Are there environmental or agricultural benefits in using forest residue biochar in boreal agricultural clay soil? Sci. Total Environ. 2020, 731, 138955. [Google Scholar] [CrossRef]
  49. Hardie, M.; Clothier, B.; Bound, S.; Oliver, G.; Close, D. Does biochar influence soil physical properties and water availability? Plant. Soil 2014, 376, 347–361. [Google Scholar] [CrossRef]
  50. Karhu, K.; Mattila, T.; Bergstrom, I.; Regina, K. Biochar addition to agricultural soil increased CH4 uptake and water holding capacity—Results from a short-term pilot field study. Agric. Ecosyst. Environ. 2011, 140, 309–313. [Google Scholar] [CrossRef]
  51. Major, J.; Lehmann, J.; Rondon, M.; Goodale, C. Fate of soil applied black carbon: Downward migration, leaching and soil respiration. Glob. Change Biol. 2010, 16, 1366–1379. [Google Scholar] [CrossRef]
  52. Blanco-Canqui, H. Biochar and soil physical properties. Soil Sci. Soc. Am. J. 2017, 81, 687–711. [Google Scholar] [CrossRef] [Green Version]
  53. Bagarello, V.; Baiamonte, G.; Caia, C. Variability of near-surface saturated hydraulic conductivity for the clay soils of a small sicilian basin. Geoderma 2019, 340, 133–145. [Google Scholar] [CrossRef]
  54. Van Dam, J.C.; Huygen, J.; Wesseling, J.G.; Feddes, R.A.; Kabat, P.; van Walsum, P.E.V.; Groenendijk, P.; van Diepen, C.A. Theory of SWAP Version 2.0; DLO Winand Staring Centre: Wageningen, The Netherlands, 1997. [Google Scholar]
  55. Crescimanno, G.; Garofalo, P. Management of Irrigation with Saline Water in Cracking Clay Soils. Soil Sci. Soc. Am. J. 2006, 70, 1774–1787. [Google Scholar] [CrossRef]
  56. Leão, T.P.; Tuller, M. Relating soil specific surface area, water film, thickness, and water vapor adsorption. Water Resour. Res. 2014, 50, 7873–7885. [Google Scholar] [CrossRef]
  57. Uras, U.; Carrier, M.; Hardie, A.G.; Knoetze, J.H. Physico-chemical characterization of biochars from vacuum pyrolysis of South African agricultural wastes for application as soil amendments. J. Anal. Appl. Pyrolys. 2012, 98, 207–213. [Google Scholar] [CrossRef]
  58. Ajay, A.E.; Horn, R. Biochar-induced change in soil resilience: Effect of soil texture and biochar dosage. Pedosphere 2017, 27, 236–247. [Google Scholar] [CrossRef]
  59. Murray, R.S.; Quirk, J.P. Surface area of clays. Langmuir Am. Chem. Soc. 1990, 6, 122–124. [Google Scholar] [CrossRef]
Figure 1. Experimental pairs (ac) (U, |h|) obtained by using the Richards pressure plate laboratory methods and (df) the corresponding pairs (θ, |h|) obtained for loamy sand, loam and clay soils with and without biochar (BC). Black dots refer to not amended soils, whereas white dots refer to BC-amended soils. Lines indicate the VG water retention curves.
Applsci 11 12108 g001
Figure 2. Relationship between the plant available water (PAW) and the specific surface area (BET-SSA). The figure also reports the fitted equation.
Applsci 11 12108 g002
Table 1. Physico-chemical characteristics of standard soils and biochar.
Soil Properties2.13A6SBiochar
Org C (%)1.23 ± 0.302.2 ± 0.11.9 ± 0.343.5 ± 2.3
pH value (0.01M CaCl2)6.2 ± 0.77.1 ± 0.06.7 ± 0.69.5 ± 0.7
Cation exchange capacity (meq/100 g)8 ± 0.117 ± 417 ± 3-
Particle sizes according to USDA (%)
0.002 mm3.6 ± 1.216.9 ± 0.141.5 ± 1.4-
0.002–0.05 mm9.5 ± 2.234.6 ± 2.736.4 ± 3.1-
0.05–2.0 mm86.9 ± 1.948.5 ± 2.622.1 ± 2.2-
Soil textureLoamy SandLoamClay-
Bulk density (g/cm3)1.38 ± 0.0401.11 ± 0.1001.20 ± 0.0600.173 ± 0.060
Table 2. Experimental pairs, pressure head, |h| (cm) and gravimetric water content, U (g/g), obtained for soils loamy sand, loam and clay with and without biochar, by using the Richards pressure plate apparatus. Values followed by the same letter are not significantly different per a two-tailed t-test (p < 0.05).
|h| (cm)Loamy-SandLoamy-Sand + BCLoamLoam + BCClayClay + BC
10.20.061 a0.463 b0.204 a0.638 b0.272 a0.346 b
1020.058 a0.253 b0.202 a0.365 b0.270 a0.334 b
3370.051 a0.139 b0.202 a0.271 b0.261 a0.330 b
7140.050 a0.139 b0.189 a0.229 b0.254 a0.291 b
10200.037 a0.074 b0.178 a0.217 b0.251 a0.268 a
33960.031 a0.062 b0.168 a0.201 b0.243 a0.249 a
15,2960.018 a0.047 b0.132 a0.162 b0.203 a0.197 a
Table 3. Parameters of the Mualem-van Genuchten model estimated the three considered soils, with and without biochar (BC).
ParameterLoamy SandLoamy Sand + BCLoamLoam + BCClayClay + BC
Ur (g/g)0.000 a0.031 b0.000 a0.150 b0.000 a0.134 b
Us (g/g)0.061 a0.491 b0.204 a0.717 b0.273 a0.347 b
α (cm−1)0.0030.0340.0010.0670.0010.003
n1.3151.5581.1501.4941.0911.314
m0.2390.3580.1310.3310.0840.239
Table 4. Measured wilting point, θwp, field capacity, θfc, and bulk density, ρb, for the three considered soils amended and not amended with biochar. Within each raw, values followed by the same letter are not significantly different per a two-tailed t-test (p < 0.05).
ParameterLoamy SandLoamy Sand + BCLoamLoam + BCClayClay + BC
θs (cm cm−3)0.084 a0.407 b0.226 a0.520 b0.329 a0.263 b
θr (cm cm−3)0.000 a0.026 b0.000 a0.109 b0.000 a0.102 b
α (cm−1)0.0030.0340.0010.0670.0010.003
N1.3151.5581.1501.4941.0911.314
θwp (cm cm−3)0.025 a0.039 b0.146 a0.117 b0.246 a0.149 b
θfc (cm cm−3)0.071 a0.115 b0.224 a0.196 b0.315 a0.250 b
ρb (g cm−3)1.381 a0.828 b1.110 a0.726 b1.208 a0.757 b
PAW (cm3cm−3)0.0456 a0.0762 b0.0782 a0.0791 a0.0692 a0.1045 b
PAWU (g g−1)0.0330 a0.0920 b0.0705 a0.1090 b0.0573 a0.1330 b
Table 5. Modal suction, |τd|, volume of drainable pores, ΔUg, structural index (SI), for the three soils amended and not amended with biochar. Within each row, values followed by the same letter are not significantly different per a two-tailed t-test (p < 0.05).
ParameterLoamy SandLoamy Sand + BCLoamLoam + BCClayClay + BC
|τd| (cm)121.2 a15.3 b156.5 a7.1 b78.0 a125.1 b
ΔUg (g g−1)0.061 a0.460 b0.204 a0.567 b0.273 a0.213 b
SI 0.0005 a0.0300 b0.0013 a0.0802 b0.0035 a0.0017 b
Table 6. BET Specific surface Area (BET-SSA) of the three considered soils amended and not amended with biochar.
ParameterLoamy SandLoamy Sand + BCLoamLoam + BCClayClay + BC
BET-SSA (m2/g)1.19 ± 0.0218.1 ± 0.234.6 ± 0.5522.25 ± 1.332.89 ± 1.551.48 ± 1.67
Publisher’s Note: MDPI stays neutral with regard to jurisdictional claims in published maps and institutional affiliations.

