Review

Latest Advances in Common Signal Processing of Pulsed Thermography for Enhanced Detectability: A Review

1
Eco-Sustainable Energy Research Institute, Kongju National University, 1223-24 Cheonan-Daero, Seobuk-gu, Cheonan-si 31080, Korea
2
Department of Future Convergence Engineering, Kongju National University, 1223-24 Cheonan-Daero, Seobuk-gu, Cheonan-si 31080, Korea
3
Division of Mechanical & Automotive Engineering, Kongju National University, 1223-24 Cheonan-Daero, Seobuk-gu, Cheonan-si 31080, Korea
*
Author to whom correspondence should be addressed.
Appl. Sci. 2021, 11(24), 12168; https://doi.org/10.3390/app112412168
Submission received: 10 November 2021 / Revised: 15 December 2021 / Accepted: 15 December 2021 / Published: 20 December 2021

Abstract

:
Non-destructive testing (NDT) is a broad group of testing and analysis techniques used in science and industry to evaluate the properties of a material, structure, or system for characteristic defects and discontinuities without causing damage. Recently, infrared thermography is one of the most promising technologies as it can inspect a large area quickly using a non-contact and non-destructive method. Moreover, thermography testing has proved to be a valuable approach for non-destructive testing and evaluation of structural stability of materials. Pulsed thermography is one of the active thermography technologies that utilizes external energy heating. However, due to the non-uniform heating, lateral heat diffusion, environmental noise, and limited parameters of the thermal imaging system, there are some difficulties in detecting and characterizing defects. In order to improve this limitation, various signal processing techniques have been developed through many previous studies. This review presents the latest advances and exhaustive summary of representative signal processing techniques used in pulsed thermography according to physical principles and thermal excitation sources. First, the basic concept of infrared thermography non-destructive testing is introduced. Next, the principle of conventional pulsed thermography and signal processing technologies for non-destructive testing are reviewed. Then, we review advances and recent advances in each signal processing. Finally, the latest research trends are reviewed.

1. Introduction

Non-destructive testing (NDT) is helpful for manufacturing defect-free products, but it is also used for maintenance and condition inspection of industrial structures and facilities [1]. There are many NDT techniques, each based on different theoretical principles and producing different results concerning the physical properties of an object. The solutions provided through each non-destructive testing technology must be further analyzed to interpret the object’s physical properties or structure. However, this interpretation inevitably involves several assumptions [2,3,4].
Infrared thermography (IRT), also known as thermal imaging, is a rapidly developing field in science and industry due to the tremendous advances made over the past few decades in microsystem technology in the design of infrared detectors consisting of electronics and computer science [5]. In addition, IRT is an optical measurement technique, evolving rapidly with the development of high spatial resolution and sensitivity detectors and improved computation power. Today, IRT technology is being applied in research and development in various industries [6,7], including non-destructive testing, detailed structural condition monitoring, predictive maintenance, manufacturing quality assurance, energy cost reduction, metal and composite material evaluation, gas leak detection, and more. Meanwhile, researchers worldwide are working to develop infrared thermography technology to improve the reliability and ability to detect failures such as defects. Every technique has its own limitations, and no technique can be considered good, effective, or perfect. In this context, there is a growing trend to integrate thermography technology into other conventional NDT technologies to compensate for each other’s limitations. It will result in better inspection capability and the possibility that more information can be acquired in a single test than a particular technique. Furthermore, it can solve the limitations posed by one NDT technique to obtain the intended information and achieve the required inspection efficiencies.
IRT has gained increased recognition in recent years because it has good benefits over its counterparts. The benefits include high-speed contactless functioning, a higher level of safety, and portability with the potential to encompass a large inspection area. IRT is generally divided into two approaches: passive thermography and active thermography. Passive thermography measures thermal variations of a material using an infrared vision device without external thermal sources [8]. Contrary to passive thermography, active thermography requires an external heat source to stimulate the materials under tests. Commonly, halogen lamps, high-power photographic flash, and laser beams are widely used, and other high-power cinematographic lamps and quartz line IR lamps are used [9,10]. In addition, active thermography is subdivided into lock-in thermography (LIT), pulsed thermography (PT), step-heated thermography (SHT), and vibration thermography (VT) according to external heating methods [11,12,13], and PT and LIT are the most utilized. The pulsed thermography (PT) idea was first proposed by Parker et al. [14]. However, other researchers integrated this technique into various NDT applications. The concept of a PT system for defect detection consists of applying a very short time and powerful energy pulse to an object and then recording the temperature rise, decay, or both curves in transient mode. The thermal energy propagates under the surface by thermal diffusion. The presence of subsurface defects interrupts the diffusion rate of the energy pulse.
Pulsed thermography is one of the active infrared techniques, which uses an optical device as an external heat source. Among the active thermography techniques described above, it is the easiest to apply and widely used. However, regardless of being one of the most promising techniques for NDT&E of materials, IRT still presents significant challenges due to non-uniform surface heating, lateral heat diffusion, environmental noise, and limited parameters of the thermal imaging device as image acquisition frequency and spatial resolution. In order to improve this problem, various IRT signal processing techniques were developed, such as the Fourier transforms [15], Principal Component Thermography [16], Thermography Signal Reconstruction [17], PCA data fusion [18], Wavelet transforms [19], etc., and used to expand IRT. Thus, a profound work review is required, including the principle, developments, strengths and limitations, signal processing, and research trends for thermography NDT with optical excitation sources.
The rest of the paper is organized as follows. Firstly, the basic concepts of optical thermography NDT are introduced in Section 2. Next, the developments of signal processing methods in thermography NDT with optical thermography are reviewed in Section 3. Then, some signal processing case studies are reviewed in Section 4. After that, the latest trends in optical thermography signal processing are predicted, and finally, a conclusion is presented in Chapter 6.

2. Basic Concepts of Optical Thermography NDT

IRT deals with the acquisition and analysis of thermal pattern from a non-contact thermal imaging device based upon the fact that all objects above absolute zero (−273.15 °C) emit infrared energy [20]. Infrared thermography (IRT) is an emerging NDT technique developed rapidly in recent years with many advantages such as high speed, large area of observation, wide area coverage and non-contact [2,5]. IRT is a thermal radiation measurement technique that is used to detect spatial variations in the measured surface temperature pattern. From an experimental approach aspect, infrared thermography techniques are classified into two major categories: passive and active. The passive approach is generally used in the research on materials that are at different temperature compared with the ambient, while in the case of active approach, an external excitation source, such as optical flash lamps, halogen heat lamps, mechanical ultrasonic vibration, or hot and cold air gun is employed with the intention of inducing thermal contrast. In the active approach of the infrared thermographic non-destructive testing and evaluation (NDT&E), pulsed transient thermography and lock-in thermography are the most commonly used approaches.

2.1. Passive Thermography

In passive thermography, no external energy is used to excite thermal gradients on the surface of the structural component under investigation. The features of interest are naturally at a lower or higher temperature than the background. In general, it is a qualitative approach, since the main objective is to pinpoint discontinuities [21]. This approach operates well in the SWIR range of 3–5 μm and LWIR range of 8–12 μm and has many applications such as process monitoring, condition monitoring, predictive maintenance, medical imaging, building thermal efficiency, forest fire detection, monitoring of road traffic, monitoring of power stations, night vision and surveillance, agriculture, and biology [2,22]. Unfortunately, this technique is limited in NDT applications as a sufficient, natural thermal contrast should be present.

2.2. Active or Dynamic Thermography

In active thermography, a certain amount of energy is introduced to the object, which is initially in thermal equilibrium, and thermal contrast is produced to highlight the features of interest. The energy transfer to the object can be pulses or either in a modulated continuous form. A halogen lamp, optical flash lamp, and cold or hot air guns can be used as an energy source. Figure 1 shows the experimental setup of typical active thermography [23,24].
The controlled experimentation condition, such as the amount and form of stimulation, allows not only identification of defect but also quantitative analysis of anomalies [6,25]. In NDT application, active thermography can be used to detect the layers structures such as delamination and inserts in the automotive and aerospace industry, investigate the interior structures such as lightweight honeycomb structures, and recognize deeper material deficiencies [26].
The inspection can be conducted either in transmission or reflection mode. In transmission mode, the heating source and thermal imaging device are positioned on opposite sides of the object being inspected, whereas in reflection mode, both the heating source and the thermal imaging device are positioned on the same side of the object.
The two primary classical or conventional practices are pulsed thermography (PT) and lock-in thermography (LIT). In both techniques, thermal energy is delivered into the object in which the heat propagates by diffusion through the material. Then, the thermal response recorded by the infrared imaging device is observed to reveal the presence of the defect. In PT, a short- and high-power thermal energy is applied to the object’s surface being inspected, and the thermal response of the stimulated surface is observed in a transient state. It is a fast and popular thermal imaging technique in NDT&E, whereas in the LIT, the object’s surface being inspected is stimulated by a periodically modulated thermal wave, and the thermal response of the surface is observed in steady state.
To access the defect information, efficient signal processing and filtering is very important. With the help of adapted image and signal processing algorithms, it is possible to detect small discontinuities inside structures or extract material characteristic information. By reducing the amount of acquired data, the process is accelerated, but a certain decrease in accuracy has to be kept in mind [27].
Results obtained in active thermography are often damaged by different noise sources such as moisture, external reflections, variations in the specimen’s emissivity, and non-uniform heating. In thermal images, these noise effects create unusual thermal patterns and complicate damage detection. To reduce noise in thermal images, several signal processing techniques have been developed to improve the defect detection and quantification evaluation of each active thermography method.
Table 1 compares representative optics utilized in active thermography methods, including flash lamps used in pulsed thermography for defect detection [28,29]. The primary differences between stimulation mechanisms of these devices determine two essential methods of optical infrared thermography [28]. We can submit a high-energy heat pulse in short (few milliseconds) time intervals using photographic flash. In contrast, halogen lamps provide a lower amount of energy submitted to the object in a relatively longtime frame (few seconds), usually in either continuous or modulated form.

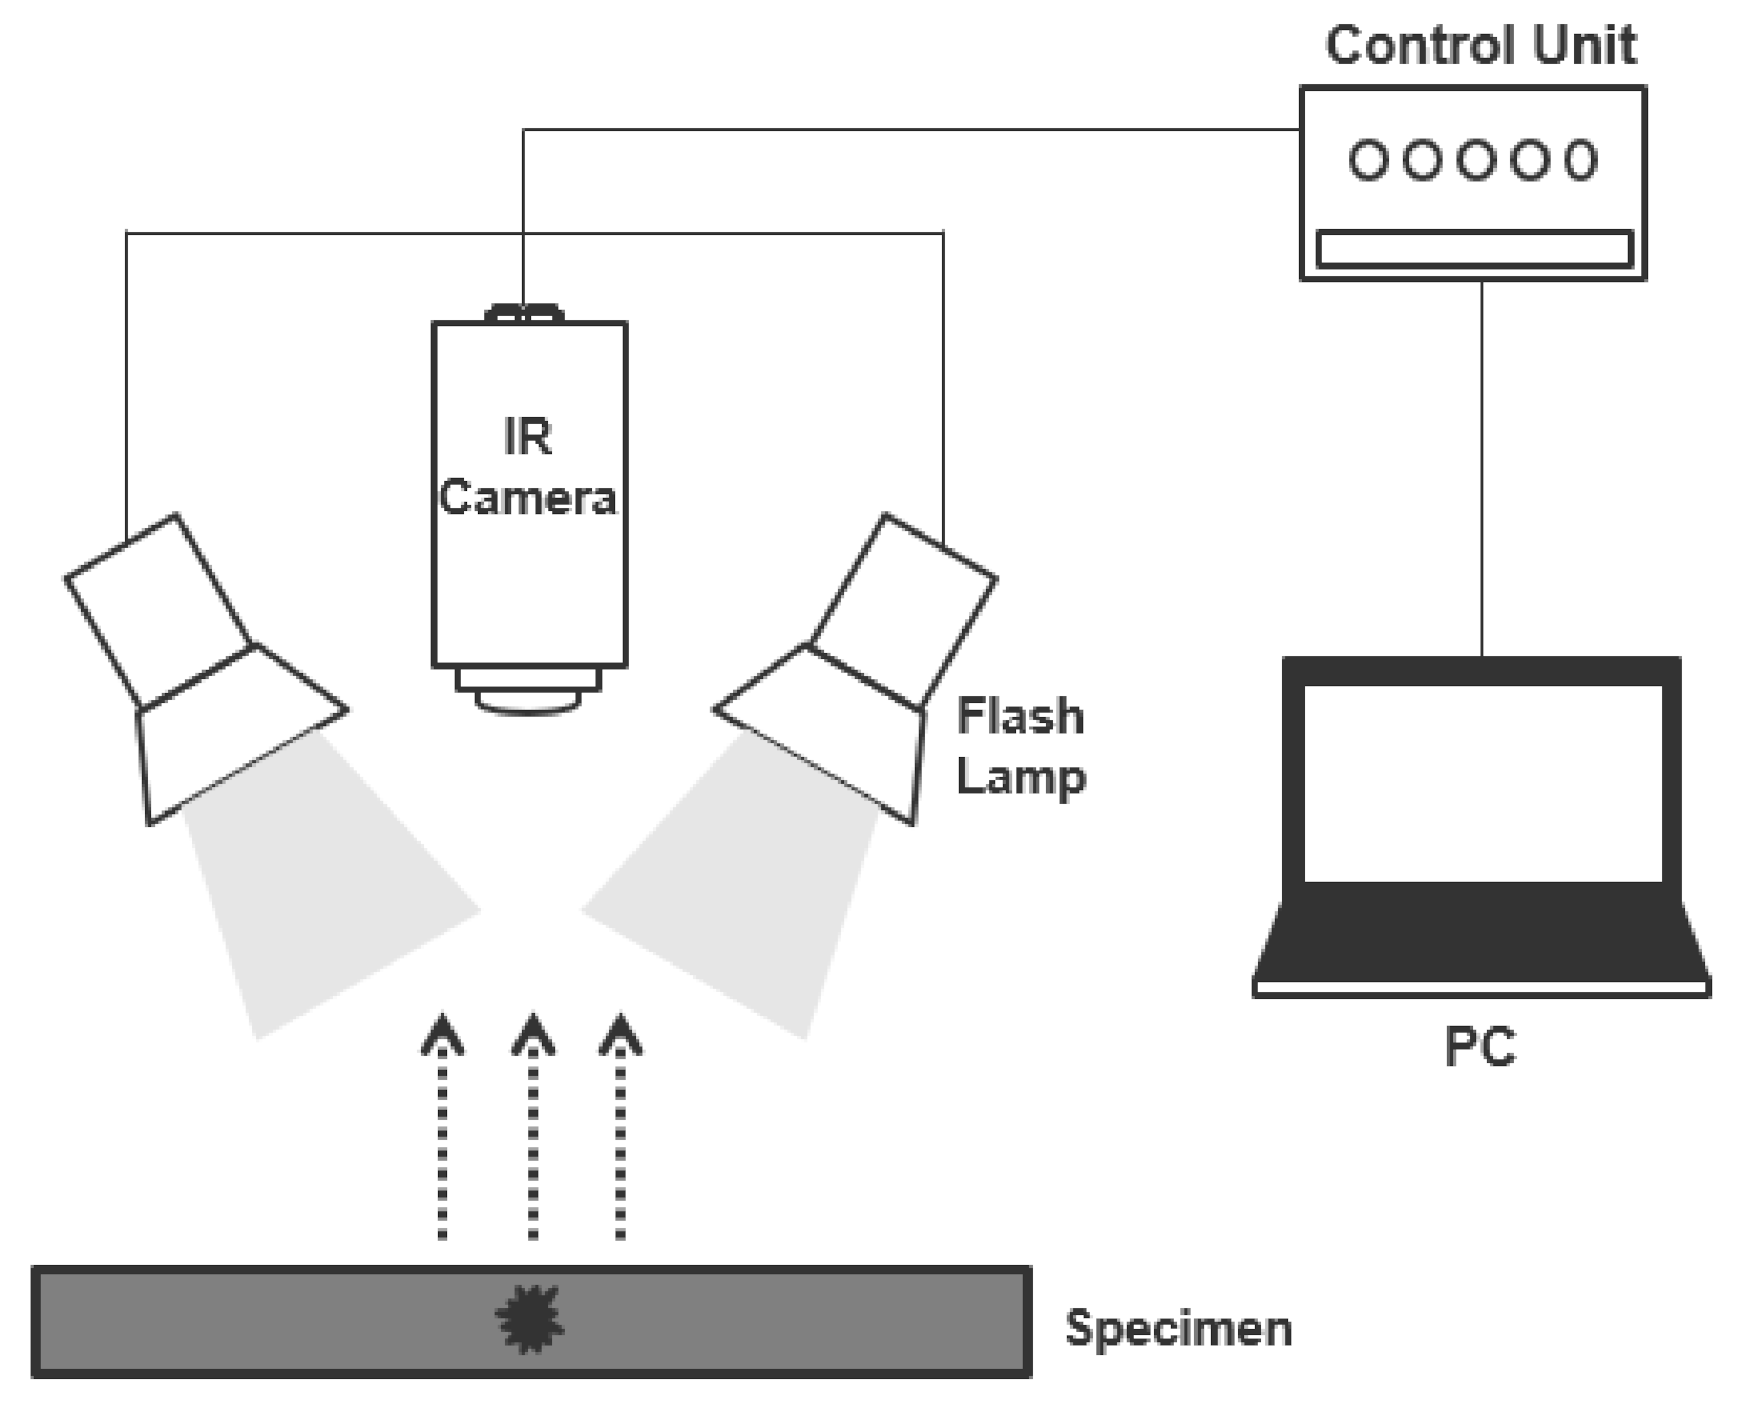
2.3. Pulsed Thermography (PT)

The concept of a PT system for defect detection consists of applying a very short time and powerful energy pulse to an object and then recording the temperature rise, decay, or both curves in transient mode According to the thermal diffusion effect, pulsed thermal energy incident on the surface propagates under the surface. If a defect exists below the surface, it interferes with the diffusion of the pulse energy [6].
Consequently, each defect will appear differently from the other defects located at different depths. Dirac pulse is defined as an intense unit-area pulse of such a short duration that no measuring equipment can differentiate it from a shorter pulse. However, in practice, producing an ideal Dirac pulse is not possible [22].
Pulsed thermography (PT) is among the most prevalent thermographic techniques in TNDT. Figure 2 depicts the principle of PT where a high-power pulse heating is employed to the sample under inspection, and the response of the sample is recorded with an infrared camera. The continuance of the pulse depends on the sample’s thermal conductivity under inspection and runs between 2 to 15 ms, making PT well known for its quickness in testing. As soon as the sample becomes excited, the surface absorbs the light energy, and temperature increases instantly. Due to the propagation of thermal waves inside the sample, the surface temperature starts to decay. Imperfections could be seen if there is variance in the thermal decay rate across the sample surface. The transient temperature field T(z,t) of PT can be expressed by an in-homogeneous one-dimensional (1D) Equation (1).
T z , t z 2 1 α T z , t t = g z , t k ,   t > 0
α = k ρ . C p
where α is the material’s thermal diffusivity with k being the thermal conductivity, ρ is the density, and Cp is the specific heat capacity. The one-dimensional solution of the Fourier’s law for the propagation of a Dirac pulse in a semi-infinite isotropic solid by conduction can be expressed by Equation (3) [6,22].
T z , t = T 0 + Q e π t exp z 2 4 α t
e = k ρ c p
where T is the temperature rise at the time after the flash heating, T 0 is the initial temperature, Q is the energy density deposited on the surface, and e is the material’s thermal effusivity to exchange heat with its surrounding.
At the surface (z = 0 mm), Equation (3) can be rewritten as Equation (5).
T t = Q e π t

3. Development of PT Signal Processing

3.1. Pulsed Phase Thermography (PPT)

Pulsed Phase Thermography (PPT), which simultaneously combines the advantages of PT and LIT, was initially developed in 1996 by Maldague and Marinetti [6]. Pulsed Phase Thermography (PPT) is the phase analysis in the frequency domain of PT and is a signal processing method that solves the problem of heating inhomogeneity as it is less sensitive to the non-uniformity of heating, surface irregularities, and environmental reflections [30]. In Pulsed Phase Thermography (PPT), data are transformed from the time domain to the frequency domain using the one-dimensional discrete Fourier transform [31]. FFT can be used in any waveform to extract amplitude and phase angle from the transient signals. As a quick algorithm of DFT, FFT can play an influential role in analyzing the amplitude and phase of every harmonic frequency and is widely used in PPT. It can also image large components on airframes relatively fast. Since PPT is widely used in the aerospace industry to inspect metallic and composite components, it can be considered a valid alternative to time-domain PT. The procedure to extract the phase from the thermal data T(k) is based on the Fourier transform, which is computed according to the well-known formula [32,33]:
F n = Δ t k = 0 N 1 T k Δ t e x p j 2 π n k N = R e n + I m n
where Re and Im are the real and imaginary parts of the transform sequence, Fn, respectively, N is the number of thermal images, j2 = −1 is the imaginary number, and Δt is the sampling time interval. Real and imaginary parts of the complex transform are then applied to evaluate the amplitude and phase angle and can be expressed by Equations (7) and (8), respectively:
A n = R e n   2 + I m n   2
n = t a n 1 I m n R e n  
presents enough phase contrast to be detected on the phase spectrum. The “blind frequency” and the defect depth are typically correlated by the following formula [34]:
d = C 1 α π f b
where C 1 is called a “correlation constant” and ranges between 1.5 and 2 [35].

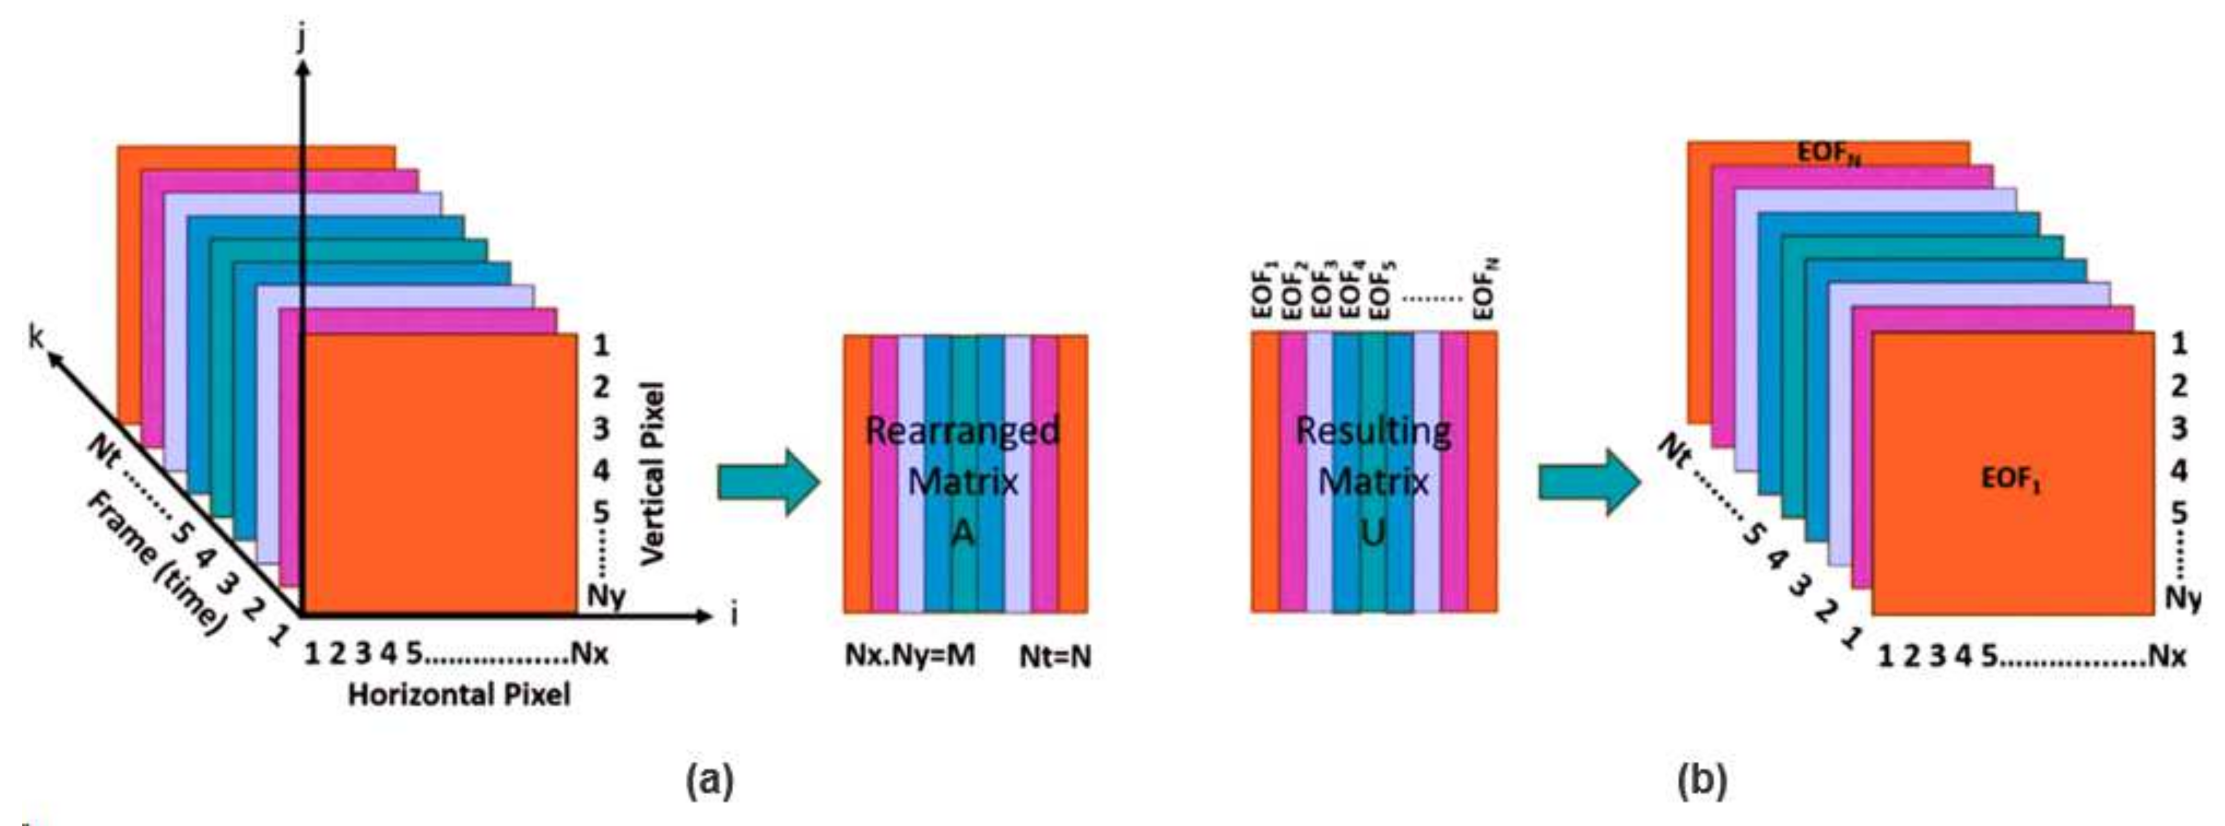
3.2. Principal Component Thermography (PCT)

The Principal Component Thermography (PCT) technique was proposed by Rajic and is a representative signal processing technique that is being applied to inspection and component inspection in various fields of NDT&E [36,37]. Principal Component Thermography (PCT) facilitates the reduction of undesirable data while preserving the major features of thermal image sequences. Principal Component Thermography (PCT) is applied by Principal Component Analysis (PCA) and utilizes the singular value decomposition (SVD) of measured temperature characteristics [36]. This technology reduces the dimension of temporal and spatial thermal data from three-dimensional to two-dimensional. In addition, this technique reconstructs the input thermal image from a matrix where each row consists of a raster-like arrangement of each single image pixel. As a result, each column represents the temporal evolution of a particular pixel. Then, using eigenvalues and eigenvectors as the essential products of SVD, the input data as a reconstructed matrix will be decomposed to its empirical orthogonal functions (EOFs).
Empirical orthogonal function (EOF) analysis (Emery and Thomson (1998)) provides a framework for constructing a set of orthogonal statistical models that furnish a complete description of the variability in a set of observations [38]. The analysis involves the calculation of a covariance matrix or, alternatively, the application of a singular value decomposition. The latter is computationally more efficient and is the approach employed in the present work. This analysis produces a remarkably compact description of the salient spatial and temporal signal variations relating to the contrasts associated with underlying structural flaws when applied to thermographic data. In many cases, a richly informative description of these contrasts is furnished in a single spatial mode and its complementary characteristic time vector, known as the principal component.
Data acquired in the course of a normal active thermal inspection are customarily organized in the manner depicted in Figure 3, a three-dimensional array, which, for convenience, is defined here as T i , j , k ,where i = 1 , 2 , , N x , j = 1 , 2 , , N y , and k = 1 , 2 , N t . The pixel values in each image frame are drawn out into a vector to condense the original data “cube” into a matrix A with dimension M × N , where M = N x × N y with dimension M × N , where M = N x × N y and N = N t . Each M column vectors are then subjected to a standardization process to ensure uniformity on a pixel-by-pixel basis. [33,39],
A n , m = A n , m μ m σ m
μ m = 1 N n = 1 N A n , m
σ   m 2 = 1 N 1 n = 1 N A n , m μ m 2
This standardized matrix A is then reduced by singular value decomposition as follows:
A = U S V T  
where U is the orthogonal matrix of dimension M × N and comprises a set of empirical orthogonal functions (EOFs) representing spatial variation. S is a diagonal matrix of dimension M × N and possesses the singular values of matrix A on the diagonals. V T is the transpose matrix of the N × N orthogonal matrix representing characteristic time.

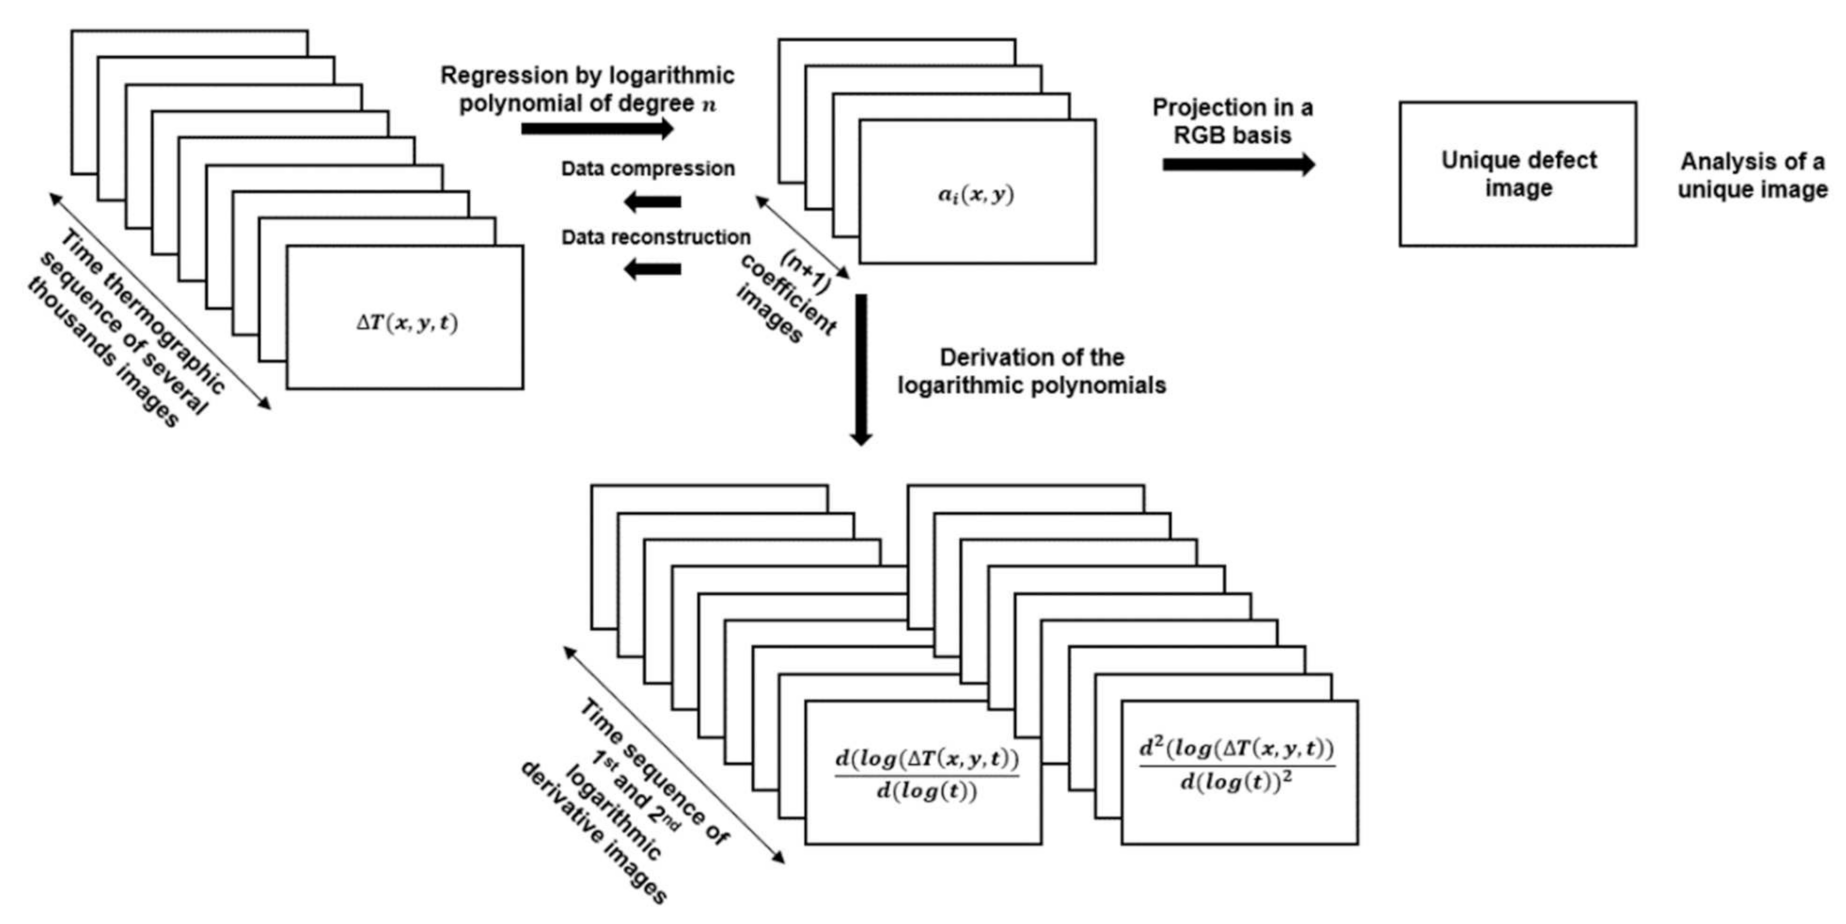
3.3. Thermographic Signal Reconstruction (TSR)

Shepard et al. [40] introduced Thermographic Signal Reconstruction (TSR), which provides improved detection of low contrast and low aspect ratio features and the ability to detect and measure the characteristics of extended interfaces [41].
A general TSR is used to qualitatively detect defects by selecting the best-derived images related to all depth ranges or to evaluate depth at a characteristic time quantitatively (Figure 4) [42]. Fitting and derivation of the thermogram depends on the time domain being considered. It is necessary to define the time window for characterization, considering only the part of the thermal image affected by the physical phenomenon. The defect image thus obtained has a better signal-to-noise ratio and sharpness than the raw thermal image. It may also be necessary to optimize the polynomial degree depending on the case.
TSR is a method of estimating the through-plane thermal diffusivity α z . This estimate of α z is referred to as α e z , the effective through-plane thermal diffusivity. The TSR algorithm can be described in the following way. First, the ambient temperature T a is subtracted from the temperature–time sequence, yielding Δ T . Then, least-squares polynomial regression is carried out in log-log scales. This polynomial is referred to as the TSR polynomial. Suggestions based on analytical studies [39] have been made, to determine the degree n of the TSR polynomial that should ideally be used. The optimal degree n depends on the sample under consideration and measurement acquisition parameters, but it is in the range of n = 7 to n = 9 [43]. The logarithmic transform of Equation (3) can be expressed by Equation (14) [43,44].
l n T = l n Q e 1 2 l n π t   = a 0 + a 1 l n t   + a 2 l n t 2 + + a n l n t n
where T is the increment in temperature as a function of time and a 0 , a 1 ,…, a n are the polynomial coefficients. In NDT, fifth- or sixth-order polynomial was found effective in temporal noise reduction, and the optimum degree of the polynomial in use was found up to ninth-order. The first log-time derivative d l n T / d l n t and the second derivative d 2 l n T / d l n 2 t of the polynomial enhanced the defect detectability and SNR.
The maximum of the second derivative can be calculated in two ways: either by evaluating the second analytic derivative or by deriving the TSR polynomial three times and finding and evaluating all real-valued roots. The second derivative is, in essence, the curvature of the temperature–time sequences, and one would also expect to find the depth of the air pocket by the TSR method [45]. In practice, this is not the case because polynomials can only approximate the temperature–time sequences. The sequence obtained by plotting the second derivative of the TSR polynomial often shows multiple peaks, wherein it is often not clear which were caused by an air pocket and which were due to oscillations (Runge’s phenomenon) of the polynomial [46].

3.4. Discrete Wavelet Transform (DWT)

Wavelet transform (WT) is widely applied in stationary and non-stationary signal analysis. This technique removes electrical noise from the signal, detects discontinuities, and compresses large amounts of data. Utilizing the WT, it is possible to decompose a signal into a group of constituent signals known as wavelets, each with a well-defined and dominant frequency, similar to the Fourier transform (FT) [47], which is represented by sine and cosine functions of unlimited duration. In WT, a wavelet is a transient function of limited duration centered on a specific time. The problem with the FT is that information loss occurs in time when moving from the time domain to the frequency domain. It is impossible to infer the time of occurrence or disappearance of the signal components of the acquired frequency spectrum using the FT. Unlike the FT, the WT utilizes both the time and frequency domains to provide frequency information of a signal over time.
Because the WT is discrete, it is known as the Discrete Wavelet Transform (DWT) and has significant advantages over the FT. The WT decomposes the signal into multiple scales representing a wide range of frequency bands, and the position of the WT at each scale is determined from the temporal characteristic that identifies and efficiently removes electrical noise [48]. A short-time WT is used to extract high-frequency component data. This is an important characteristic to eliminate high frequency fluctuations due to electrical noise. Long-term WT can acquire low-frequency data. High-frequency and low-frequency data can be used to define thresholds and set electrical noise thresholds below zero.
DWT is considered as a new technology to replace electrical noise attenuation processing using low-pass filter of Fast Fourier Transform (FFT) or lock-in amplifier system that can be used independently in environments with very low electrical noise [49]. The overlap of bands that are completely different or completely different from the signal and noise for which filtering methods can be utilized is an important characteristic of the moment of processing digital signals whose information does not change over time.
FT and WT applied to infrared thermography technology can extract phase angle and amplitude data from the temperature–time history of each pixel. Analysis image sequences by applying transient signals to detect and characterize defects. However, the FT reconstructs all signals by using the infinite constant base of the sequence, which causes a problem when there is a transient component or a sudden change in the signal. However, the WT can be described as an extension of the FT that preserves the time domain information directly related to the defect depth while maintaining the properties of the FT. As a result, it affects the time frequency and resolution of the signal. Therefore, WT is utilized as a transformation algorithm to extract transient function data.
The principle of the WT is that the analyzed function, f t , is decomposed into a set of basic functions, Ψ s , τ t , which are referred to as wavelets. The continuous WT is expressed as in Equation (15) [50].
γ s , τ = f t Ψ s , τ * t d t = R e n + j I M n
where * stands for complex conjugation, s is the scale and defines the wavelet dilation ( s > 1 ) or contraction ( 1 > s > 0 ), and τ corresponds to the WT along the analyzed signal, t is the time, R e n is the real part of the transform, I m n is the imaginary part of the transform and j is the imaginary number ( 1 1 / 2 ). Function Ψ s , τ * t is generated by scaling and translating the Mother Wavelet (MT) according to Equation (16).
γ s , τ = 1 s Ψ t τ s
Ψ x = 1 π f b e j 2 π f c x e e x 2 f b
where f b is a constant that defines the width of the wavelet and f c is the wavelet center frequency constant. In general, f b = 1 and f c = 1 were considered.
Real and imaginary parts of Equation (16) are used to calculate the phase angle of the transform and is expressed as Equation (17).
n = t a n 1 I m n R e n

3.5. Differential Absolute Contrast (DAC)

Differential absolute contrast (DAC) is a based on a one-dimensional solution of a Fourier diffusion equation (Dirac delta function) for a pulsed heatwave [51,52]. By applying DAC, it is possible to obtain thermal response energy data at each point on the surface by modeling the time-dependent profile of the specimen surface temperature [53,54]. Therefore, advanced as a Source Distribution Image (SDI) solution, it is possible to properly establish a sound reference area based on the assumption that all pixels exhibit a similar enumeration to the sound defect reference area in the initial thermogram.
Assuming that the heat transfer of the specimen under inspection can be described with sufficient accuracy using the semi-finite body model, the equation for controlling the temperature contrast of the specimen surface with time after the energy impulse Q δ t is applied is as follows [55]:
T s e m i i n f i n i t e   b o d y z = 0 , t = Q e π t
where z is the distance from the specimen object surface, t is time, e is effusivity, and Q is input energy. Considering the thermal image acquired at time t before the first defect is visually detected on the surface, the temperature Δ T s i , j t of the sound area is as follows:
Δ T s o u n d i , j t = Δ T i , j t = Q i , j e i , j · π t
Assuming that the energy incident on the specimen fluctuates, the value of local Q i , j / e i , j is as follows:
Q i , j e i , j = π t · Δ T i , j t
Therefore, the DAC can be calculated as the Q i , j / e i , j between the thermal response solutions for semi-infinites describing Equation (21).
D A C i , j = Q i , j e i , j · π t = t t · Δ T i , j t
The DAC scales for every pixel in the thermal map processing and provides a result for the minimization of non-uniform heating of the surface.

4. Case Study for Signal Processing of Pulsed Thermography

In Sections 2 and 3, the basic principles of optical infrared thermography and PPT, PCT, TSR, DWT, and DAC signal processing, which are widely applied, were introduced. Section 4 introduces the latest application of each signal processing technique and some case studies. Each algorithm is used in similar cases overall but has different strengths and differences. Some cases of pulsed thermography signal processing studies are as follows.

4.1. Advances of PPT

Combining the characteristics and benefits of PT and LIT, PPT is a common NDT technique in various industries for inspection, including metal, non-metal, composite, concrete, and other materials. As an algorithm representing thermography with a long history, PPT has been applied as a signal processing technique for PT in almost all fields where TNDT is used. Applications of optical-infrared thermography are numerous and in different fields. Some typical applications include: detection of the subsurface defect and surface crack; evaluation of coating thickness; detection of inclusion and delamination in materials; evaluation of dissimilar metal joint, such as adhesively bonded and weld joints; detection of steel corrosion; internal defects NDT&E of aircraft components; evaluation of materials such as metals, non-metal and composite; inspection of the nuclear power plant, solar cells, and electrical installation control; and assessment of cultural heritage objects.
Recently, in recent literature, studies have been conducted to detect and evaluate defects by modifying the PPT algorithm. In [56], two modified algorithms for PPT were defined. A first algorithm is defined using a frequency-dependent Gaussian window function. Furthermore, a second algorithm is defined using a rectangular window function. The algorithms were tested on synthetic signals modeling a subsurface cylindrical defect in a plate and experimentally by PT on steel and a polymer sample. As a result, a significantly enhanced contrast-to-noise ratio (CNR) from the defects was obtained for higher analysis frequencies.
Thermal imaging cameras are very sensitive to noise and need to new processing methods in PPT algorithms. Fleuret et al., inspired by Maldague’s work, investigated a feature-based approach based on single–signal reconstruction for defect detection. Although this approach was very sensitive to noise, promising results were obtained. In [57], a phase and time-domain tomography for defecting defects in composite materials was proposed. In general, PPT requires the evaluation of multiple-phase images at different frequencies to obtain an in-depth evaluation of the sample. However, the selection and subsequent evaluation of these images is cumbered by some and not always straightforward. In order to improve these shortcomings, [58] introduced an Adaptive Spectral Band Integration (ASBI) processing. The technique is more powerful than the PPT and offers a better SNR even for barely visible defects. It also returns a single index map of the defects for a given sequence, making it easier to interpret.

4.2. Advances of PCT

With the PPT described in the previous section, PCT is most applicable for PT data processing. PPT transforms the image sequence into the Fourier (frequency) domain, and PCT applies PCA to the image sequence to extract the most meaningful frames.
Weng et al. [59] introduced Candid Covariance-free Principal Component Analysis (CCIPCA). This method is a fast Incremental Principal Component Analysis (IPCA), used to compute the principal components of a sequence of samples incrementally without estimating the covariance matrix. After that, Yousefi et al. proposed Candid Covariance-free Principal Thermography based on CCIPCA. This approach decomposes the defects of the sample with the K-medoids clustering method based on the RGB of the PCT results. In addition, shorter calculations are applied to estimate the covariance command and singular value decomposition (SVD). The results of CCIPCT showed promising results in simplifying computational complexity while increasing the number of data acquisition frames. In addition, Yousefi et al. [60] introduced Sparse Principal Component Analysis (RPCA)-based K-means clustering on improving the noise of PCT and CCIPCT results. This approach increased the robustness due to the norm addition terms to the PCA linear transformation and improved noise significantly compared to the existing technique. Wu et al. [61] proposed the Sparse Principal Component Thermography (SPCT), an application of the SPCA to PT. They showed that SPCT outperforms existing techniques with high computational performance. Wen et al. [62,63] introduced an improved version of SPCT called Edge-Group Sparse Principal Component Thermography (ESPCT) that can preserve the spatial connectivity of thermal image pixels. They showed in experiments conducted on marquetry sample that ESPCT results provide higher contrast and SNR than PCT and SPCT.
Yousefi et al. [64,65,66] introduced the Low-rank SPCT and applied several Non-negative Matrix Factorization (NMF) approaches. They conducted a comparative analysis on low-rank matrix approximation using the NMF approach and showed more promising results than other component-based (PCT, CCIPCT, SCPT) methods.
Many PCT studies have focused mainly on improving the contrast of defects and reducing the quantity of data. Recently, Independent Component Analysis (IPCA) has been attracting attention, and various approaches have been proposed to solve ICA [67]. In [68], Fleuret et al. investigated several recent ICA methods and evaluated their influence on PT data compared with the state-of-the-art methods. They found that ICA outperformed PCT for small defects and that the frequency of data acquisition and ICA methods had a significant influence on the results.

4.3. Advances of TSR

Shepard et al. described the dependence of extended interface detection on the ratio of layer thermal effectivities [69] and added the aspect ratio dependence for discrete defects [70]. Like PPT and PCT, TSR is also an algorithm widely used recently, providing improvements in noise reduction and detecting defects. The acquisition procedure required to apply this post-processing should be a PT. Generally, TSR consists of using a low-order polynomial function to fit the profile of the cooling process belonging to the temperature evolution of each pixel of the thermal image tested over a specific period. A change in effective thermal diffusivity characterizes defect detection with conventional TSR. Recently, Schager et al. [71] studied an extended TSR technique that can automatically segment defects into defects in the sound domain and generate defect maps by utilizing the signal characteristics of defects. They showed that the defect map provides an estimate of the depth of the defect and is inexpensive to compute. Roche et al. [72] introduced a new approach to TSR. Instead of analyzing the time-derivate images, they proposed to utilize the coefficient images generated from each term of the differential equation to detect all defects.
Feng et al. [73] proposed a hybrid of TSR and Automatic Seeded Region Growing (ASRG) algorithm for thermal image signal processing. The proposed approach significantly reduced the uneven illuminance and improved the detectability. They showed improved detection resolution and were useful for the automatic selection of regions suspected of being defective. In addition, the ASRG algorithm reliably extracts the internal defect information and improves the contrast between the defect area and the sound area. Ratsakou et al. [74] proposed combining TSR and Canny shape-reconstruction algorithms for defect characterization. According to the TSR technique, the approach consists of fitting the raw thermographic images to a low-degree polynomial in the log-log representation of the time axis and then applying the Canny algorithm to reconstruct the original signals. The proposed juxtaposition of the two methods benefits from the inherent signal denoising and compression of the TSR algorithm, thus enhancing the performance of the overall reconstruction process.

4.4. Advances of DWT

Ahmad et al. [75] proposed the detection of damage to the cylindrical shell using DWT analysis in a post-processing technique based on active IRT as one of the NDT. ABAQUS simulation was used to analyze the transient heat transfer problem of the damaged double-sided shell. Afterward, 1D- and 2D-DWT were applied to emphasize the location of damage to the thermal response of the structure, and a deep neural network was used to reduce image noise. Khaleel et al. [76] proposed a method for extracting features from the histogram of oriented gradients (HOG) coefficient vectors using IRT and reducing HOG vectors by combining continuous coefficients. Therefore, the sub-band HH was obtained using 2D-DWT, and the image’s desired feature extraction was performed. In addition, a technique for classifying normal and abnormal using the Support Vector Machine (SVM) binarization classification method is presented. Anurag et al. [77] proposed an automated defect detection technique for bearings of rotating machines using IRT. The thermal image was filtered with 2D-DWT, and detectability was improved using PCA. Through this, images were acquired for multi-resolution analysis in the time and frequency domains. Ranjit et al. [78] presented experimental results for shape and size analysis at various depth stages of GFRP composites using LIT. To improve the SNR of inclusions, PCA and DWT techniques based on pixel-level data fusion were applied. As a result, it was demonstrated that the higher the frequency range in the region where inclusions are detected, the more significant the improvement in the SNR value.

4.5. Advances of DAC

Quang et al. [79] proposed depth characterization of delamination defects on concrete’s front and back surfaces using a PT-based DAC. Comparative analysis of SNR values was performed by applying thermal contrast, histogram equalization, and PPT and FFT to the raw image. In addition, predictive characterization analysis of the size and depth of delamination defects was performed using linear regression analysis.
Xiangning et al. [80] proposed an intelligent diagnostic system based on active infrared thermal imaging for solder joint inspection. TSR and DAC processing techniques were applied to improve the SNR of images acquired by IRT. After that, the hot spots of the solder balls were classified, and statistical features were extracted using the K-means algorithm, and it was suggested that it is an efficient inspection technique. Babar et al. [81] presented factors affecting the heat flux and wind velocity thermal contrast of the surface of the bridge deck by applying the IRT technique to analyze the optimal inspection time for various geometrical properties of delamination. To compare and analyze the data of experiments and simulations, the validity was verified using DAC. Poelman et al. [82] proposed a flash lamp’s damage characterization of CFRP composites based on IRT. The measured thermal image sequence was evaluated, and comparative analysis was performed using DAC, PPT, and PCT signal processing.

5. IRT Trends

5.1. IRT Utilized Deep Learning

In recent years, it has been a trend that IRT and other technologies are integrated and utilized, and research is being conducted. Deep learning is an emerging area of machine learning (ML) research. Recently, interest in IRT technology incorporating deep learning has been emerging. Deep learning refers to a set of machine learning algorithms that attempt to summarize critical contents or functions in high-level data (big data or complex data) through a combination of non-linear transformation methods. In [83], a system for predicting the depth of defects in composites obtained through PT and COMSOL simulations using a deep learning model was presented. Fang et al. [84] conducted an evaluation of the POD improvement of CFRP composites by collecting data obtained from simulations and PT experiments based on Mask-RCNN. Marani et al. [85] used step-heated thermography to normalize the temperature profile of GFRP laminate defects and presented an efficient inspection technique for high-sensitivity specimens by applying deep learning for the characterization of difficult-to-detect defect areas. Bang et al. [86] proposed various detection techniques for images with various types of defects using Faster RNCC. Hu et al. [87] conducted a comparative analysis of POD based on RNCC after applying various types of signal processing to images acquired using the ECPT technique. Wei et al. [88], by grafting a deep neural network to pulsed infrared thermography, conducted a study to detect impact damage of curved laminates exposed to a thermal stress cycle and subsequent ballistic impact and segment them into medium and long wave infrared sequences.

5.2. IRT Utilized Unmanned System

Recently, the study has been actively conducted to integrate an Unmanned Aerial Vehicle (UAV) or drone into IRT to enable inspection in an environment that is difficult for inspectors to access. UAV refers to a vehicle that flies automatically or semi-automatically according to a pre-programmed route without an actual inspector boarding it. Carvalho et al. [89] conducted a semi-automatic examination of accessibility and mobility using a system equipped with an infrared camera on the UAV. Deane et al. [90] conducted a study on the detection of defects in aerospace structures that reduced inspection time and cost by performing PPT and PCT signal processing on images acquired using UAV. Pant et al. [91] reduced unnecessary motion by using Black Border (BB) and evaluated the stabilization of the Multi-Scale Structural Similarity (MS-SSIM) algorithm of images acquired by active IRT. Omar et al. [92] conducted a surface inspection of a concrete structure using an IRT-based UAV and presented a mapping image mechanism for delamination detection by applying a threshold algorithm. Cheng et al. [93] presented a framework applying deep learning for automatic delamination profiling by utilizing IRT for applications based on limited image data acquired by UAV experiments with infrared cameras. Genest et al. [94] evaluated stabilization technology for aircraft applications using UAV-based active infrared thermography. They also performed foreign body detection studies in lightweight composites utilizing terahertz imaging techniques.

5.3. Active Thermography for Enhanced Detectability

The IRT technique, alone or in combination with other NDT techniques, has emerged as a good alternative for the evaluation of the condition of “invisible” structures and materials. Some of the recent studies on active infrared thermography are as follows. Kim et al. [78,95,96] conducted the quantitative evaluation of defects on the backside of composite materials, coating thickness, and metallic materials using thermography and conducted a study to improve detectability by applying signal processing to images. They also presented a defect detection mechanism by applying an automated algorithm through binarization processing utilizing threshold values. Ibarra-Castanedo et al. [97,98] performed a study on the inspection of composite materials for aircraft applications using integrated infrared thermography. They also conducted automated defect detection studies utilizing learning algorithms. Paoletti et al. [99,100] performed a comparative study of coating thickness and non-destructive testing techniques to evaluate ceramic materials. They also performed broadband infrared imaging analysis studies in the NIR-MIR-FIR region. Laureti et al. [101] conducted a study of delamination detection of glass/silicon composites using active infrared thermography and ultrasound examination, and it was demonstrated that the modulated frequency chirped signal and pulse compression can successfully be utilized for delamination detection. Fernandes et al. [102,103] conducted a defect detection study of a 3-dimensional hybrid composite structure using infrared thermography. They also presented a technique for the experimental analysis of composites by presenting thermography with a mixture of optical-mechanical excitation.
Yang et al. [104,105] performed electromagnetic-thermal mixed infrared thermography studies using pulsed and transient eddy current thermography. They also presented a thermal imaging technique incorporating electromagnetic waves to inspect and diagnose composites utilized in industrial applications. He et al. [106,107] performed a study to measure defects and geometrical profiles of motors using non-destructive eddy current pulsed thermography. They described the current status of infrared thermal imaging technology applying deep learning and the progress and trend of fault diagnosis. Tian et al. [108,109] performed a study on a fault diagnosis system for composites composed of multiple physical structures using pulsed eddy current thermography. They also performed imaging studies for visualization of this lateral defect.
Sfarra et al. [110,111] performed research on damage behavior, deformation measurement, and thermal stress measurement of building structures and composites using hybrid infrared thermography technology. Barreira et al. [112] performed an emissivity evaluation study of black tape to measure the exact emissivity using infrared thermography and radiometer. Through this, the degree of influence on the emissivity according to the moisture content of the building material was confirmed. In addition, in [113], pulse compression infrared thermography technique was used to acquire data on the internal structure, and it was used as a heat source to minimize a low-power light emitting diode (LED) chip whose emission was modulated through a noise sequence. In addition, it shows how to maximize the number of objects by applying a statistical algorithm (PCA and ICA), and proposes a clear mapping technique that displays both surface and interior in-depth information at a glance. Lerma et al. [114] conducted a study to evaluate the risk of condensation and identify the period and area affected by the building by comparing the NDT techniques of temperature and relative humidity sensors, CFD and IRT. Garrido et al. [115], in order to detect and classify moisture on the inner wall of a building according to its severity, proposed a method combining infrared thermography and GRP (Ground-Penetrating Radar), and a study was conducted to detect the movement of moisture on the surface and the point of accumulation of moisture inside the building. Lopez et al. [116,117] researched on the minimization and detection of reflectance in thermal images. They also presented a high-level signal processing technique for the monitoring of chemical plants. Sannikov et al. [118] conducted a study in which induction heating and resistance heating were used to excite the corroded rebar, and thermal property evaluation was conducted by monitoring the dynamic temperature distribution using infrared thermography.
Ahmadi et al. [119] proposed a virtual wave-based image processing technique combining three different approaches to significantly improve the defect reconstruction of active thermal imaging tests. The combination of photothermal structured illumination (SI) measurements and virtual-wave (VW) plus iterative joint sparsity (IJOSP) image reconstruction represented a novel super resolution (SR) reconstruction technique for subsurface defects in metals. They applied a stainless-steel sample with internal defects to evaluate the proposed treatment technique. As a result, the approach showed at least four times better spatial resolution compared to conventional thermal reconstruction techniques.
Moskovchenko et al. [120] introduced a quantitative evaluation technique for coating thickness using the apparent thermal effusivity method. The proposed algorithm in pulsed thermography is based on determining the threshold of apparent utilization that can be found in a specific coating-on-substrate structure. They demonstrated the effectiveness of the proposed approach by testing and analyzing thermally-sprayed coating sample. Svantner et al. [121] introduced a time-power transformation method for quantitative evaluation of coating thickness using flash-pulse thermography. They demonstrated that the measured thermal response approximation had a significant effect on the quantitative results of thermal imaging, and showed that the exponential decay function could be well utilized for the thermal imaging data.
Hu et al. [122], in order to improve the sequence processing and detectability of infrared thermography, proposed a framework by applying a sparse pattern extraction algorithm to reduce the data dimension and improve the contrast between the cropping operator and the defect region. Gavrilov et al. [37] proposed an approach to isolate independent image patterns (circular pattern) from a set of principal component images based on infrared thermography technology, and presented it through application of composite inspection and non-invasive analysis of works of art.

6. Conclusions

This paper presented an overview of pulsed thermography signal processing techniques recently used for non-destructive evaluation. Pulsed thermographic methods are today the most widely used infrared thermography NDT application. Flaws and damages such as crack, subsurface defect, delamination, and disbond are inevitable during either fabrication or lifetime of a structure or component. Thus, NDT is required to prevent failures and increase the reliability of structures and/or components in both manufacturing and service. IRT NDTs have shown great potential and benefits with faster inspection rates, higher resolution and sensitivity, and the possibility of defect detection. PPT, PCT, TSR, DWT, and DAC, typical signal processing technologies for pulsed thermographic testing, have enhanced significant thermographic data quality. Each signal processing method is based on a totally different principle. In this work, a fully in-depth and comprehensive review of these pulsed thermography and signal processing techniques for NDT&E was reported based on an orderly and concise literature survey. Next, the developments of thermography NDT and signal processing were reviewed. Then, the fundamental concepts of TSR, PPT, PCT, DWT, and DAC were reviewed for the signal processing and analysis of thermal images. After that, some signal processing latest advances for pulsed thermography testing were reviewed. At last, some research trends in thermography NDT were reviewed, such as IR integration with other technologies.

Author Contributions

Conceptualization, W.K. and Y.C.; Formal analysis, Y.C. and S.L.; Funding acquisition, W.K.; Investigation, Y.C. and S.L.; Methodology, W.K. and Y.C.; Project administration, W.K.; Resources, W.K.; Software, Y.C. and S.L.; Supervision, W.K.; Writing—original draft, Y.C. and S.L.; Writing—review and editing, W.K. All authors have read and agreed to the published version of the manuscript.

Funding

This work was supported by the National Research Foundation of Korea (NRF–2019R1F1A1061328) funded by the Korean Government, Ministry of Education, Science and Technology (MEST).

Institutional Review Board Statement

Not applicable.

Informed Consent Statement

Not applicable.

Data Availability Statement

Due to the nature of this research, participants of this study did not agree for their data to be shared publicly and only available upon reasonable request.

Conflicts of Interest

The authors declare no conflict of interest.

References

  1. Balayssac, J.-P.; Laurens, S.; Arliguie, G.; Breysse, D.; Garnier, V.; Dérobert, X.; Piwakowski, B. Description of the general outlines of the French project SENSO—Quality assessment and limits of different NDT methods. Constr. Build. Mater. 2012, 35, 131–138. [Google Scholar] [CrossRef]
  2. Maldague, X.P. Introduction to NDT by Active Infrared Thermography. Mater. Eval. 2002, 60, 1060–1073. [Google Scholar]
  3. Shull, P.J. Nondestructive Evaluation: Theory, Techniques, and Applications; CRC Press: Boca Raton, FL, USA, 2002. [Google Scholar]
  4. Daryabor, P.; Safizadeh, M. Image fusion of ultrasonic and thermographic inspection of carbon/epoxy patches bonded to an aluminum plate. NDT E Int. 2017, 90, 1–10. [Google Scholar] [CrossRef]
  5. Vollmer, M.; Möllmann, K. Infrared Thermal Imaging: Fundamentals, Research and Applications; John Wiley & Sons: Hoboken, NJ, USA, 2017. [Google Scholar]
  6. Maldague, X. Theory and Practice of Infrared Technology for Nondestructive Testing; John Wiley & Sons: Hoboken, NJ, USA, 2001. [Google Scholar]
  7. Qu, Z.; Jiang, P.; Zhang, W. Development and Application of Infrared Thermography Non-destructive Testing Techniques. Sensors 2020, 20, 3851. [Google Scholar] [CrossRef] [PubMed]
  8. Wiecek, B. Review on Thermal Image Processing for Passive and Active Thermography. In Proceedings of the 2005 IEEE Engineering in Medicine and Biology 27th Annual Conference, Shanghai, China, 1–4 September 2005; pp. 686–689. [Google Scholar]
  9. Vavilov, V.; Pawar, S. A novel approach for one-sided thermal nondestructive testing of composites by using infrared thermography. Polym. Test. 2015, 44, 224–233. [Google Scholar] [CrossRef]
  10. Bates, D.; Smith, G.; Lu, D.; Hewitt, J. Rapid thermal non-destructive testing of aircraft components. Compos. Part B Eng. 2000, 31, 175–185. [Google Scholar] [CrossRef]
  11. Ranjit, S.; Kang, K.; Kim, W. Investigation of lock-in infrared thermography for evaluation of subsurface defects size and depth. Int. J. Precis. Eng. Manuf. 2015, 16, 2255–2264. [Google Scholar] [CrossRef]
  12. Shrestha, R.; Kim, W. Evaluation of coating thickness by thermal wave imaging: A comparative study of pulsed and lock-in infrared thermography—Part II: Experimental investigation. Infrared Phys. Technol. 2018, 92, 24–29. [Google Scholar] [CrossRef]
  13. Fedala, Y.; Streza, M.; Sepulveda, F.; Roger, J.-P.; Tessier, G.; Boué, C. Infrared Lock-in Thermography Crack Localization on Metallic Surfaces for Industrial Diagnosis. J. Nondestruct. Eval. 2013, 33, 335–341. [Google Scholar] [CrossRef]
  14. Parker, W.J.; Jenkins, R.J.; Butler, C.P.; Abbott, G.L. Flash Method of Determining Thermal Diffusivity, Heat Capacity, and Thermal Conductivity. J. Appl. Phys. 1961, 32, 1679–1684. [Google Scholar] [CrossRef]
  15. Ibarra-Castanedo, C.; Maldague, X. Pulsed Phase Thermography Reviewed. Quant. Infrared. Thermogr. J. 2004, 1, 47–70. [Google Scholar] [CrossRef]
  16. Marinetti, S.; Grinzato, E.; Bison, P.G.; Bozzi, E.; Chimenti, M.; Pieri, G.; Salvetti, O. Statistical Analysis of IR Thermographic Sequences by PCA. Infrared Phys. Technol. 2004, 46, 85–91. [Google Scholar] [CrossRef]
  17. Omar, M.A.; Zhou, Y. A Quantitative Review of Three Flash Thermography Processing Routines. Infrared Phys. Technol. 2008, 51, 300–306. [Google Scholar] [CrossRef]
  18. Xiao, X.; Gao, B.; yun Tian, G.; qing Wang, K. Fusion Model of Inductive Thermography and Ultrasound for Nondestructive Testing. Infrared Phys. Technol. 2019, 101, 162–170. [Google Scholar] [CrossRef]
  19. Niola, V.; Quaremba, G.; Amoresano, A. A Study on Infrared Thermography Processed trough the Wavelet Transform. In Proceedings of the 8th WSEAS International Conference on System Science and Simulation in Engineering, Genova, Italy, 17–19 October 2009; ICOSSSE. pp. 57–62. [Google Scholar]
  20. Shrestha, R.; Kim, W. Evaluation of coating thickness by thermal wave imaging: A comparative study of pulsed and lock-in infrared thermography—Part I: Simulation. Infrared Phys. Technol. 2017, 83, 124–131. [Google Scholar] [CrossRef]
  21. Yang, R.; He, Y. Optically and non-optically excited thermography for composites: A review. Infrared Phys. Technol. 2016, 75, 26–50. [Google Scholar] [CrossRef]
  22. Maldague, X.; Moore, P.O. ASNT Handbook. Infrared and Thermal Testing; ASNT Press: Columbus, OH, USA, 2001; Volume 3. [Google Scholar]
  23. Czichos, H. Handbook of Technical Diagnostics: Fundamentals and Application to Structures and Systems; Springer Science & Business Media: Berlin/Heidelberg, Germany, 2013. [Google Scholar]
  24. Fazeli, H.; Mirzaei, M. Shape identification problems on detecting of defects in a solid body using inverse heat conduction approach. J. Mech. Sci. Technol. 2012, 26, 3681–3690. [Google Scholar] [CrossRef]
  25. Meola, C.; Boccardi, S.; Carlomagno, G.M. Infrared Thermography in the Evaluation of Aerospace Composite Materials: Infrared Thermography to Composites; Woodhead Publishing: Sawston, UK, 2016. [Google Scholar]
  26. Hung, Y.; Chen, Y.; Ng, S.P.; Liu, L.; Huang, Y.; Luk, B.L.; Ip, R.; Wu, L.; Chung, P. Review and comparison of shearography and active thermography for nondestructive evaluation. Mater. Sci. Eng. R Rep. 2009, 64, 73–112. [Google Scholar] [CrossRef] [Green Version]
  27. Peeters, J.; Steenackers, G.; Sfarra, S.; Legrand, S.; Ibarra-Castanedo, C.; Janssens, K.; Van Der Snickt, G. IR Reflectography and Active Thermography on Artworks: The Added Value of the 1.5–3 µm Band. Appl. Sci. 2018, 8, 50. [Google Scholar] [CrossRef] [Green Version]
  28. Ciampa, F.; Mahmoodi, P.; Pinto, F.; Meo, M. Recent Advances in Active Infrared Thermography for Non-Destructive Testing of Aerospace Components. Sensors 2018, 18, 609. [Google Scholar] [CrossRef] [PubMed] [Green Version]
  29. Doshvarpassand, S.; Wu, C.; Wang, X. An overview of corrosion defect characterization using active infrared thermography. Infrared Phys. Technol. 2018, 96, 366–389. [Google Scholar] [CrossRef]
  30. Ishikawa, M.; Hatta, H.; Habuka, Y.; Fukui, R.; Utsunomiya, S. Detecting deeper defects using pulse phase thermography. Infrared Phys. Technol. 2013, 57, 42–49. [Google Scholar] [CrossRef]
  31. Ibarra-Castanedo, C.; Maldague, X.P. Review of Pulsed Phase Thermography. In Thermosense: Thermal Infrared Applications XXXVII; International Society for Optics and Photonics: Bellingham, WA, USA, 2015; p. 94850T. [Google Scholar]
  32. Maldague, X.; Galmiche, F.; Ziadi, A. Advances in pulsed phase thermography. Infrared Phys. Technol. 2002, 43, 175–181. [Google Scholar] [CrossRef] [Green Version]
  33. Chung, Y.; Shrestha, R.; Lee, S.; Kim, W. Thermographic Inspection of Internal Defects in Steel Structures: Analysis of Signal Processing Techniques in Pulsed Thermography. Sensors 2020, 20, 6015. [Google Scholar] [CrossRef]
  34. Ibarra-Castanedo, C. Quantitative Subsurface Defect Evaluation by Pulsed Phase Thermography: Depth Retrieval with the Phase; Faculty of Science and Engineering—Université Laval: Quebec, QC, Canada, 2005. [Google Scholar]
  35. Meola, C.; Carlomagno, G.M.; Giorleo, L. The use of infrared thermography for materials characterization. J. Mater. Process. Technol. 2004, 155–156, 1132–1137. [Google Scholar] [CrossRef]
  36. Rajic, N. Principal Component Thermography for Flaw Contrast Enhancement and Flaw Depth Characterisation in Composite Structures. Compos. Struct. 2002, 58, 521. [Google Scholar] [CrossRef]
  37. Gavrilov, D.; Maev, R. Extraction of Independent Structural Images for Principal Component Thermography. Appl. Sci. 2018, 8, 459. [Google Scholar] [CrossRef] [Green Version]
  38. Thomson, R.E.; Emery, W.J. Data Analysis Methods in Physical Oceanography, 3rd ed.; Elsevier Inc.: Amsterdam, The Netherlands, 2014; ISBN 9780123877833. [Google Scholar]
  39. Milovanović, B.; Gaši, M.; Gumbarević, S. Principal Component Thermography for Defect Detection in Concrete. Sensors 2020, 20, 3891. [Google Scholar] [CrossRef] [PubMed]
  40. Shepard, S.M.; Lhota, J.R.; Rubadeux, B.A.; Wang, D.; Ahmed, T. Reconstruction and enhancement of active thermographic image sequences. Opt. Eng. 2003, 42, 1337–1343. [Google Scholar] [CrossRef]
  41. Siegel, J.E.; Beemer, M.F.; Shepard, S.M. Automated Non-Destructive Inspection of Fused Filament Fabrica-tion Components using Thermographic Signal Reconstruction. Addit. Manuf. 2020, 31, 100923. [Google Scholar]
  42. Balageas, D.L.; Roche, J.-M.; Leroy, F.-H.; Liu, W.-M.; Gorbach, A.M. The thermographic signal reconstruction method: A powerful tool for the enhancement of transient thermographic images. Biocybern. Biomed. Eng. 2014, 35, 1–9. [Google Scholar] [CrossRef] [Green Version]
  43. Alvarez-Restrepo, C.A.; Benitez-Restrepo, H.D.; Tobón, L.E. Characterization of Defects of Pulsed Ther-mography Inspections by Orthogonal Polynomial Decomposition. NDT E Int. 2017, 91, 9–21. [Google Scholar] [CrossRef]
  44. Balageas, D.; Chapuis, B.; Deban, G.; Passilly, F. Improvement of the Detection of Defects by Pulse Ther-mography Thanks to the TSR Approach in the Case of a Smart Composite Repair Patch. Quant. Infrared. Thermogr. J. 2010, 7, 167–187. [Google Scholar] [CrossRef]
  45. Ibarra-Castanedo, C.; Piau, J.; Guilbert, S.; Avdelidis, N.P.; Genest, M.; Bendada, A.; Maldague, X.P. Comparative Study of Active Thermography Techniques for the Nondestructive Evaluation of Honeycomb Structures. Res. Nondestr. Eval. 2009, 20, 1–131. [Google Scholar] [CrossRef]
  46. Shepard, S.M. Advances in pulsed thermography. In Thermosense XXIII; International Society for Optics and Photonics: Bellingham, WA, USA, 2001; Volume 4360, pp. 511–516. [Google Scholar] [CrossRef]
  47. Galmiche, F.; Maldague, X. Depth Defect Retrieval using the Wavelet Pulsed Phased Thermography. In Proceedings of the 2000 International Conference on Quantitative InfraRed Thermography, Reims, France, 18–21 July 2000. [Google Scholar]
  48. Zauner, G.; Mayr, G.; Hendorfer, G. Application of wavelet analysis in active thermography for non-destructive testing of CFRP composites. Wavelet Appl. Ind. Process. IV 2006, 6383, 63830. [Google Scholar] [CrossRef]
  49. Liu, J.; Qin, L.; Tang, Q.; Wang, Y. Experimental study of inspection on a metal plate with defect using ultrasound lock-in thermographic technique. Infrared Phys. Technol. 2012, 55, 284–291. [Google Scholar] [CrossRef]
  50. Shrestha, R.; Chung, Y.; Kim, W. Wavelet transform applied to lock-in thermographic data for detection of inclusions in composite structures: Simulation and experimental studies. Infrared Phys. Technol. 2018, 96, 98–112. [Google Scholar] [CrossRef]
  51. Susa, M.; Benítez, H.D.; Ibarra-Castanedo, C.; Loaiza, H.; Bendada, H.; Maldague, X. Phase contrast using a differentiated absolute contrast method. Quant. Infrared Thermogr. J. 2006, 3, 219–230. [Google Scholar] [CrossRef]
  52. Benitez, H.; Maldague, X.; Ibarra-Castanedo, C.; Loaiza, H.; Bendada, A.; Caicedo, E. Modified Differential Absolute Contrast using Thermal Quadrupoles for the Nondestructive Testing of Finite Thickness Specimens by Infrared Thermography. In Proceedings of the 2006 Canadian Conference on Electrical and Computer Engineering, Ottawa, ON, Canada, 7–10 May 2006; pp. 1039–1042. [Google Scholar] [CrossRef]
  53. González, D.A.; Ibarra-Castanedo, C.; Pilla, M.; Klein, M.; López-Higuera, J.M.; Maldague, X. Automatic Interpolated Differentiated Absolute Contrast Algorithm for the Analysis of Pulsed Thermographic Sequences. In Proceedings of the 2004 International Conference on Quantitative InfraRed Thermography, Brussels, Belgium, 5–8 July 2004. [Google Scholar]
  54. Panella, F.; Pirinu, A.; Dattoma, V. A Brief Review and Advances of Thermographic Image—Processing Methods for IRT Inspection: A Case of Study on GFRP Plate. Exp. Tech. 2020, 45, 429–443. [Google Scholar] [CrossRef]
  55. Pilla, M.; Klein, M.; Maldague, X.; Salerno, A. New Absolute Contrast for Pulsed Thermography. In Proceedings of the 2002 International Conference on Quantitative InfraRed Thermography, Collegium Ragusinum, Dubrovnik, Croatia, 24–27 September 2002. [Google Scholar]
  56. Netzelmann, U.; Müller, D. Modified Pulse-Phase Thermography Algorithms for Improved Con-trast-to-Noise Ratio from Pulse-Excited Thermographic Sequences. NDT E Int. 2020, 116, 102325. [Google Scholar] [CrossRef]
  57. Vavilov, V.P.; Shiryaev, V.V.; Kuimova, M.V. Time- and Phase-Domain Thermal Tomography of Composites. Photonics 2018, 5, 31. [Google Scholar] [CrossRef] [Green Version]
  58. Poelman, G.; Hedayatrasa, S.; Segers, J.; Van Paepegem, W.; Kersemans, M. Adaptive Spectral Band Inte-gration in Flash Thermography: Enhanced Defect Detectability and Quantification in Composites. Compos. B. Eng. 2020, 202, 108305. [Google Scholar] [CrossRef]
  59. Weng, J.; Zhang, Y.; Hwang, W.-S. Candid covariance-free incremental principal component analysis. IEEE Trans. Pattern Anal. Mach. Intell. 2003, 25, 1034–1040. [Google Scholar] [CrossRef] [Green Version]
  60. Yousefi, B.; Sharifipour, H.M.; Castanedo, C.I.; Maldague, X.P.V. Automatic IRNDT inspection applying sparse PCA-based clustering. In Proceedings of the 2017 IEEE 30th Canadian Conference on Electrical and Computer Engineering (CCECE), Windsor, ON, Canada, 30 April–3 May 2017; pp. 1–4. [Google Scholar] [CrossRef]
  61. Wu, J.-Y.; Sfarra, S.; Yao, Y. Sparse Principal Component Thermography for Subsurface Defect Detection in Composite Products. IEEE Trans. Ind. Inform. 2018, 14, 5594–5600. [Google Scholar] [CrossRef]
  62. Wen, C.-M.; Sfarra, S.; Gargiulo, G.; Yao, Y. Edge-Group Sparse Principal Component Thermography for Defect Detection in an Ancient Marquetry Sample. Proceedings 2019, 27, 34. [Google Scholar] [CrossRef] [Green Version]
  63. Wen, C.-M.; Sfarra, S.; Gargiulo, G.; Yao, Y. Thermographic Data Analysis for Defect Detection by Imposing Spatial Connectivity and Sparsity Constraints in Principal Component Thermography. IEEE Trans. Ind. Inform. 2020, 17, 3901–3909. [Google Scholar] [CrossRef]
  64. Liu, K.; Ma, Z.; Liu, Y.; Yang, J.; Yao, Y. Enhanced Defect Detection in Carbon Fiber Reinforced Polymer Composites via Generative Kernel Principal Component Thermography. Polymers 2021, 13, 825. [Google Scholar] [CrossRef] [PubMed]
  65. Yousefi, B.; Castanedo, C.I.; Maldague, X.P.V. Measuring Heterogeneous Thermal Patterns in Infrared-Based Diagnostic Systems Using Sparse Low-Rank Matrix Approximation: Comparative Study. IEEE Trans. Instrum. Meas. 2021, 70, 1–9. [Google Scholar] [CrossRef]
  66. Yousefi, B.; Sfarra, S.; Sarasini, F.; Castanedo, C.I.; Maldague, X.P. Low-rank sparse principal component thermography (sparse-PCT): Comparative assessment on detection of subsurface defects. Infrared Phys. Technol. 2019, 98, 278–284. [Google Scholar] [CrossRef]
  67. Liu, Y.; Wu, J.-Y.; Liu, K.; Wen, H.-L.; Yao, Y.; Sfarra, S.; Zhao, C. Independent component thermography for non-destructive testing of defects in polymer composites. Meas. Sci. Technol. 2019, 30, 044006. [Google Scholar] [CrossRef]
  68. Fleuret, J.R.; Ebrahimi, S.; Ibarra-Castanedo, C.; Maldague, X.P.V. Independent Component Analysis Ap-plied on Pulsed Thermographic Data for Carbon Fiber Reinforced Plastic Inspection: A Comparative Study. Appl. Sci. 2021, 11, 4377. [Google Scholar] [CrossRef]
  69. Shepard, S.M.; Beemer, M.F. Advances in thermographic signal reconstruction. In Thermosense: Thermal Infrared Applications XXXVII; International Society for Optics and Photonics: Bellingham, WA, USA, 2015; p. 94850R. [Google Scholar] [CrossRef]
  70. Beemer, M.F.; Shepard, S.M. Aspect Ratio Considerations for Flat Bottom Hole Defects in Active Thermography. Quant. Infrared. Thermogr. J. 2018, 15, 1–16. [Google Scholar] [CrossRef]
  71. Schager, A.; Zauner, G.; Mayr, G.; Burgholzer, P. Extension of the Thermographic Signal Reconstruction Technique for an Automated Segmentation and Depth Estimation of Subsurface Defects. J. Imaging 2020, 6, 96. [Google Scholar] [CrossRef] [PubMed]
  72. Roche, J.M.; Leroy, F.H.; Balageas, D.L. Images of Thermographic Signal Reconstruction Coefficients: A Simple Way for Rapid and Efficient Detection of Discontinuities. Mater. Eval. 2014, 72, 73–82. [Google Scholar]
  73. Feng, Q.; Gao, B.; Lu, P.; Woo, W.L.; Yang, Y.; Fan, Y.; Qiu, X.; Gu, L. Automatic Seeded Region Growing for Thermography Debonding Detection of CFRP. NDT E Int. 2018, 99, 36–49. [Google Scholar] [CrossRef]
  74. Ratsakou, A.; Skarlatos, A.; Reboud, C.; Lesselier, D. Shape reconstruction of delamination defects using thermographic infrared signals based on an enhanced Canny approach. Infrared Phys. Technol. 2020, 111, 103527. [Google Scholar] [CrossRef]
  75. Parrany, A.M. Damage detection in circular cylindrical shells using active thermography and 2-D discrete wavelet analysis. Thin-Walled Struct. 2019, 136, 34–49. [Google Scholar] [CrossRef]
  76. Al-Rababah, K.; Mustaffa, M.R.; Doraisamy, S.C.; Khalid, F. Hybrid Discrete Wavelet Transform and Histogram of Oriented Gradients for Feature Extraction and Classification of Breast Dynamic Thermogram Sequences. In Proceedings of the 2021 Fifth International Conference on Information Retrieval and Knowledge Management (CAMP), Kuala Lumpur, Malaysia, 15–16 June 2021; pp. 31–35. [Google Scholar]
  77. Choudhary, A.; Goyal, D.; Letha, S.S. Infrared Thermography-Based Fault Diagnosis of Induction Motor Bearings Using Machine Learning. IEEE Sens. J. 2020, 21, 1727–1734. [Google Scholar] [CrossRef]
  78. Shrestha, R.; Kim, W. Non-destructive testing and evaluation of materials using active thermography and enhancement of signal to noise ratio through data fusion. Infrared Phys. Technol. 2018, 94, 78–84. [Google Scholar] [CrossRef]
  79. Tran, Q.H.; Huh, J.; Kang, C.; Lee, B.Y.; Kim, I.-T.; Ahn, J.-H. Detectability of Subsurface Defects with Different Width-to-Depth Ratios in Concrete Structures Using Pulsed Thermography. J. Nondestruct. Eval. 2018, 37, 32. [Google Scholar] [CrossRef]
  80. Lu, X.; He, Z.; Su, L.; Fan, M.; Liu, F.; Liao, G.; Shi, T. Detection of Micro Solder Balls using Active Thermography Technology and K-Means Algorithm. IEEE Trans. Industr. Inform. 2018, 14, 5620–5628. [Google Scholar] [CrossRef]
  81. Raja, B.N.K.; Miramini, S.; Duffield, C.; Sofi, M.; Mendis, P.; Zhang, L. The Influence of Ambient Environ-mental Conditions in Detecting Bridge Concrete Deck Delamination using Infrared Thermography (IRT). Struct. Control. Health Monit. 2020, 27, e2506. [Google Scholar] [CrossRef]
  82. Poelman, G.; Segers, J.; Poelman, G.; Hedayatrasa, S.; Segers, J.; Paepegem, W.V.; Kersemans, M. Application of Flash Thermography and Advanced Post-Processing Techniques for Rapid NDT of CFRP Aircraft Com-ponent: A Case Study. In Proceedings of the 11th Symposium on NDT in Aerospace, Saclay, France, 11–13 November 2019. [Google Scholar]
  83. Fang, Q.; Maldague, X. A Method of Defect Depth Estimation for Simulated Infrared Thermography Data with Deep Learning. Appl. Sci. 2020, 10, 6819. [Google Scholar] [CrossRef]
  84. Fang, Q.; Ibarra-Castanedo, C.; Maldague, X. Automatic Defects Segmentation and Identification by Deep Learning Algorithm with Pulsed Thermography: Synthetic and Experimental Data. Big Data Cogn. Comput. 2021, 5, 9. [Google Scholar] [CrossRef]
  85. Marani, R.; Palumbo, D.; Galietti, U.; D’Orazio, T. Deep learning for defect characterization in composite laminates inspected by step-heating thermography. Opt. Lasers Eng. 2021, 145, 106679. [Google Scholar] [CrossRef]
  86. Bang, H.-T.; Park, S.; Jeon, H. Defect identification in composite materials via thermography and deep learning techniques. Compos. Struct. 2020, 246, 112405. [Google Scholar] [CrossRef]
  87. Hu, J.; Xu, W.; Gao, B.; Tian, G.Y.; Wang, Y.; Wu, Y.; Yin, Y.; Chen, J. Pattern Deep Region Learning for Crack Detection in Thermography Diagnosis System. Metals 2018, 8, 612. [Google Scholar] [CrossRef] [Green Version]
  88. Wei, Z.; Fernandes, H.; Herrmann, H.-G.; Tarpani, J.R.; Osman, A. A Deep Learning Method for the Impact Damage Segmentation of Curve-Shaped CFRP Specimens Inspected by Infrared Thermography. Sensors 2021, 21, 395. [Google Scholar] [CrossRef]
  89. Carvalho, R.; Nascimento, R.; D’Angelo, T.; Delabrida, S.; GC Bianchi, A.; Oliveira, R.A.; Azpúrua, H.; Uzeda Garcia, L.G. A UAV-Based Framework for Semi-Automated Thermographic Inspection of Belt Conveyors in the Mining Industry. Sensors 2020, 20, 2243. [Google Scholar] [CrossRef] [Green Version]
  90. Deane, S.; Avdelidis, N.P.; Ibarra-Castanedo, C.; Zhang, H.; Nezhad, H.Y.; Williamson, A.A.; Mackley, T.; Davis, M.J.; Maldague, X.; Tsourdos, A. Application of NDT Thermographic Imaging of Aerospace Structures. Infrared Phys. Technol. 2019, 97, 456–466. [Google Scholar] [CrossRef] [Green Version]
  91. Pant, S.; Nooralishahi, P.; Avdelidis, N.P.; Ibarra-Castanedo, C.; Genest, M.; Deane, S.; Valdes, J.J.; Zolotas, A.; Maldague, X.P. Evaluation and Selection of Video Stabilization Techniques for UAV-Based Active Infrared Thermography Application. Sensors 2021, 21, 1604. [Google Scholar] [CrossRef] [PubMed]
  92. Omar, T.; Nehdi, M.L. Remote sensing of concrete bridge decks using unmanned aerial vehicle infrared thermography. Autom. Constr. 2017, 83, 360–371. [Google Scholar] [CrossRef]
  93. Cheng, C.; Shang, Z.; Shen, Z. Automatic Delamination Segmentation for Bridge Deck Based on Encod-er-Decoder Deep Learning through UAV-Based Thermography. NDT E Int. 2020, 116, 102341. [Google Scholar] [CrossRef]
  94. Alhammad, M.; Avdelidis, N.P.; Deane, S.; Ibarra-Castanedo, C.; Pant, S.; Nooralishahi, P.; Ahmadi, M.; Genest, M.; Zolotas, A.; Zanotti-Fragonara, L.; et al. Diagnosis of composite materials in aircraft applications: Towards a UAV active thermography inspection approach. In Thermosense: Thermal Infrared Applications XLIII; International Society for Optics and Photonics: Bellingham, WA, USA, 2021; Volume 11743, p. 1174306. [Google Scholar] [CrossRef]
  95. Lee, S.; Chung, Y.; Shrestha, R.; Kim, W. Automated Defect Detection Using Threshold Value Classification Based on Thermographic Inspection. Appl. Sci. 2021, 11, 7870. [Google Scholar] [CrossRef]
  96. Shrestha, R.; Park, J.; Kim, W. Application of thermal wave imaging and phase shifting method for defect detection in Stainless steel. Infrared Phys. Technol. 2016, 76, 676–683. [Google Scholar] [CrossRef]
  97. Fernandes, H.C.; Zhang, H.; Morioka, K.; Ibarra-Castanedo, C.; López, F.; Maldague, X.P.V.; Tarpani, J. Infrared thermography for CFRP inspection: Computational model and experimental results. In Thermosense: Thermal Infrared Applications XXXVIII; International Society for Optics and Photonics: Bellingham, WA, USA, 2016; Volume 9861. [Google Scholar] [CrossRef]
  98. López, F.; Sfarra, S.; Ibarra-Castanedo, C.; Paoletti, D.; Maldague, X. Integration of infrared and optical imaging techniques for the nondestructive inspection of aeronautic parts. In Thermosense: Thermal Infrared Applications XXXVII; International Society for Optics and Photonics: Bellingham, WA, USA, 2015; p. 948506. [Google Scholar] [CrossRef]
  99. Daffara, C.; Pezzati, L.; Ambrosini, D.; Paoletti, D.; Di Biase, R.; Mariotti, P.I.; Frosinini, C. Wide-band IR imaging in the NIR-MIR-FIR regions for in situ analysis of frescoes. In Thermosense: Thermal Infrared Applications XXXVII; International Society for Optics and Photonics: Bellingham, WA, USA, 2011; Volume 8084, p. 808406. [Google Scholar] [CrossRef]
  100. Sfarra, S.; Ibarra-Castanedo, C.; Bendada, A.; Maldague, X.; Ambrosini, D.; Paoletti, D. Comparative study for the nondestructive testing of advanced ceramic materials by infrared thermography and holographic interferometry. In Thermosense XXXII; International Society for Optics and Photonics: Bellingham, WA, USA, 2010; Volume 7661, p. 76610. [Google Scholar] [CrossRef]
  101. Laureti, S.; Rizwan, M.K.; Malekmohammadi, H.; Burrascano, P.; Natali, M.; Torre, L.; Rallini, M.; Puri, I.; Hutchins, D.; Ricci, M. Delamination Detection in Polymeric Ablative Materials Using Pulse-Compression Thermography and Air-Coupled Ultrasound. Sensors 2019, 19, 2198. [Google Scholar] [CrossRef] [Green Version]
  102. Fernandes, H.; Zhang, H.; Quirin, S.; Hu, J.; Schwarz, M.; Jost, H.; Herrmann, H. Infrared Thermographic Inspection of 3D Hybrid Aluminium-CFRP Composite using Different Spectral Bands and New Unsupervised Probabilistic Low-Rank Component Factorization Model. NDT E Int. 2021, 125, 102561. [Google Scholar] [CrossRef]
  103. Fernandesa, H.C.; Quirin, S.; Schwarz, M.; Herrmann, H.G. Infrared Thermography for Defect Detection on Aluminium-CFRP Hybrid 3D Structure. In Proceedings of the 15th International Conference on Quantitative Infrared Thermography, Porto, Portugal, 6–10 July 2020. [Google Scholar]
  104. Yang, R.; He, Y.; Mandelis, A.; Wang, N.; Wu, X.; Huang, S. Induction Infrared Thermography and Ther-mal-Wave-Radar Analysis for Imaging Inspection and Diagnosis of Blade Composites. IEEE Trans. Industr. Inform. 2018, 14, 5637–5647. [Google Scholar] [CrossRef]
  105. Yang, R.; He, Y.; Zhang, H.; Huang, S. Through Coating Imaging and Nondestructive Visualization Eval-uation of Early Marine Corrosion using Electromagnetic Induction Thermography. Ocean. Eng. 2018, 147, 277–288. [Google Scholar] [CrossRef]
  106. He, Y.; Deng, B.; Wang, H.; Cheng, L.; Zhou, K.; Cai, S.; Ciampa, F. Infrared machine vision and infrared thermography with deep learning: A review. Infrared Phys. Technol. 2021, 116, 103754. [Google Scholar] [CrossRef]
  107. Peng, Y.; Huang, S.; He, Y.; Guo, X. Eddy Current Pulsed Thermography for Noncontact Nondestructive Inspection of Motor Winding Defects. IEEE Sens. J. 2019, 20, 2625–2634. [Google Scholar] [CrossRef]
  108. Lu, X.; Yi, Q.; Tian, G.Y. A Comparison of Feature Extraction Techniques for Delamination of CFRP using Eddy Current Pulse-Compression Thermography. IEEE Sens. J. 2020, 20, 12415–12422. [Google Scholar] [CrossRef]
  109. Cheng, Y.H.H.; Liu, X.; Tian, G.Y.; Bai, L. Visual Detection of Subsurface Defects using Enhanced Magneto-Optic Imaging System. In Eighth International Symposium on Precision Engineering Measurement and Instrumentation; International Society for Optics and Photonics: Bellingham, WA, USA, 2013; p. 87591K. [Google Scholar]
  110. Sfarra, S.; Ambrosini, D.; Paoletti, D.; Nardi, I.; Pasqualoni, G. The Hybrid Thermography Approach Applied to Architectural Structures. In Optics for Arts, Architecture, and Archaeology VI; International Society for Optics and Photonics: Bellingham, WA, USA, 2017; p. 103310V. [Google Scholar] [CrossRef]
  111. Avdelidis, N.P.; Exarchos, D.; Vázquez, P.; Ibarra-Castanedo, C.; Sfarra, S.; Maldague, X.; Matikas, T.E. Fracture Behavior of Reinforced Aluminum Alloy Matrix Composites using Thermal Imaging Tools. In Thermosense: Thermal Infrared Applications XXXVIII; International Society for Optics and Photonics: Bellingham, WA, USA, 2016; p. 98610 K. [Google Scholar] [CrossRef]
  112. Barreira, E.; Almeida, R.M.S.F.; Simões, M.L. Emissivity of Building Materials for Infrared Measurements. Sensors 2021, 21, 1961. [Google Scholar] [CrossRef] [PubMed]
  113. Barreira, E.; Almeida, R.M.S.F.; L. Simões, M.; Rebelo, D. Quantitative Infrared Thermography to Evaluate the Humidification of Lightweight Concrete. Sensors 2020, 20, 1664. [Google Scholar] [CrossRef] [PubMed] [Green Version]
  114. Lerma, C.; Borràs, J.; Mas, Á.; Torner, M.; Vercher, J.; Gil, E. Evaluation of Hygrothermal Behaviour in Heritage Buildings through Sensors, CFD Modelling and IRT. Sensors 2021, 21, 566. [Google Scholar] [CrossRef]
  115. Garrido, I.; Solla, M.; Lagüela, S.; Fernández, N. IRT and GPR Techniques for Moisture Detection and Characterisation in Buildings. Sensors 2020, 20, 6421. [Google Scholar] [CrossRef]
  116. Lopez, F.; Huot, A. Advanced Signal Processing Applied to Thermographic Inspection of Petrochemical Furnaces. In Thermosense: Thermal Infrared Applications XLI; International Society for Optics and Photonics: Bellingham, WA, USA, 2019; Volume 11004, p. 1100407. [Google Scholar] [CrossRef]
  117. Nooralishahi, P.; Deane, S.; Lopez, F.; Ibarra-Castanedo, C.; Avdelidis, N.P.; Maldague, X. Reflectivity Detection and Reduction of Thermographic Images using Image Stitching Technique and its Applications on Remote Inspection. In Thermosense: Thermal Infrared Applications XLII; International Society for Optics and Photonics: Bellingham, WA, USA, 2020; p. 114090U. [Google Scholar]
  118. Sannikov, D.V.; Kolevatov, A.S.; Vavilov, V.P.; Kuimova, M.V. Evaluating the Quality of Reinforced Concrete Electric Railway Poles by Thermal Nondestructive Testing. Appl. Sci. 2018, 8, 222. [Google Scholar] [CrossRef] [Green Version]
  119. Ahmadi, S.; Thummerer, G.; Breitwieser, S.; Mayr, G.; Lecompagnon, J.; Burgholzer, P.; Jung, P.; Caire, G.; Ziegler, M. Multidimensional Reconstruction of Internal Defects in Additively Manufactured Steel Using Photothermal Super Resolution Combined with Virtual Wave-Based Image Processing. IEEE Trans. Ind. Inform. 2021, 17, 7368–7378. [Google Scholar] [CrossRef]
  120. Moskovchenko, A.; Vavilov, V.; Švantner, M.; Muzika, L.; Houdková, Š. Active IR Thermography Evalua-tion of Coating Thickness by Determining Apparent Thermal Effusivity. Materials 2020, 13, 4057. [Google Scholar] [CrossRef] [PubMed]
  121. Švantner, M.; Muzika, L.; Houdková, Š. Quantitative Inspection of Coating Thickness by Flash-Pulse Thermography and Time-Power Transformation Evaluation. Appl. Opt. 2020, 59, E29–E35. [Google Scholar] [CrossRef] [PubMed]
  122. Hu, J.; Zhang, H.; Sfarra, S.; Sergi, C.; Perilli, S.; Ibarra-Castanedo, C.; Tian, G.; Maldague, X. Enhanced Infrared Sparse Pattern Extraction and Usage for Impact Evaluation of Basalt-Carbon Hybrid Composites by Pulsed Thermography. Sensors 2020, 20, 7159. [Google Scholar] [CrossRef] [PubMed]
Figure 1. General schematic diagram of active thermography testing.
Applsci 11 12168 g001
Figure 2. Configuration of a pulsed thermography inspection system.
Applsci 11 12168 g002
Figure 3. Principle of signal processing by Principal Component Thermography (PCT): (a) Thermographic data conversion from a 3D sequence to a 2D A matrix in order to apply singular value decomposition (SVD); and (b) rearrangement of 2D U matrix into a 3D matrix containing the empirical orthogonal functions (EOFs).
Applsci 11 12168 g003
Figure 4. Principle of signal processing by Thermography Signal Reconstruction (TSR).
Applsci 11 12168 g004
Table 1. Summary of thermal heating devices most commonly used for active thermography for NDT application.
Thermal SourceIRT TerminologyAcronymMajor AdvantagesMajor Limitations
Photographic FlashesPulsed
Thermography
PT
-
Very fast inspection time (few ms)
-
Wide inspection area
-
High power energy
-
Beneficial for flat defects
-
Non-uniform heating
-
Relatively expensive
-
Limited to some field applications
Halogen LampLock-in
Thermography
LIT
-
Wide inspection area
-
Beneficial for flat defects
-
Less non-uniform heating and environmental factors Detecting defects located at various depths
-
Considering the optimal modulation frequency according to material properties
-
Long heating time
-
Limited to some field applications
Publisher’s Note: MDPI stays neutral with regard to jurisdictional claims in published maps and institutional affiliations.

