Article

Sources and Metal Pollution of Sediments from a Coastal Area of the Central Western Adriatic Sea (Southern Marche Region, Italy)

by
Federico Spagnoli
1,2,3,
Rocco De Marco
1,
Enrico Dinelli
4,
Emanuela Frapiccini
1,*,
Fabrizio Frontalini
5 and
Patrizia Giordano
6
1
National Research Council-Institute of Marine Biological Resources and Biotechnologies (CNR-IRBIM), Largo Fiera della Pesca, 60125 Ancona, Italy
2
Istituto per le Scienze Marine (ISMAR), Consiglio Nazionale delle Ricerche, Largo Fiera della Pesca 2, 60125 Ancona, Italy
3
Geology Division, School of Science and Technology, University of Camerino, Via Gentile III da Varano, 62032 Camerino, Italy
4
Dipartimento di Scienze Biologiche, Geologiche e Ambientali, Alma Mater Studiorum Università di Bologna, Piazza di Porta S. Donato 1, 40126 Bologna, Italy
5
Dipartimento di Scienze Pure e Applicate (DiSPeA), Campus Scientifico Enrico Mattei, Università degli Studi di Urbino “Carlo Bo”, Località Crocicchia, 61029 Urbino, Italy
6
Istituto di Scienze Polari, Consiglio Nazionale delle Ricerche, Via Gobetti 101, 40129 Bologna, Italy
*
Author to whom correspondence should be addressed.
Appl. Sci. 2021, 11(3), 1118; https://doi.org/10.3390/app11031118
Submission received: 22 December 2020 / Revised: 19 January 2021 / Accepted: 22 January 2021 / Published: 26 January 2021
(This article belongs to the Special Issue Transport, Persistence and Toxicity of Pollutants in the Sea)

Abstract

:
Sediments represent a critical compartment of marine coastal ecosystems due to the toxic and long-lasting effects of the contaminants buried therein. Here, we investigated the properties of surficial sediments in front of the Southern Marche Region coast (Central Adriatic Sea, Italy). The grain size of the surficial sediments was determined by X-ray sedigraphy. TN and OC contents were determined by elemental analysis. The concentrations of Al, Fe, Mg, K, S, Ca, Ti, P, Na, Mn, Mg, Li, As, Ba, Ga, Pb, Sr, and Zn were determined by ICP-OES to evaluate their spatial patterns and temporal trends. A Q-mode Factor Analyses was applied and resulted in the identification of three compositional facies (Padanic, Coastal, and Residual) characterized by common biogeochemical, mineralogical, sedimentological properties, transport pathway, and source. Some pollution indicators, such as the enrichment factor, the geoaccumulation index, and the pollution load index were calculated to assess the deviation from the natural background levels. The results showed a pollution by As and Ba due to the human activities in the 20th century. Furthermore, a general decreasing of Al, Ti, P, Co, Cr, Cu, Ga, Ni, Pb, Sc, V, and Y concentrations from the background levels suggested a change in the sedimentation processes during the last decades.

1. Introduction

The biogeochemical and sedimentological properties of bottom marine sediments are the results of complex interactions between their composition, sourcing areas, transport, depositional, and early diagenesis processes [1]. Additionally, anthropic activities by discharging contaminants can further influence the natural composition of the sediments. Considering all the factors affecting the biogeochemical and the sedimentological composition of the bottom marine sediments, information about the source area, the sedimentological processes, and the anthropic inputs can be inferred [2,3,4,5,6,7]. Wastewater discharges such as domestic wastes, drugs, fertilizers, and zootechnical byproducts represent the major anthropogenic contributions in marine coastal area [8]. Anthropogenic chemicals can be introduced into the marine environments by different sources (i.e., effluent treatment plants, accidental discharges, dumping, riverine inputs, surface runoff, atmospheric deposition, etc.) and then accumulate in sediments [9,10,11,12,13,14,15]. In coastal marine sediment, however, heavy metals might be sourced by anthropic activity or by natural sources [8,16] and could represent a serious hazard due to their toxicity, bioavailability and persistence [17,18]. Because of the adsorption, hydrolysis, and co-precipitation of metal ions, most of the water column metals are deposited in the marine sediment and only a small portion of these ions remains dissolved in the water column [19]. Then, marine sediments enriched in metals can release them by various remobilization processes to the water column [1].
Marine sediments are preferred over seawater for monitoring environmental quality because pollutants are much higher and less variable in time and space than in seawater, and they reflect in an integrated manner the pollution level in the area [7,20,21,22]. Marine sediments act not only as a reservoir of contaminants, but also serve as a source of toxicants to marine fauna. This can be due to the ingestion of bottom or resuspended sediment particles [23,24], or to the adsorption of solutes present in the pore waters and on the bottom. The solutes present near the bottom can be the consequence of diffusive or bio-irrigation fluxes or resuspension [1], resuspension that can be due to natural (by storms, waves, tidal currents) or anthropogenic (dredging, trawling) processes [25,26]. For these reasons, sediments are commonly targeted in marine pollution surveillance programs [27,28,29]. Generally, natural metal concentrations in sediments are not detrimental to inhabiting organisms [30]. For metabolism, organisms essentially require some key micronutrients (i.e., iron, copper, zinc, manganese, cobalt) [31] but at high metals concentration can pose a toxicological threat to marine organisms [8,32,33]. Sediment features such as mineralogy, sediment texture, metal properties, pH, organic matter, oxidation–reduction potential, and adsorption and desorption processes are important controlling factors for the accumulation and availability of heavy metals in the sediment [34,35,36,37,38,39,40,41,42]. Thus, sediments are considered as sources of heavy metals in marine environments and play a key role in their deposition and transmission along the trophic chain and must be therefore monitored. The current European Union (EU) legislation for the protection and conservation of the marine environment emphasizes the need to evaluate and limit the concentrations of contaminants, and to undertake preventive measures to re-establish a Good Environmental Status in impacted marine areas, as requested by Marine Strategy Framework Directive (MSFD, 2008/56/EC, Commission Decision 2010/477/EU).
The present study aims to recognize the sedimentological processes that drove the formation of the present sediment bodies on the base of the geochemical and sedimentological properties of the superficial marine sediments in a central Italian Adriatic Sea coastal area. In addition, the trace element pollution in the surface sediment of this area is investigated. The level of pollution has been evaluated by the elaboration of contamination index and by comparison with the limits of the Italian legislation [43]. The comparison with these limits needs to be considered as an indication due to the different methods used to measure the element concentrations. The research has been carried out by using a statistical elaboration of the biogeochemical and sedimentological variables. The statistical approach allowed the determination of compositional facies, that is, areas with common geochemical, mineralogical, and sedimentological properties. Previous studies have investigated the sedimentological and geochemical processes and recognized the main source area of sediments as well as anthropic heavy metal inputs in different offshore areas of the Adriatic Sea [4,13,44,45,46] but little is known about the present study area that instead shows a specific role as consequence of the coastal morphology on the Adriatic Sea circulation [47].

2. Study Area

The Adriatic Sea is located between the Italian peninsula and the Balkan Region; it is an elongated basin (about 800 km long and 200 km wide) oriented NW/SE and is connected to the Mediterranean Sea through the Otranto Strait. The Adriatic sea is historically divided into three distinct sectors [48]: the northern sector is characterized by a shallow continental shelf with a very gentle slope of about 0.02° until the isobath of 100 m; the middle sector, between the 100 m isobath and the Gargano Promontory, where a basin, called Mid-Adriatic Depression (MAD), or Jabuka Pit or Pomo Pit, occurs; this basin exhibits three sub-trenches, with maximum depths of 255 m (Western Pit), 270 m (Central Pit), and 240 m (Eastern Pit) [49]; the southern sector, between the Gargano Promontory and the Otranto Strait, which shows a maximum depth of 1260 m in the South Adriatic Depression (SAD). The hydrodynamic of the Adriatic Sea is characterized by a general anticlockwise circulation, aligned to the coasts that reaches its maximum in winter and spring, and by weak currents resulting in a series of clockwise and anti-clockwise gyres, in summer (Figure 1). In the eastern side of the basin, the current is directed northward (The East Adriatic Current: EAC). The EAC is characterized by warmer and high saline waters coming from the Levantine Basin (Levantine intermediate water, LIW), and from Ionian Basin (Ionian surface water: ISW) and in some cases from the Modified Atlantic Waters (MAW) following the pattern of the Bimodal Oscillating System (BiOS) [50,51,52,53]. The Adriatic Sea circulation is complicated by the formation of dense waters in the Northern Adriatic Sea (North Adriatic Dense Water: AdDW). These are cold and high salinity waters forming in winter in the Northern Adriatic Sea when the Bora wind blows [54,55]. The AdDW annually or biennially, generally in spring, flows southward close to the coast and reaches partly the MAD and flowing further south [56] (Figure 1).
In this context, waters and the fine sedimentary load of the Po and Apennine rivers as well as of the local rivers flowing along the South Marche coast, tend to branch out offshore in summer and to be confined near the coast in winter [4,57]. Overall, the combined action of currents and waves induces a redistribution of bottom sediments towards the south and, to a certain extent, towards the open sea, in the Northern and Central Adriatic Sea [2,4]. The main sedimentary inputs of the northern and central sectors of the Adriatic Sea are located along the western coasts since the contributions from the Balkan rivers are limited, due to the prevalent carbonatic composition of the rocks, and the confinement within the inshore basins parallel to the coast [58]. The sediment contribution of the Northern and Western Adriatic Sea rivers is represented by the northern Alpine rivers that contribute for 8 MT/y, the Po basin, contributing for 13 MT/y, and the Apennine rivers that contribute for 22 MT/y, for a total of 43 MT/y [59]. The catchment area of the Po River includes igneous, metamorphic and sedimentary rocks of the western and central Alps, carbonatic rocks mainly from the northern Alpine rivers, and a mixture of carbonatic and silicoclastic sediments from the Po alluvial System [42]. South of the Po River mouths the solid inputs of these rivers are composed mainly of terrigenous sediments with varying contents of carbonates [60]. The solid load of the minor rivers Southern of the Po River is estimated to be 16.9 × 10⁶ MT/y, between the Po River and Ancona, and 7.8 × 10⁶ MT/y, between Ancona and Punta Penne [61].
The current sea bottom sedimentological features of the northern and central sectors of the Adriatic Sea are the result of the last sea level rise and the following and present general Adriatic Sea hydrodynamics and riverine inputs. Indeed, the northern and central Adriatic Sea bottom is characterized by a Holocene accretionary wedge parallel to the Italian shoreline. This wedge is made up of coarse sediments near the coast, followed by finer sediments eastward. Further offshore, the Holocene accretionary wedge gives way to coarser sediments again consisting mainly of reworked sands. These sandy substrates were left in place by the last fast transgression and are due to the outcropping of partial reworked beach sands, paralic sediments and old filled valleys [58,62,63].
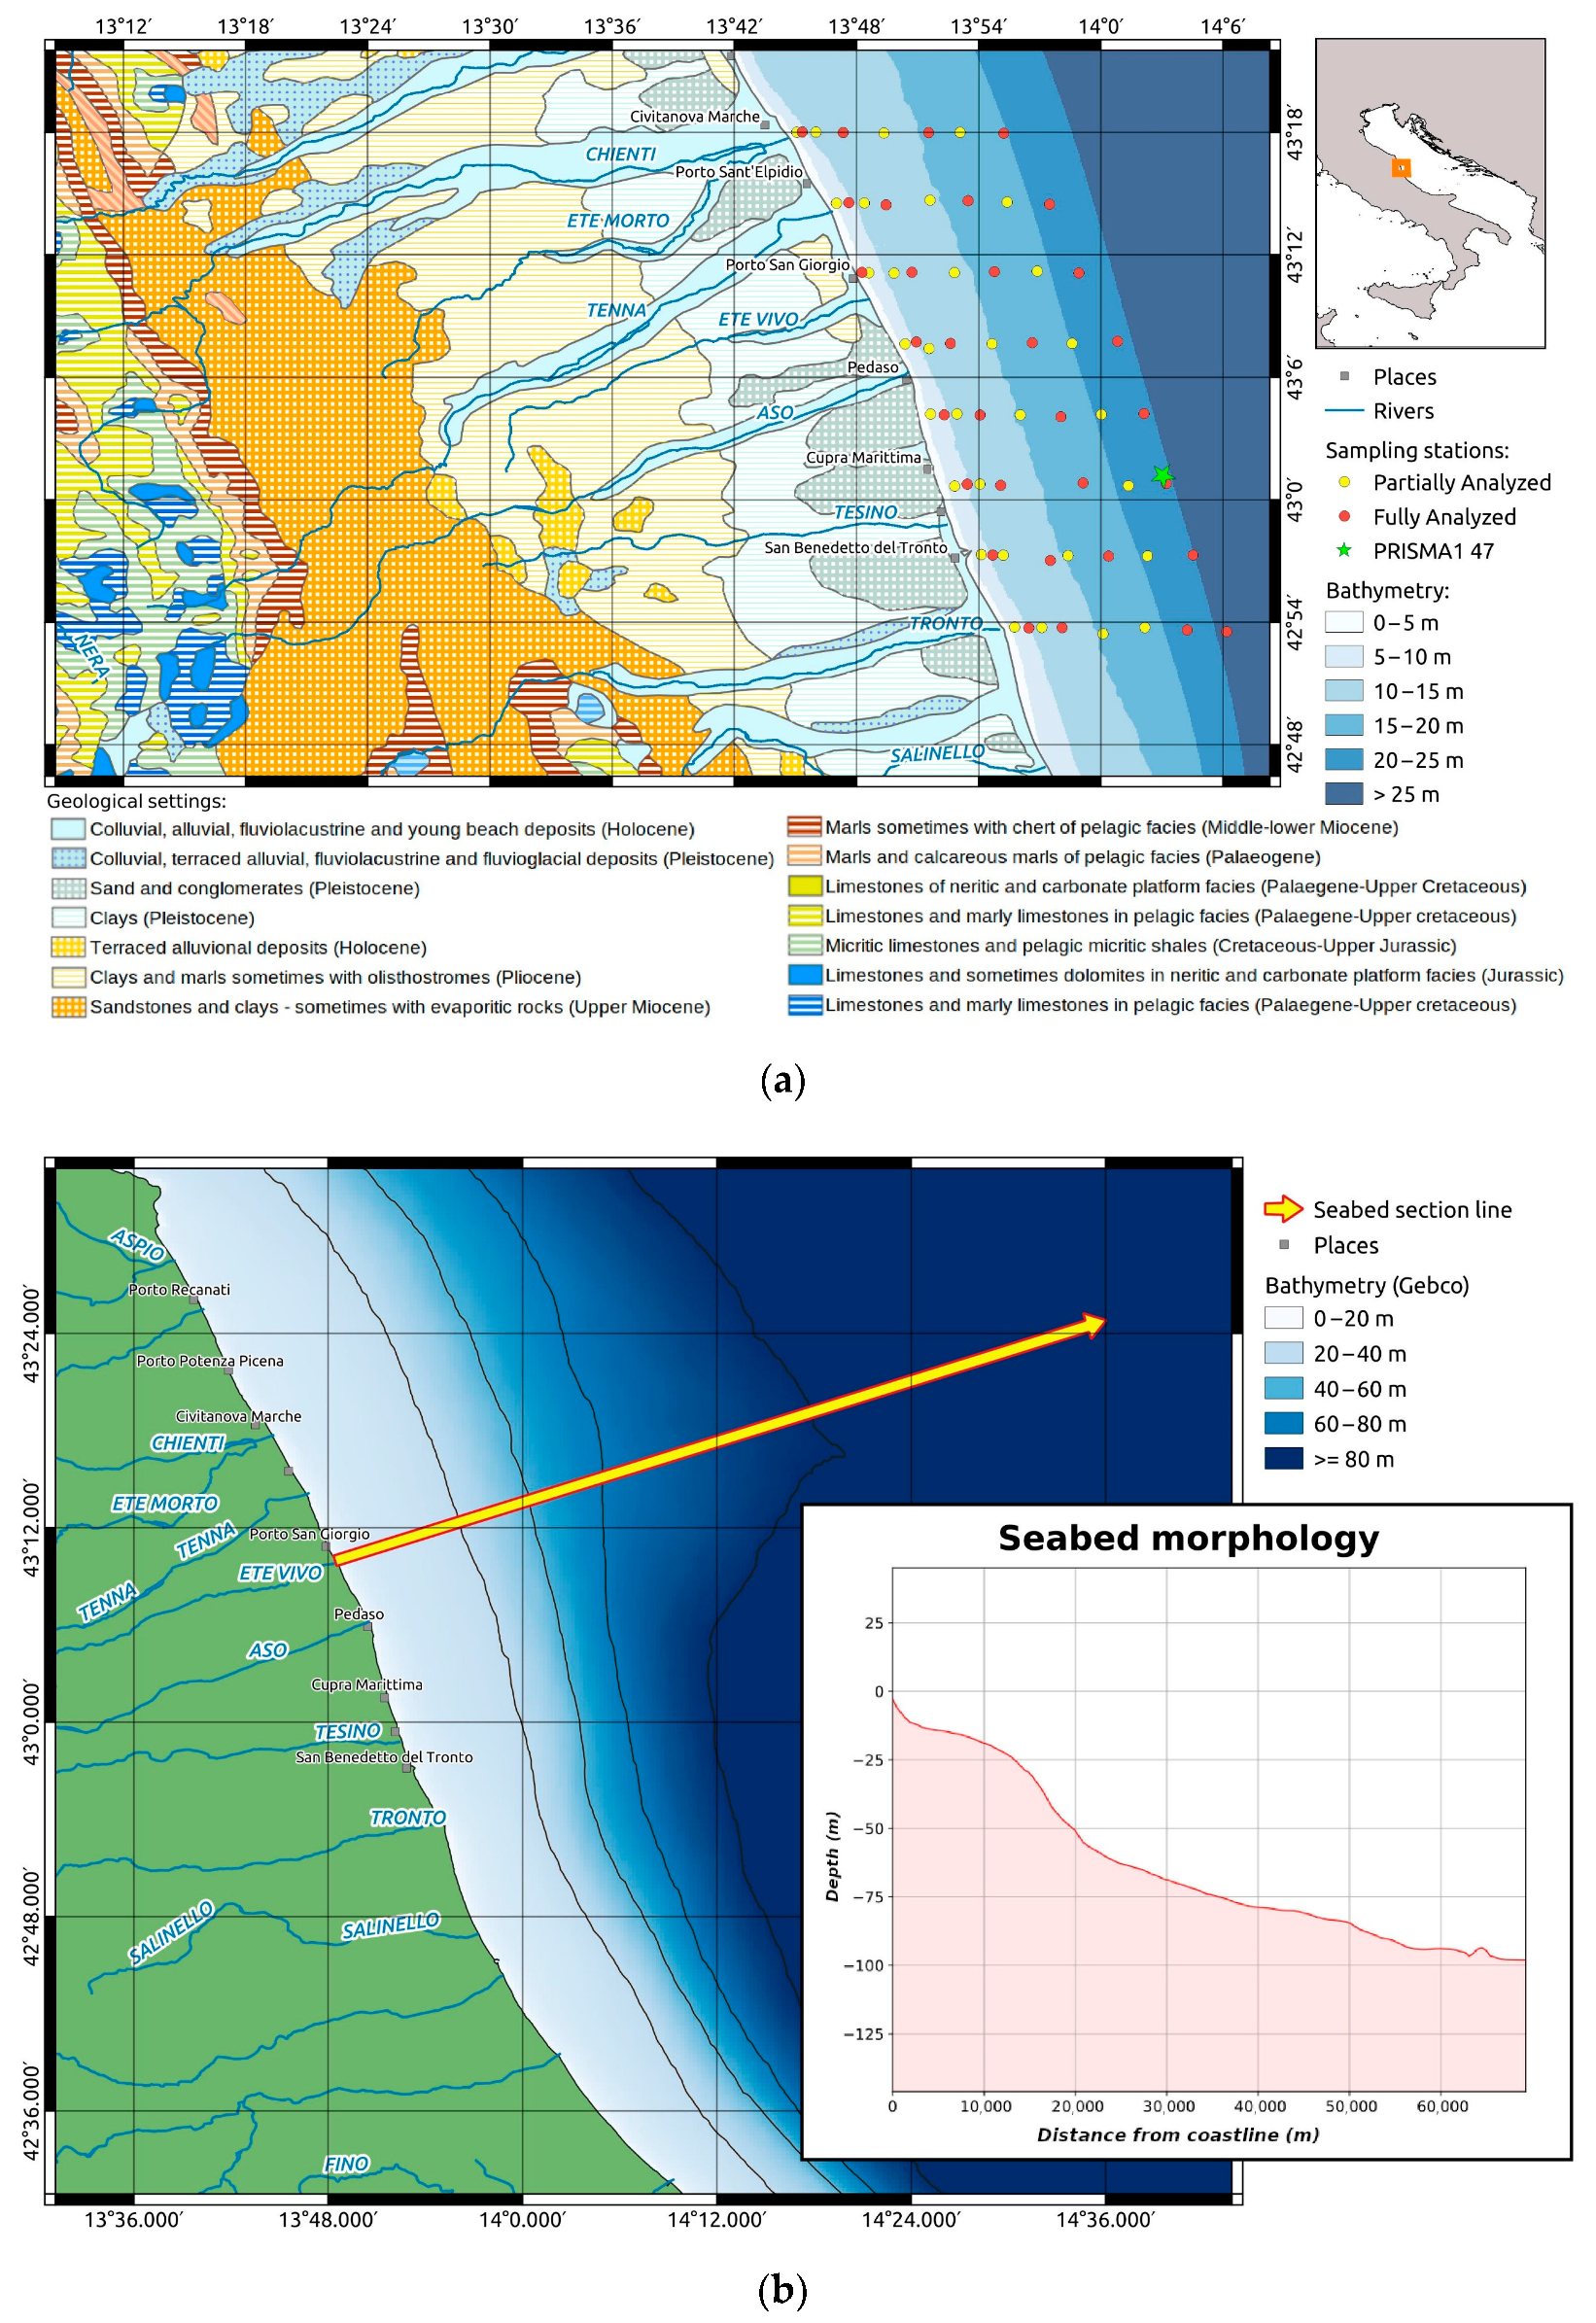
The study area is located in the central part of the western Adriatic Sea, in front of the southern part of the Marche Region (from the Chienti River to the Tronto River), from the shoreline to a depth of about 50 m (Figure 2). The main tributaries in the area are the Chienti, Tenna, Aso and Tronto Rivers. These rivers are located in an area with neighboring industrial activities, are contaminated with domestic and industrial wastewater and are exposed to pesticides used in surrounding agricultural areas [64]. From west to east, these rivers drain the carbonatic rocks of the Apennines, followed by the arenitic and clay Miocene rocks, the Plio-Pleistocene clays, and the arenitic and conglomeratic Pleistocene formations (Figure 2a). From a morphological point of view, the study area is characterized by a flat bottom gently sloping eastward, with weak dipping near the coast, slightly higher dipping in the center and again a less sloping to the East (Figure 2b). Only two minor river catchments, namely Ete and Tesino, do not include the Apennine carbonatic rocks (Figure 2). In the study area, the Holocene wedge is formed by an accretionary prism that tends to become thinner towards the coast and offshore [47]. Moreover, this coastal area undergoes intensive bottom sediment resuspension due to strong autumn and winter storms [65,66,67].

3. Materials and Methods

3.1. Sampling

Sediment samples were collected by a box-corer (sizes 101 × 17 w × 25 d cm) following a grid of 64 stations located in front of the Southern Marche Region coast, from shoreline to offshore (Figure 2a). The sediment samples were collected during the CASE1 cruise, in April 2010, carried out by the CNR-ISMAR of Ancona on the M/N G. Dallaporta. Each box-core was described for the macroscopic characteristics (color by Munsell tables, presence of organism and bioturbation, hydration and texture, sedimentary structures, grain-size) of the lateral and superficial surfaces. pH and Eh were measured in the sediment by punching in electrodes in the first 2 cm. The sediment samples were then collected at different depth on the base of the texture of the sediment core. On the basis of present research, only the superficial samples (0–2 cm) have been considered. Each sediment sample was split in aliquots immediately after the sub-sampling for the various analyses. The aliquot for the grain-size and water-content analyses was stored at 4 °C, while samples for geochemical analyses were stored at −20 °C and then freeze-dried.
Some samples (red dot in Figure 2a) were analyzed for grain-size and biogeochemical variables (total carbon (TC), total nitrogen (TN), organic carbon (OC), δ13C, and chemical elements); while other samples (yellow dot in Figure 2a) were analyzed only for grain-size, TC, TN, and OC.

3.2. Grain-Size and Organic Geochemistry

Grain-size analyses were carried out on wet sediment samples pre-treated with H2O2-16 vol. solution to remove organic matter. The coarser fractions were dry-sieved over the range 2 mm down to 0.063 mm by a stack of sieves ISO 3310 in accordance with UKAS Traceability Test Sieve LAB22-1. Bioclast component (>2 mm fraction) was separated by sands (2 mm < sands > 0.063 mm), while the finer fractions were analyzed by X-ray sedigraph (Micrometrics 5000D) [45].
The TC and TN were measured with a FisonsNA2000 elemental analyzer on the freeze-dried bulk sediment, while the OC was analyzed after acidification in hydrochloric acid 1.5 M [68] by the same instrument. The inorganic carbon (IC) was determined from the difference between TC and OC.
Stable isotopic analyses of OC (δ13C) were carried out on samples by using a FINNIGAN Delta Plus mass spectrometer directly coupled to the elemental analyzer. Stable-isotope data were expressed in ‰ relative to the variation (δ) from the international PDB standard.

3.3. Inorganic Geochemistry

The analyses of chemical elements (Ag, Al, As, Ba, Be, Bi, Ca, Cd, Co, Cr, Cu, Fe, Ga, Hg, K, Mg, Li, Mn, Mo, Na, Ni, P, Pb, Sb, S, Sc, Sr, Te, Ti, Tl, U, V, W, Y, Zn, and Zr) were carried out on freeze-dried sediment sample after acid digestion employing HF, HClO4, HNO3, and HCl and the following determination of the concentration of each element in the eluate solution by Inductively Coupled Plasma-Optical Emission Spectroscopy (Activation Laboratory LTD, Ancaster, ON, Canada).
To identify possible anthropic contributions, some pollution indicators, such as the contamination factor (Cf), the degree of contamination index (Cd), the enrichment factor (EF), the geoaccumulation index (Igeo), and the pollution load index (PLI) of heavy metals and other trace elements were calculated [69] (Table 1). Furthermore, element concentrations were compared to the threshold values of the Italian legislation [43], to the general abundance data reported for the marine shale [70] (Table 2) and the ecotoxicological risks with the Sediment Quality Guidelines (SQGs) indicated in Rachel and Wasserman, 2015 [71].
Contamination factor (Cf). The Cf [5] is an index developed to evaluate the contamination of a given toxic substance in a basin, and it is calculated as:
C f i   =   C e i C b i
where Ceiis the concentration of the substance i in sediment samples, and Cbi is the background values of the same substance indicated in Table 2. In this work, the Cfi was calculated for all elements even if only trace elements that may be affected by human activities (As, Ba, Co, Cr, Cu, Ni, Pb, V, and Zn) or that can be indicative of peculiar processes (Ga, Sc, Sr, Y, and Zr) have been discussed.
The background values (Cbi) of the element i and of the other elements not considered for the calculation of Cfi (Table 2) were deduced by using the concentrations in the sample collected at a depth of 105 cm of the sediment core 47 recovered in the study area (Figure 2a, green star) during the PRISMA1 project [4]. The element concentration in the core of the PRISMA1 project were determined by XRF following the method specified in [5] so that the concentrations can be compared to those determined by strong acid dissolution, both referring to the total concentrations. The core 47 is located inside the study area and the level 105 is referred to a time previous the industrial age as deduced by the radiometric and metal anthropogenic data of the PRISMA1 and by the accumulation rates determined in this area by previous studies [72] so that is not affected by anthropic inputs. Furthermore, by the normalization respect to the Al or Ti content determined in the same sample, it can be compared to samples with different grain size composition. Other methods such as those used in an area in front of the Abruzzo coast [73] can be useful applied when available only superficial samples.
Enrichment factor (EF). The EF has been developed to evaluate the metal contamination. The EF normalizes the trace element content with respect to a sample reference metal, in this case the Al:
EF   =   M Al S s M Al B s
where (M/Al)Ss is the ratio of each metal and Al concentrations of the sediment sample and (M/Al)Bs is the same ratio in the background sample (Table 2). The ecological risks based on EF values are categorized according to Table 1.
Geoaccumulation index (Igeo). The Igeo is an indicator of heavy metal contamination of sediments with respect to the background natural levels (Cbi). Igeo is expressed for each metal as:
I g e o   = C e i   1.5   *   C b i
Based on the Igeo values sediments are classified according to the classes shown in Table 1.
Modified degree of contamination index (mCd). The mCd, is the sum of all contamination factors of various heavy metals. It is obtained as follow:
mC d   =   i = 1 i = n C f n
in which n is the number of analyzed elements and i = ith element. The classification of mCd is shown in Table 1. In this work, the mCd has been calculated considering only metals or trace elements that show almost one value of Cf > 1 (As, Ba, Ga, Pb, Sr, and Zn).
Pollution load index (PLI). The Pollution Load Index (PLI) evaluates the heavy metal contamination of sediment samples as:
PLI = (Cf1× Cf2× Cf3×…× Cfn)1/n,
where Cf is the contamination factor and n is the number of metals. The PLI was calculated retaining only metals or trace elements that show at least one value of Cf > 1 (As, Ba, Ga, Pb, Sr and Zn). According to the contamination degree, the PLI data were classified as reported in Table 1 [74].

3.4. Statistical Analyses

Selected variables (i.e., major and trace element, grain-size, OC, IC, δ13C, TN, OC/TN, pH, and Eh) were processed using a multivariate statistical analysis (i.e., Factor Analysis, FA). This analysis allowed us to recognize the primary relationships between a series of samples, greatly reducing the size of the multidimensional system without losing a significant amount of information. The analysis consisted of a Q-mode FA applied to the sediment samples and their compositional variables [75]. The FA was carried out using the following steps [76]: (1) standardization of the initial data between the minimum and the maximum value for each variable; (2) correlation of the variables using the similarity coefficient cosθ [77]; (3) choice of a number of factors for which the sum of the individual variances ranges between 90–95% of the total variance of the system so that not much significant information is lost; and (4) final rotation of the axes-factors of the new system keeping them orthogonal. This last step was carried out to obtain better guidance on the original samples and to preserve the independence of the variables (Varimax criterion).
The FA was carried out to avoid an excessive number of variables respect to the number of samples. The selected variables of each sample were processed to obtain statistical factors clustering similar geochemical and sedimentological compositions. These factors represent biogeochemical-sedimentary facies (BSF), that is, the component of each sample that has been subjected to the same transport and depositional processes and whose sediments are from the same source areas. The areal mapping of the score of each factor extracted for each sample allows us to obtain the areal distribution of the different BSF and then to infer the main sedimentological and biogeochemical processed that took place in the area. The areal distribution maps of the BSF as well as of the single variables were drafted by using the tension continuous curvature spline method [78]. All the biogeochemical and sedimentological variables were plotted according to their areal distribution following a standardized method that creates a grid file with GMT v. 6.0.0 [79] and plots the map by QGIS v. 3.10.4-A Coruña. The areal distribution of each variable is shown in Figure S1 (Supplementary Materials).

4. Results and Discussion

A summary of statistics of the investigated variables is reported in Table 3. Selected chemical elements (i.e., Cd, Sb, Tl, U, W) have not been considered as their concentrations were either below the detection limits or above detection limits in a very limited number of samples (in parenthesis after the element): Bi (1), Hg (2).
Table 3 also includes information about Ag (9), Mo (16), Te (19), Be (29), and As (41) although they were not observed in some of the samples. All these elements were excluded from the multivariate statistical analysis (the complete dataset is reported in Supplemental Table S1). Table 2 presents some reference values used in the discussion, the background concentrations considered for some elaborations, regulatory values and the ecotoxicological sediment values. Meanwhile, Table 4 includes basic statistics relative to the various indexes calculated for describing the sediment status.

4.1. Sedimentological Processes and Facies Recognition

The statistical elaboration of the biogeochemical and sedimentological variables highlights the presence of three main factors explaining, on overall, 94.6% of the total variance. These factors mainly represent the three key BSFs in the coastal marine area of the Southern Marche.
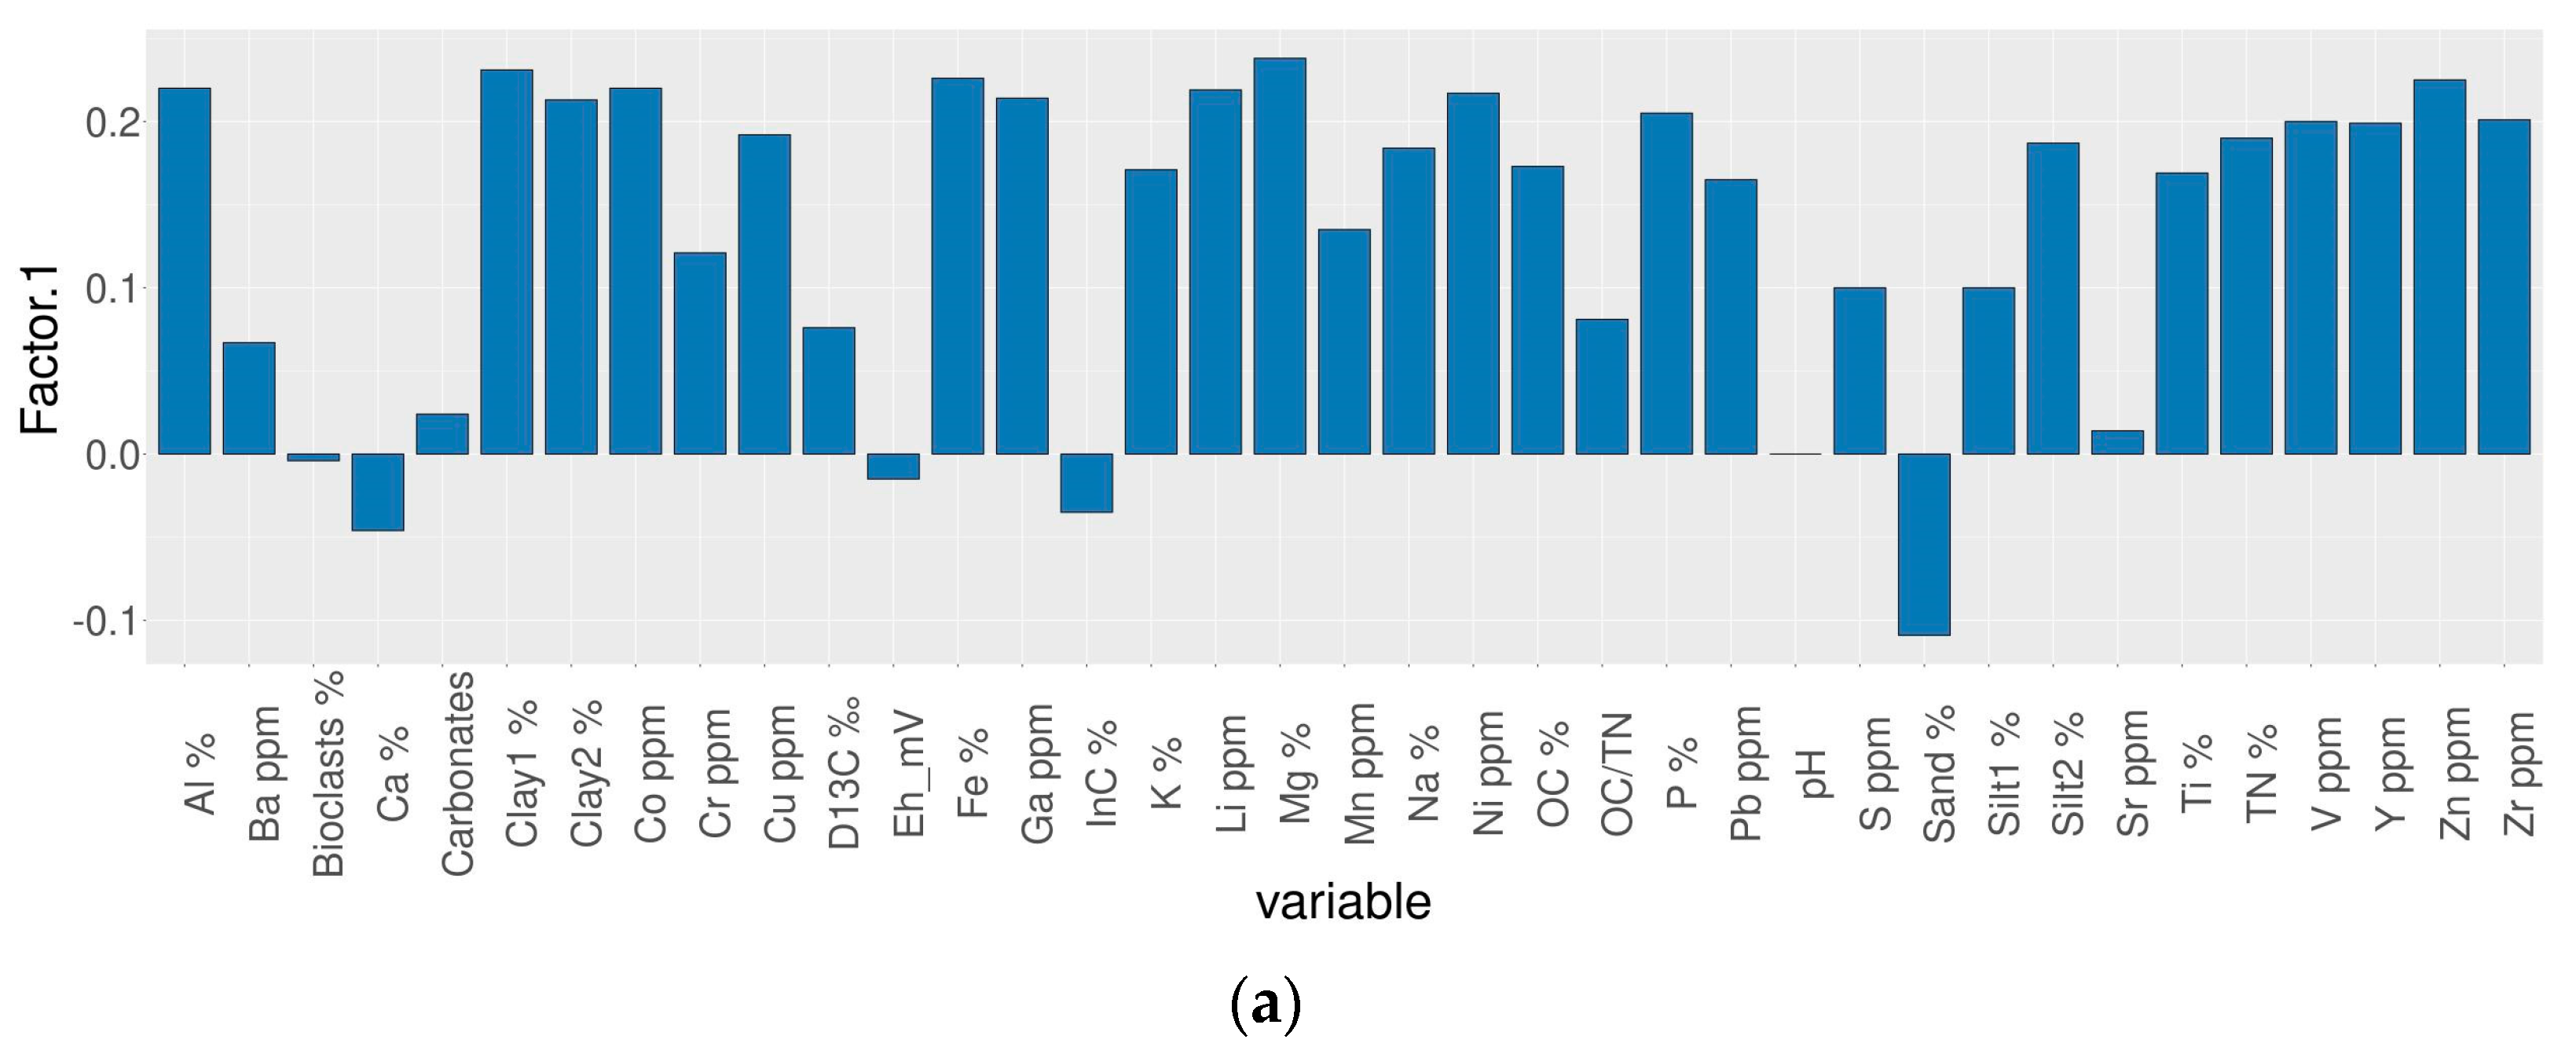
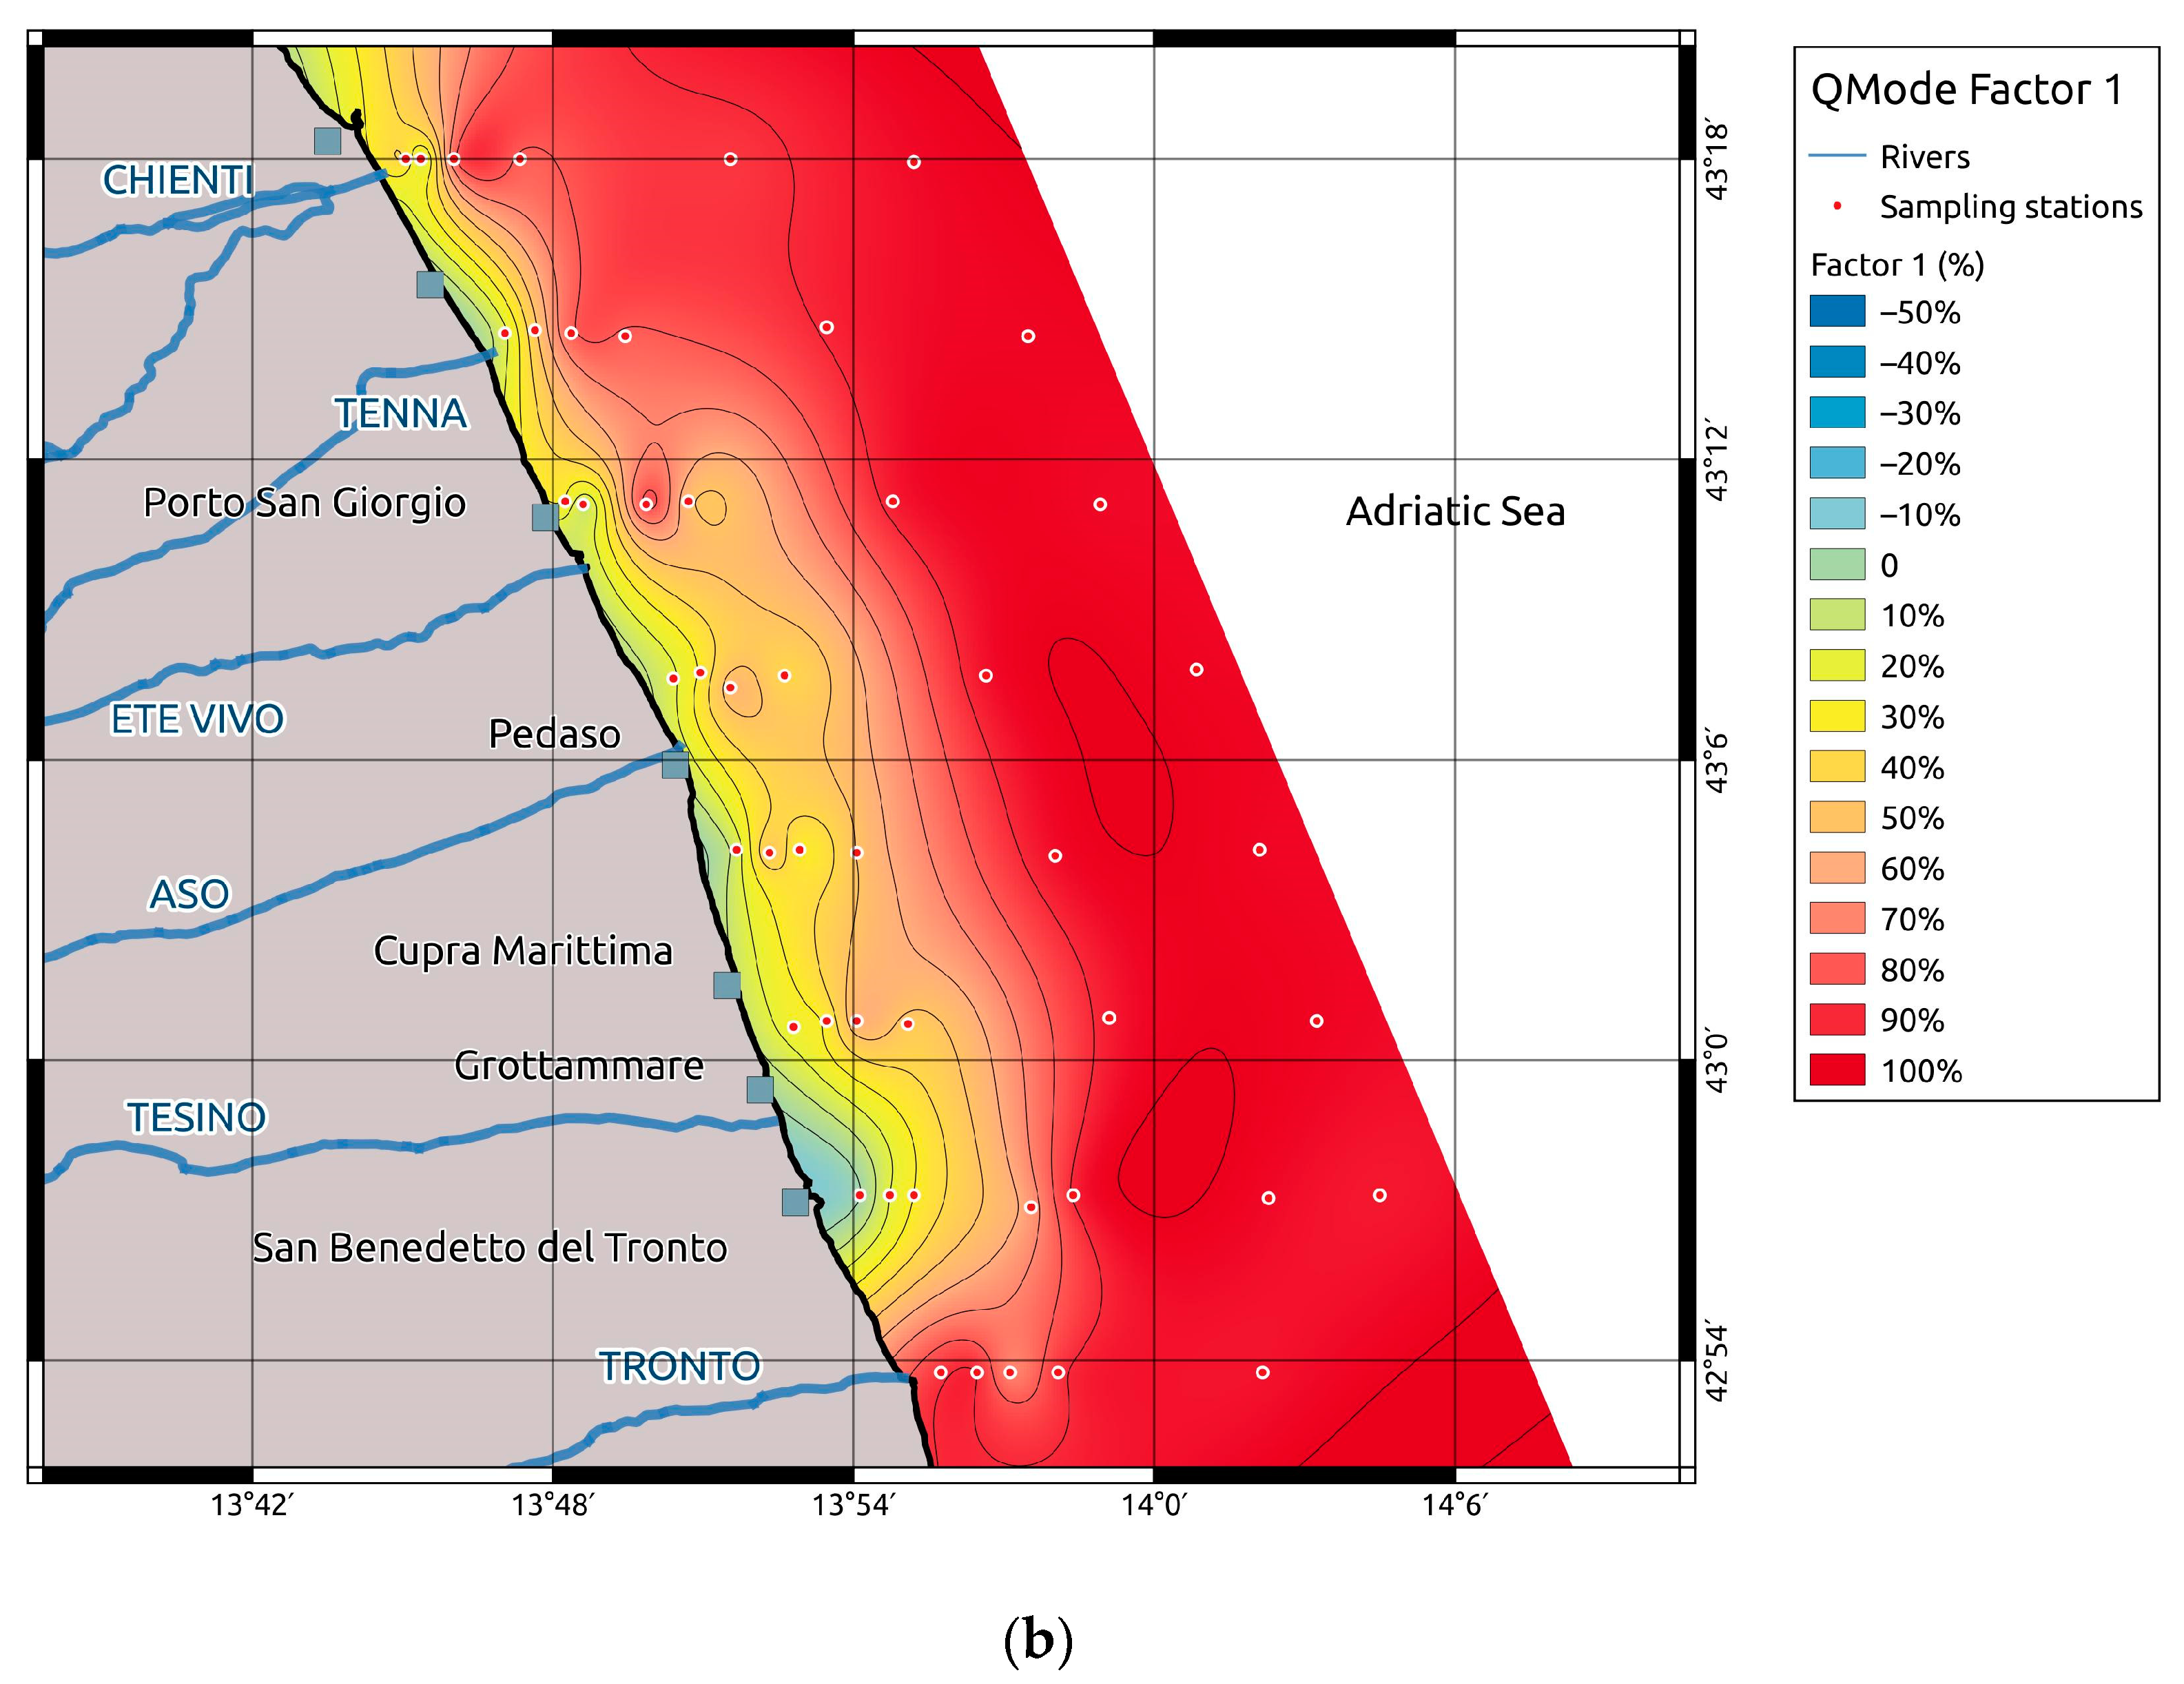
The most significant facies (BSF1) explains 79.2% of the total variance and is characterized by sediments with (Figure 3a) high contents of clay and fine silt, some elements (i.e., Al, Ti, Mg, K, Na, P, Fe, Co, Cu, Zn, Ni, Pb, V, Ga, Li, Y, and Zr mainly linked to clay minerals), OC that is directly linked to the Organic Matter (OM), and TN that is contained both in the OM and in the clay minerals. The SBF1 is therefore sedimentological facies consisting primarily of fine pelitic sediments with abundant clay minerals and OM. The extracted scores of these facies increase seaward, starting from values close to zero, that imply absence of pelitic sediment, clay minerals and OM, near coast, to values close to 1 (i.e., sediments made up of almost all fine sediments) (Figure 3b). By considering the areal distribution of the fine pelitic, organic and clay-rich sediments of BSF1 and the general cyclonic circulation of the Adriatic Sea as well as the reworking and removing action of the wave near the coast, the sediments of the BSF1 are inferred to be mainly sourced from the fine load of the Po River as well as from that of the Apennine rivers in the northern part of the study area. For this reason, the BSF1 facies can be assimilated and named as the Padanic Facies of Spagnoli et al. (2014) [4]. The fine particles introduced in the Adriatic Sea in front of the river mouths and are then resuspended by the wave action and transported southwards by the WAC [2]. As a result, the fine particles settle at greater depths in a belt area aligned to the coastline, where the action of the wave motion on the seabed is weaker [4]. Furthermore, the WAC confines the suspended sediments near the coast, preventing their spreading eastward limiting their sedimentation towards the center of the basin. The fine sediments of the BSF1 are subject to a continuous reworking process acting on the sea bottom. This consists in repeated resuspension and redeposition processes, due to strong storms that result in the transportation and dilution processes of the BSF1 sediments southward. As a consequence of this sedimentological and hydrographic set up, the present offshore sediment accumulation is very feeble, and the relict sediments connected to the last sea level rise tend to surface in the deeper side of the north-central Adriatic Sea. The BSF1 facies approaches towards the coast between the Chienti and the Ete Vivo rivers and in front of the Tronto river where it also shows a maximum (Figure 3b). This distribution near the coast suggests that the Chienti, Tenna and, to a greater extent, the Tronto rivers discharge more fine sediment than the other rivers in the southern Marche.
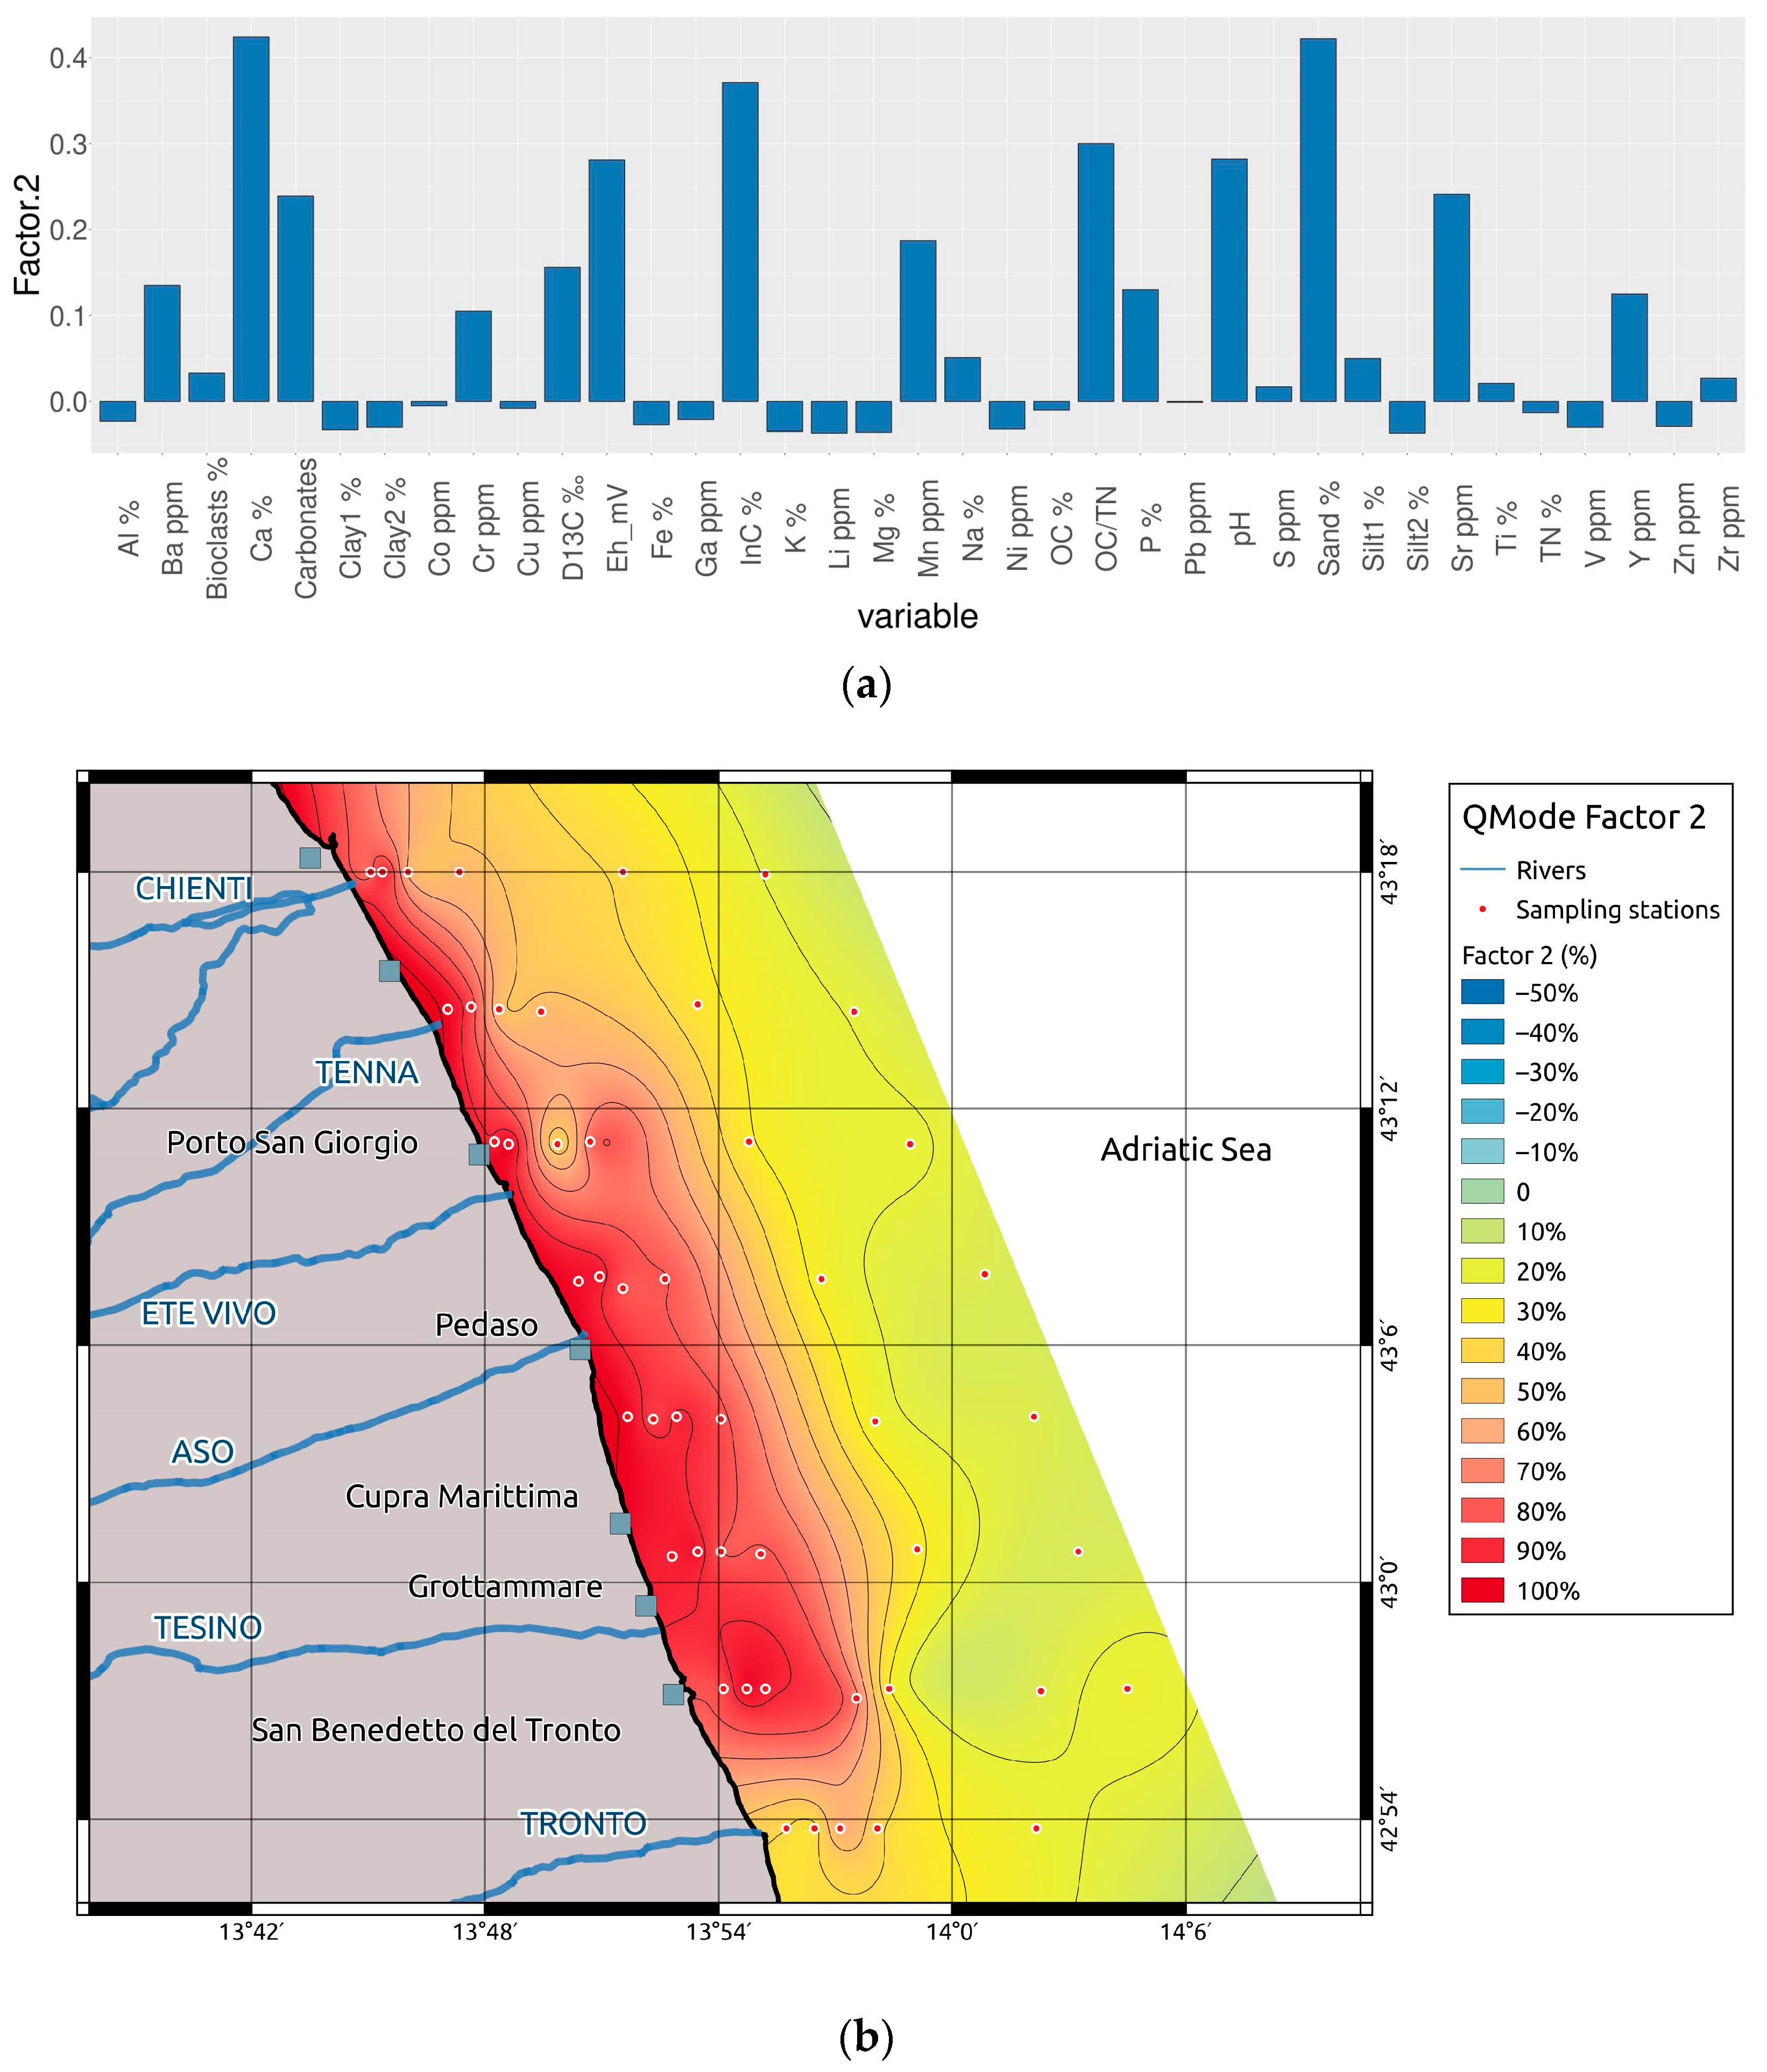
The second facies (BSF2) represents 14.5% of the total variance and is marked by high contents of sand, IC, Ca, Sr, OC/TN, pH, and Eh (Figure 4a). Calcium and IC are typical of sediments with abundant carbonate, while high values of pH and Eh are associated to coarse grain-sizes. Based on these characteristics, it can be inferred that the BSF2 is mainly made up of a coarse sandy sediment enriched in carbonates. The areal distribution pattern of the BSF2 (Figure 4b) is complementary to that of the BSF1, with values that suddenly increase the near the coast, where they show values close to 1, meaning sediments consisting almost exclusively of carbonate sandy materials and decrease offshore where they reach value lower than 0.1. The origin of the BSF2 sediments is ascribed to the coarse sandy contributions of the local rivers of the Marche Region. They drain the carbonate rocks of the central Apennine and discharge their coarse sediments near the coast, while finer sediments are removed by wave action. The BSF2 facies can be named as Coastal Facies being mainly affected by coastal processes and inputs. The BSF2 presents a smaller extension towards the offshore in front of the Chienti and Tenna rivers and, to a greater extent, in front of the Tronto River where, there is also an area marked by the lowest values. This trend in the areal distribution of BSF2 confirms the greater inputs of fine material from the Chienti, Tenna and, to a greater extent, from the Tronto rivers.
The third facies (BSF3) explains 1.9% of the total variance and is defined by abundant silts, P, Mn, Ba, Sr, and partially Zr (Figure 5a). The highest values of the BSF3 are mostly found along a belt parallel to the coast in an intermediate position between the BSF1 and BSF2 maxima (Figure 5b) with three maximum areas. By considering the distribution of the BSF3 sediments in relation with the hydrography of the central Adriatic Sea, the silty sediments of the BSF3 are the results of the accumulation at depth where the wave action can remove the finer granulometric fractions, but where the coarse sandy coastal material supplied by the local rivers and reworked by the wave motion, is not deposited. Furthermore, the presence Zr and P also suggest the presence of heavy minerals like zircon and apatite, while the occurrence of Sr and Mn as well as IC suggest the presence of carbonates. These minerals support the residual nature of these sediments in which heavy minerals and carbonate concentrations increase for the removing of lighter minerals and finer grains. The characteristics of the BSF3 are similar to the Residual Facies of Spagnoli et al. (2014) [4] and can then be partially considered as the same Residual Facies. The two minima near the coast are in front of the Ete Vivo and Tesino rivers: the two rivers that do not drain the limestone rocks of the Sibillini mountains. This means that the residual sediments are partially associated with the carbonate rocks.
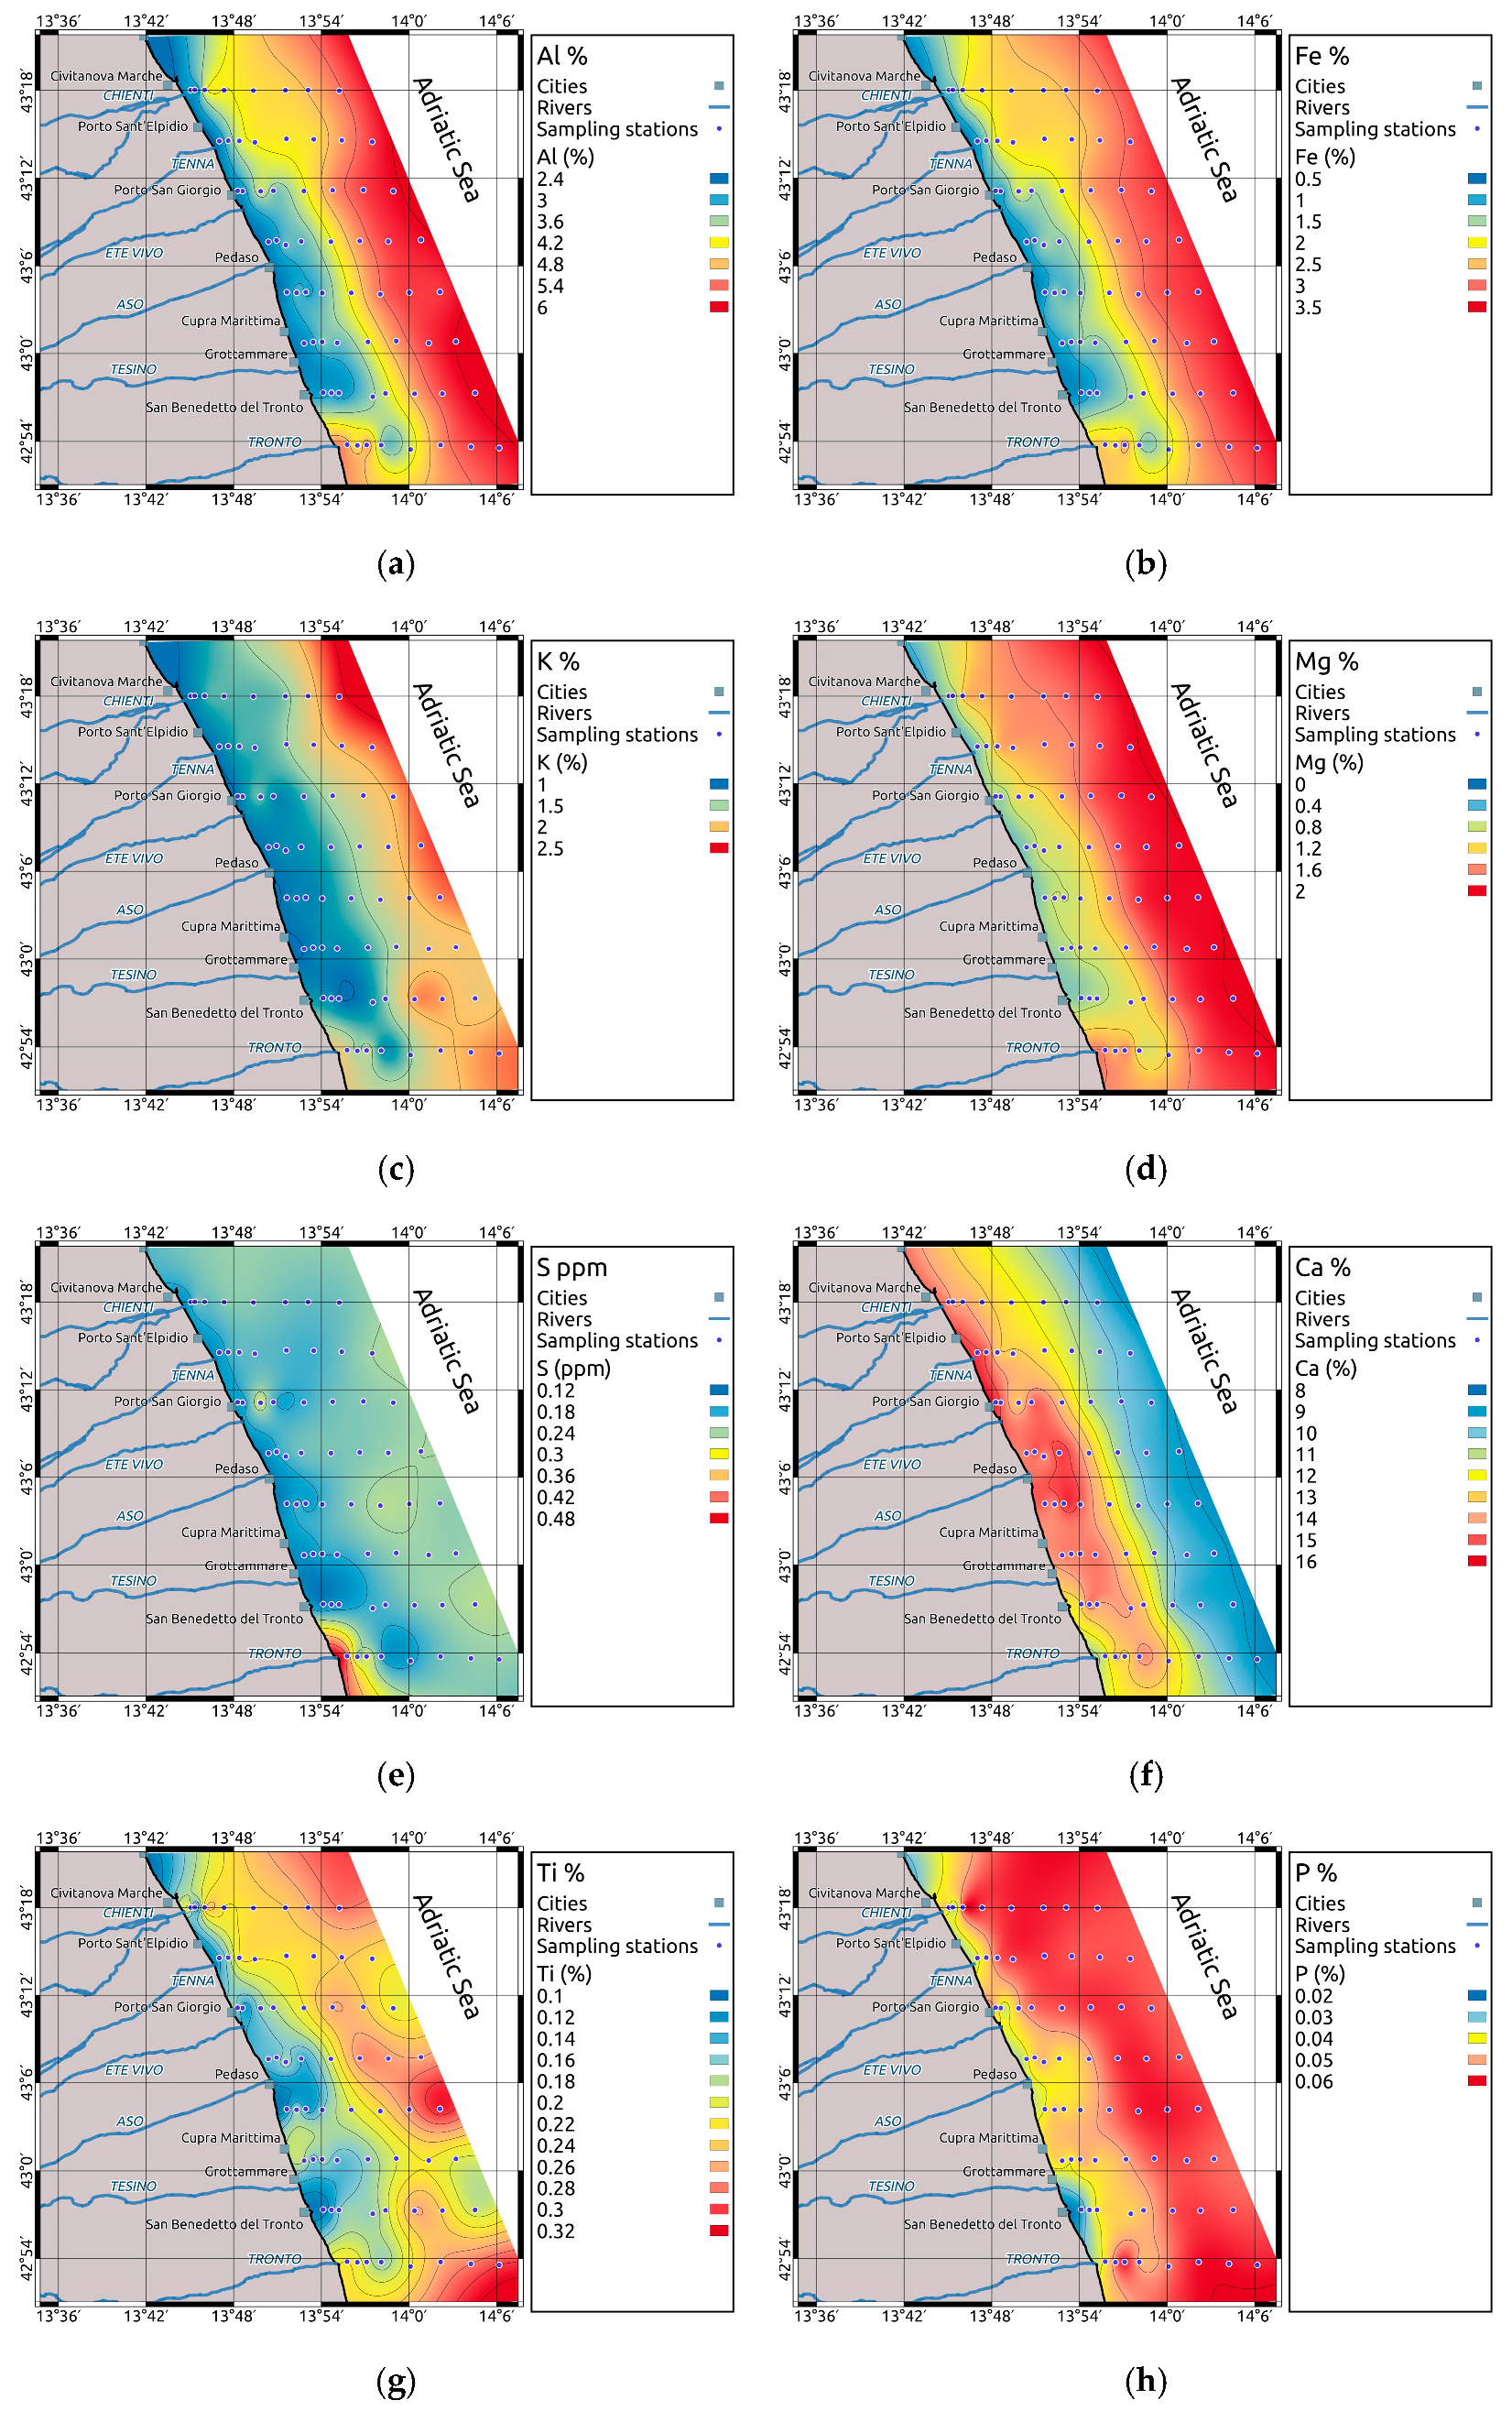
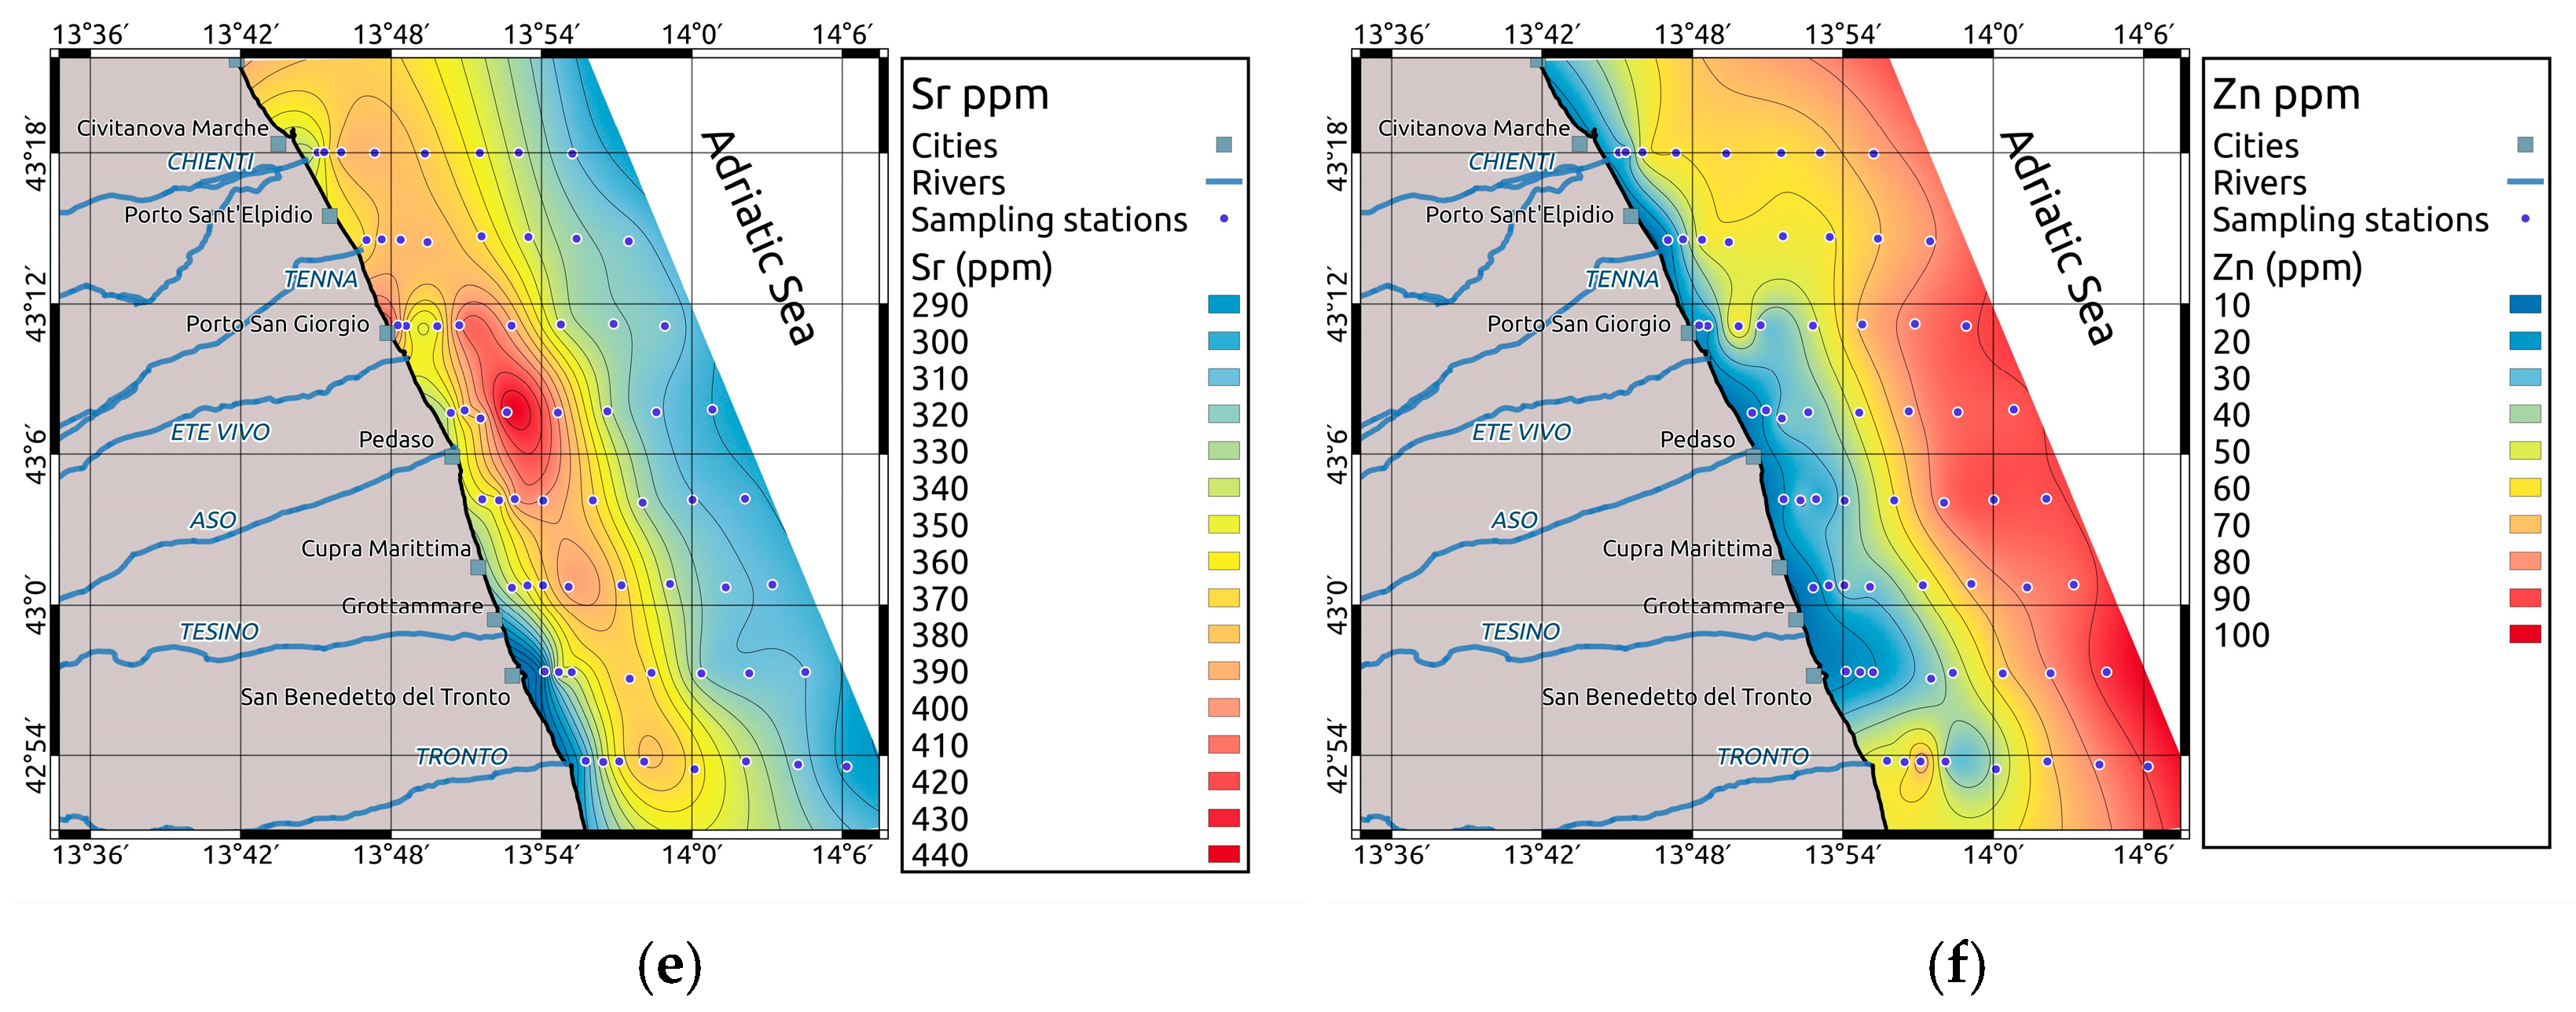
By considering single elements, it is worthy to note that the elements that present high affinity with the clay minerals (i.e., Al, Co, Cr, Cu, Fe, Ga, K, Li, Mg, Mn, Na, Ni, P, Pb, Sc, Ti, V, Y, Zn, Zr) show a distribution pattern very similar to that of the BSF1 facies (Padanic Facies) (Figure 6, Figure 7 and Figure 8) because they naturally tend to accumulate with finer fractions. On the other hand, elements having high affinity with the carbonate minerals (i.e., Ca and Sr) show distribution patterns (Figure 6f and Figure 7e) similar to that of the Coastal Facies BSF2 (Ca) and BSF3 (Sr). This is in full agreement with the findings of the statistical elaboration that connects the same elements with the clay minerals and with the carbonate minerals. For this reason, the anomalies regarding these patterns have been considered to infer anthropic inputs or local natural processes. In this context, an anomaly is recorded in front of the Tronto River where a siliciclastic fine sediment enriched in S is recorded (Figure 6). This is also supported by the sediment description of the box-core upon collection that consisted of compact gray mud with blackish veins and burrows. Following the bathymetric reliefs that delineate a depression, the geochemical composition of this area is related to a strong erosion of the bottom that allows the outcropping of older, weak diagenized siliciclastic sediments.

4.2. Evaluation of the Contamination and Ecotoxicological Risks

4.2.1. Contamination Assessment

Only elements with Cf higher than one in some samples are herein considered.
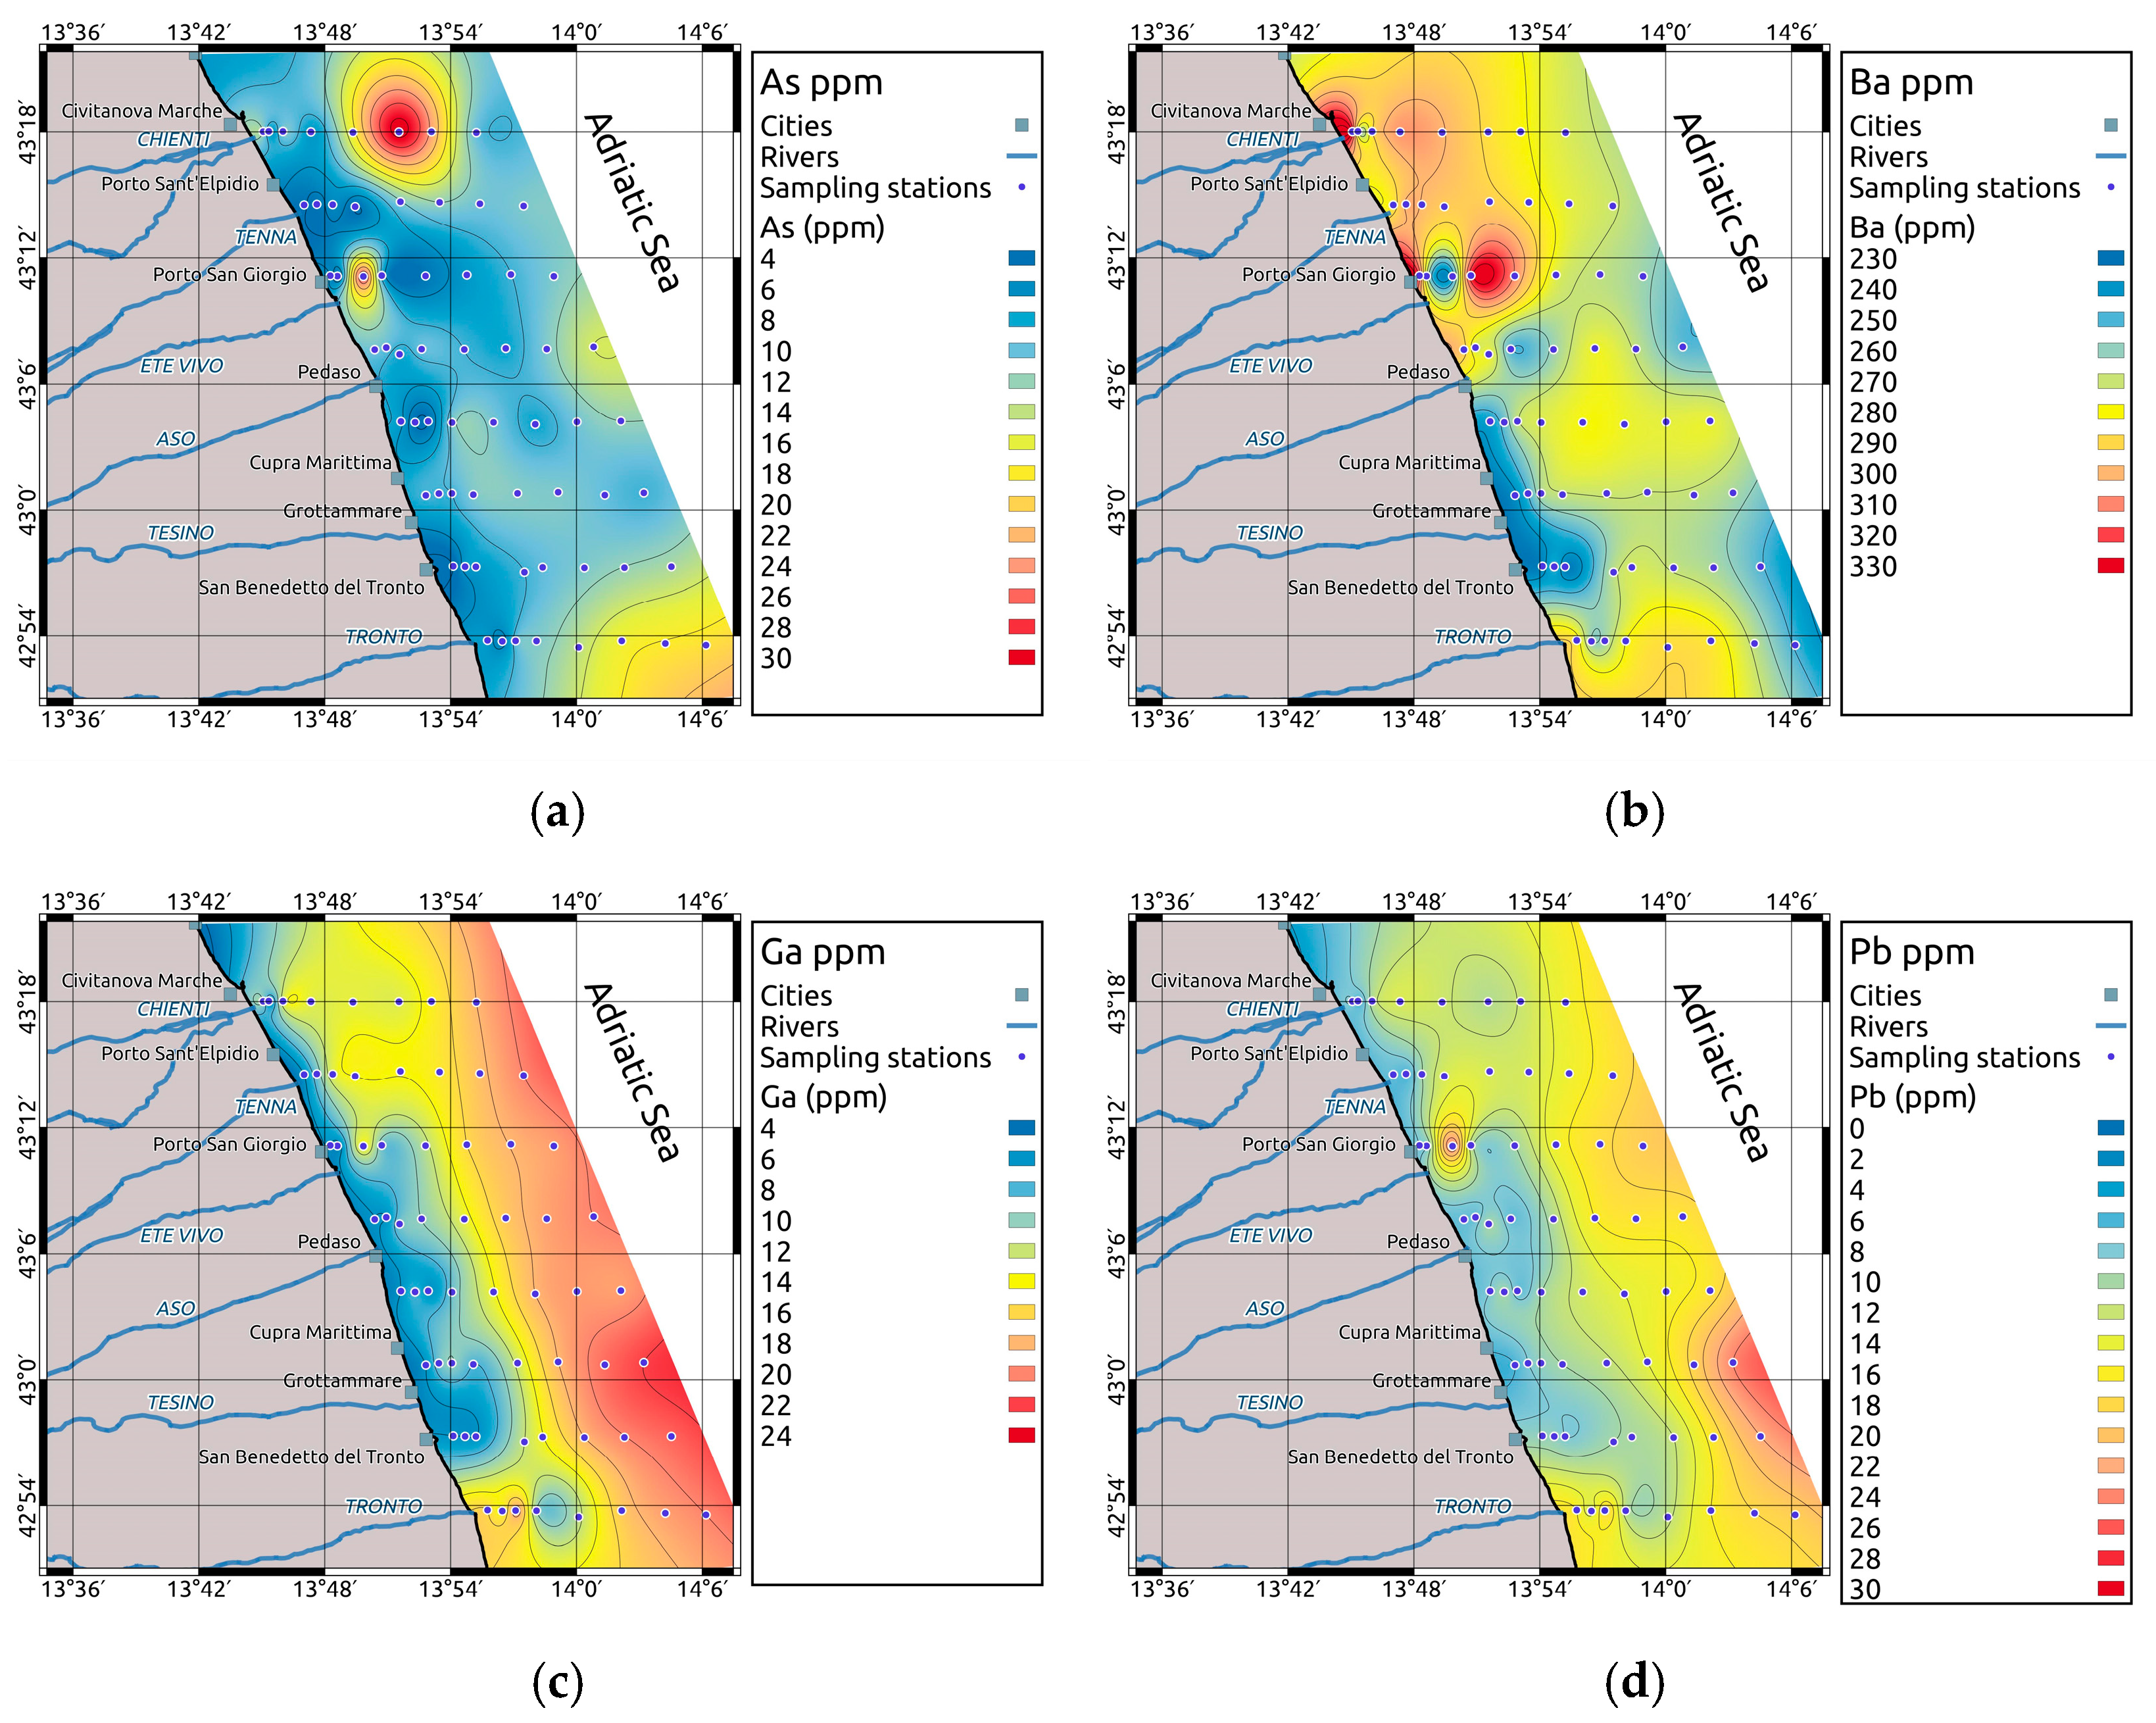
As. Arsenic mean values are in the order of 9 ppm (Table 3) that are slightly lower than the average marine shale composition (Table 2) and are in line with the local background value (Table 2) of the southern Marche Holocene pelitic wedge (10 ppm at −105 cm). The spatial distribution indicates the occurrence of relatively high concentrations (up to 31 ppm) in the northern area (Figure 7a). These data suggest that this area has, on average, high As values likely related to the composition of the source rocks coming from North [4]. Arsenic was included in the multivariate analysis but shows a good affinity with elements of the BSF1. In two sandy areas located inshore in front of the Chienti and Ete Vivo river mouths, as well as in a pelitic belt directed north-south, in front of the Chienti River (Figure 7a), the As values are equal to or higher than the Italian thresholds (Table 2), its Cf is higher than 1 and the EF and Igeo fall in the second class (Table 4).The mainly sandy sites, located inshore, in front of the Chienti River (station 101) and of the Ete Vivo River (station 303) fall in the moderate enrichment class (2–5) for EF index and unpolluted to moderately polluted (0–1) for Igeo, respectively. Furthermore, the concentration of As at station 303 is over the second threshold of the Italian legislation (20 ppm, Table 2). In addition, the station 106, in the pelitic belt in front of the Chienti River, is moderately polluted (1–2) for Igeo and shows a concentration over the second threshold of the Italian legislation (20 ppm, Table 2). Unpolluted to moderately polluted (0–1) Igeo values are also recorded offshore and to the Southeast of the study area, in correspondence with mainly clayey sediment, but in this case the high values are due to the inputs of fine materials coming from North, that however influence also other proximal areas, further south [73]. The As pollution in the north-western area could be ascribed to local discharges of waste of fertilizer productions along the southern Marche coast in the past decades.
Ba. The average concentrations of barium are around 270 ppm (Table 3) reaching a maximum of 329 ppm, far below the average marine shale composition and in line with local background (Table 2). The highest values of Ba are found near the coast between the Chienti and Aso Rivers and in a belt along the central area that mainly corresponds to the BSF3 (Figure 7b). In some stations of these areas, the EF of Ba slightly exceeds 2, resulting in the moderate enrichment class, while the absolute concentrations (average 272.8 ppm; Table 2) are higher than the background value of 295 ppm in the high Al content stations (Table 2). The high Ba concentrations near the coast and in the BSF3 facies, particularly in the northern side of the study area, suggest a provenance of Ba from North. It also suggests a scavenging process, due to high specific weight of the barium sulphate, a heavy mineral that tends to remain in situ after reworking processes. The barium sulphate is a component of the drilling muds so that the high Ba concentrations could be due to discharges into the sea in the past of these drilling muds from hydrocarbon platform perforation as reported for other areas [2,46,80].
Ga. The values of Ga in the whole area (average 12.3 ppm, Table 3) with a maximum of 22 ppm are in line with average marine shale and with local background concentrations (16.2 ppm, Table 2) even if some stations show values of Cf slightly above 1. The EF and Igeo indexes are constantly lower than the minimum threshold values. Its distribution describes an almost regular increase seaward (Figure 7c).
Pb. The average values of Pb in the whole area (12.1 ppm, Table 3), with a maximum of 24 ppm, match well with the background data (18 ppm, Table 2) and the average marine shale. Some samples, however, show a Cf slightly over 1 (Table 4). The ER and Igeo indexes are permanently less than the minimum threshold values (Table 4). Both the present average Pb contents and the background values are strongly lower than the L1 threshold level of 30 ppm (Table 2) suggesting limited anthropogenic Pb inputs.
Sr. Strontium has an average concentration of 353 ppm (maximum of 436 ppm, Table 3) that are comparable to the local background and slightly higher than average marine shale (Table 2). This element has a strong affinity for carbonates and its concentrations show higher values in correspondence of the residual facies BSF3. Among the sedimentary quality index, the Igeo is constantly lower than minimum threshold value, but the EF index is higher than 2 (low enrichment, Table 4) in many samples, likely due for the way the index is calculated on a normalized base.
Zn. Zinc concentration records an average of 49 ppm and a maximum of 95 ppm (Table 3) that are, in general, slightly lower than local background and average marine shale values (Table 2). The sediment quality index displays few observations of the Cf value of 1, whereas the EF and Igeo indexes are constantly lower than minimum threshold values (Table 4). All the observations are below the L1 threshold levels (100 ppm, Table 2) pointing therefore to a limited anthropogenic contribution for this element.
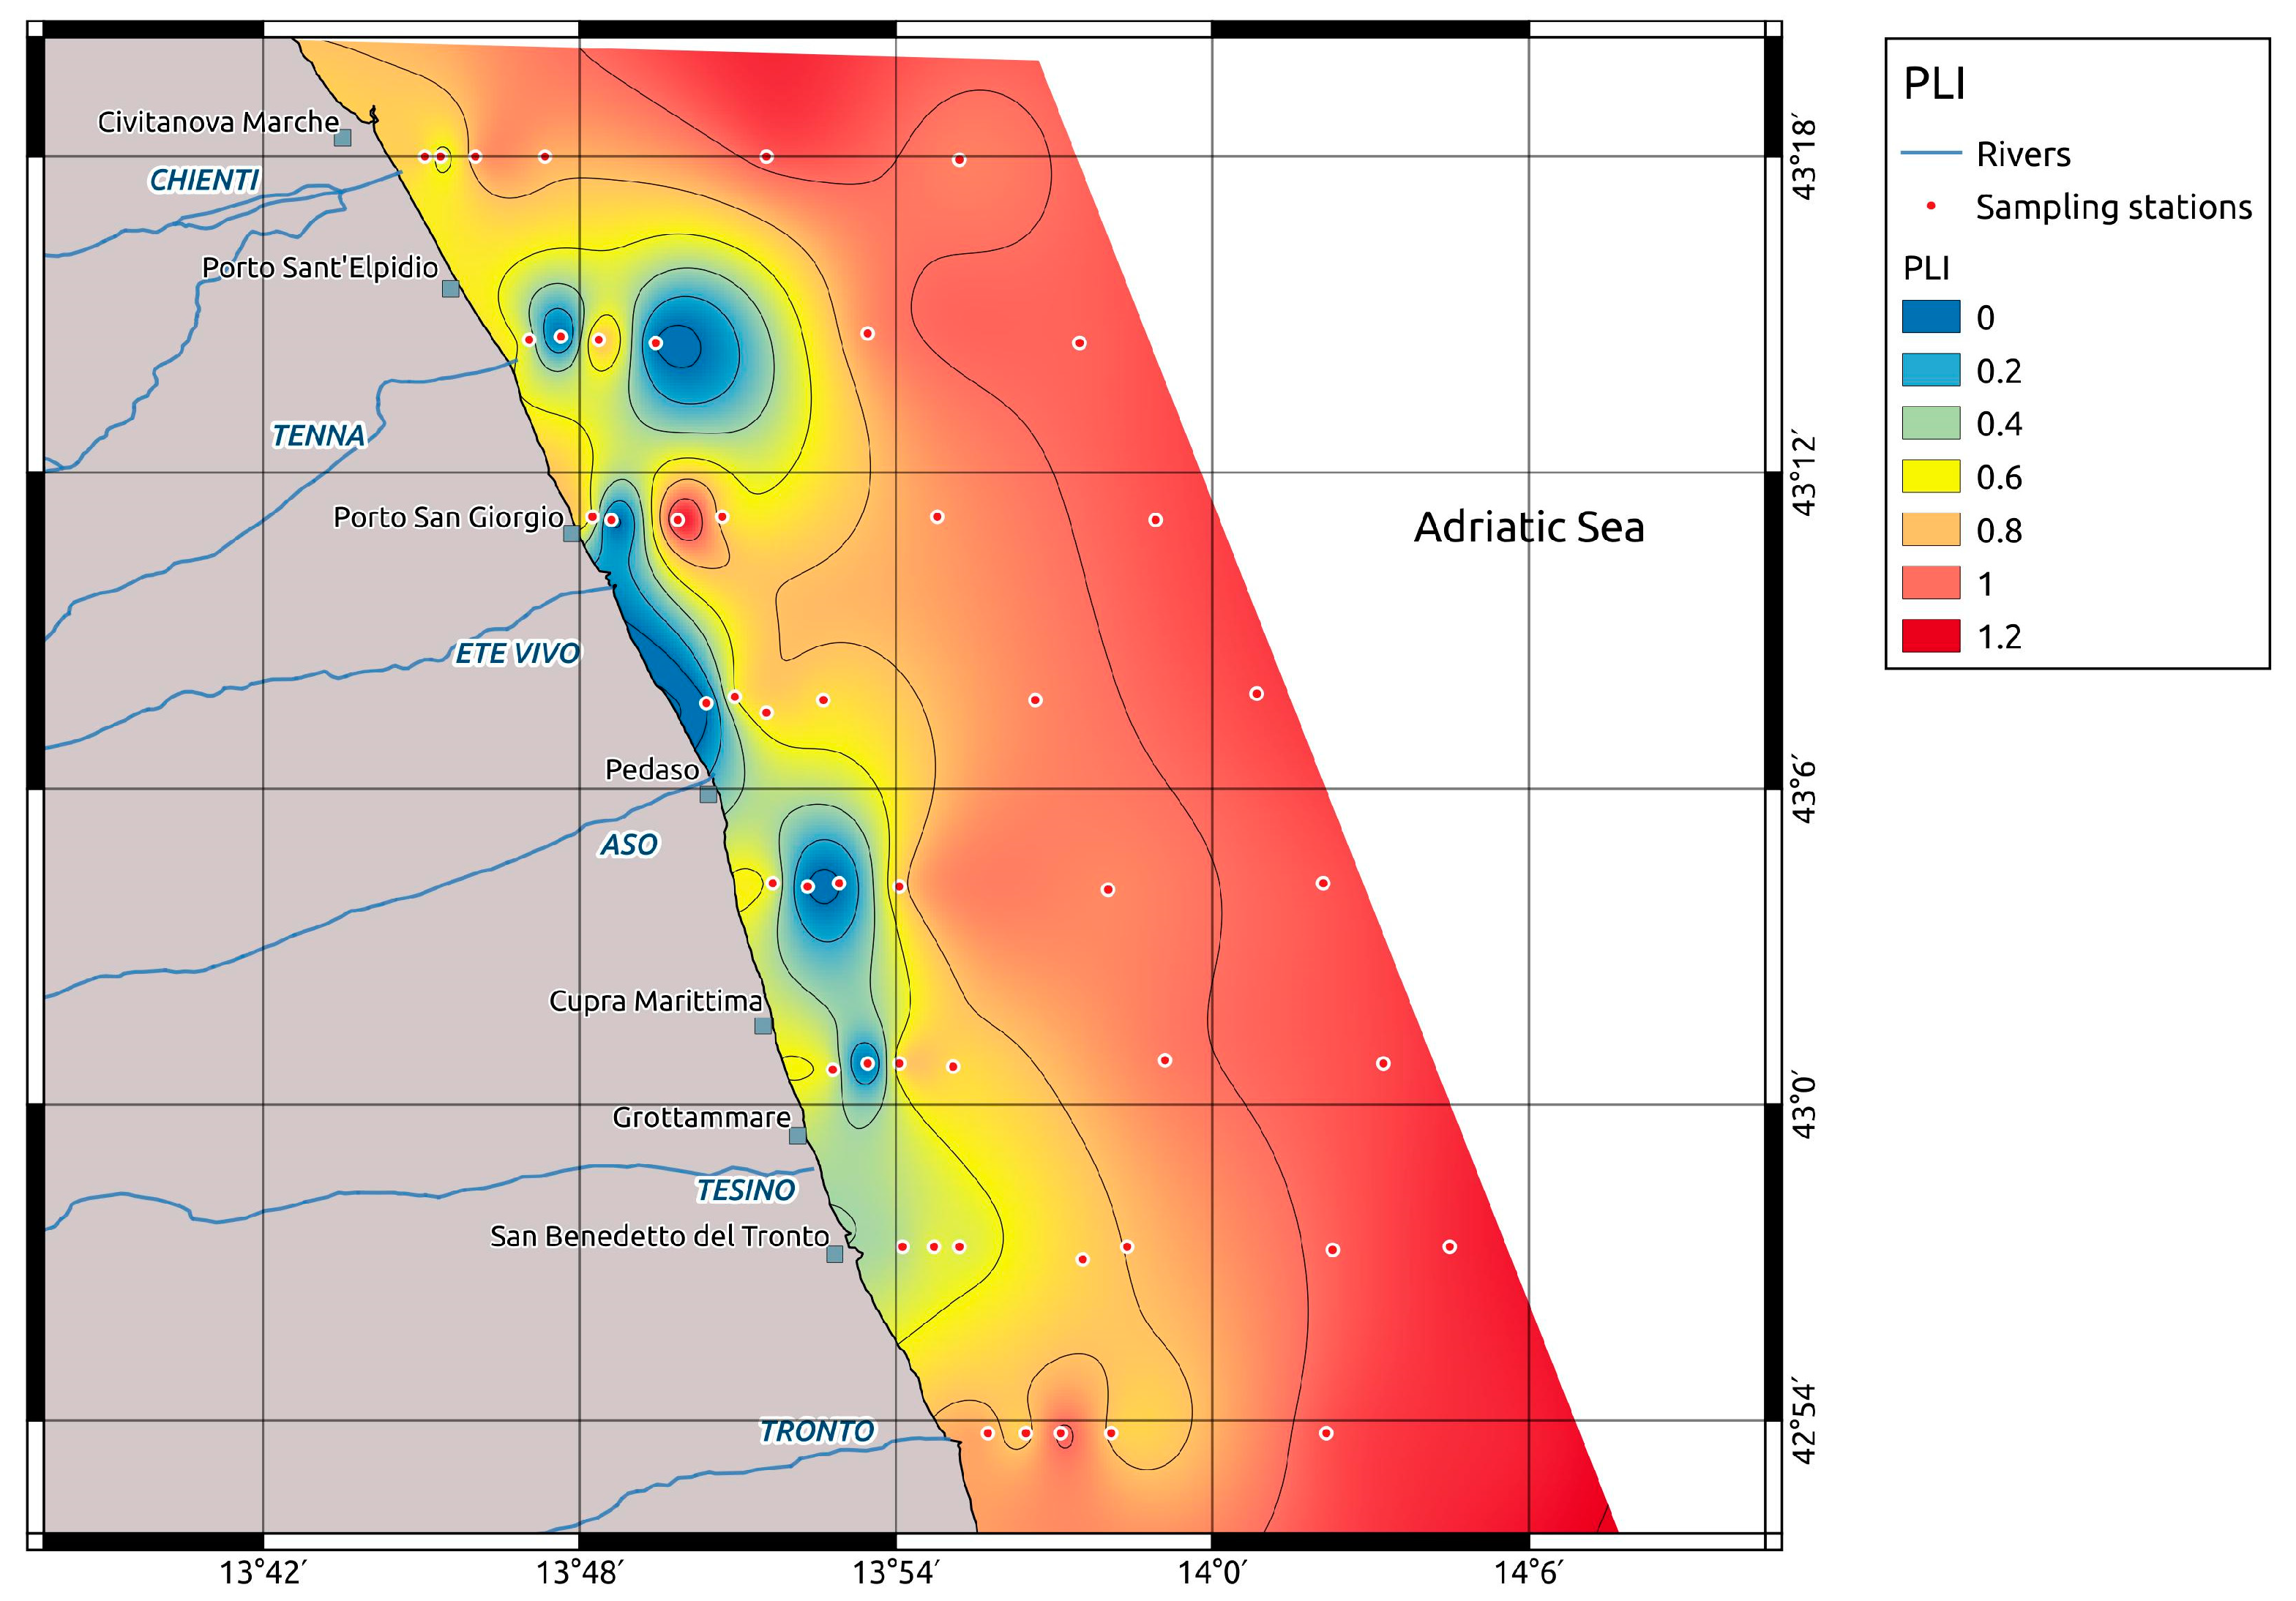
As regard the cumulative impact of the elements it is important to recall that the mCd and the PLI were calculated considering only metals or trace elements that show almost one value of Cf > 1 (As, Ba, Ga, Pb, Sr, and Zn). Despite the cumulative impact of more anthropogenic substances, the values of mCd are always below the threshold of 1.5, so all sample sites fall in the very low polluted class (Table 4). On the other hand, the PLI shows values slightly higher than 1 in front of the Civitanova Marche, at the higher depths towards the offshore, particularly on the south-eastern part of the study area, and in front of the Tronto River. While the high values of PLI present in the offshore are attributed to the fine grain size sediments coming from the north and belonging to the BSF1 Facies (Table 3, Figure 9), those occurring in the area between Chienti and Ete Vivo Rivers could be the results of local pollution inputs, in particular the pollution in this area could have been higher if it were related to finer grain-size. In this coastal area, the pollution is due to high values of As, followed by Pb and Zn. The high concentrations of heavy metals, mainly As, could be caused by the discharge of processing residues of fertilizer production industries that were operative along the southern Marche coast in the last century.
The following elements exhibit a Cf lower than one.
Co. The concentrations of Co in the whole area display an average value of 7.8 ppm and reach a maximum of 13 ppm (Table 3), in general below the local background and the average marine shale (Table 2), that suggest a regional depletion compared to global references. Its distribution displays an almost regular increase seaward (Figure 8a), common to all the elements included in the BSF1. The Cf values are constantly less than 1.
Cr. Chromium average concentration is 61.5 ppm with a maximum of 101 ppm (Table 3). The average marine shale (90 ppm Cr, Table 2) and the local background (128 ppm Cr, Table 2) values are comparable or higher indicating that there is no enrichment respect to the pre-industrial period. In some stations close to the coast, mainly sandy, some higher values are recorded and could be either related to possible anthropic inputs or to selective enrichment in heavy minerals, given the high values of other elements such as Zr and Ti. Many of the observations are above the L1 threshold level of the Italian legislation (50 ppm, Table 2). It should however be considered that, both for Cr and all the other considered elements, the values of the national legislation refer to an aqua regia digestion and not to a multi-acid digestion including HF, as the one applied in the present study.
Cu. Copper concentrations have a mean value of 14.4 ppm and a maximum value of 32 ppm Cu (Table 3), the latter is lower than the average marine shale (45 ppm) and the local background (40 ppm) ones. (Table 2). This element does not, therefore, represent an important issue for this area. This is further confirmed by the Cf values of Cu (Table 4) constantly lower than 1 as well as by the values of the EF and Igeo indexes, permanently lower than the minimum threshold values (Table 4). Considering this, there has not been any enrichment with respect to the pre-industrial periods. Indeed, the weak decrease in the last decades could be related to the reduction of northern riverine inputs.
Ni. Nickel has an average concentration of 32.7 ppm and a maximum of 63 ppm, which are both lower than the average marine shale and the local background. Despite of it, many stations show values above the L1 threshold level of the Italian legislation (30 ppm, Table 2). The comparison between the average values and the background data in the study area suggests that L1 threshold level of the Ni could be underestimated for this area, likely due to the different analytical method. A support is given by the Cf values always below 1 and by the EF and Igeo indexes constantly lower than the minimum threshold values (Table 4).
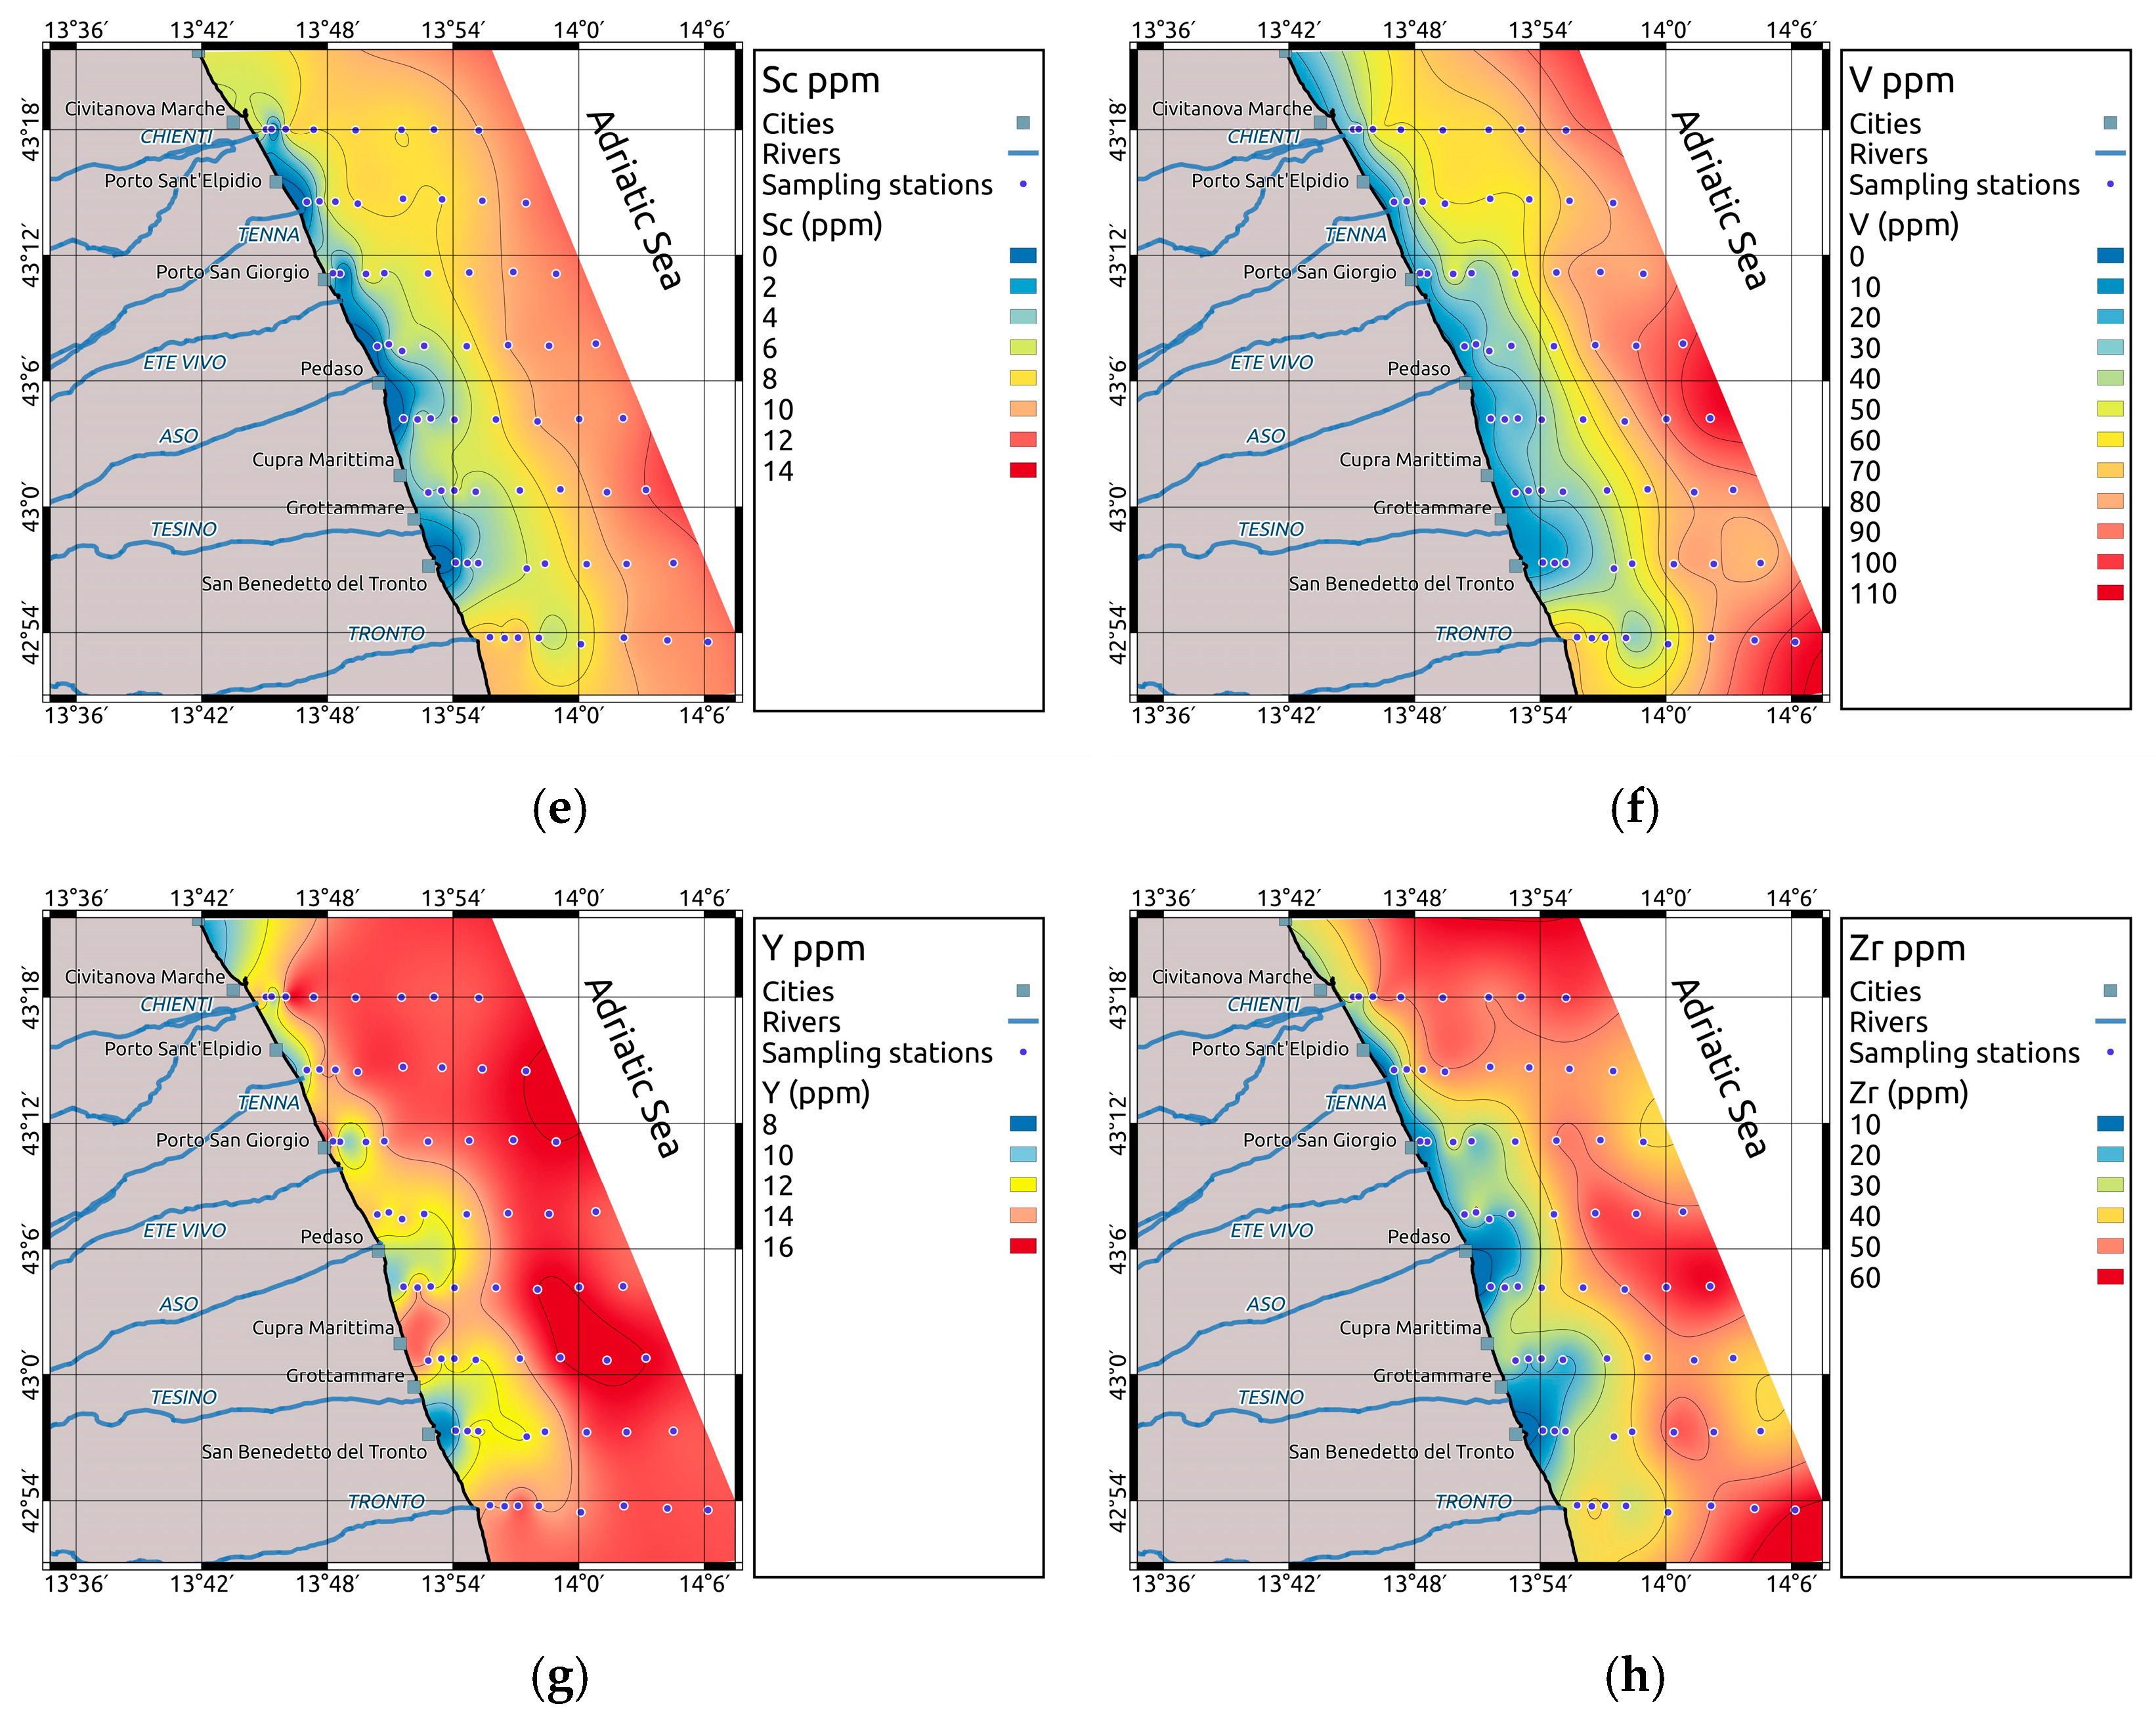
Sc. Scandium has an average concentration of 6.8 ppm and a maximum of 12 ppm (Table 3) against an average marine shale concentration of 13 ppm and a local background of 29 ppm (Table 2). It is not an element considered by the legislative side, and its Cf values are constantly less than 1 as well as the EF ER and Igeo indexes are permanently lower than minimum threshold values (Table 4). These data indicate that there is not Sc enrichments respect to the pre-industrial period and its decrease in the last decades could reflect the decrease of northern riverine inputs.
V. Vanadium has an average concentration of 49 ppm and a maximum value of 105 ppm. Its spatial distribution displays a clear seaward increase (Figure 8f). The values are below the average marine shale and the local background values (Table 2), likely for the diluting effect of the carbonate fraction and the relative importance of sandy sediments, both causing a general depletion of V. The Cf value are always lower and the EF and Igeo indexes and lower than the minimum threshold values (Table 4). This indicates that there are no enrichments of V respect to the pre-industrial period but an overall decrease. These decreases could be due to the decrease of northern riverine inputs in the last decades.
Y. Yttrium concentrations have an average concentration of 13.7 ppm and a maximum of 16 ppm, all values are well below the global reference and the local background (Table 2). The dilution effect of carbonate material is the likely explanation for this difference. The Cf values are always lower than 1; similarly, EF and Igeo indexes are constantly lower than the minimum threshold values (Table 4). All these evidence points to a lack of t enrichments of this element with respect to the pre-industrial period.
Zr. Zirconium has average value of 35 ppm Zr and a maximum value of 65 ppm that are well below the average marine shale (160 ppm, Table 2) and the local background (97 ppm, Table 2). The values of Cf value are always < 1, and EF and Igeo indexes are permanently lower than minimum threshold values (Table 4). This decrease respect to the pre-industrial period is attributed to the decrease of northern riverine inputs in the last decades.
The analysis of the core 47 also allows us to establish the background values of other elements other than those considered for the contamination assessment (Table 2). An important finding arises for the comparison between the present concentrations and the background values. The concentrations of most of the elements with a high affinity to clay and silicate minerals show a decrease respect to the background values (Table 5a), while other elements with an affinity with carbonate minerals exhibit an increasing respect to the past (Table 5b). These trends suggest a change in the sedimentation pattern in the area in the last decades. Specifically, this change consists in a percentage decrease of the clay contributions coming from the North and a percentage increase in the carbonate fraction due to the local river inputs. This change could be ascribed to the lower fine solid inputs of Po River as a result of the regimentation works and the lower quantity of water flowing of the Po River due to both the pumping water for zootechnical, agricultural and industrial uses and for the climate changes in the last decades [81].

4.2.2. Ecotoxicology of Central Western Adriatic Sea Bottom Sediments

The Numerical Sediment Quality Guidelines (SQGs) developed for marine and estuarine ecosystems as suggested by Rachel and Wasserman (2015) [71], are used here to evaluate the ecotoxicological state of the bottom sediments. According to Rachel and Wasserman SQGs (2015) [71], the following thresholds can be considered (Table 2): the TEL (Threshold Effect Level) that is the concentrations below which sediment-dwelling organism do not exhibit toxic effects; the ERL (effect range low) that is the concentrations below which sediment-dwelling organism rarely exhibit toxic effects; the PEL (Probable effect level) and the ERM (Effect Range Median) that are the concentrations above which toxic effects are detected frequently [82].
Most of the samples show As values exceeding the TEL; this is the consequence of the background values of As that is rather high in this area and due to the inputs of sediments coming from the North that present high As source catchment areas. Furthermore, two samples (303 and 106 sites) show As values exceeding the PEL. In this case, as previously noted for the contamination indexes, the exceeding of the SQLs thresholds is probably due to anthropic causes due to the discharges into the sea of waste of the fertilizer production of firms that have been operative along the Southern Marche coast during the 20th century. As regards the Cr, almost all samples exceed the TEL, 11 samples exceed the ERL and 3 samples overcame the PEL. The high contents of Cr that generally exceed the lower levels of some SQGs are ascribed to the composition of the sediments coming from the North that exhibits high Cr levels [14] and are a well-known geochemical signature sediment associated to the Po river in northern areas [83,84,85]. As regard the Ni, 34 stations exceed the TEL, 25 the ERL, and 16 the PEL. In this case, as for the Cr, these excesses could be ascribed to the composition of the sediments coming from the North, which naturally show high Ni levels, or due to the sediments affected by anthropogenic input in the North Adriatic. Finally, in the cases of Cu, Pb e Zn no station presents contents higher than the TEL.

5. Conclusions

The present work analyzes the bottom sediments in front of the Marche Region by using a multi-proxies and integrated approach. This allows us to recognize and to map the distribution of three main sedimentological and geochemical facies: the Padanic Facies (BSF1), the Coastal Facies (BSF2) and the Residual Facies (BSF3). The Padanic BSF1 Facies is characterized by fine siliciclastic sediments coming from Northern areas, reflecting the regional sediment dispersal pattern, mostly originating from the Po River, and transported southwards by the WAC and towards offshore by wave motion of the strongest storms. The BSF2 Coastal Facies is mainly defined by coarser sediments enriched in carbonatic minerals, coming from local rivers and partly mixed, by the wave motion of the stronger storms, with the sediments of the BSF1 Facies. The BSF3 Residual Facies is mainly composed by silty sediments coming from local rivers that are partially sorted from the clayey from the wave motion. Towards the offshore, this facies mixes progressively with sediments of Padanic sources coming from the North. The distribution of these three facies is the result of two principal processes. The first is the predominance of sedimentary inputs coming from the North and from local rivers, hence, the prevalence of sediments coming from source areas with different mineral-petrographic composition. The second regards the general hydrodynamic of the Adriatic Sea such as the cyclonic circulation that mainly flows southward near the Italian coast and the wave motion of the stronger storms directed perpendicularly to the coast.
The data processing of trace elements and heavy metals concentrations also allow us to determine the background reference values for the study area. It is noteworthy to stress that the Cr and Ni values recorded in the past and in the surface sediments of this study area are above the L1 threshold levels of the Italian legislation (DM 173/2016). On the other hand, the present and past concentrations of Pb are generally lower than it. This suggests a possible underestimation of Cr and Ni thresholds and an overestimation of the Pb threshold. Therefore, a further study in order to validate or reject these discrepancies on Cr, Ni and Pb reference values should be carried out.
The present study also identifies a small coastal area, between the Chieti and Ete Vivo rivers, that is probably affected by an As and Ba local pollution. The high contents of As could be ascribed to local discharges of waste of fertilizer productions during the 20th century. Moreover, the pollution of Ba is probably related to past discharges into the sea of drilling muds coming from oil platform perforation as reported for other area on the Central Adriatic Sea. Finally, the comparison between the background concentrations and the current average concentrations point to a general decrease in Al, Ti, P, Co, Cr, Cu, Ga, Ni, Pb, Sc, V, Y, and Zn and an increase in Ca and Sr. These trends suggest a change in the sedimentation in the last decades characterized by a decrease in the clayey contributions coming from the north and an increase in the carbonate fraction coming from the local rivers. This could be ascribed to the lower solid inputs of the Po River as a result of the regimentation works and the lower water flow prompted by both climate changes and pumping for irrigation, farm, civil and industrial uses.

Supplementary Materials

The following are available online at https://www.mdpi.com/2076-3417/11/3/1118/s1. Figure S1: Areal distribution of the elements in surface sediments. Ag (a), Mo (b), Be (c) and Te (d); Table S1: Values of the biogeochemical and sedimentological data and pollution indicators.

Author Contributions

Conceptualization, F.S.; Data curation, F.S., R.D.M., E.D., E.F., F.F. and P.G.; Formal analysis, F.S., E.D., E.F., F.F. and P.G.; Funding acquisition, F.S.; Investigation, F.S., F.F. and P.G.; Methodology, F.S., R.D.M., E.D., F.F. and P.G.; Project administration, F.S.; Resources, F.S.; Software, F.S., R.D.M. and P.G.; Supervision, F.S.; Validation, F.S., E.D., F.F. and P.G.; Visualization, F.S.; Writing—original draft, F.S., R.D.M., E.D., E.F., F.F. and P.G.; Writing—review & editing, F.S., R.D.M., E.D., E.F., F.F. and P.G. All authors will be informed about each step of manuscript processing including submission, revision, revision reminder, etc. via emails from our system or assigned Assistant Editor. All authors have read and agreed to the published version of the manuscript.

Funding

This study has been conducted with the financial support of PERSEUS Project, grant number 287600

Institutional Review Board Statement

Not applicable.

Informed Consent Statement

Not applicable.

Data Availability Statement

Data is contained within the article and the Supplementary Materials.

Acknowledgments

We want to give our thanks to the crew of the M/N Dallaporta, to the Giuseppe Corti and the Stefania Cocco of the Università Politecnica delle Marche, to Fabio Zaffagnini, Laura Borgognoni, Eva Turicchia and Piero Ferracuti, to Giuseppe Caccamo and Elisa Ghetti of the IRBIM Ancona, for their valuable help given during the sampling, analysis and data processing phases.

Conflicts of Interest

The authors declare no conflict of interest.

References

  1. Spagnoli, F.; Bergamini, M.C. Water-solid exchanges of nutrients and trace elements during early diagenesis resuspension of anoxic shelf sediments. Water Air Soil Pollut. 1997, 99, 541–556. [Google Scholar] [CrossRef]
  2. Marcaccio, M.; Spagnoli, F.; Frascari, F. Drilling discharges as tracer of sedimentation and geochemical processes in Adriatic, Sea. J. Coast. Res. 2003, 19, 89–100. [Google Scholar]
  3. Spagnoli, F.; Bartholini, G.; Dinelli, E.; Giordano, P. Geochemistry particles size of surface sediments of Gulf of Manfredonia (Southern Adriatic, Sea). Estuar. Coast. Shelf Sci. 2008, 80, 21–30. [Google Scholar] [CrossRef]
  4. Spagnoli, F.; Dinelli, E.; Giordano, P.; Marcaccio, M.; Zaffagnini, F.; Frascari, F. Sedimentological biogeochemical mineralogical facies of Northern and Central Western Adriatic, Sea. J. Mar. Syst. 2014, 139, 183–203. [Google Scholar] [CrossRef]
  5. Spagnoli, F.; Andresini, A. Biogeochemistry sedimentology of Lago di Lesina, (Italy). Sci. Total Environ. 2018, 643, 868–883. [Google Scholar] [CrossRef]
  6. Lopes-Rocha, M.; Langone, L.; Miserocchi, S.; Giordano, P.; Guerra, R. Spatial patterns and temporal trends of trace metal mass budgets in the western Adriatic sediments (Mediterranean Sea). Sci. Total Environ. 2017, 599, 1022–1033. [Google Scholar] [CrossRef] [PubMed]
  7. Lopes-Rocha, M.; Langone, L.; Miserocchi, S.; Giordano, P.; Guerra, R. Detecting long-term temporal trends in sediment-bound metals in the western Adriatic (Mediterranean, Sea). Mar. Pollut. Bull. 2017, 124, 270–285. [Google Scholar] [CrossRef]
  8. Bastami, K.D.; Neyestani, M.R.; Shermirani, F.; Soltani, F.; Haghparast, S.; Akbari, A. Heavy metal pollution assessment in relation to sediment properties in the coastal sediments of the southern Caspian, Sea. Mar. Pollut. Bull. 2015, 92, 237–243. [Google Scholar] [CrossRef]
  9. Burton, G.A.; Denton, D.L.; Ho, K.; Ireland, D.S. Sediment toxicity testing: Issues and methods. In Handbook of Ecotoxicology, 2nd ed.; Hoffman, D.J., Rattner, B.A., Burton, G.A., Jr., Cairns, J., Jr., Eds.; Lewis Publishers: Boca Raton, FL, USA, 2003; pp. 111–150. [Google Scholar]
  10. Focardi, S.; Specchiulli, A.; Spagnoli, F.; Fiesoletti, F.; Rossi, C. A combinated approach to investigate the biochemistry hydrology of a shallow bay in the South Adriatic Sea: The Gulf of Manfredonia, (Italy). Environ. Monit. Assess. 2009, 153, 209–220. [Google Scholar] [CrossRef]
  11. Pérez-Albaladejo, E.; Rizzi, J.; Fernandes, D.; Lille-Langøy, R.; Karlsen, O.A.; Goksøyr, A.; Oros, A.; Spagnoli, F.; Porte, C. Assessment of the environmental quality of coastal sediments by using a combination of in vitro bioassays. Mar. Pollut. Bull. 2016, 108, 53–61. [Google Scholar] [CrossRef]
  12. Roussiez, V.; Ludwig, W.; Radakovitch, O.; Probst, J.L.; Monaco, A.; Charrière, B.; Buscail, R. Fate of metals in coastal sediments of a Mediterranean flood-dominated system: An approach based on total and labile fractions. Estuar. Coast. Shelf Sci. 2011, 92, 486–495. [Google Scholar] [CrossRef] [Green Version]
  13. Spagnoli, F.; Dell’ Anno, A.; De Marco, A.; Dinelli, E.; Fabiano, M.; Gadaleta, M.V.; Ianni, C.; Loiacono, F.; Manini, E.; Marini, M.; et al. Biogeochemistry, grain size and mineralogy of the central and southern Adriatic Sea sediments: A review. Chem. Ecol. 2010, 26, 1944. [Google Scholar] [CrossRef] [Green Version]
  14. Spagnoli, F.; Kaberi, H.; Giordano, P.; Zeri, C.; Borgognoni, L.; Bortoluzzi, G.; Campanelli, A.; Ferrante, V.; Giuliani, G.; Martinotti, V.; et al. Benthic fluxes of dissolved heavy metals in polluted sediments of the Adriatic Sea. In Proceedings of the Integrated Marine Research in the Mediterranean and the Black Sea, Bruxelles, Belgium, 7–9 December 2015; pp. 301–302, 399. [Google Scholar]
  15. Neal, C.; Robson, A.J.; Jeffery, H.A.; Harrow, M.L.; Neal, M.; Smith, C.J.; Jarvie, H.P. Trace element inter-relationships for the Humber rivers: Inferences for hydrological and chemical controls. Sci. Total Environ. 1997, 194/195, 321–343. [Google Scholar] [CrossRef]
  16. Callender, E. Heavy Metals in the Environment-Historical, Trends. Treatise Geochem. 2003, 9, 67–105. [Google Scholar]
  17. Gao, X.; Chen, C.A. Heavy metal pollution status in surface sediments of the coastal Bohai, Bay. Water Res. 2012, 46, 1901–1911. [Google Scholar] [CrossRef]
  18. Illuminati, S.; Annibaldi, A.; Truzzi, C.; Tercier-Waeber, M.L.; Nöel, S.; Braungardt, C.B.; Achterberg, E.P.; Howell, K.A.; Turner, D.; Marini, M.; et al. In-situ trace metal (Cd, Pb, Cu) speciation along the Po River plume (Northern Adriatic Sea) using submersible systems. Mar. Chem. 2019, 212, 47–63. [Google Scholar] [CrossRef]
  19. Olsen, C.R.; Cutshall, N.H.; Larsen, I.L. Pollutant-particle association and dynamics in coastal marine environments: A review. Mar. Chem. 1982, 11, 501–533. [Google Scholar] [CrossRef]
  20. Bellas, J.; Nieto, O.; Beiras, R. Integrative assessment of coastal pollution: Development and evaluation of sediment quality criteria from chemical contamination and ecotoxicological data. Cont. Shelf Res. 2011, 31, 448–456. [Google Scholar] [CrossRef]
  21. Martins, M.A.; Mane, M.A.; Frontalini, F.; Santos, J.F.; Silva, F.S.; Terroso, D.; Miranda, P.; Figueira, R.; Laut, L.L.M.; Bernardes, C.; et al. Early diagenesis and adsorption by clay minerals important factors driving metal pollution in sediments. Environ. Sci. Pollut. Res. 2015, 22, 10019–10033. [Google Scholar] [CrossRef]
  22. Rial, D.; León, V.M.; Bellas, J. Integrative assessment of coastal marine pollution in the Bay of Santander and the Upper Galician Rias. J. Sea Res. 2017, 130, 239–247. [Google Scholar] [CrossRef]
  23. Frapiccini, E.; Panfili, M.; Guicciardi, S.; Santojanni, A.; Marini, M.; Truzzi, C.; Annibaldi, A. Effects of biological factors and seasonality on the level of polycyclic aromatic hydrocarbons in red mullet (Mullus barbatus). Environ. Pollut. 2020, 258, 113742. [Google Scholar] [CrossRef] [PubMed]
  24. Baldrighi, E.; Semprucci, F.; Franzo, A.; Cvitkovic, I.; Bogner, D.; Despalatovic, M.; Berto, D.; Formalewicz, M.M.; Scarpato, A.; Frapiccini, E.; et al. Meiofaunal communities in four Adriatic ports: Baseline data for risk assessment in ballast water management. Mar. Poll. Bull. 2019, 147, 171–184. [Google Scholar] [CrossRef] [PubMed]
  25. Fichet, D.; Radenac, G.; Miramand, P. Experimental studies of impacts of harbour sediments resuspension to marine invertebrates larvae: Bioavailability of Cd, Cu, Pb and Zn and toxicity. Mar. Pollut. Bull. 1998, 36, 509–518. [Google Scholar] [CrossRef]
  26. Rial, D.; Beiras, R. Prospective ecological risk assessment of sediment resuspension in an estuary. J. Environ. Monit. 2012, 14, 2137–2144. [Google Scholar] [CrossRef] [PubMed]
  27. Directive 2010/75/UE of the European Parliament and of the Council of the European Union, 2010, November 24 2010. Industrial emissions (integrated pollution prevention and control) (Recast). Off. J. Eur. Union 2010, L334, 17–119.
  28. OSPAR Commission. Protecting and Conserving the North-East Atlantic and Its Resources; Annual Report 2012/2013 OSPAR Secretariat; Publication Number: 620/2013; OSPAR Commission: London, UK, 2012. [Google Scholar]
  29. Camp Dresser & McKee, Inc. Guidelines for Water Reuse; EPA/625/R-04/108 (NTIS PB2005 106542); U.S. Environmental Protection Agency: Washington, DC, USA, 2004. [Google Scholar]
  30. Stankovic, S.; Kalaba, P.; Stankovic, A.R. Biota as toxic metal indicators. Environ. Chem. Lett. 2014, 12, 63–84. [Google Scholar] [CrossRef]
  31. Stankovic, S.; Stankovic, A.R. Bioindicators of toxic metals. In Green Materials for Energy, Products and Depollution; Springer: Dordrecht, The Netherlands, 2013; pp. 151–228. [Google Scholar] [CrossRef]
  32. Frontalini, F.; Greco, M.; Di Bella, L.; Lejzerowicz, F.; Reo, E.; Caruso, A.; Cosentino, C.; Maccotta, A.; Scopelliti, G.; Nardelli, M.P.; et al. Assessing the effect of mercury pollution on cultured benthic foraminifera community using morphological and eDNA metabarcoding approaches. Mar. Pollut. Bull. 2018, 129, 512–524. [Google Scholar] [CrossRef]
  33. Frontalini, F.; Semprucci, F.; Di Bella, L.; Caruso, A.; Cosentino, C.; Maccotta, A.; Scopelliti, G.; Sbrocca, C.; Bucci, C.; Balsamo, M.; et al. The response of cultured meiofaunal and benthic foraminiferal communities to lead contamination: Results from mesocosm experiments. Environ. Toxicol. Chem. 2018, 37, 2439–2447. [Google Scholar] [CrossRef]
  34. Bastami, K.D.; Bagheri, H.; Haghparast, S.; Soltani, F.; Hamzehpoor, A.; Bastami, M.D. Geochemical and geo-statistical assessment of selected heavy metals in the surface sediments of the Gorgan Bay, Iran. Mar. Pollut. Bull. 2012, 64, 2877–2884. [Google Scholar] [CrossRef]
  35. Buccolieri, A.; Buccolieri, G.; Cardellicchio, N.; Dell’ Atti, A.; Di Leo, A.; Maci, A. Heavy metals in marine sediments of Taranto Gulf (Ionian Sea, southern Italy). Mar. Chem. 2006, 99, 227–235. [Google Scholar] [CrossRef]
  36. de Souza Machado, A.A.; Spencer, K.; Kloas, W.; Toffolon, M.; Zarfl, C. Metal fate and effects in estuaries: A review and conceptual model for better understanding of toxicity. Sci. Total Environ. 2016, 541, 268–281. [Google Scholar] [CrossRef] [PubMed]
  37. El Nemr, A.M.; El Sikaily, A.; Khaled, A. Total leachable heavy metals in muddy sandy sediments of Egyptian coast along Mediterranean, Sea. Environ. Monit. Assess. 2007, 129, 151–168. [Google Scholar] [CrossRef] [PubMed]
  38. Hakanson, L. An ecological risk index for aquatic pollution control. A sedimentological approach. Water Res. 1980, 14, 975–1001. [Google Scholar] [CrossRef]
  39. Manahan, S. Chimica Dell’ambiente, 6th ed.; Piccin: Padova, Italy, 2000. [Google Scholar]
  40. Wright, P.; Mason, C.F. Spatial and seasonal variation in heavy metals in the sediments and biota of two adjacent estuaries, the Orwell and the Stour, in eastern England. Sci. Total Environ. 1999, 226, 139–156. [Google Scholar] [CrossRef]
  41. Tam, N.F.Y.; Wong, Y.S. Spatial variation of heavy metals in surface sediments of Hong Kong mangrove swamps. Environ. Pollut. 2000, 110, 195–205. [Google Scholar] [CrossRef]
  42. Natali, C.; Bianchini, G. Natural vs anthropogenic components in sediments from the Po River delta coastal lagoons (NE Italy). Environ. Sci. Pollut. Res. 2018, 25, 2981–2991. [Google Scholar] [CrossRef]
  43. DM 173/2016. Ministero Dell’ambiente e della Tutela del Territorio e del Mare. Decreto 15 luglio 2016, n. 173. Regolamento Recante Modalità e Criteri Tecnici Per L’autorizzazione All’immersione in Mare dei Materiali di Escavo di Fondali Marini. (16G00184) (GU Serie Generale n.208 del 06-09-2016-Suppl. Ordinario n. 40). Available online: https://www.gazzettaufficiale.it/eli/gu/2016/09/06/208/so/40/sg/pdf (accessed on 26 January 2021).
  44. Annibaldi, A.; Illuminati, S.; Truzzi, C.; Scarponi, G. Heavy Metals in Spring and Bottled Drinking Waters of Sibylline Mountains National Park (Central Italy). J. Food Prot. 2018, 81, 295–301. [Google Scholar] [CrossRef]
  45. Droghini, E.; Annibaldi, A.; Prezioso, E.; Tramontana, M.; Frapiccini, E.; De Marco, R.; Illuminati, S.; Truzzi, C.; Spagnoli, F. Mercury content in Central and Southern Adriatic Sea sediments in relation to seafloor geochemistry and sedimentology. Molecules 2019, 24, 4467. [Google Scholar] [CrossRef] [Green Version]
  46. Frascari, F.; Marcaccio, M.; Spagnoli, F.; Modica, A. Effects of offshore drilling activities on the geochemical and sedimentological processes in the Northern Adriatic coastal area. Period. Biol. 2000, 102, 225–241. [Google Scholar]
  47. Curzi, P.V.; Tomadin, L. Dinamica della sedimentazione pelitica attuale ed olocenica nell’Adriatico centrale. G. Di Geol. 1987, 49, 101–111. [Google Scholar]
  48. Artegiani, A.; Bregant, D.; Paschini, E.; Pinardi, N.; Raicich, F.; Russo, A. The Adriatic Sea General Circulation. Part I: Air–Sea Interactions and Water Mass Structure. J. Phys. Oceanogr. 1997, 27, 1492–1514. [Google Scholar] [CrossRef]
  49. Marini, M.; Russo, A.; Paschini, E.; Grilli, F.; Campanelli, A. Short-term physical and chemical variations in the bottom water of middle Adriatic depressions. Clim. Res. 2006, 31, 227–237. [Google Scholar] [CrossRef]
  50. Artegiani, A.; Paschini, E.; Russo, A.; Bregant, D.; Raicich, F.; Pinardi, N. The Adriatic Sea General Circulation. Part II: Baroclinic Circulation Structure. J. Phys. Oceanogr. 1997, 27, 1515–1532. [Google Scholar] [CrossRef]
  51. Civitarese, G.; Gačvić, M.; Lipizer, M.; Borzelli, G. On the impact of the Bimodal Oscillating System (BiOS) on the biogeochemistry and biology of the Adriatic and Ionian Seas (Eastern Mediterranean). Biogeosci. Discuss. 2010, 7. [Google Scholar] [CrossRef]
  52. Lipizer, M.; Partescano, E.; Rabitti, A.; Giorgetti, A.; Crise, A. Qualified temperature, salinity and dissolved oxygen climatologies in a changing Adriatic Sea. Ocean Sci. 2014, 10, 771–797. [Google Scholar] [CrossRef] [Green Version]
  53. Vilibić, I.; Supić, N. Dense water generation on a shelf: The case of the Adriatic Sea. Ocean Dyn. 2005, 55, 403–415. [Google Scholar] [CrossRef]
  54. Boldrin, A.; Carniel, S.; Giani, M.; Marini, M.; Bernardi Aubry, F.; Campanelli, A.; Grilli, F.; Russo, A. Effects of bora wind on physical and biogeo chemical properties of stratified waters in the northern Adriatic. J. Geophys. Res. 2009, 114, C08S92. [Google Scholar] [CrossRef]
  55. Vilibić, I.; Mihanović, H.; Janeković, I.; Šepić, J. Modelling the formation of dense water in the northern Adriatic: Sensitivity studies. Ocean Model. 2016, 101, 17–29. [Google Scholar] [CrossRef]
  56. Marini, M.; Maselli, V.; Campanelli, A.; Foglini, F.; Grilli, F. Role of the Mid-Adriatic deep in dense water interception and modification. Mar. Geol. 2016, 375, 5–14. [Google Scholar] [CrossRef]
  57. Frascari, F.; Spagnoli, F.; Marcaccio, M.; Giordano, P. Anomalous Po river flood event effects on sediments and water column of the Northwestern Adriatic Sea. Clim. Res. 2006, 31, 151–165. [Google Scholar] [CrossRef]
  58. Van Straaten, L.M.J.U. Holocene and late-Pleistocene sedimentation in the Adriatic Sea. Geol. Rundsch. 1970, 60, 106–131. [Google Scholar] [CrossRef]
  59. Syvitski, J.P.; Kettner, A.J. On the flux of water and sediment into the Northern Adriatic Sea. Cont. Shelf Res. 2007, 27, 296–308. [Google Scholar] [CrossRef]
  60. Dinelli, E.; Lucchini, F. Sediment supply to the Adriatic Sea basin from the Italian rivers; geochemical features and environmental constraints. G. Di Geol. 1999, 61, 121–132. [Google Scholar]
  61. Frignani, M.; Langone, L.; Ravaioli, M.; Sorgente, D.; Alvisi, F.; Albertazzi, S. Fine-sediment mass balance in the western Adriatic continental shelf over a century time scale. Mar. Geol. 2005, 222–223, 113–133. [Google Scholar] [CrossRef]
  62. Colantoni, P.; Tramontana, M.; Tedeschi, R. Contributo alla conoscenza dell’Avampaese Apulo: Struttura del Golfo di Manfredonia (Adriatico Meridionale). G. Di Geol. 1990, 52, 19–32. [Google Scholar]
  63. Ronchi, L.; Fontana, A.; Correggiari, A.; Asioli, A. Late Quaternary incised and infilled landforms in the shelf of the northern Adriatic Sea (Italy). Mar. Geol. 2018, 405, 47–67. [Google Scholar] [CrossRef]
  64. Palermo, F.; Mosconi, G.; Angeletti, M.; Polzonetti-Magni, A.M. Assessment of water pollution in the Tronto River (Italy) by applying useful biomarkers in the fish model Carassius auratus. Archives Environ. Contam. Toxicol. 2008, 55, 295–304. [Google Scholar] [CrossRef]
  65. Acciarri, A.; Bisci, C.; Cantalamessa, G.; Di Pancrazio, G.; Spagnoli, F. Gli effetti antropici nell’evoluzione storica della costa “Picena”. Studi Costieri 2017, 24, 3–10. [Google Scholar]
  66. Acciarri, A.; Bisci, C.; Cantalamessa, G.; Di Pancrazio, G.; Spagnoli, F. Tendenza evolutiva della spiaggia della Riserva Naturale della Sentina (San Benedetto del Tronto, AP). Studi Costieri 2017, 24, 11–16. [Google Scholar]
  67. Acciarri, A.; Bisci, C.; Cantalamessa, G.; Cappucci, S.; Conti, M.; Di Pancrazio, G.; Spagnoli, F.; Valentini, E. Metrics for short-term coastal characterization, protection and planning decisions of Sentina Natural Reserve, Italy. Ocean Coast. Manag. 2021, 201, 105472. [Google Scholar] [CrossRef]
  68. Froelich, P.N. Analysis of organic carbon in marine sediments. Limnol. Oceanogr. 1980, 25, 564–572. [Google Scholar]
  69. Shirani, M.; Afzali, K.N.; Jahan, S.; Soleimani-Sardo, M. Pollution and contamination assessment of heavy metals in the sediments of Jazmurian playa in southeast Iran. Sci. Rep. 2020, 10, 4775. [Google Scholar] [CrossRef] [PubMed]
  70. Li, Y.H. Distribution Patterns of the Elements in the Ocean: A Synthesis. Geochim. Cosmochim. Acta 1991, 55, 3223–3240. [Google Scholar] [CrossRef]
  71. Rachel, T.; Wasserman, H. Sediment Quality Guidelines (SQGs): A Review and Their Use in Practice. Geoenviron. Eng. 2015. Available online: https://www.geoengineer.org/education/web-class-projects/cee-549-geoenvironmental-engineering-fall-2015/assignments/sediment-quality-guidelines-sqgs-a-review-and-their-use-in-practice (accessed on 26 January 2021).
  72. Palinkas, C.; Nittrouer, C. Clinoform sedimentation along the Apennine shelf, Adriatic Sea. Mar. Geol. 2006, 234, 245–260. [Google Scholar] [CrossRef]
  73. Surricchio, G.; Pompilio, L.; Novelli, A.A.; Scamosci, E.; Marinangeli, L.; Tonucci, L.; D’Alessandro, N.; Tangari, A.C. Evaluation of heavy metals background in the Adriatic Sea sediments of Abruzzo region, Italy. Sci. Total Environ. 2019, 684, 445–457. [Google Scholar] [CrossRef]
  74. Wu, W.; Wu, P.; Yang, F.; Sun, D.; Zhang, D.; Zhou, Y. Assessment of heavy metal pollution and human health risks in urban soils around an electronics manufacturing facility. Sci. Total Environ. 2018, 630, 53–61. [Google Scholar] [CrossRef]
  75. Davis, J.C. Statistics and Data Analysis in Geology, 3rd ed.; John Wiley & Sons: New York, NY, USA, 2002; 638p. [Google Scholar]
  76. Klovan, J.E.; Imbrie, J. An algorithm and FORTRAN-IV program for large-scale Q-mode factor analysis and calculation of factor scores. J. Int. Assoc. Math. Geol. 1971, 3, 61–77. [Google Scholar] [CrossRef]
  77. Imbrie, J.F. Purdy. Classification of modern Bahamian carbonate sediments. In classification of carbonate rocks. Am. Assoc. Rel. Geol. Mem. 1982, 7, 257–272. [Google Scholar]
  78. Wessel, P.; Bercovici, D. Interpolation with splines in tension: A Green’s function approach. Math. Geol. 1998, 30, 77–93. [Google Scholar] [CrossRef]
  79. Wessel, P.; Luis, J.F.; Uieda, L.; Scharroo, R.; Wobbe, F.; Smith, W.H.F.; Tian, D. The Generic Mapping Tools version 6. Geochem. Geophys. Geosyst. 2019, 20, 5556–5564. [Google Scholar] [CrossRef] [Green Version]
  80. Frontalini, F.; Cordier, T.; Balassi, E.; Armynot du Châtelet, E.; Cermakova, K.; Apothéloz-Perret-Gentil, L.; Alves Martins, M.V.; Bucci, C.; Scantamburlo, E.; Treglia, M.; et al. Benthic foraminiferal metabarcoding and morphology-based assessment around three offshore gas platforms: Congruence and complementarity. Environ. Int. 2020, 144, 106049. [Google Scholar] [CrossRef] [PubMed]
  81. Price, N.B.; Mowbray, S.; Giordani, P. Sedimentation and heavy metal input changes on the Northwest Adriatic Sea shelf: A consequence of anthropogenic activity. Proceeding of the 10th Meeting of the Italian Association of Oceanology and Limnology, Alassio, Italy, 4–6 November 1999; pp. 23–33. [Google Scholar]
  82. Burton, G.A., Jr. Sediment quality criteria in use around the world. Limnology 2002, 3, 65–76. [Google Scholar] [CrossRef]
  83. Amorosi, A. Chromium and nickel as indicators of source-to-sink sediment transfer in a Holocene alluvial and coastal system (Po Plain, Italy). Sediment. Geol. 2012, 280, 260–269. [Google Scholar] [CrossRef]
  84. Amorosi, A.; Centineo, M.C.; Dinelli, E.; Lucchini, F.; Tateo, F. Geochemical and mineralogical variations as indicators of provenance changes in Late Quaternary deposits of SE Po Plain. Sediment. Geol. 2002, 151, 273–292. [Google Scholar] [CrossRef]
  85. Greggio, N.; Giambastiani, B.M.S.; Campo, B.; Dinelli, E.; Amorosi, A. Sediment composition, provenance, and Holocene paleoenvironmental evolution of the Southern Po River coastal plain (Italy). Geol. J. 2018, 53, 914–928. [Google Scholar] [CrossRef]
Figure 1. Bathymetric map of the Adriatic Sea with the three morphological sectors (lower left corner), the general Adriatic Sea circulation (in the center) and the study area (on the upper right corner). WAC: Western Adriatic Current; EAC: Eastern Adriatic Current; NAdG: North Adriatic Gyre; MAdG: Mid Adriatic Gyre; SAdG = South Adriatic Gyre. AdDW: Adriatic Dense Water (in blue North Adriatic formation area of AdW-NAdDW). LIW: Levantine intermediate Water. BIOS: Adriatic-Ionian bimodal oscillating system [50,51,52,53].
Applsci 11 01118 g001
Figure 2. Study area with the mainland geological setting and sampling stations, red and yellow dots, respectively (a); topographic section along the study area (b). The map has been generated using QGIS 3.10.4-A Coruña. Rivers courtesy of ISPRA (http://www.sinanet.isprambiente.it/it/sia-ispra/download-mais/reticolo-idrografico/view), and the geological setting courtesy of Geoportale Nazionale (http://www.pcn.minambiente.it/viewer/).
Applsci 11 01118 g002
Figure 3. Histogram of the factor scores (a) and map of the areal distribution of the of the BSF1 (b).
Applsci 11 01118 g003aApplsci 11 01118 g003b
Figure 4. Histogram of the factor scores (a) and map of the areal distribution of the of the BSF2 (b).
Applsci 11 01118 g004
Figure 5. Histogram of the factor scores (a) and map of the areal distribution of the of the BSF3 (b).
Applsci 11 01118 g005
Figure 6. Areal distribution of the elements in surface sediments. (a) Al, (b) Fe, (c) K, (d) Mg, (e) S, (f) Ca, (g) Ti, (h) P, (i) Na, (j) Mn, and (k) Li.
Applsci 11 01118 g006aApplsci 11 01118 g006b
Figure 7. Areal distribution of the elements in surface sediments with Cf > 1 in some samples. (a) As, (b) Ba, (c) Ga, (d) Pb, (e) Sr, and (f) Zn.
Applsci 11 01118 g007aApplsci 11 01118 g007b
Figure 8. Areal distribution of the elements in surface sediments with Cf < 1 in all samples. (a) Co, (b) Cr, (c) Cu, (d) Ni, (e) Sc, (f) V, (g) Y, and (h) Zr.
Applsci 11 01118 g008aApplsci 11 01118 g008b
Figure 9. Areal distribution of the PLI values.
Applsci 11 01118 g009
Table 1. Summary of the classification categories of sediment contamination derived from the different applied indicators.
CfClassificationEFClassificationIgeoClassificationmCdClassificationPLIClassification
<8Low≤2Low enrichment<0Unpolluted<1.5Very low<1Unpolluted
8–16Moderate2–5Moderate
enrichment
0–1Unpolluted to
moderately polluted
1.5 < mCd < 2Low1–2Unpolluted to
moderately polluted
16–32Considerable5–20High enrichment1–2Moderately polluted2 < mCd < 4Moderate2–3Moderately polluted
>32Very high20–40Very high
enrichment
2–3Moderately to strongly polluted4 < mCd < 8High3–4Moderately to highly polluted
>40Extreme
enrichment
3–4Strongly polluted8 < mCd < 16Very high4–5Highly polluted
4–5Strongly to extremely strongly polluted16 < mCd < 32Extremely high>5Very highly polluted
>5Extremely polluted32 < mCdUltra high
Table 2. Reference values, local background, normative limits and ecotoxicological reference concentrations for the elements investigated in the present study, when available 1 [70].
UnitMarine Shales (1)Local BackgroundL1 DM 173/2016L2 DM 173/2016DM 173/2016TELERLPELERM
Agppm0.07
Al%86.9 1
Asppm1310122015.9331785
Bappm580295
Beppm3
Ca%1.611
Cdppm0.3 0.30.80.030.653.539
Coppm1913
Crppm90128501501377090145
Cuppm4540405213670197390
Fe%4.723.5 1
Gappm1916.2
Hgppm0.04 0.30.80.030.20.20.491.3
K%2.661.6
Lippm662.2
Mg%1.5
Mnppm850774.5
Moppm2.6
Na%0.96
Nbppm11
Nippm68733075118303650
Pppm7000.06
Pbppm201830701353591.3110
Sppm2400n.a
Scppm1329
Srppm300348
Teppm0.08n.a
Tippm46000.3
Vppm130116 1
Yppm2625
Znppm95481001501123120315270
Zrppm16097
Table 3. Summary statistics for the investigated variables.
UnitMeanMedianMinMaxDev. Stn
Water content%35.836.420.259.111.364
Porosity%56.358.238.177.911.964
Bioclasts%1.10.10.019.63.164
Sand%33.517.30.296.734.264
Silt%34.938.12.461.818.564
Clay%30.531.70.866.219.964
TN%0.10.10.00.10.064
IC%4.34.43.15.50.664
OC%0.40.40.11.00.264
δ13CPDB−24.0−23.7−26.4−21.20.864
OC/TN 8.88.54.911.51.264
carbonates %3.73.62.45.90.763
pH 7.37.36.88.10.364
EhmV−98.1−125.9−250.0143.788.364
Agppm0.20.2<0.31.60.29
Al%4.03.72.56.01.248
Asppm9.19<3315.841
Bappm272.827123432921.648
Beppm1.11<120.629
Ca%12.813.558.915.42.148
Cdppm <0.3 0
Coppm7.873133.248
Crppm61.5612710115.948
Cuppm14.4123328.048
Fe%1.91.70.793.30.848
Gappm12.312.55225.248
Hgppm0.60.50.52.00.32
K%1.41.2412.40.448
Mg%1.21.0950.582.00.548
Lippm26.82385314.848
Mnppm703.9714.550687367.648
Moppm1.10.5<14.01.016
Na%1.61.521.022.40.348
Nippm32.728.5106317.348
P%0.00.0490.0260.10.048
Pbppm12.1116244.748
Sppm0.20.20.140.40.048
Scppm6.86.5<4123.042
Srppm352.935428043634.048
Teppm3.011123.019
Ti%0.20.1850.110.30.048
Vppm49.444.51410526.848
Yppm13.7149161.748
Znppm49.045159325.248
Zrppm35.335.5116013.848
Table 4. Statistical values (mean, median, min, max and dev.st.) of the contamination indexes data and pollution indicators.
MeanMedianMinMaxDev. Std.n
AsCf1.01.00.33.10.541
EF1.81.60.74.80.841
Igeo−0.7−0.6−2.31.00.641
BaCf0.90.90.81.10.148
EF1.71.81.02.70.548
Igeo−0.7−0.7−0.9−0.40.141
CoCf0.60.50.21.00.248
EF1.01.00.61.20.248
Igeo−1.5−1.5−2.7−0.60.648
CrCf0.50.50.20.80.148
EF0.90.80.51.60.248
Igeo−1.7−1.7−2.8−0.90.441
CuCf0.40.30.10.80.248
EF0.60.60.21.20.248
Igeo−2.3−2.3−4.3−0.90.948
GaCf0.80.80.31.40.348
EF1.21.30.81.60.248
Igeo−1.0−0.9−2.0−0.10.641
NiCf0.40.40.10.90.248
EF0.70.70.31.00.248
Igeo−1.9−1.7−3.5−0.80.841
PbCf0.70.60.31.30.348
EF1.11.10.72.40.248
Igeo−1.2−1.3−2.2−0.20.541
ScCf0.30.30.10.40.142
EF0.40.40.30.50.042
Igeo−2.6−2.4−3.4−1.90.537
SrCf1.01.00.81.30.148
EF1.91.91.02.90.648
Igeo−0.6−0.6−0.9−0.30.141
VCf0.40.40.10.90.248
EF0.70.70.31.10.248
Igeo−1.9−1.7−3.6−0.70.941
YCf0.50.60.40.60.148
EF1.01.00.71.40.248
Igeo−1.5−1.4−2.1−1.20.241
ZnCf0.70.60.21.30.348
EF1.11.00.51.50.348
Igeo−1.4−1.3−2.9−0.30.848
ZrCf0.40.40.10.60.148
EF0.60.60.30.90.248
Igeo−2.2−2.0−3.7−1.30.748
mCd00.80.80.01.30.350
PLI00.70.70.01.10.450
Table 5. Elements that decrease respect to the past (a); elements that increase respect to the past (b); elements for which only the background value is available (c).
ElementPresent Average Values (ppm)Background Values (ppm)
(a)
Al4.036.9
Ti0.20.3
P0.050.06
Co 7.813.0
Cr61.5128.0
Cu14.440.0
Fe1.933.49
Ga12.316.2
K1.431.64
Mg1.232.22
Mn703.9774.5
Ni32.773.0
P0.050.06
Pb12.118
Sc7.429.0
Ti0.190.32
V49.4116.0
Y13.725.0
Zn49.074.0
(b)
Ca12.010.0
Sr353.0348.0
(c)
Ce 59
Fe 3.49
Nb 1.65
Rb 115
Publisher’s Note: MDPI stays neutral with regard to jurisdictional claims in published maps and institutional affiliations.