Article

Multiaxial Fatigue Assessment for the Hanger Deck Connection of a High-Speed Steel-Truss-Arch Railway Bridge

1
Jinling Institute of Technology, 99 Hongjing Avenue, Jiangning District, Nanjing 211169, China
2
Key Laboratory of Concrete and Prestressed Concrete Structures of Ministry of Education, Southeast University, 2 Sipailou Rd., Xuanwu District, Nanjing 210096, China
3
Shenzhen Express Engineering Consulting Co., Ltd., Shenzhen 518000, China
4
JSTI, Nanjing 210017, China
*
Author to whom correspondence should be addressed.
Appl. Sci. 2021, 11(3), 1142; https://doi.org/10.3390/app11031142
Submission received: 31 December 2020 / Revised: 21 January 2021 / Accepted: 24 January 2021 / Published: 26 January 2021

Abstract

:
Steel-truss-arch bridges have been applied in high-speed railway bridges due to their excellent dynamic and static structural performance. Under the action of high-speed trains, the steel connections between hangers and decks suffer from repeated stresses, inducing potential fatigue problems or even fatigue failure. In this study, a multiaxial fatigue evaluation method was first created and established based on critical damage-plane methodology, following which the fatigue evaluation procedure was also created and recommended. The methodology was applied to real-life strain data from a high-speed railway bridge from which an assessment of fatigue damage and predicted fatigue life was estimated. The connection between the shortest hanger and deck on the downstream side was selected as the target due to its relatively high stress. A multiscale finite-element model of this bridge was created according to the design profile and monitoring results of traffic flow, where the finite-element model was calibrated and validated by comparing the calculation results with the monitoring data. Influence analysis was then carried out to investigate two factors—i.e., the total traffic flow and compositions of freight trains—having effects on the fatigue life of the steel connection. The results indicate that the applied multiaxial fatigue method is suitable for online fatigue evaluation of actual bridges. In addition, by using the multiaxial fatigue method, the fatigue-damage accumulation rate can be nearly 60 times that obtained by the uniaxial fatigue method. If freighting is taken into consideration, the fatigue damage will increase rapidly, and for the case 10% of proportion traffic as freighting, the actual fatigue life is estimated to be shorter than the design life.

1. Introduction

As typical connection members between arch ribs and bridge decks, hangers of arch bridges are required to be robust enough to sustain dead and live loads. According to the magnitude of the flexural rigidity, the hangers of arch bridges are divided into flexible and rigid hangers [1,2,3]. As typical flexible hangers, steel wires and steel rebars are extensively applied in deck-type arch bridges to coordinate the diverse mechanical properties between ribs and decks. However, flexible hangers are unable to provide essential rigidity and stability to adapt to the requirements of small deformation and vibration. Recently, rigid hangers have been more commonly applied in half-through arch bridges, especially in high-speed railway arch bridges, to reduce the dynamic responses of railway bridges under cyclic loads, such as winds, earthquakes and running trains [4,5,6,7,8,9,10]. Initially, concrete or prestressed concrete was used to produce rigid hangers. However, concretes frequently suffer from cracking, assembly and replacement problems. Recently, profile steels, such as rectangular and H-shaped steels, have been used extensively to manufacture rigid hangers due to their high installation and maintenance efficiency [11,12]. As replacements for traditional cables, rigid steel hangers have been considered specimens with infinite fatigue lives for very small vibration and stress ranges, and the wind- or train-induced fatigue lives for cable-stayed arch bridges have been within the design life requirements [13,14,15].
Compared to flexible hangers, rigid hangers sustain more complicated stress under transportation loads and environmental actions due to their considerable cross-sectional stiffness. Among all hangers of whole arch bridges, rigid hangers near the roots of arch ribs have to suffer from higher stress with obvious multiaxial properties due to their short lengths [16,17]. Under the action of dynamic live loads, the shortest rigid hangers are subjected to repeated actions of tensile, shear and bending stresses, inducing a higher fatigue-cracking risk. However, the most likely positions of fatigue cracking for the shortest rigid hangers are located at the connections between the hangers and bridge-deck beams [18]. The reason for this risk is the more serious and complicated multiple-axle stress field due to the special geometric profile and short lengths of the connected hangers.
To execute fatigue assessments with significant multiple-axle properties, various multiple-axle fatigue methods have evolved and been applied based on different assumptions or theories. Three typical methods have been established to predict the fatigue life by transforming the complex stress or strain state into a simple equivalent stress or strain. These three typical methods are the static-strength method, the equivalent energy method and the critical plane method [19,20]. Among them, the critical plane method has been extensively applied in actual projects because of its specific definition of fatigue damage, and the simplification of the critical stress state. According to their different assumptions for failure rules, fatigue damage functions were built by using tensile or shear-related critical planes, where fatigue-failure is dependent on the evolution or accumulation of tensile or shear stress amplitudes.
In this paper, a multiaxial fatigue evaluation method was first proposed based on the critical-damage plane methodology by applying the shearing stress in the critical-damage plane as the fatigue parameter, where the critical plane is assumed to be vertical to the maximum nominal stress. Then, fatigue assessment can be achieved by using the Basquin equation to convert this multiaxial fatigue problem into a fatigue problem of pure torsion. The recommended multiaxial fatigue evaluation method was then applied in the fatigue-life assessment of an actual project, i.e., the Dashengguan Yangze River High-speed Railway Bridge in Nanjing, China, to evaluate the fatigue properties of the connection between the shortest hanger and deck. A multiscale numerical model was created and calibrated to obtain the related fatigue parameters according to the monitoring results of the hangers. Having obtained the annual fatigue damage of the target part, the influences of two factors, i.e., the total traffic flow and compositions of freight trains, on the fatigue life were emphatically investigated for future bridge maintenance.

2. Multiaxial Fatigue Assessment Method

2.1. Critical-Damage-Plane Function

Various critical-damage-plane functions have been applied for fatigue evaluations with multiple stresses. Typical methods, and their advantages and disadvantages, are presented in Table 1 [21]. A typical “stress—number of cycles” formula is introduced and applied in this paper for multiaxial fatigue-life evaluation due to its low dependence on fatigue experiments on specific structures [22]. Using the shear-stress amplitude in the critical-damage plane as the typical fatigue effect, the equation can be described as follows:
t x y , a = f ( N f ) = t 1 1 κ N f b 1
where txy,a is the shear-stress amplitude; Nf is the fatigue life in the form of the stress cycle number; t−1 is the fatigue limit in torsion; and κ and b1 are fatigue strength-related indexes that can be obtained by fatigue experiments on metal materials.
Then, the Basquin equation is applied to convert the multiaxial fatigue problem into a pure-torsion fatigue problem, which can be described as follows:
t x y , a = f ( N f ) = τ f ( 2 N f ) b 2
where τf and b2 are two fatigue-strength indexes under the condition of pure torsion loading.
On the basis of defining the critical fatigue-damage plane where the maximum nominal stress is located, the fatigue-life prediction formulation can be deduced as follows:
t e q , a = f ( N f ) = ( C a * ) 2 C a * N m a x * + ( t 1 2 f 1 2 ) ( f 1 + 2 C a * ) N m a x *
where teq,a is the equivalent stress amplitude, C a * and N a * are the shear-stress amplitude and maximum nominal stress on the critical plane, respectively; t−1, f−1, κ and b2 are four material-related indexes that can be obtained by existing fatigue experiments. Table 2 presents the comparison results of fatigue experiments and theoretical predictions. As shown in the figure, the difference is within the dispersion zone of three times, showing the accuracy of the method.

2.2. Fatigue-Damage Accumulation Rule

Equations (1)–(3) provide the fatigue-life calculation method under constant stress-amplitude loading. However, actual projects are mostly subjected to loading with variable stress amplitudes. Therefore, proper accumulation rules must be introduced to account for each instance of fatigue damage and to finally obtain the fatigue life with the help of the definition of critical damage.
Although various nonlinear fatigue-damage accumulation rules have been proposed for single or multiaxial fatigue problems, their complex formulations have prevented their widespread application [23,24,25]. In comparison, the traditional linear fatigue-damage rule, Miner’s rule [26], has also been the most popular due to its simple and reasonable formulation. Therefore, Miner’s rule is applied in this paper to calculate the accumulated fatigue damage.

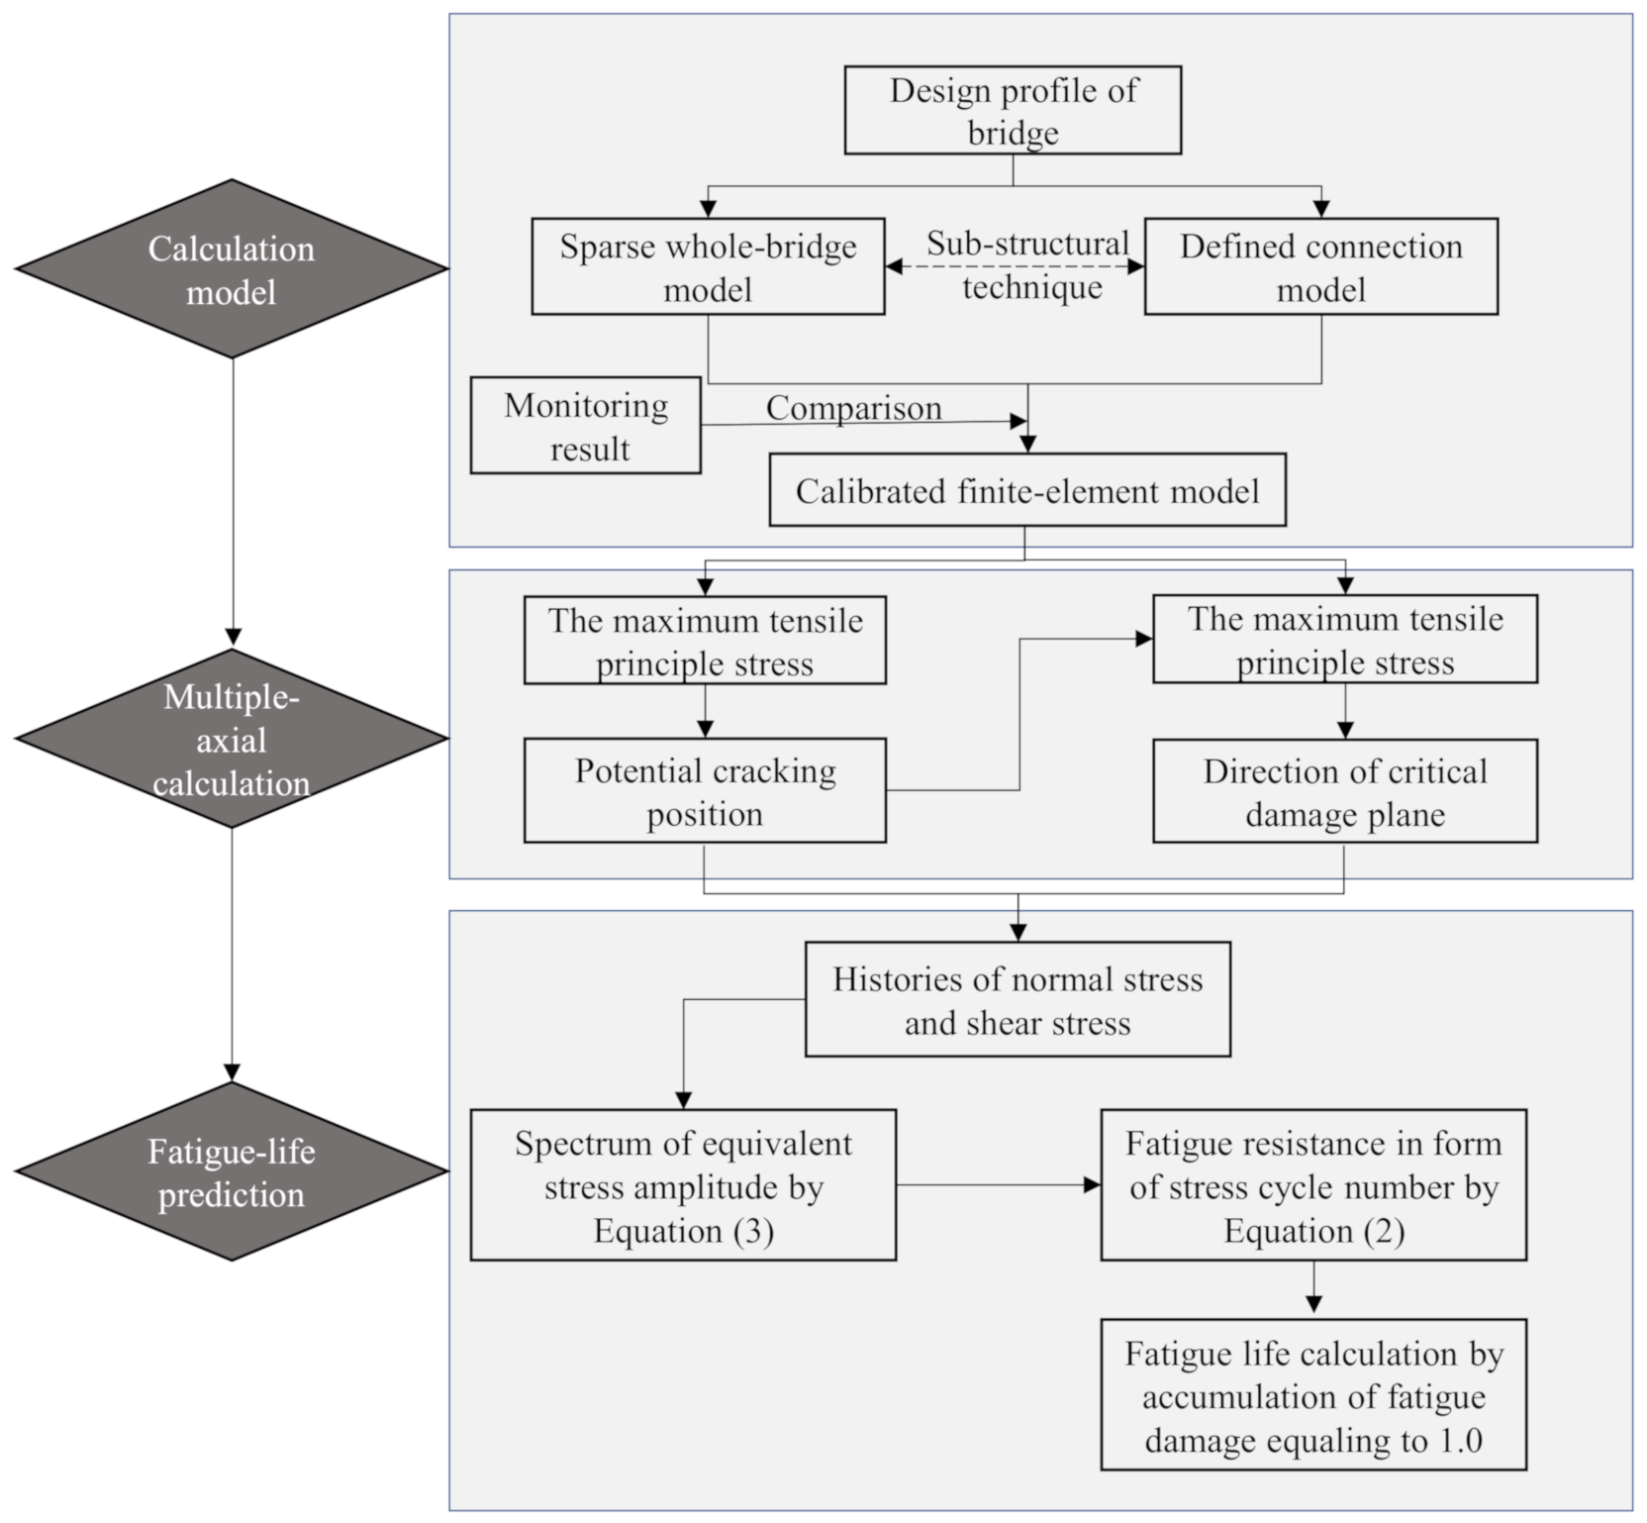
2.3. Evaluation Procedure

The fatigue-life evaluation and assessment procedure, which is shown in Figure 1, is presented as follows:
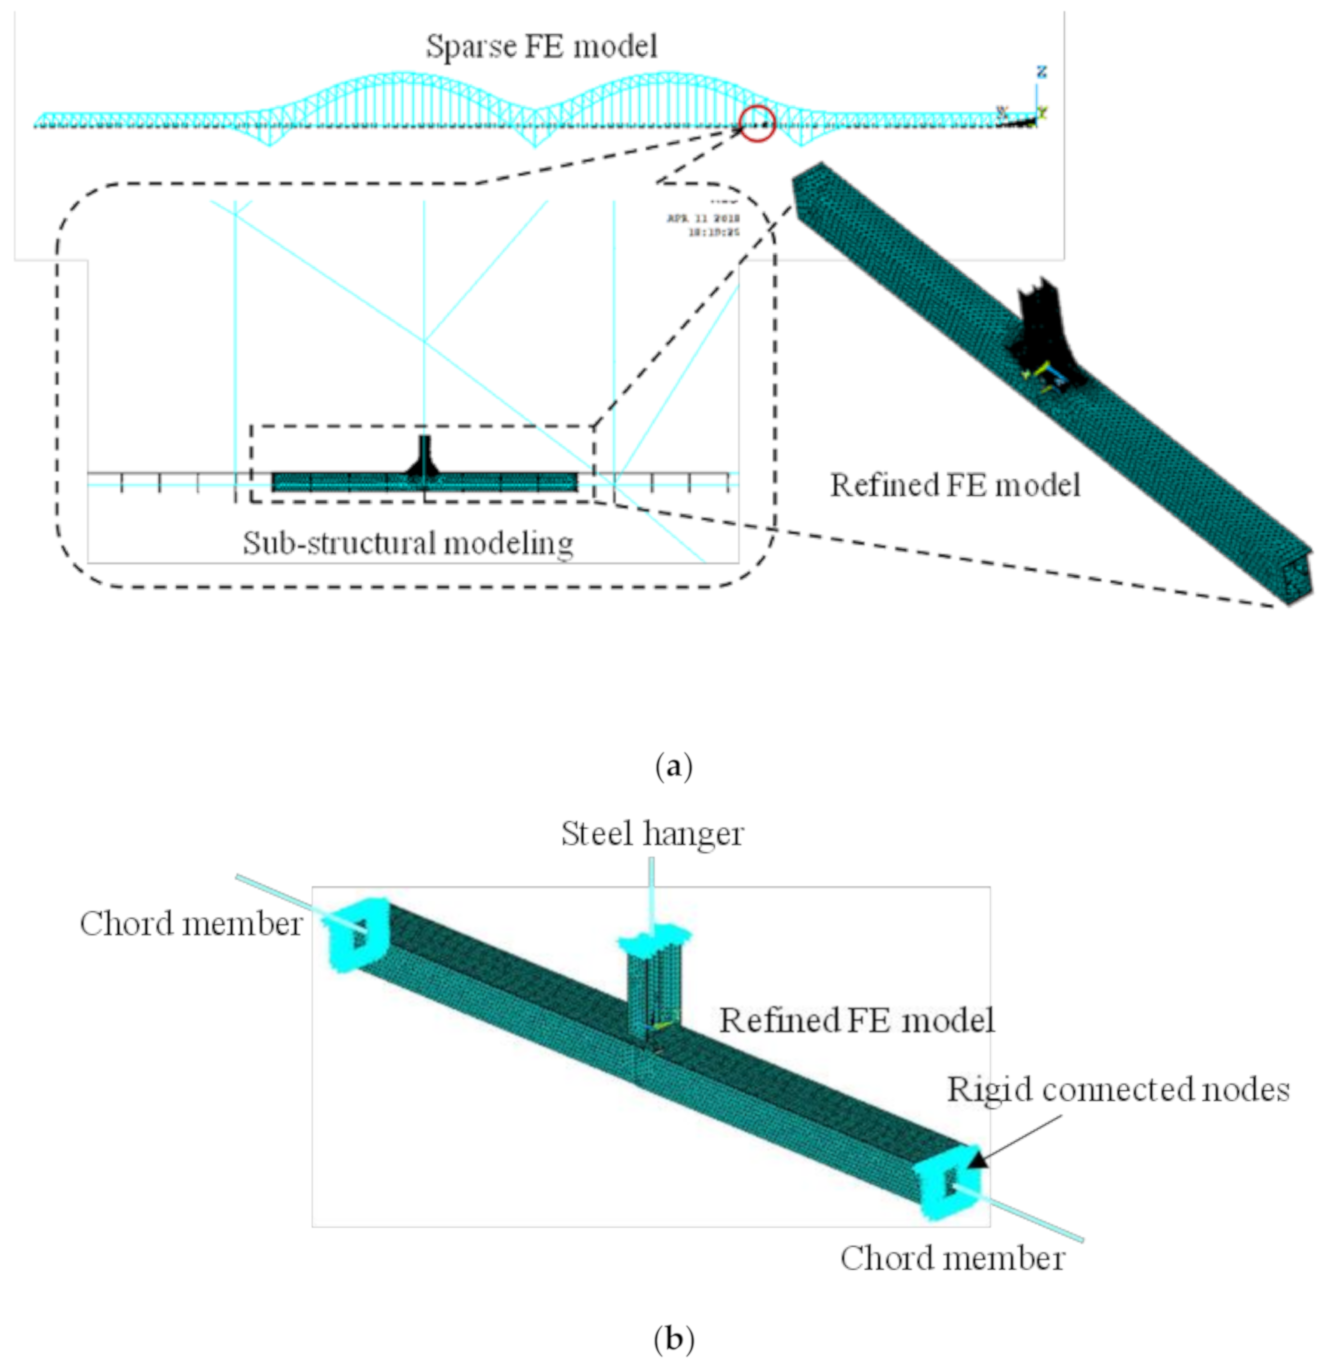
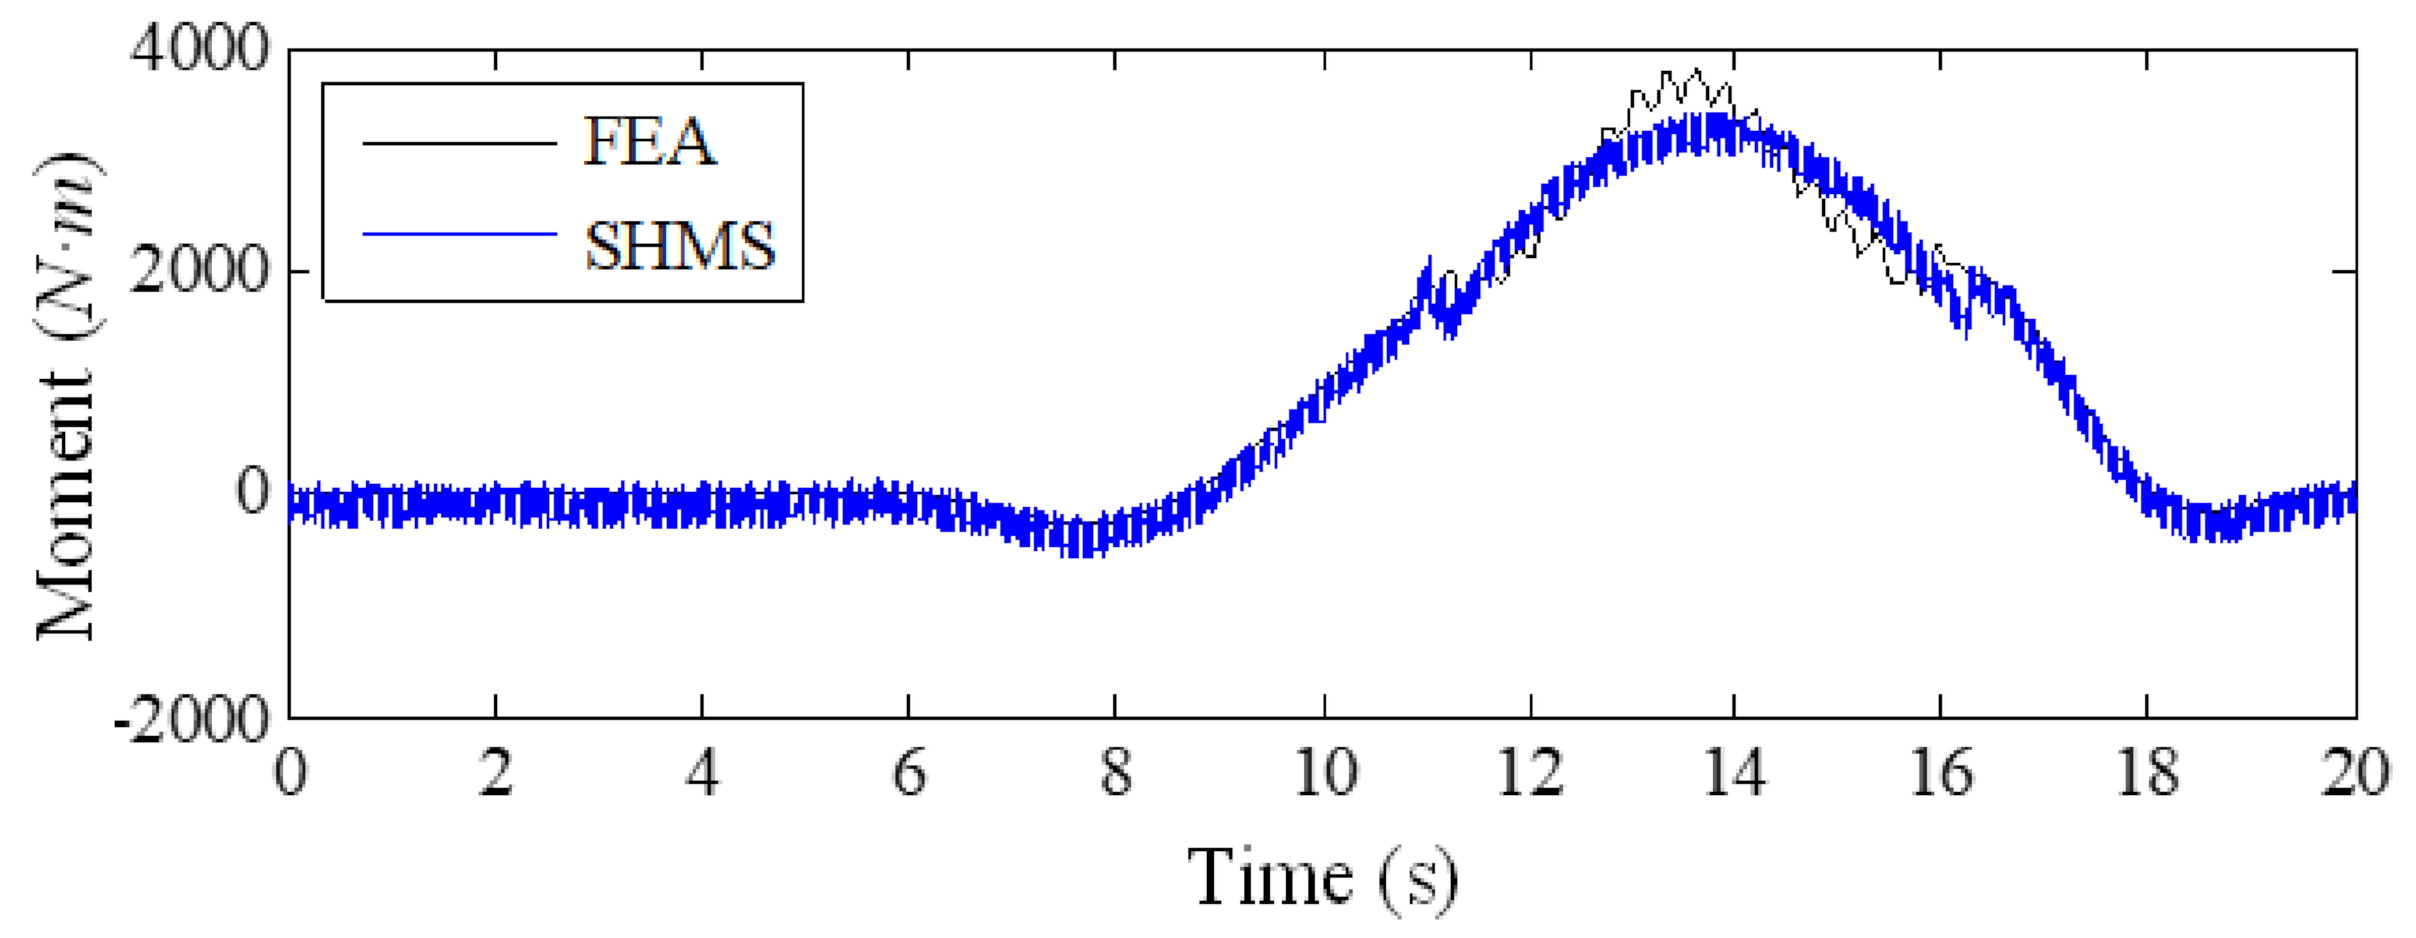
  • A multiscale finite-element model of a short hanger’s connection to a bridge deck was created according to the design profile of the Dashengguan Yangtze River High-speed Railway Bridge, where a substructural technique was used to link two levels of finite element models, i.e., the sparse whole-bridge model and defined connection model. Then, the multiple-dimensional finite-element model was calibrated and validated by comparing its calculation results to the field motoring data.
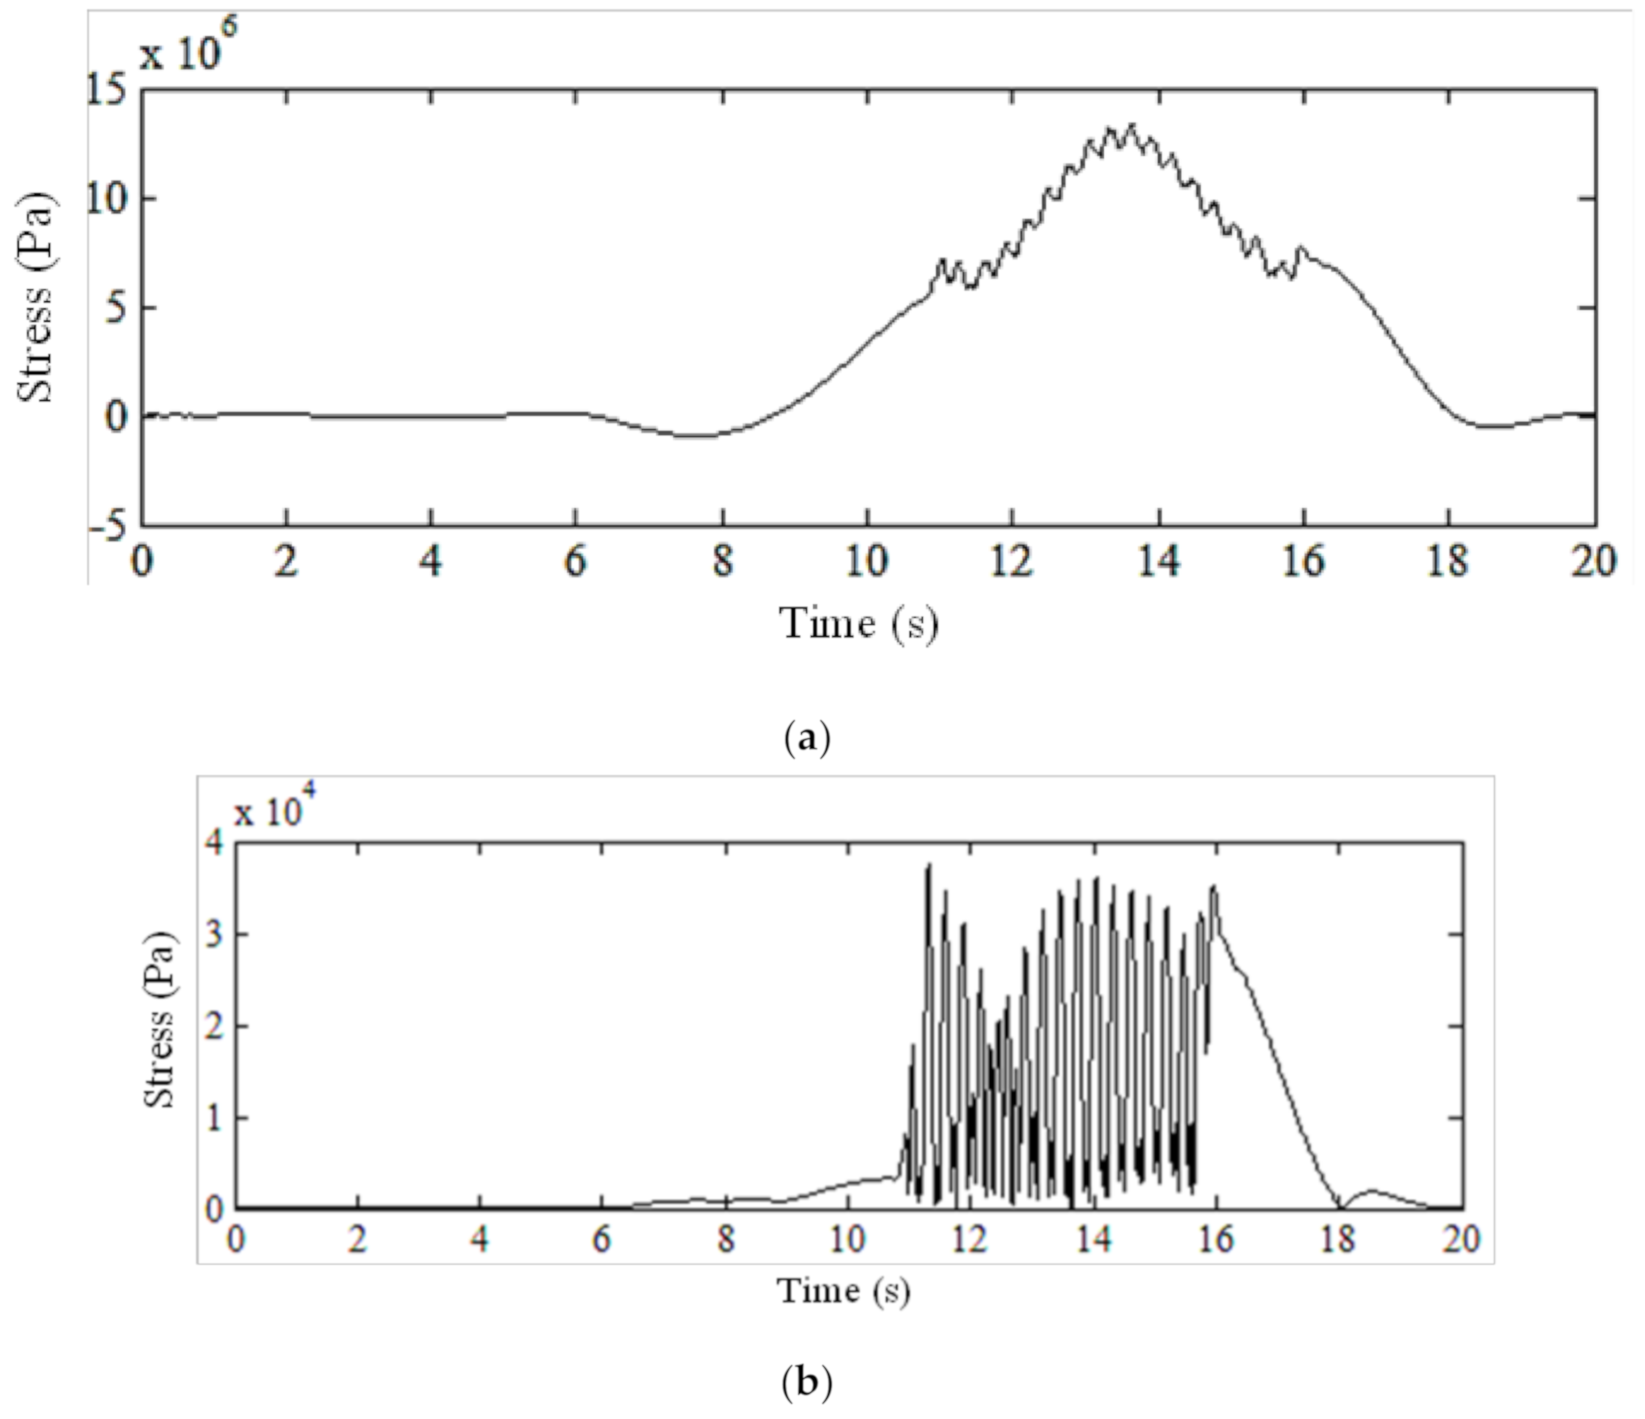
  • According to the multiscale finite element calculation of the tensile principle stress, the position of the maximum value was first obtained and validated under the action of high-speed trains. By mechanical analysis of the element at this position, the critical damage plane was confirmed to be perpendicular to the direction of the tensile principal stresses. Then, histories of the normal stress and shear stress on the critical plane of fatigue failure were calculated and obtained for further fatigue-damage evaluation and assessment.
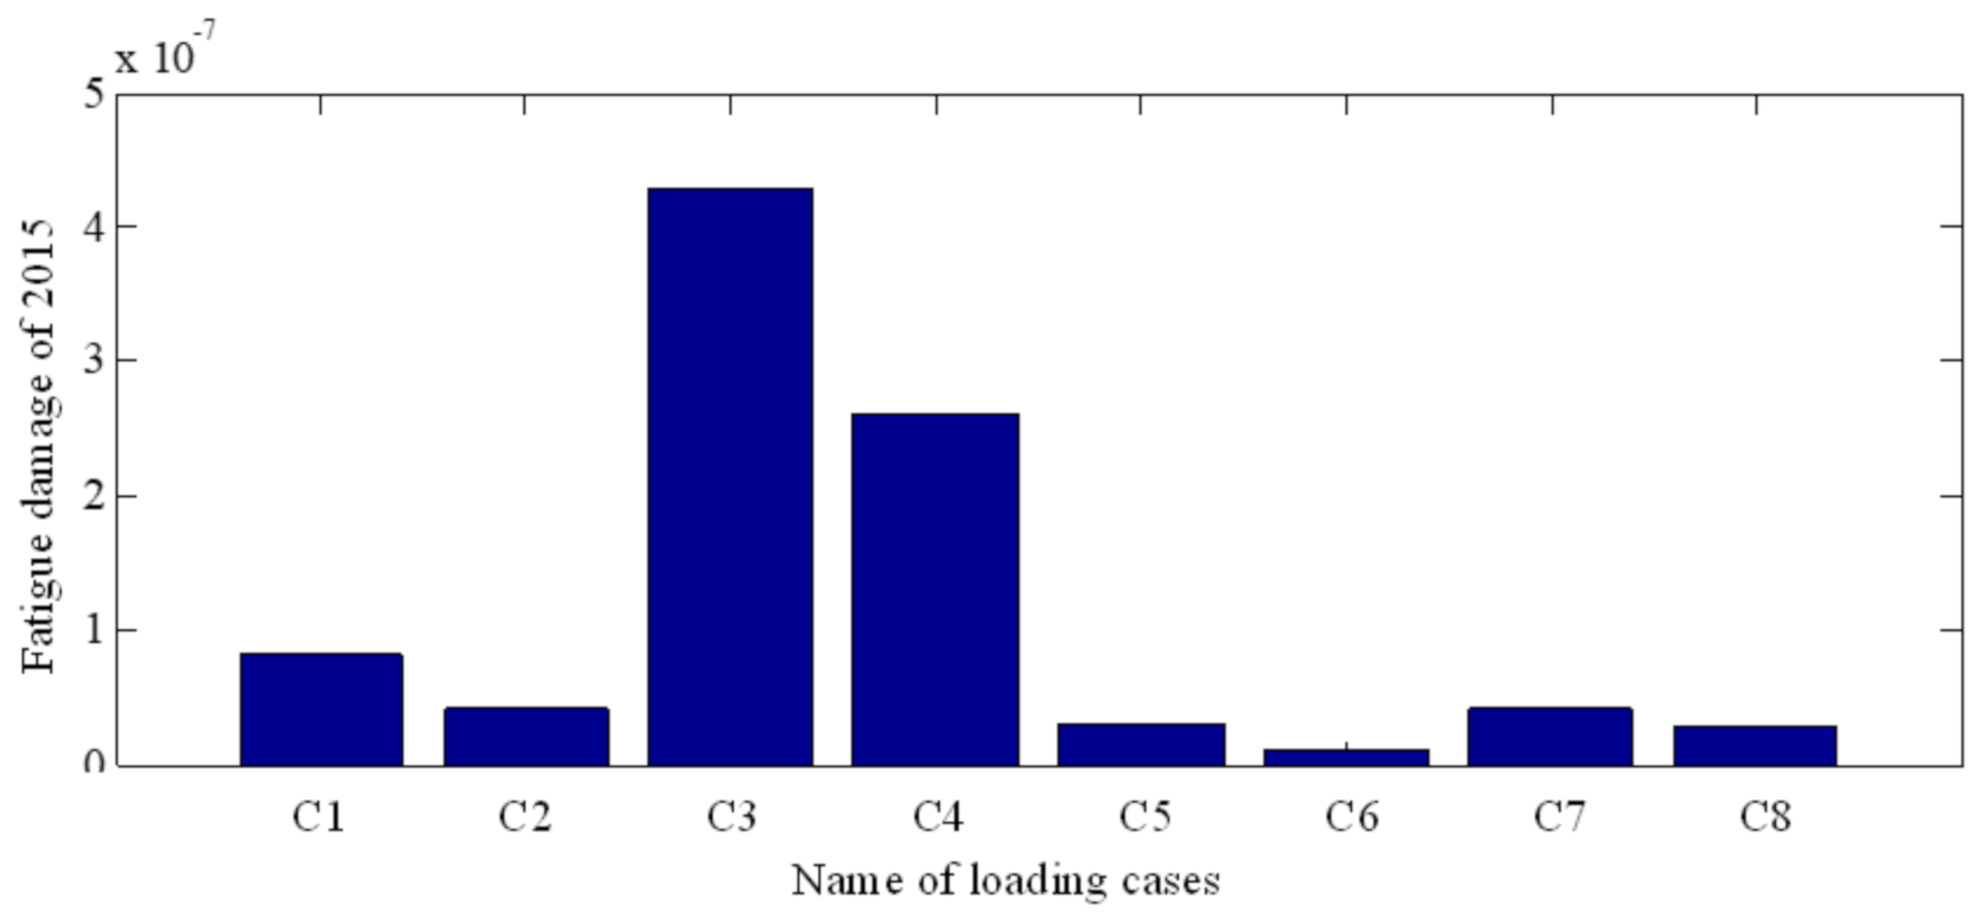
  • The stress amplitude spectra of these two histories were obtained by rain-flow processing. Then, the spectrum of the equivalent stress amplitude under loads from high-speed trains was calculated according to Equation (3). Furthermore, the fatigue life in the form of the stress cycle number for each component of the spectrum was calculated by Equation (2). Miner’s rule was introduced to calculate the fatigue damage contributed by each component of the spectrum, by which the total fatigue damage of each train was calculated by adding them together. Finally, the fatigue life of the connection was calculated and validated when the accumulation value of fatigue damage reached 1.0.

3. Multiscale Numerical Model

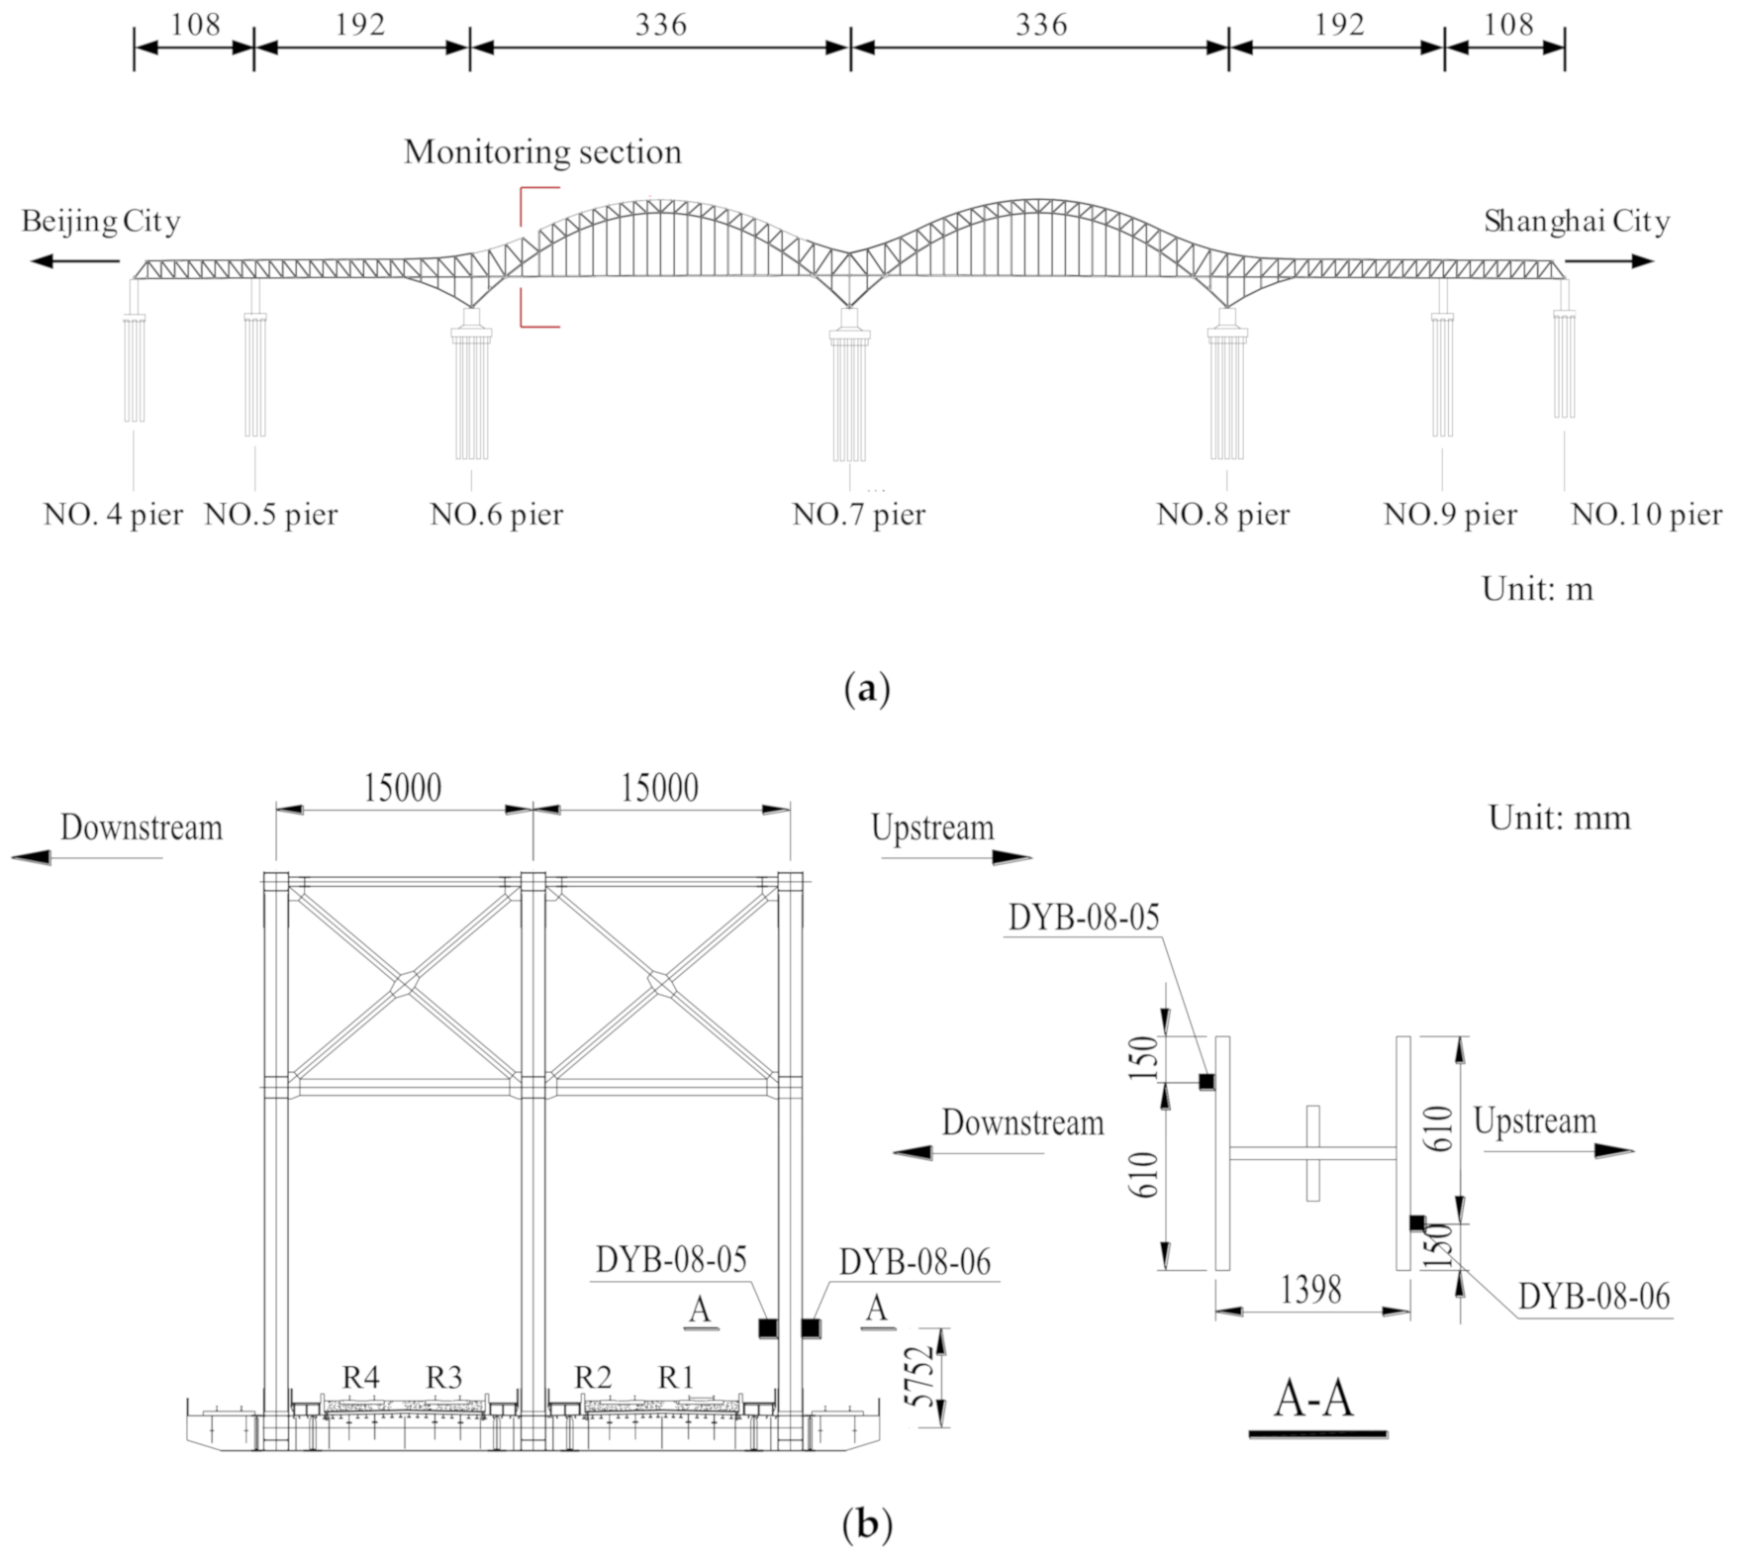
3.1. Project Description
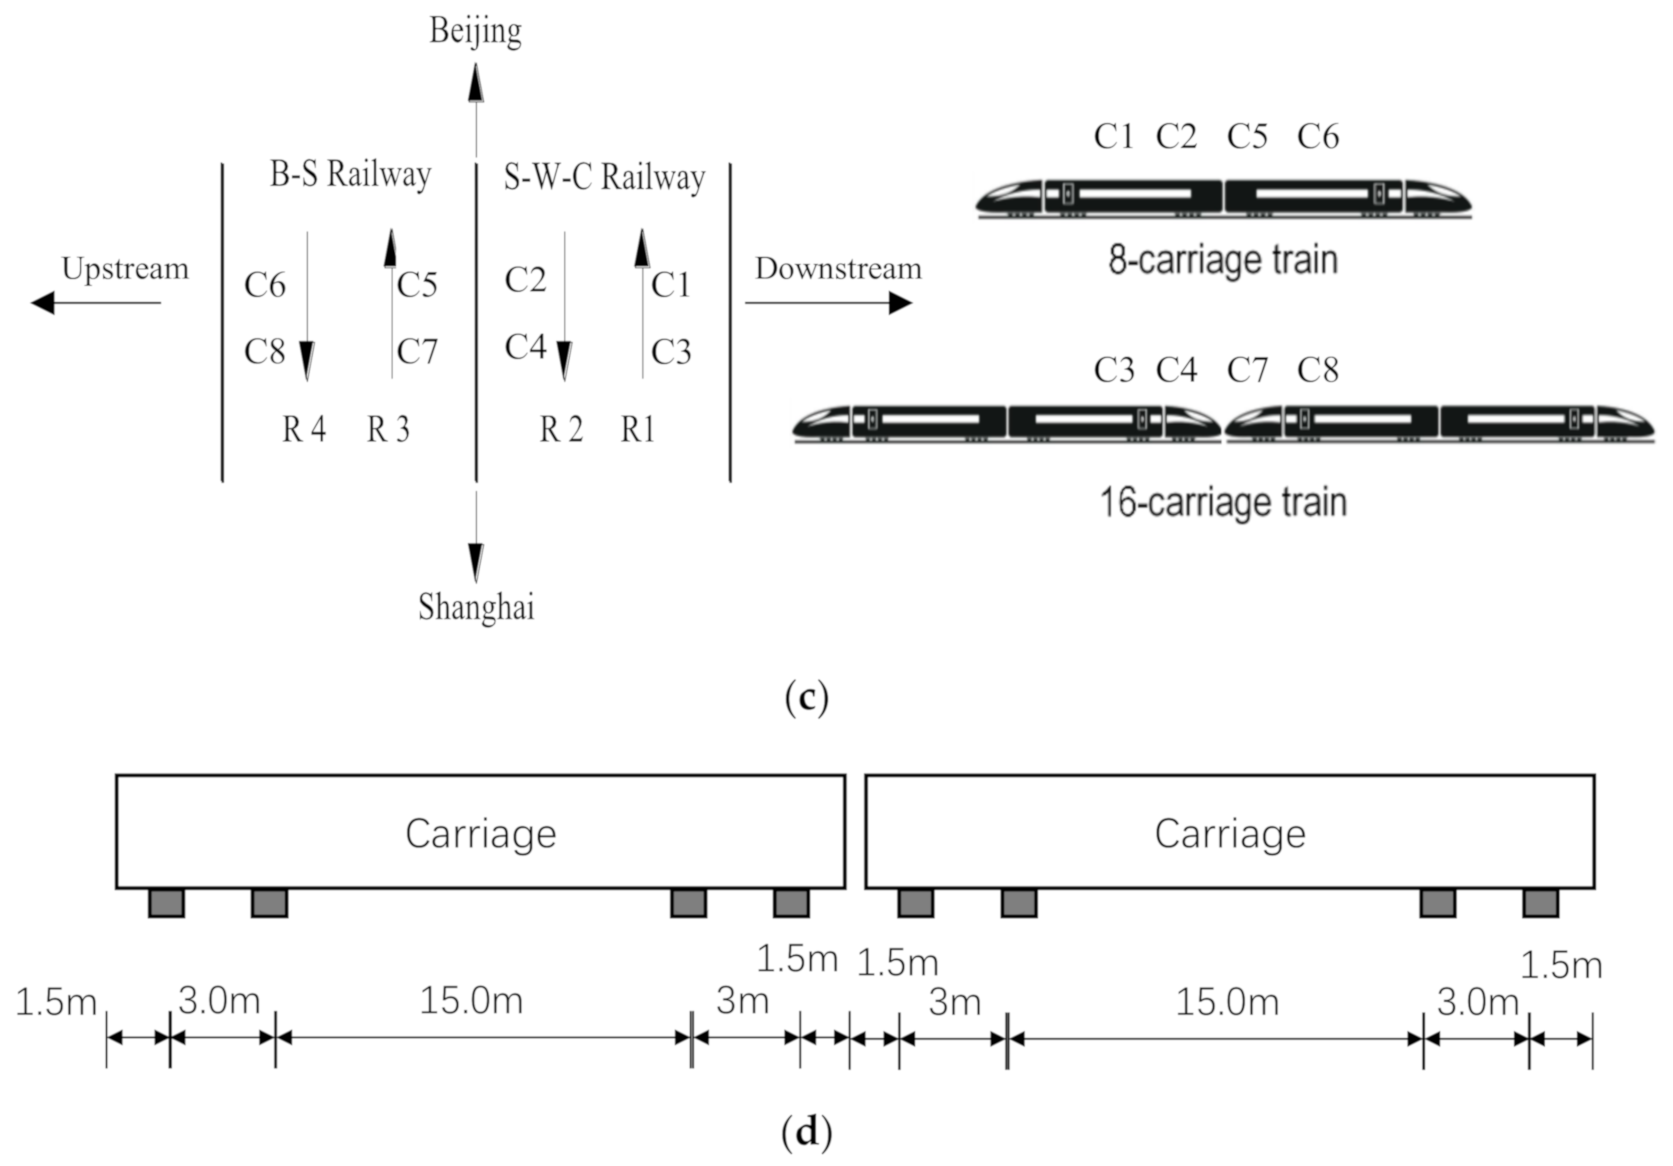
The Dashengguan Yangtze River High-speed Railway Bridge is located in Nanjing, China. It is one of the most important bridges in China, sustaining two national high-speed railways, i.e., Beijing–Shanghai and Chengdu–Shang; it crosses the Yangtze River. It is a 6-rail high-speed railway bridge, where four rails are for 300 km/h high-speed railways and two rails are for Nanjing Metro. A continuous steel arch-truss structure with six spans is the bridge’s superstructure; the total length and distribution of the spans are shown in Figure 2a. As shown in Figure 2b, the superstructure is composed of three planes of arch-truss components. Steel H-shaped stiff hangers are used to connect the bridge deck and main arches vertically. To reduce the stress on the bridge deck from the vertical hangers, box-shaped beams are set as tie beams to connect the bridge deck and vertical hangers, where the root area of the vertical hangers is magnified and welded to the side beams to form a joining region. As the shortest hangers sustain the greatest forces due to their relatively great stiffness, strain sensors are installed on both flanges of the shortest H-shaped hanger on the upstream side to monitor their mechanical performance, which is shown in Figure 2b.

3.2. Traffic Cases

Figure 2c presents eight different traffic cases along four rails, where C1–C8 represent eight traffic cases and R1–R4 represent four rails. As shown in the figure, there are two kinds of trains, i.e., 8-carriage and 16-carriage trains, running along Beijing–Shanghai and Chengdu–Shang high-speed railway lines, each of which has two rails with reverse running directions. Therefore, eight loading cases are defined considering both the number of carriages and transverse locations of the running rails. In the eight different loading cases, the whole weight of each carriage was as great as 3800 kN, and 601 people—the weight is assumed to be 0.8 kN per person—are included in each carriage [5,16,17]. As each carriage has eight wheels distributed equally in two rows, the train-loading was simulated as two rows of concentrated forces whose loading locations were contact points on top of the rails, and all the loads were equal. The distribution of wheel group is shown in Figure 2d.

3.3. Sub-Modelling Finite-Element Model

Owing to its relatively great tensile stiffness, the shortest hangers sustain more force than other hangers, inducing a greater probability of fatigue failure in the joining region of the bridge decks. To assess the actual stress distribution and evaluate the fatigue performance in such a joining region, a refined model with four faces of solid elements is introduced to simulate the mechanical performance of the joining region. To improve computational efficiency, the members of the superstructure were simulated by a sparse finite-element model, where the hanger and arch members were simulated by beam elements and bridge decks were simulated by shell elements. To coordinate the mechanical performance between the sparse and refined elements, a multipoint restriction method was applied to unify the boundary between the two-level models.
As shown in Figure 3, the two-level finite-element model of the Dashengguan Yangtze River High-speed Railway Bridge was created and established in the commercial FEA software ANSYS 15.0. In the sparse model, Beam 181 was used to simulate truss and arch members, and Shell 11 was used to simulate the bridge deck. In the refined model, Solid 92 was used to simulate the mechanical performance of the joining region between the hangers and tie beams. The average unit size of the refined model was defined as 20 mm, and the average unit size of the sparse mode was defined as 1.0 m. The multipoint restriction method was introduced to realize rigid connections between these models of two levels. The nodes of the truss, arch and deck in the two ends in the longitudinal direction, and the bottom nodes of the arch members, were defined as fixed to simulate the action of auxiliary bridge and bridge piers. As the steel material of the bridge structure is Q345b, the elastic modulus and Poisson’s ratio in the numerical model were 206 GPa and 0.31, respectively [17].

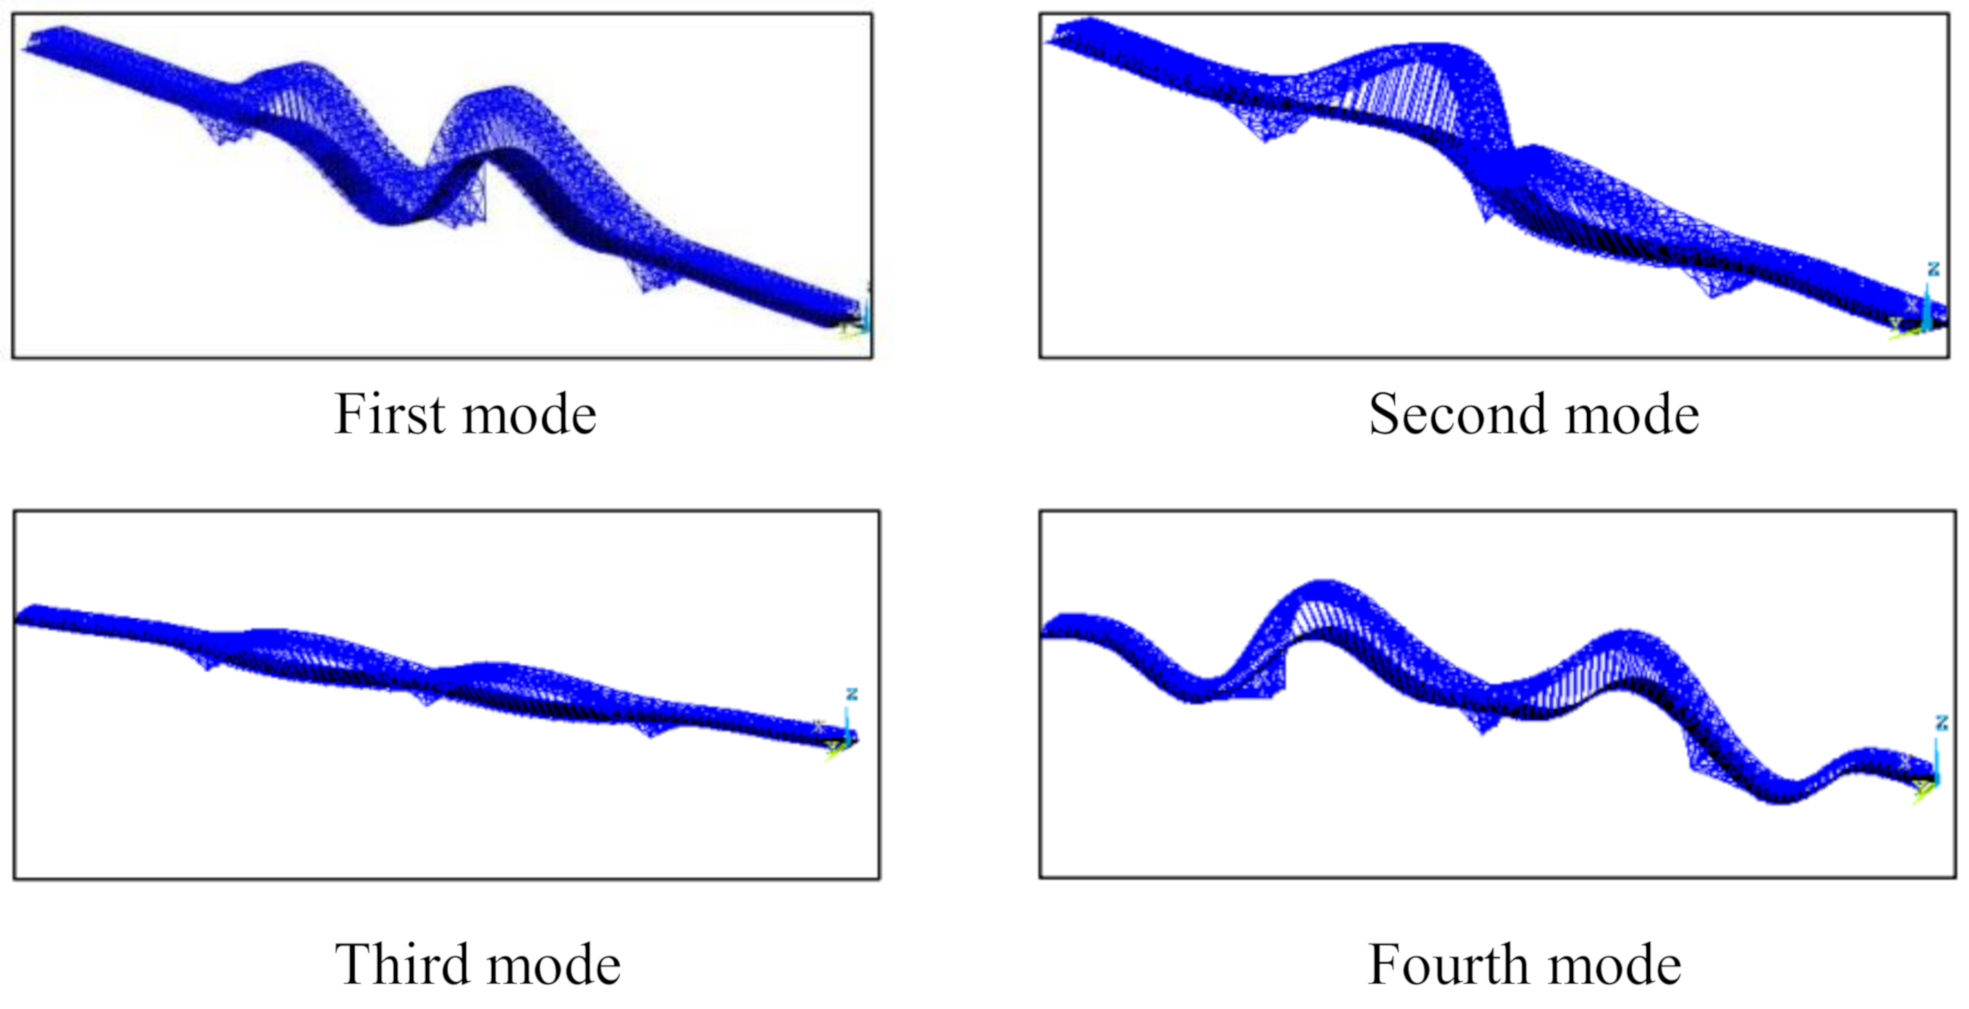
3.4. Comparison between the Numerical and Monitoring Results

Structural monitoring data were used to calibrate and validate the multiscale finite element model. First, long-term acceleration data were introduced and processed by frequency-domain analysis to obtain the first four dynamical modes and corresponding vibration frequencies. Then, modal analysis was conducted for the multiscale finite element model to calculate the first four dynamical modes, which is shown in Figure 4. The field calculations and numerical simulation results are shown in Table 3; the field calculation results were obtained by processing monitoring data of accelerated velocity [5]. As shown in the table, the first four dynamic modes of the numerical simulation fit well with the field calculations, where the maximum error in these four frequencies is within 1.0%. The above results indicate that the dynamic property of the numerical model is appropriate for further calculations.
To further assess the veracity of the multiscale finite element model, computational and monitoring results on the bending moment of the shortest hanger, which has been proven to be highly susceptible to train loading, on the east side in the south-bound direction, has also been marked in Figure 1. As one of the shortest hangers in the side plane, this hanger was chosen not only because it sustains the greatest axial force but also because of its position near the busiest rails. Figure 5 shows the monitoring and numerical curves of the bending movement of this hanger under case 2. It is shown that the monitoring and numerical results fit well to a certain extent, indicating that the accuracy of the multilevel numerical model fulfills the fatigue requirements of the hanger-deck joining region.

3.5. Multiaxial Fatigue-Damage

As an example, the load case of C2 is used to reveal the progress of multiaxial fatigue-life assessment in detail. To validate the critical plane where the normal stress reaches a maximum value, the distribution of the major principal stress in the joining region was first calculated and obtained under load case C2. Then, the position of the maximum value of the major principal stress was selected as the fatigue-potential point where the critical plane is located. Figure 6 presents the curve of the major principal stress at this point; the distribution of the major principal stress at peak time is shown in the figure. The critical-plane parameters, such as the spatial location and the angles, were assessed and evaluated by analyzing the stress composition along three axial directions. Afterwards, the curve of the shearing stress on the critical plane was calculated and obtained, which is shown in Figure 7.
The rain-flow counting method [26] was applied to process the above two stress curves; and the stress-amplitude spectra—including various stress amplitudes corresponding to their cycles—of the major principal stress and corresponding shearing stress were obtained. By substituting the above two stress amplitudes into Equations (1)–(3), the corresponding fatigue life in the form of the stress cycling number was calculated and obtained. The strength grade of steel of hangers applied was Q420, for which the tensile strength can be as great as 520 MPa. Thus, the relative parameters were validated by referring to a similar steel material [22] in these three equations, which are presented in Table 4. Finally, the spectrum of fatigue damage was calculated by dividing the number of stress cycles by the corresponding fatigue life, and the total fatigue damage was calculated by summing them.
The traffic flow of eight loading cases in 2015 was resolved by the monitoring system and shown in Table 5. By applying these loading cases to the fatigue calculation model, the total fatigue damage of 2015 was then calculated and obtained by the previous method. To investigate the effect of increasing traffic flow on fatigue damage, four annual growth rates in traffic flow were defined, where the composition of traffic flow was assumed to be constant, to calculate and obtain annual fatigue damage. Figure 8 presents the annual fatigue damage of the target hanger in 2015 under eight different loading cases. As shown in the figure, loading cases C3 and C4, which possess the greatest number of running trains with 16 carriages, cause the greatest fatigue damage.

4. Influences of Multiple Factors on the Multiaxial Fatigue Life

4.1. Total Traffic Flow

With the development of transportation, future traffic flow may increase at a certain rate. Three annual growth rates, i.e., 3%, 5% and 10%, were applied to simulate the increase in traffic flow in the future. Figure 9 presents the accumulation of fatigue damage over time by year. In addition, the fatigue life is defined as when the accumulated fatigue damage arrives at 1.0. Therefore, the fatigue lives corresponding to these three annual growth rates are shown in the figure. As shown in the figure, with traffic flow increasing by 3%, 5% and 10% yearly, the fatigue life is as great as 327, 270 and 138 years. The results show that even when the annual growth rate of traffic flow reaches 10%, the fatigue life can be much greater than the design life of the whole bridge.

4.2. Composition of a Freight Train

Currently, there are only passenger trains running on bridges and railways. In the future, freight trains may be used on high-speed railways. The wheel distribution of the candidate train is similar to that of passenger trains, but the design loading capacity is as high as 1200 kN per carriage. The action of freight trains was the same as for passenger trains, whereas the live load applied was 1200 kN per carriage. The ratio of freight trains in the total traffic flow was applied as the parameter to investigate the influences of freight trains on fatigue damage and life. Another simplification was made—the traffic flow under the above eight cases was assumed to be consistent; and the ratio of the freight trains in each case was assumed to be the same.
In this section, four ratios, i.e., 0%, 10%, 20% and 30%, were assumed to calculate the fatigue damage under eight different cases, where the annual growth rate of traffic flow was assumed to be 10%. Figure 10 presents curves of accumulated fatigue damage under these three ratios. The fatigue life was obtained and validated by accumulated fatigue damage arriving at 1.0. Therefore, the fatigue lives under these four ratios were 138, 73, 70 and 68 years. The comparison shows that the joining of freight trains in the traffic flow accelerates the accumulation of fatigue damage, greatly decreasing the fatigue life. Even though the ratio of freight trains was only 10%, the fatigue life was reduced from 138 to 73 years, which indicates that the increase of freight trains may speed up the fatigue failure extraordinary.

5. Conclusions

Due to the complexity of the geometrical profile and mechanical properties, the steel connections between the hangers and decks may suffer from multifatigue problems under the action of high-speed trains. In this paper, the Dashengguan Yangtze River High-speed Railway Bridge was used as the background project to elaborate the process of multifatigue evaluation under loads from high-speed trains. By integrating the critical-damage-plane method and monitoring data, the fatigue life of the steel connections between the shortest hangers and deck was evaluated and assessed. In combination with impact analysis on the fatigue life, the following conclusions can be presented:
(1)
Compared with the uniaxial fatigue-life evaluation method, the fatigue-damage results calculated by the multiaxial fatigue method are nearly 60 times greater. This indicates that the multiple properties of stress may accelerate fatigue failure under the action of high-speed trains. However, the annual fatigue damage is so low that the fatigue life may be infinite if the traffic flow remains the same.
(2)
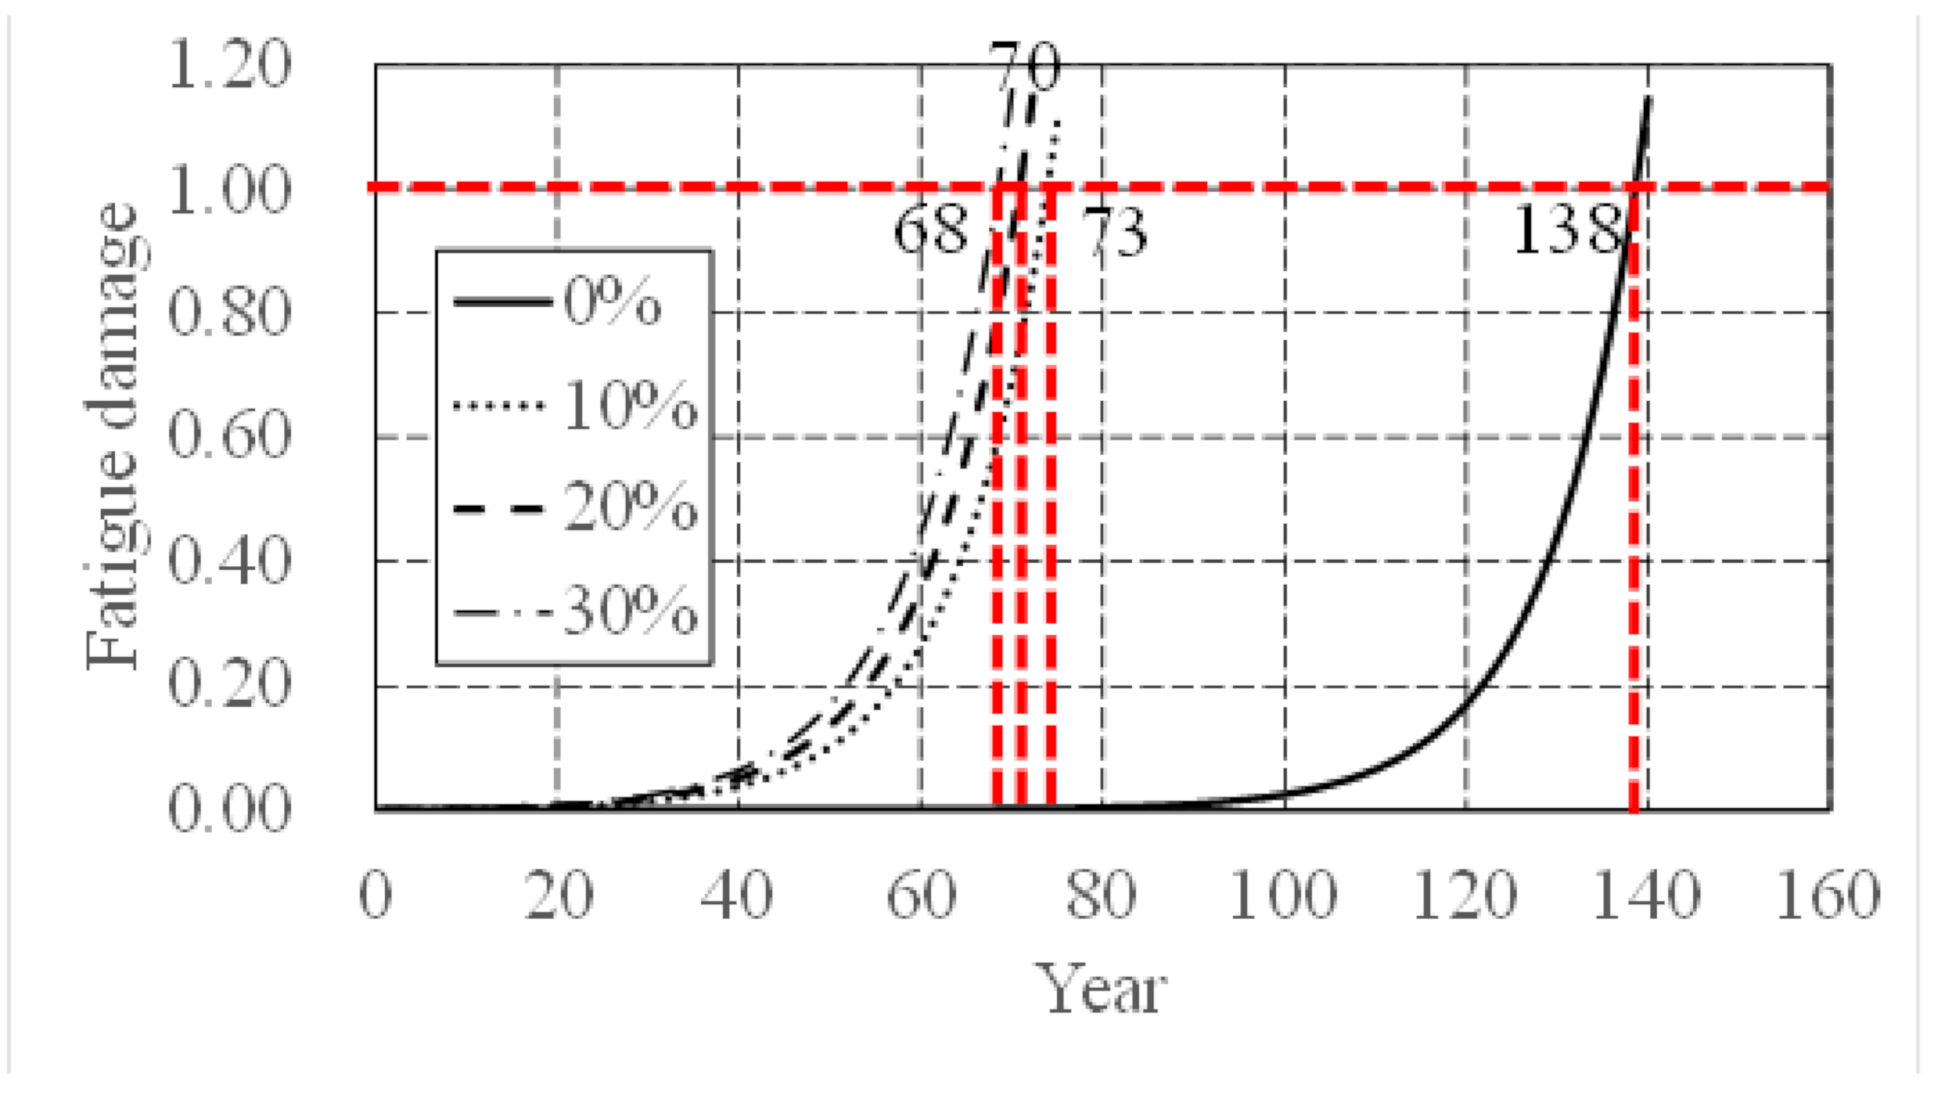
Without consideration of the traffic composition and load of trains, the number of trains has a substantial influence on the fatigue life of the hanger-deck connection by increasing the number of stress cycles. If the annual increase in traffic flow reaches 10%, the fatigue life will decrease to 138 years, but the design fatigue life is only 100 years.
(3)
The fatigue life decreases rapidly with increasing freight train weight in the traffic flow. If the proportion of freight train traffic is 10%, the fatigue life can drop to as low as 73 years. This indicates that fatigue failure occurs during the design life cycle of the bridge, whereas the fatigue life calculated by typical means may infinite.

Author Contributions

Conceptualization, Y.S. and Y.D.; methodology, Y.S.; software, Y.S.; validation, Y.S. and Y.D.; formal analysis, J.L.; investigation, Y.S.; resources, Z.W.; data curation, F.J.; writing—original draft preparation, Y.S.; writing—review and editing, F.J.; visualization, H.J.; supervision, Y.D.; project administration, Y.D.; funding acquisition, Y.S. and Y.D. All authors have read and agreed to the published version of the manuscript.

Funding

This research was funded by the Program of National Natural Science Foundation (number 51508251, 51978154), Fund for Distinguished Young Scientists of Jiangsu Province (grant BK20190013), Six talent peaks project in Jiangsu Province (number JZ-062), Natural Science Foundation of Jiangsu Province (17KJB560004) and the Jinling Institute of Technology High-level Personnel Work Activation Fee to Fund Projects (number jit-b-201614).

Institutional Review Board Statement

Not applicable.

Informed Consent Statement

Not applicable.

Data Availability Statement

No data, models, or code were generated or used during the study.

Acknowledgments

The authors gratefully acknowledge the Program of National Natural Science Foundation, Fund for Distinguished Young Scientists of Jiangsu Province (grant BK20190013), Six talent peaks project in Jiangsu Province (no. JZ-062), and the Jinling Institute of Technology High-level Personnel Work Activation Fee to Fund Projects (No. jit-b-201614).

Conflicts of Interest

The authors declare no conflict of interest.

References

  1. Hu, N.; Dai, G.L.; Yan, B.; Liu, K. Recent development of design and construction of medium and long span high-speed railway bridges in China. Eng. Struct. 2014, 74, 233–241. [Google Scholar] [CrossRef]
  2. Bogacz, R.; Czyczuła, W.; Konowrocki, R. Influence of sleepers shape and configuration on track-train dynamics. Shock Vib. 2014, 2014, 1–7. [Google Scholar] [CrossRef]
  3. Cantero, D.; Karoumi, R. Numerical evaluation of the mid-span assumption in the calculation of total load effects in railway bridges. Eng. Struct. 2016, 107, 1–8. [Google Scholar] [CrossRef]
  4. Chen, Z.Q.; Liu, M.G.; Hua, X.G.; Mou, T.M. Flutter, galloping, and vortex-induced vibrations of h-section hangers. J. Bridge Eng. 2012, 17, 500–508. [Google Scholar] [CrossRef]
  5. Zhao, H.W.; Ding, Y.L.; An, Y.H.; Li, A.Q. Transverse dynamic mechanical behavior of hangers in the rigid tied-arch bridge under train loads. J. Perform. Constr. Facil. 2017, 31, 04016072. [Google Scholar] [CrossRef]
  6. Bernuzzi, C.; Simoncelli, M. An advanced design procedure for the safe use of steel storage pallet racks in seismic zones. Thin Walled Struct. 2016, 109, 73–87. [Google Scholar] [CrossRef] [Green Version]
  7. Bernuzzi, C.; Simoncelli, M. Steel storage pallet racks in seismic zones: Advanced vs. standard design strategies. Thin Walled Struct. 2017, 116, 291–306. [Google Scholar] [CrossRef]
  8. Tran-Ngoc, H.; He, L.; Reynders, E.; Khatir, S.; Wahab, M.A. An efficient approach to model updating for a multispan railway bridge using orthogonal diagonalization combined with improved particle swarm optimization. J. Sound Vib. 2020, 476. [Google Scholar] [CrossRef]
  9. Tran-Ngoc, H.; Khatir, S.; De Roeck, G.; Bui-Tien, T.; Wahab, M.A. An efficient artificial neural network for damage detection in bridges and beam-like structures by improving training parameters using cuckoo search algorithm. Eng. Struct. 2019, 199. [Google Scholar] [CrossRef]
  10. Tran-Ngoc, H.; Khatir, S.; De Roeck, G.; Bui-Tien, T.; Nguyen-Ngoc, L.; Wahab, M.A. Model updating for nam o bridge using particle swarm optimization algorithm and genetic algorithm. Sensors 2018, 18. [Google Scholar] [CrossRef] [Green Version]
  11. Ribeiro, D.; Calçada, R.; Delgado, R.; Brehm, M.; Zabel, V. Finite element model updating of a bowstring-arch railway bridge based on experimental modal parameters. Eng. Struct. 2012, 40, 413–435. [Google Scholar] [CrossRef]
  12. Klinger, C.; Michael, T.; Bettge, D. Fatigue cracks in railway bridge hangers due to wind induced vibrations—Failure analysis, measures and remaining service life estimation. Eng. Fail. Anal. 2014, 43, 232–252. [Google Scholar] [CrossRef]
  13. Liu, Z.; Guo, T.; Pan, S.; Liu, J. Forensic investigation on cracking in hanger-to-girder connections of long-span suspension bridges. Struct. Eng. Int. 2017, 27, 344–352. [Google Scholar] [CrossRef]
  14. Virlogeux, M. Replacement of the suspension system of the tancarville bridge. Transp. Res. Rec. J. Transp. Res. Board 1999, 1654, 113–120. [Google Scholar] [CrossRef]
  15. Ostenfeld, K. Design of the great belt east bridge. Struct. Eng. Int. 1995, 5, 218–220. [Google Scholar] [CrossRef]
  16. Song, Y.S.; Ding, Y.L.; Zhong, W.; Zhao, H. Reliable fatigue-life assessment of short steel hanger in a rigid tied arch bridge integrating multiple factors. J. Perform. Constr. Facil. 2018, 32, 04018038. [Google Scholar] [CrossRef]
  17. Zhong, W.; Ding, Y.L.; Song, Y.S.; Zhao, H.W. Fatigue behavior evaluation of full-field hangers in a rigid tied arch high-speed railway bridge: Case study. J. Bridge Eng. 2018, 23, 05018003. [Google Scholar] [CrossRef]
  18. Ulstrup, C.C. Aerodynamic lessons learned from individual bridge members. Ann. N. Y. Acad. Sci. 2010, 352, 265–281. [Google Scholar] [CrossRef]
  19. Kakuno, H.; Kawada, Y. A new criterion of fatigue strength of a round bar subjected to combined static and repeated bending and torsion. Fatigue Fract. Eng. Mater. Struct. 2007, 2, 229–236. [Google Scholar] [CrossRef]
  20. Susmel, L.; Lazzarin, P. A bi-parametric wöhler curve for high cycle multiaxial fatigue assessment. Fatigue Fract. Eng. Mater. Struct. 2002, 25, 63–78. [Google Scholar] [CrossRef]
  21. Liu, J.; Zhang, Z.; Li, B.; Lang, S. Multiaxial fatigue life prediction of gh4169 alloy based on the critical plane method. Met. Open Access Metall. J. 2019, 9, 255. [Google Scholar] [CrossRef] [Green Version]
  22. Zhang, C.C.; Yao, W.X. An improved multiaxial high-cycle fatigue criterion based on critical plane approach. Fatigue Fract. Eng. Mater. Struct. 2010, 34, 337–344. [Google Scholar] [CrossRef]
  23. Chaboche, J.L.; Lesne, P.M. A non-linear continuous fatigue damage model. Fatigue Fract. Eng. Mater. Struct. 1988, 11, 1–17. [Google Scholar] [CrossRef]
  24. Lemaitre, J.; Plumtree, A. Application of damage concepts to predict creep-fatigue failures. J. Eng. Mater. Technol. 1979, 101, 284–292. [Google Scholar] [CrossRef]
  25. NRAPR-PRC. Code for Design on Railway Bridge Culvert. TB 10002-2017; NRAPR-PRC: Beijing, China, 2017. [Google Scholar]
  26. Downing, S.; Socie, D. Simple rainflow counting algorithms. Int. J. Fatigue 1982, 4, 31–40. [Google Scholar] [CrossRef]
Figure 1. Fatigue-life evaluation and assessment procedure.
Applsci 11 01142 g001
Figure 2. Dashengguan Yangtze River High-speed Railway Bridge; (a) side view; (b) monitoring section; (c) eight traffic cases; (d) distance distribution of wheel groups.
Applsci 11 01142 g002aApplsci 11 01142 g002b
Figure 3. Two-level FE model of the high-speed railway bridge; (a) sub-modeling method; (b) refined model and connected boundary.
Applsci 11 01142 g003
Figure 4. Calculation results of first four dynamical modes.
Applsci 11 01142 g004
Figure 5. Monitoring and numerical curves of bending movement.
Applsci 11 01142 g005
Figure 6. Distribution of major principle stress.
Applsci 11 01142 g006
Figure 7. Curves of nominal and shearing stress on the critical plane; (a) normal stress; (b) shearing stress.
Applsci 11 01142 g007
Figure 8. Fatigue damage of 2015.
Applsci 11 01142 g008
Figure 9. Fatigue-damage accumulation under three growth rates of traffic flow.
Applsci 11 01142 g009
Figure 10. Fatigue-damage accumulation under four ratios of freight trains.
Applsci 11 01142 g010
Table 1. Advantages and disadvantages of typical critical-damage-plane functions.
NameAdvantageDisadvantage
Fatemi–Socie
(FS)
Taking into account the shear strain and normal strain on the critical planeWithout considering the influence of average stress effect
Wang–Brown
(WB)
Considering the influence of mean stressIgnoring the impact of the cyclic hardening effect
SWT (Smith–Watson–Topper)Having a good life prediction effectImproper for pure torsion and multiaxial fatigue
Table 2. Validation of the applied critical plane approach [16].
No.Nominal Stress Amplitude (MPa)Shear Stress Amplitude (MPa)Angle (°)Experimental Ressults
(Cycles)
Prediction Results
(Cycles)
Difference
(%)
14492829029,90031,0383.81
23543349035,70026,540−25.66
3126.49195.50730420,261283,118−32.63
4158.114119.3843063,58452,745−17.05
5126.491100.045275,527212,599−22.84
6158.114125.04557,00441,195−27.73
Table 3. Results of dynamic frequencies under the first four modes.
ModeFrequency (Hz)Difference Rate (%)
Field CalculationNumerical Simulation
10.5080.50570.455
20.5120.5101−0.391
30.55810.5602−0.376
40.9650.95700.834
Table 4. Fatigue-related parameters.
Name of ParametersValue
f 1 508 MPa
t 1 293.283 MPa
τ f 1766.713 MPa
b 1 −0.12377
b 2 −0.53
k 62.3
Table 5. Traffic flow of eight loading cases.
Loading CaseTraffic FlowLoading CaseTraffic Flow
C12309C53675
C22260C62070
C38735C74231
C48867C83568
Publisher’s Note: MDPI stays neutral with regard to jurisdictional claims in published maps and institutional affiliations.

