Abstract
A hydraulic system is a key subsystem of heavy-duty machine tools with a high failure intensity, the failure of which often causes shutdown of production and economic loss in machining. Therefore, it is necessary to implement failure analysis to identify the weak links of system and improve the reliability. For hydraulic system, there is often an amount of failure data collected in field, which help to calculate the occurrence probability of basic events through fault tree analysis method. However, the data are incomplete and uncertain. To address this issue, this study presents a fault tree analysis methodology. Experts’ opinions are utilized, combined with field data based on the Dempster–Shafer theory and rough set theory to fill the incompleteness and eliminate the uncertainty. For application in a case study, a fault tree of the hydraulic system of heavy-duty machine tools is firstly constructed. Then, the importance analysis is performed to help identify the weak links of hydraulic system. The results show the critical basic events affecting the safety and reliability of a hydraulic system.
1. Introduction
Heavy-duty CNC machine tools (HCMTs) are responsible for the manufacturing of parts related to major pillar industries and national key projects [1,2,3] in fields of aerospace, marine, hydraulic engineering, metallurgy, energy, rail transit, etc. Among subsystems of HCMT, the hydraulic system plays a key role in the power transmission and control of HCMT [4], the failure frequency of which also accounts for the largest proportion [5]. The parts scrap or production accidents caused by hydraulic failure from seals [6], pipes, valves, and so on will lead to enormous waste, because HCMTs are mainly used to process large-scale and expensive parts [7]. Therefore, to avoid unnecessary waste and maintain the machine manufacturing sustainably, it is necessary to analyze the failure of hydraulic systems to find their weaknesses for reliability growth or for creating a maintenance strategy of HCMT.
Fault Tree Analysis (FTA) is a systematic approach that identifies weaknesses, evaluates possible upgrades, and monitors and predicts behavior and has been used in various areas [8,9,10,11], such as nuclear, electric power, aerospace, oil and gas transmission, etc. Thus far, researchers have applied the FTA method for reliability analyses of machine tool products [12,13,14,15,16]. They constructed fault trees of different kinds of machine tool products and minimal cut sets were obtained. Analyses of these fault trees are only performed on a qualitative level. The importance measure of a basic event (BE) cannot be mathematically calculated on a quantitative level [17], which helps to determine which components or parts of the system are more critical for risk management and decision making.
As a complex system with mechanisms, electronics and hydraulics, the BEs in the fault tree of hydraulic system are generally described as failure modes, regardless of the components, due to its complexity and the large number of components [18]. In addition, the hydraulic system of HCMT manifests a high failure rate. This means a certain amount of failure data can be collected on field. This corresponds well to the failure modes and also provide useful information for measuring the importance of BEs. Shen [19] constructed a fault tree for tool storage of machining center on a quantitative level and obtained an importance measure of BEs using failure data. In [20,21], the failure rate and importance measure of BEs were obtained through quantitative analysis of hydraulic system of excavator; the weakest components were identified. However, the result of quantitative analysis using field data only is questionable in the application of an HCMT hydraulic system because the data are always incomplete in practice, which is reflected in the following two cases: (a) The causes of some failures are uncertain. There may be several BEs jointly causing one failure, but the contribution weight of each BE cannot be determined. We call this a Type I problem for convenience. (b) The occurrence probabilities of some BEs are too low so that there is a lack of observed data in some cases, in which it is difficult to determine the occurrence probability in an objective manner. We call this a Type II problem. To handle imprecise and insufficient failure information of a system, researchers have applied fuzzy theory with expert judgement to define the events’ probabilities [22,23]. Mi [24] utilized fuzzy theory to qualify the uncertainty of basic events and applied it to a CNC hydraulic system. The application of fuzzy fault tree can also be found in the hydraulics of other machineries. Ren [25] obtained the importance degree of BEs for hydraulic system of A-frame launch and recovery system for the “Jiaolong” manned submersible from expert experiences by applying fuzzy theory, Li [26] proposed a fuzzy dynamic fault tree model to assess the probability of failure events in the absence of failure data. Li [27] used triangular fuzzy numbers to describe the probability of BEs in the fault tree of hydraulic system of Anchor Drilling Rigs. Zhang [28] performed quantitative analysis of hydraulic system based on a T-S fuzzy model. However, the selection of membership function in these researches is usually subjectively determined based on the engineers’ experience and intuition, which is a challenge for a hydraulic system of HCMT due to its complex composition [29,30]. Moreover, the information contained in failure data is precious and should not be ignored. The fusion of failure information and experts’ opinions is necessary.
This study aims at making the FTA results accurate for a hydraulic system of HCMT with incomplete failure data. Experts’ opinions are utilized in combination with field data to address the above issue. First, the collected failure data are used to preliminarily calculate the frequency of BEs. Next, in dealing with a Type I problem, the weight of each possible BE, which commonly leads to one failure, is evaluated using the Dempster–Shafer evidence theory to correct the probability obtained in the first step. In dealing with a Type II problem, the probability interval of BEs that lacks data is also estimated by experts using the rough set theory. The rest of this paper is organized as follows. Section 2 proposes the method based on the Dempster–Shafer theory and rough set theory to combine failure data and experts’ opinions. In Section 3, the proposed approach is applied in a case study to perform the final importance analysis of hydraulic system of HCMT. Finally, the results are summarized in Section 4.
2. Fault Tree Analysis Method Combining Incomplete Failure Data and Experts’ Opinions
The procedures of hydraulic system FTA can be given as follows:
- Model definition: System description, confirm the components of equipment, problem identification.
- Hazard analysis: Obtain the failure mode for components of the system.
- Fault tree construction: Identify the top event, Bes, and sub-events, then build up a fault tree according to the logical relationship.
- Qualitative analysis: Obtain the minimal cut sets.
- Quantitative analysis: Calculate the frequencies of BEs using failure data, then calculate the occurrence and importance measure of BEs.
- Risk assessment and control: Make decisions based on the results of the analysis and improve the reliability of the system.
Due to Type I and Type II problems, the results of quantitative analysis just using field data are inaccurate using a conventional FTA method. Therefore, this study focuses on improving the quantitative analysis step; the framework of fault tree qualitative analysis is shown in Figure 1. The quantitative analysis, including the occurrence probability calculation of BEs and importance analysis, will be described in detail in the next body.
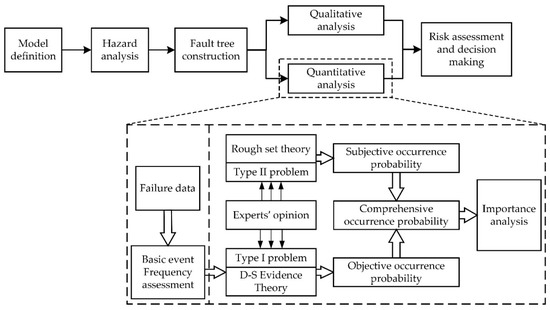
Figure 1.
The framework of FTA for the hydraulic system of HCMT.
2.1. Occurrence Calculation
2.1.1. Objective Occurrence Calculation Based on the Dempster–Shafer Evidence Theory
Like conventional FTA, failure data are first preprocessed to calculated the frequencies of BEs. For data with Type I problem, experts’ opinions are needed to assign probability weights to all BEs that may cause the failure. The results might vary depending on measurement precision or the uncertainty in statements of experts. The Dempster–Shafer evidence theory (D-S theory) [31] is a mathematical theory of evidence developed to combine information supplied by different experts or from other sources. It performs well in dealing with uncertain information. Therefore, an approach of processing a Type I problem based on the D-S theory is given as the following steps:
Let X = {X1, X2, …, Xq} denote the BE set obtained through fault tree construction, where Xi (i = 1, …, q) is the ith BE. Step 1 is a frequency assessment based on failure data: analyze the failure data with clear causes. Trace the source and find all possible BEs causing the failure, then calculate the frequencies.
Step 2: From this step, failure data with a Type I problem is processed: for a single failure with an uncertain cause, a group of experts (E1, …, Em) determine all possible BEs that can cause the failure, which are expressed as (D1, …, Ds), to establish the frame of discernment, symbolized by D = (D1, …, Ds), with Di ∈ X and D ⊆ X.
P(D) is denoted as the power set composed of 2D elements of D; each element of 2D represents a proposition. A mass assignment to each subset of P(D) is known as the basic probability assignment (BPA) M. If A1, …, An are the sets of interest with Aj ∈ P(D), then a BPA is defined as:
Step 3: Experts determine all possible combinations of D1, …, Ds, which are expressed as A1, …, An, as focal elements of the frame of discernment. It shows that Aj ⊆ D (j = 1, …, n). Next, the assessment of each focal element is provided by each expert, as shown in Table 1, where Mk(Aj) (j = 1, …, n; k = 1, …, m) is the BPA provided by expert Ek on the assessment of Aj.

Table 1.
The BPA value assigned by experts.
Step 4: Evidence combination: if the evidence shows agreement, combine it with Dempster’s combination rule as follows:
When evidence highly conflicts with each other, the above combination rule is not efficient; thus, a new combination rule [32] for conflict evidence is introduced as Equation (3):
where K is the conflict coefficient and m is the amount of evidence in the frame of discernment D. Then, the aggregated assessment of focal elements with respect to each BPA can be calculated by the combination rule, a group assessment matrix M is constructed as M = [M(A1), M(A2), …, M(At)].
Step 5: Calculate the belief and plausibility function of Di, which are defined as follows:
The results of the belief and plausibility function of Di compose the frequency interval, as shown in Table 2.
Table 2.
Frequency interval of Di.
Step 6: Merge the results in Table 2 with the frequency of corresponding BEs obtained in Step 1.
Repeat Step 2 to Step 6 until all data with Type I problem are processed. Additionally, the mass has to be normalized, because experts tend to ignore the restriction in Equation (1). The final result, , is normalized by Equation (5) and defined as the objective occurrence probability of BE Xi, which represents the occurrence probability calculated by solving a Type I problem:
where N denotes the number of failures and is the merged frequency interval of Xi.
2.1.2. Subjective Occurrence Estimation Based on Rough Set Theory
For BEs with a Type II problem, human judgments become an essential requirement. Hence, experts’ opinions are also introduced to estimate the occurrence probability. Unlike fuzzy set theory, which defines a set by a partial membership without a clear boundary, the rough set theory utilizes the boundary region of a set to express vagueness. Additionally, there is no need for it to require additional subjective information to analyze data [33], which remains objective. The steps of subjective occurrence estimation based on rough set theory are proposed as follows [34]:
Step 1: Define the problem. Find all possible BEs with insufficient failure data to form a set T as T = {T1, T2,...., Tp}, where Ti is the ith BE with Type II problem, Ti ∈ X, I = 1, …, p.
Assume there are three experts, including designers F1, maintainers F2, and users F3, which give an estimation of the occurrence of each BE, which is expressed by the interval rough number, as shown in Table 3, where , cij < aij < bij < dij, indicating the occurrence of Ti given by expert Fj, j = 1, 2, 3.
Table 3.
Estimation of occurrence given by experts.
Step 2: Determine the expert weight.
When determining the weight of each expert, the influence of expert risk preferences is considered and reflected by the distance between the expert estimation and its positive and negative ideal point.
(1) Determine the positive and negative ideal point: For expert Fj, the positive ideal point is defined as the maximum estimation of the occurrence of all Ti by Equation (6), while the negative ideal point is defined as the minimum estimation of the occurrence of all Ti by Equation (7):
(2) Calculate the distance between the occurrence estimation and its positive and negative ideal point by Equations (8) and (9), respectively:
where for interval rough number and , the operator d(•) is defined as follows:
(3) The risk preference coefficient is fused into the above distances to produce a new distance, called the preference distance, which represents the difference in the subjective assessment of different types of experts. The preference distance is defined as follows:
where τ is the risk preference coefficient. If the expert is a risk liker, then τ > 0.5; if the expert is neutral, then τ = 0.5; if the expert is a risk evader, then τ < 0.5.
(4) The entropy weight method is adopted in determination of the expert weight by Equation (12):
where ej is the distance entropy for expert Fj, wj is the weight of expert Fj, with j = 1, 2, 3, 0≤ wj ≤1, and .
Step 3: Calculate the utility value of each interval rough number and its expectation:
where the expectation is calculated as for .
The final result, , is defined as the subjective occurrence of Ti, which represents the occurrence probability estimated by solving a Type II problem.
2.1.3. Fusion of the Objective Occurrence and Subjective Occurrence
After calculating the objective and subjective occurrence, the results need to be combined. Denote the objective occurrence vector as and the subjective occurrence vector as , where for Xi that is not involved in a Type I problem, and for Xi that is not involved in a Type II problem.
Combine and normalize the two occurrences by Equation (15):
The final result, , is defined as the comprehensive occurrence. Since the objective occurrence is in the form of an interval, the result after its fusion with subjective occurrence is still an interval, i.e., , where:
2.2. Importance Analysis
An important analysis can help identify which BEs are critical and need to be improved; it is useful for decision making. In this study, the probability importance is employed to evaluate the contribution of each BE to the occurrence probability of top event, which is expressed as follow:
where is the probability importance of Xi.
For the comprehensive occurrence probability in the form of an interval, the corresponding probability importance is still an interval, which is , where:
Therefore, the ranking of importance is essentially the ranking of interval numbers. A ranking rule based on possibility degree matrix for interval numbers is introduced [35]; the steps are as follows:
Step 1: Establish the possibility matrix (i, j=1, …, q), using the possibility formula as follows:
Step 2: Construct a Boolean matrix , where:
Step 3: Sum the Boolean matrix in rows; the results are as follows:
Step 4: Order the probability importance according to the size of Ri.
After the above steps are completed, the probability importance ranking of each BE is obtained and used for subsequent safety assessment and decision making.
3. A Case Study
The proposed method is applied to fault tree analysis for the hydraulic system of heavy horizontal lathe and heavy gantry boring and milling machine in a factory, which are two typical HCMTs. After more than 12 months of field tracking (over 2000 h in total), a total of 143 hydraulic related failure data of heavy-duty horizontal lathe and 88 hydraulic related failure of heavy gantry boring and milling machines were collected, which were recorded according to the Chinese national standard GB/T 23567.1. Failure data contain information including failure time, failure position, failure symptoms, maintenance time, and maintenance mode. For the sake of convenience, the failure data were combined for analysis, because the hydraulic systems of the two types of HCMT are similar in structure and configuration.
3.1. Fault Tree Construction
By analyzing the failure data, “The hydraulic system of HCMT cannot work” was considered as the top event. By reviewing previous hazard records [36] and using the experts’ opinions, main sub-event failures were determined and given in Table 4. The fault tree is constructed and shown in Figure 2, Figure 3, Figure 4, Figure 5, Figure 6, Figure 7, Figure 8, Figure 9 and Figure 10, where Figure 2 is the main tree and Figure 3, Figure 4, Figure 5, Figure 6, Figure 7, Figure 8, Figure 9 and Figure 10 are the sub-trees. Table 5 shows the symbols used in fault trees and Table 6 lists all the sub-events and BEs in the tree; the basic event set is X = {X1, X2, …, X27}. Through qualitative analysis, the minimal cut sets are obtained as: {X1}, {X2}, {X3}, {X4}, {X5}, {X6}, {X7}, {X8}, {X9}, {X10}, {X11}, {X12}, {X13}, {X14}, {X15}, {X16}, {X17}, {X18}, {X19}, {X20}, {X21}, {X22}, {X23}, {X24}, {X25}, {X26}, and {X27}.
Table 4.
Main sub-event failures of a hydraulic system.
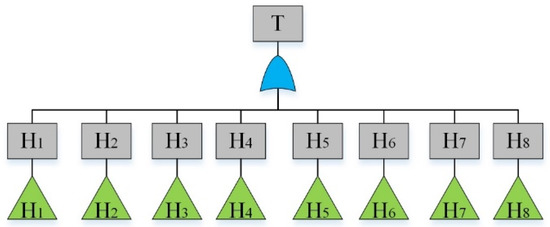
Figure 2.
Fault tree of a hydraulic system: main tree.
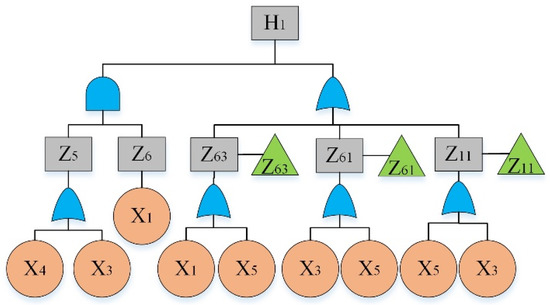
Figure 3.
Fault tree of a hydraulic system: sub-tree I.
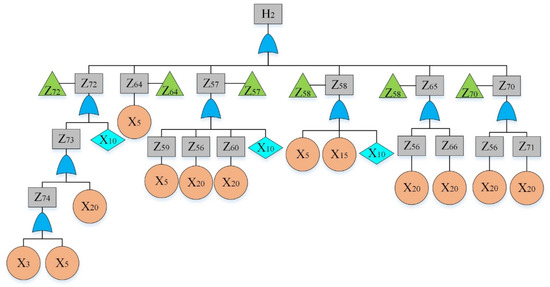
Figure 4.
Fault tree of a hydraulic system: sub-tree II.
Figure 5.
Fault tree of a hydraulic system: sub-tree III.
Figure 6.
Fault tree of a hydraulic system: sub-tree IV.
Figure 7.
Fault tree of a hydraulic system: sub-tree V.
Figure 8.
Fault tree of a hydraulic system: sub-tree VI.
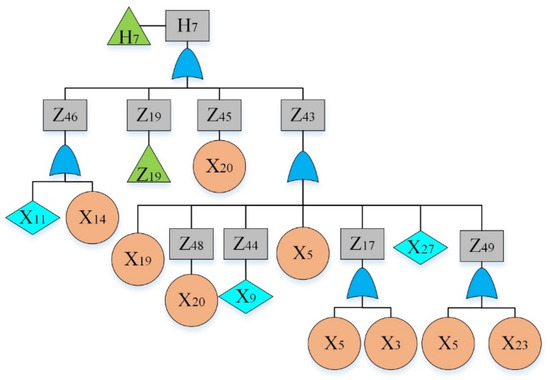
Figure 9.
Fault tree of a hydraulic system: sub-tree VII.
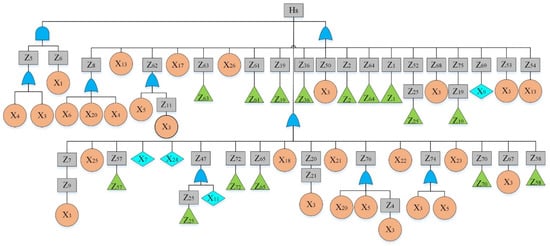
Figure 10.
Fault tree of a hydraulic system: sub-tree VIII.
Table 5.
Symbols used in the fault trees.
Table 6.
Events in the fault tree.
3.2. Quantitative Analysis
The results of frequency assessment based on failure data are shown in Table 7. As one can see, there are 21 failures evaluated as “uncertain,” i.e., Type I data.
Table 7.
The result of the frequency assessment.
For the purpose of illustration, one of the Type I data, which is the “check valve leakage,” was taken as an example for analysis. Two maintenance personnel gave three possible reasons for the failure: “Internal leakage caused by wear,” “Quality problems of check valve,” and “Connection looseness caused by mechanical vibration,” which constituted the frame of discernment D = {D1 = X3, D2 = X5, D3 = X9}. Four possible combinations are determined as focal elements, the BPA of each focal element was assigned, and the aggregated BPA was obtained by combining evidence, as shown in Table 8. Then, the frequency interval of D1, D2, and D3 was calculated, as shown in Table 9. The results were consequently merged into corresponding BEs in Table 6. After the remaining Type I data were processed, the objective occurrence was obtained.
Table 8.
The BPA of each combination.
Table 9.
The confidence interval of D1, D2, and D3.
There are six BEs with a Type II problem, which are expressed as a set T = {T1 = X8, T2 = X14, T3 = X21, T4 = X22, T5 = X24, T6 = X27}. The occurrence estimation was given by the designers, maintainers, and users, respectively, in the form of an interval rough number, as shown in Table 10.
Table 10.
The occurrence estimation given by experts.
The positive and negative ideal point of Fj is given as: = ([0.008, 0.012], [0.005, 0.015]), = ([0.002, 0.004], [0.001, 0.005]), = ([0.007, 0.011], [0.005, 0.012]), = ([0.001, 0.004], [0.001, 0.005]), = ([0.008, 0.012], [0.006, 0.014]), and = ([0.002, 0.003], [0.001, 0.004]).
All the three experts prefer to avoid risks; thus, risk preference coefficient τ was determined as τ = 0.3 to calculate the preference distance, of which the result is shown in Table 11. Then, the weight of expert was calculated, as shown in Table 12. By substituting wj, we calculated the utility value and its expectation. Thus, the subjective occurrence was obtained, as shown in Table 13.
Table 11.
The preference distance.
Table 12.
The expert weight.
Table 13.
The subjective occurrence.
3.3. Importance Analysis and Decision Making
Next, the objective and subjective occurrence were combined to derive the comprehensive occurrence. Table 14 summarizes the results of quantitative analysis.
Table 14.
Results of quantitative analysis.
Finally, the probability importance of each BE was calculated and shown in Table 15.
Table 15.
Probability importance of each BE.
According to the ranking rule of interval number, the probability importance of all BEs is listed in Table 16 and ranked as follows (largest to smallest):
Table 16.
Importance ranking of each BE.
For comparison purposes, the importance was measured and ranked in another three cases: In case 1 (C1), Type I problem was ignored, that is, the failure data of which the reason was identified as “Uncertain” were not used for analysis; in case 2 (C2), the Type II problem was ignored; in case 3 (C3), both Type I and Type II problems were ignored, which amounts to a conventional FTA approach. The importance ranking in three cases was compared to the result by the proposed approach, which is marked as C0, as shown in Figure 11. The results show that:
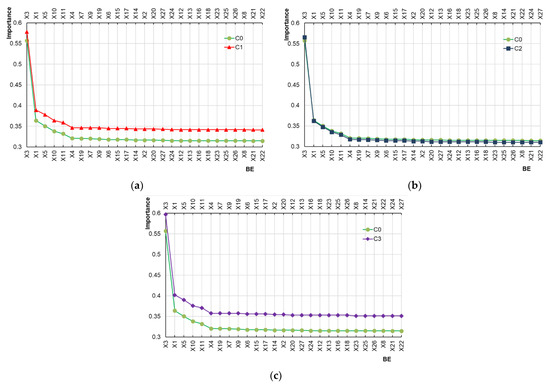
Figure 11.
Comparison results of importance analysis in different cases: (a) Comparison between C0 and C1; (b) Comparison between C0 and C2; (c) Comparison between C0 and C3.
Compared to C0, the ranking of X19 becomes lower in C1, which means that ignoring type I problems will change the ranking of BEs to some extent.
The rankings of X14, X24, and X27 become lower in C2 compared to C0. It should be noted that the three BEs are all Type II problem-related. This indicates that the importance of some BEs will be underestimated due to the lack of data support if a Type II problem is ignored.
The ranking of X19, X14, X24, and X27 changes in C3, which is the aggregate result of C1 and C2. The main reason for the differences is that the failure data incompleteness and uncertainty are not considered in C3 as compared to C0.
Finally, as one can see from the result, the top three critical BEs are “X3: Oil pollution,” “X1: Improper maintenance,” and “X5: Poor outsourced parts quality” in this case study, which make up more than 50% of the failure. Oil pollution is the most critical BE of a hydraulic system, which is the same as the result in [37]. This shows that the proposed approach ensures the veracity of analysis. Meanwhile, the result also gives advice about the reliability growth of the hydraulic system of HCMT: control the source of oil pollution and improve the filtering capacity. The service time threshold of key components should be clear, along with a proper maintenance plan, so that necessary repairs or replacements can be made in an appropriate time. In addition, the quality of outsourced parts should be strictly checked and the screen process should be carried out if necessary.
4. Conclusions
The hydraulic system of HCMT is a complex system with a high failure rate. For its fault tree quantitative analysis, failure data contains a lot of information about reliability and is useful for measuring the probability of BEs. However, conventional FTA approaches just using failure data have some limitations in quantitative analysis.
In this study, the proposed approach, which incorporates the experts’ opinions and the conventional FTA technique, is demonstrated as a viable method for the estimation of the occurrence probability when encountered with data uncertainty and incompleteness. Through a case study, the fault tree of a hydraulic system of HCMT is constructed, and the result shows that there are 27 basic events that cause hydraulic failure in an HCMT, where oil pollution is the most critical basic event.
The function of experts’ opinions is embodied from two aspects: (1) Experts’ opinions are utilized for correcting failure data with uncertainty, so that the data can be used for quantitative analysis; (2) Experts’ opinions are used as supplementary information for BEs with no observed data. The purpose is to integrate the subjective information with the objective information to improve the accuracy of quantitative analysis results. Therefore, based on the above idea, the proposed approach is also applicable to the fault tree quantitative analysis of other products with incomplete failure data.
Finally, although expert opinion was introduced for uncertainty and incompleteness of failure data, it more or less brought subjectivity. One solution is to detect the fault accurately through analyzing condition signals of hydraulic such as vibration, flow, leakage, oil pollution, and so on, without relying on the experience of experts. Due to the complexity and ambiguity of hydraulic failure mechanism, an intelligent diagnosis approach may be needed to learn fault features from fault data. In addition, considering there is no single intelligent diagnosis approach that can be suitable for all fault diagnosis tasks, ensemble methods, such as bagging, boosting, and other rules, are also needed to combine multiple base intelligent fault diagnosis approaches to become a strong learning mode. This put forward demands on the condition monitoring technique of a hydraulic system and related algorithms, which cannot be implemented in this article, because only fault event data were obtained. Nonetheless, it provides a direction for future FTA works.
Author Contributions
Conceptualization: H.T. and Z.Y.; Methodology: S.L. (Shizheng Li) and H.T.; Data curation: C.C. and H.T.; Software: S.L. (Shizheng Li); Formal analysis and investigation: S.L. (Shizheng Li) and H.T.; Writing—original draft preparation: S.L. (Shizheng Li); Writing—review and editing: Y.Z. and C.C.; Funding acqui-sition: Z.Y., F.D., and C.C.; Resources: F.D. and S.L. (Song Lu); Supervision: Z.Y. and Y.Z. All authors have read and agreed to the published version of the manuscript.
Funding
This work was supported by the National Natural Science Foundation of China [Grant No. 51675227, 62073274, 62075168]; National Major Science and Technology Projects of China [Grant No. 2018ZX04014001, 2014ZX04015031]; Jilin Province Science and Technology Development Funds [Grant No. 20180201007GX, 20190302017GX]; Special Plan of Provincial School Building [SXGJSF2017-2]; Technology Development and Research of Jilin Province [Grant No. 2019C037-01]; Changchun Science and Technology Planning Project [Grant No. 19SS011]; Special projects in key fields of Guangdong Provincial Department of Education of China [Grant No. 2019KZDZX1025]; Key R & D projects in Guangdong Province [Grant No. 2019B040403003]; Shenzhen Peacock Plan of Shenzhen Science and Technology Program (Grant No. KQTD2016113010470345).
Conflicts of Interest
The authors declare no conflict of interest.
References
- Uriarte, L.; Zatarain, M.; Axinte, D.; Yagüe-Fabra, J.; Ihlenfeldt, S.; Eguia, J.; Olarra, A. Machine tools for large parts. CIRP Ann.-Manuf. Technol. 2013, 62, 731–750. [Google Scholar] [CrossRef]
- Zhou, Z.-D.; Gui, L.; Tan, Y.-G.; Liu, M.-Y.; Liu, Y.; Li, R.-Y. Actualities and Development of Heavy-Duty CNC Machine Tool Thermal Error Monitoring Technology. Chin. J. Mech. Eng. 2017, 30, 1262–1281. [Google Scholar] [CrossRef]
- Urbikain, G.; Campa, F.-J.; Zulaika, J.-J.; López De Lacalle, L.-N.; Alonso, M.-A.; Collado, V. Preventing chatter vibrations in heavy-duty turning operations in large horizontal lathes. J. Sound Vib. 2015, 340, 317–330. [Google Scholar] [CrossRef]
- Prodan, D.; Balan, E.; Bucuresteanu, A.; Constantin, G. Hydraulic balancing of crossrails and rams of heavy duty machine tools. Proc. Manuf. Syst. 2015, 10, 3–8. [Google Scholar]
- Zhang, F.; Cheng, L.; Gao, Y.; Xu, X.; Wang, Y. Fault tree analysis of a hydraulic system based on the interval model using latin hypercube sampling. J. Intell. Fuzzy Syst. 2019, 37, 8345–8355. [Google Scholar] [CrossRef]
- Urreta, H.; Aguirre, G.; Kuzhir, P.; Lopez de Lacalle, L.-N. Seals Based on Magnetic Fluids for High Precision Spindles of Machine Tools. Int. J. Precis. Eng. Manuf. 2018, 19, 495–503. [Google Scholar] [CrossRef]
- Xiong, Y.; Wu, J.; Deng, C.; Wang, Y. Machining process parameters optimization for heavy-duty CNC machine tools in sustainable manufacturing. Int. J. Adv. Manuf. Technol. 2013, 18, 1–10. [Google Scholar] [CrossRef]
- Dobrivoje, C.; Milomir, G.; Mile, S.; Jasna, G. Fault tree analysis of hydraulic power-steering system. Int. J. Veh. Des. 2014, 64, 26–45. [Google Scholar] [CrossRef]
- Shafiee, M.; Enjema, E.; Kolios, A. An Integrated FTA-FMEA Model for Risk Analysis of Engineering Systems: A Case Study of Subsea Blowout Preventers. Appl. Sci. 2019, 9, 1192. [Google Scholar] [CrossRef]
- Baklouti, A.; Nguyen, N.; Mhenni, F.; Choley, J.-Y.; Mlika, A. Improved Safety Analysis Integration in a Systems Engineering Approach. Appl. Sci. 2019, 9, 1246. [Google Scholar] [CrossRef]
- Hyun, K.-C.; Min, S.; Choi, H.; Park, J.; Lee, I.-M. Risk analysis using fault-tree analysis (FTA) and analytic hierarchy process (AHP) applicable to shield TBM tunnels. Tunn. Undergr. Space Technol. 2015, 49, 121–129. [Google Scholar] [CrossRef]
- Sung, B.J.; Kim, D.S. A study of reliability improvement of high capacity cooling system for machine tool. In Proceedings of the 2014 17th International Conference on Electrical Machines and Systems, ICEMS, Hangzhou, China, 22–25 October 2014; pp. 2396–2402. [Google Scholar] [CrossRef]
- Zhou, L.; Chen, S.; Liang, Y.; Cheng, K. Reliability design of machine tool feed system based on fault tree analysis. Mach. Des. Manuf. 2007, 6, 60–62. [Google Scholar]
- Fan, J.; Wang, H.; Zhang, L.; Liu, C. FMECA and FTA Reliability Analysis of Head Frame System of CNC Grinding Machine. Modul. Mach. Tool Autom. Manuf. Technol. 2016, 11, 157–160. [Google Scholar] [CrossRef]
- Mi, J.; Li, Y.; Peng, W.; Yang, Y.; Huang, H.-Z. Fault tree analysis of feeding control system for computer numerical control heavy-duty horizontal lathes with multiple common cause failure groups. J. Shanghai Jiaotong Univ. 2016, 21, 504–508. [Google Scholar] [CrossRef]
- Zhang, Y.; Fan, J.; Li, Z.; Wu, C.; Tao, H.; Zhao, Y.; Lu, Q. Reliability analysis of cooling system of CNC grinding machine based on FTA analysis. IOP Conf. Ser. Mater. Sci. Eng. 2019, 612, 1–9. [Google Scholar] [CrossRef]
- Patil, R.B.; Mhamane, D.A.; Kothavale, P.B.; Kothavale, B. Fault Tree Analysis: A Case Study from Machine Tool Industry. In Proceedings of the TRIBOINDIA-2018 An International Conference on Tribology, Mumbai, India, 13–15 December 2018. [Google Scholar] [CrossRef]
- Hogan, P.A.; Burrows, C.R.; Edge, K.A.; Atkinson, R.M.; Montakhab, M.R.; Woollons, D.J. Automated fault tree analysis for hydraulic systems. J. Dyn. Sys. Meas. Control. 1996, 118, 278–282. [Google Scholar] [CrossRef]
- Shen, G.; Li, H.; Zhang, Y.; Li, Q.; Wang, X.; Ding, Y. The importance analysis of tool magazine fault and its reliability improved design. J. Chongqing Univ. 2013, 36, 70–75. [Google Scholar]
- Ma, C.; Wang, K.; Sun, J. Fault diagnosis to mid-size excavator hydraulic system based on fault tree analysis. In Proceedings of the 2010 International Conference on Frontiers of Manufacturing and Design Science, Chonqqing, China, 11–12 December 2010; pp. 1110–1114. [Google Scholar] [CrossRef]
- Jianghong, S.; Chi, M.; Yuanlin, Y. Fault diagnosis to mid-size excavator bucket hydraulic system based on fault tree analysis. In Proceedings of the 3rd International Conference on Digital Manufacturing and Automation, Guilin, China, 31 July–2 August 2012; pp. 88–92. [Google Scholar] [CrossRef]
- Purba, J.H.; Lu, J.; Zhang, G.; Pedrycz, W. A fuzzy reliability assessment of basic events of fault trees through qualitative data processing. Fuzzy Sets Syst. 2014, 243, 50–69. [Google Scholar] [CrossRef]
- Ferdous, R.; Khan, F.; Sadiq, R.; Amyotte, P.R.; Veitch, B. Handling data uncertainties in event tree analysis. Process. Saf. Environ. Prot. 2009, 87, 283–292. [Google Scholar] [CrossRef]
- Mi, J.; Li, Y.; Li, H.; Huang, H. Fault tree analysis for CNC hydraulic system based on fuzzy theory. Manuf. Tech Mach. Tool 2011, 4, 114–119. [Google Scholar] [CrossRef]
- Ren, Y.; Ding, Z.; Li, D.; Yu, J.; Liu, Y.; Yu, K.; Zhan, G. Research on Fuzzy Fault Tree Analysis for Hydraulic System of A-Frame Launch & Recovery System for the “Jiaolong” Manned Submersible. Zhendong Ceshi Yu Zhenduan 2018, 38, 1187–1192, 1293. [Google Scholar] [CrossRef]
- Li, Y.; Sun, J.; Li, H.; Huang, H.-Z.; Liu, Y. Fuzzy dynamic fault tree analysis of hydraulic system of CNC machining center. In Proceedings of the ASME 2011 International Design Engineering Technical Conferences and Computers and Information in Engineering Conference, Washington, DC, USA, 28–31 August 2011; pp. 887–892. [Google Scholar] [CrossRef]
- Li, Q.; Sun, H.; Chen, X. Reliability Analysis of Hydraulic System of Anchor Drilling Rigs Based on Fuzzy Fault Tree. J. Donghua Univ. 2019, 36, 227–233. [Google Scholar] [CrossRef]
- Zhang, L.L.; Zhang, R.J.; Si, X.X. Importance analysis method of fuzzy fault tree based on T-S modle and application in hydraulic system. In Proceedings of the 2nd International Conference on Mechanical Engineering, Materials Science and Civil Engineering, Beijing, China, 25–26 October 2013; pp. 707–711. [Google Scholar] [CrossRef]
- Zheng, P.; Xu, X.; Xie, S. A weighted interval rough number based method to determine relative importance ratings of customer requirements in QFD product planning. J. Intell. Manuf. 2019, 30, 3–16. [Google Scholar] [CrossRef]
- Mansour, B.; Mahmoud, M.; Naser, S. Fuzzy reliability analysis using a new alpha level set optimization approach based on particle swarm optimization. J. Intell. Fuzzy Syst. 2016, 30, 235–244. [Google Scholar] [CrossRef]
- Zhang, Z.; Jiang, C.; Fan, S.; Liu, J. A reliability-based design optimization method for structures using evidence theory. Sci. Sin. Technol. 2016, 46, 706–716. [Google Scholar] [CrossRef]
- Xi, Z.; Linghu, Q.; Yi, C.; Wu, X.; Li, J.; Tang, Z. A novel combination of evidence theory based on improved conflict coefficient. J. Cent. South Univ. Sci. Technol. 2018, 49, 1700–1709. [Google Scholar] [CrossRef]
- Khoo, L.P.; Tor, S.B.; Zhai, L.Y. A Rough-Set-Based Approach for Classification and Rule Induction. Int. J. Adv. Manuf. Technol. 1995, 15, 438–444. [Google Scholar] [CrossRef]
- Wang, X.; Lv, S. Multi-attribute Decision Method Based on Interval Rough Numbers Considering the Risk Preferences of Decision-makers. Stat. Decis. 2017, 10, 50–53. [Google Scholar] [CrossRef]
- Li, D.; Zeng, W.; Zeng, W. Novel ranking method of interval numbers based on the Boolean matrix. Soft Comput. 2016, 31, 629–634. [Google Scholar] [CrossRef]
- Zhang, G.; Zhang, H.; Pang, J.; Liu, J. Fault trace and analysis of hydraulic system attached to CNC machine tools. Appl. Res. Comput. 2012, 29, 1356–1358. [Google Scholar] [CrossRef]
- Rakic, R. The influence of hydraulic oil on the hydraulic system failures. Tribologia 2000, 19, 17–26. [Google Scholar]


Publisher’s Note: MDPI stays neutral with regard to jurisdictional claims in published maps and institutional affiliations. |
© 2021 by the authors. Licensee MDPI, Basel, Switzerland. This article is an open access article distributed under the terms and conditions of the Creative Commons Attribution (CC BY) license (http://creativecommons.org/licenses/by/4.0/).