Article

Effect of Pd on the Electrocatalytic Activity of Pt towards Oxidation of Ethanol in Alkaline Solutions

by
Salma Jadali
1,
Mohammad Ali Kamyabi
1,2,*,
José Solla-Gullón
2 and
Enrique Herrero
2,*
1
Department of Chemistry, Faculty of Science, University of Zanjan, Zanjan 45371-38791, Iran
2
Instituto de Electroquímica, Universidad de Alicante, Apartado 99, E-03080 Alicante, Spain
*
Authors to whom correspondence should be addressed.
Appl. Sci. 2021, 11(3), 1315; https://doi.org/10.3390/app11031315
Submission received: 23 December 2020 / Revised: 21 January 2021 / Accepted: 26 January 2021 / Published: 1 February 2021
(This article belongs to the Special Issue Nanostructured Materials and Energy-Related Devices)

Abstract

:
The understanding of electrocatalytic activity and poisoning resistance properties of Pt and Pd nanoparticles, recognized as the best electrocatalysts for the ethanol oxidation reaction, is an essential step for the commercialization of direct ethanol fuel cells (DEFCs). In this paper, mono and bimetallic Pt and Pd nanoparticles with different atomic ratios have been synthesized to study their electrocatalytic properties for an ethanol oxidation reaction in alkaline solutions. The different nanoparticles were physiochemically characterized by transmission electron microscopy (TEM), energy-dispersive X-ray spectroscopy (EDX), X-ray diffraction (XRD), and X-ray photoelectron spectroscopy (XPS). The electrochemical characterization was performed by cyclic voltammetry and chronoamperometry measurements. The electrochemical measurements indicate that Pt nanoparticles have much higher electrocatalytic activity for ethanol oxidation than Pd nanoparticles. The studies with bimetallic PtPd nanoparticles showed a significant impact of their composition on the ethanol oxidation. Thus, the highest electrocatalytic activity and poisoning resistance properties were obtained for Pt3Pd2 nanoparticles. Moreover, this study demonstrates that the poisoning of the catalyst surface through ethanol oxidation is related to the prevalence of the acetaldehyde–acetate route and the polymerization of acetaldehyde through aldol condensation in the alkaline media.

1. Introduction

Direct alcohol fuel cells (DAFCs) have been considered as an alternative source of energy for many electronic devices [1,2]. DAFCs present several advantages over lithium-ion batteries (LIBs), which are normally used in these electronic devices, and hydrogen-feed polymer electrolyte membrane fuel cells (PEMFCs). LIBs cannot be used as the power source in portable devices or even in stationary devices where an electrical energy source is not available. Under these conditions, DAFCs are the best choice for such devices [3,4]. Although the theoretical voltage of DAFCs and PEMFCs are approximately the same, alcohols present with fewer problems of storage and transportation. Alcohols have a high energy density (4000–7000 Wh L−1) which is similar to those of hydrocarbons (9800 Wh L−1) while the power density of hydrogen (180 Wh L−1) is lower than DAFCs [5]. These properties reflect the theoretical superiority of DAFCs over PEMFCs. Different kinds of alcohols can be used as fuel in DAFCs, each of them has its own advantages and disadvantages [6]. Although there are studies on the use of ethylene glycol [7], propanol [8], and butanol [9] as fuels in DAFCs, the most widespread alcohol-based fuels are methanol and ethanol [10,11,12,13,14,15]. In addition to the high energy density and nontoxicity of ethanol, the balance of CO2, the most common greenhouse gas, in the environment is preserved during ethanol oxidation because ethanol can be obtained from biomass. Thus, there is a circulation between ethanol consumption and ethanol production through the fermentation process of agricultural products [6]. Regarding its oxidation mechanism on platinum electrodes, it has been well confirmed that ethanol oxidation reaction (EOR) can take place through a parallel pathway [16,17,18]. In the first route (blue arrows in Figure 1), the so-called C2 pathway, the C-C bond is not broken, and ethanol is first oxidized to acetaldehyde, which can be further oxidized to acetic acid (or acetate in alkaline solution) [19,20]. This route exchanges four electrons and releases only one-third of the formal energy density of ethanol. The release of the whole energy stored in ethanol is obtained through the C1 pathway with the exchange of twelve electrons. This route (green arrows in Figure 1) proceeds through the breaking of the C-C bond in the early stages of the oxidation process and produces adsorbed CO which can be further oxidized to CO2 (or carbonate in alkaline solution). CO is considered a poison intermediate because it is strongly adsorbed on the surface (blocking surface sites) and its oxidation requires high overpotentials. The efforts that expedite oxidation of CO to CO2 and decrease the potential of CO oxidation remarkably improve the electrocatalytic activity towards EOR [20].
Nowadays, the oxidation of alcohols, like ethanol, in alkaline media has gained attention since non-Pt-based catalysts, such as Pd-based catalysts, can be used as the electrocatalyst for the oxidation and reduction reaction [21]. These alternative catalysts may decrease the cost of DEFCs and facilitate their commercialization [22,23]. The prevailing mechanism of the EOR produces acetaldehyde through the cleavage of the C-H bond, which can undergo the aldol condensation reaction in alkaline media. When the aldol condensation reaction is faster than acetaldehyde oxidation to produce acetate the catalyst surface with β–hydroxy aldehyde. Since the electrocatalytic activity of materials is connected to their composition and morphology, replacement of Pt with other elements such as Pd not only mitigates the catalyst poisoning but may also decrease the cost. Mono and bimetallic Pt and Pd nanoparticles have been used for the electrocatalytic oxidation of ethanol. In all these studies, PtPd nanoparticles on different supports show better electrocatalytic properties than pure Pt or Pd nanoparticles [23,24,25,26,27,28,29,30,31,32]. However, due to the different criteria for comparing the electrocatalytic activity of these electrodes and the variety of supports, it is not clear which is the optimal composition for the EOR. On the other hand, there is a doubt about the electrocatalytic activity of Pt and Pd nanoparticles towards EOR. While some of these studies demonstrate the higher activity of Pd nanoparticles judging from onset potential and current density, other studies exhibit the lower onset potential for ethanol oxidation on the surface of Pt nanoparticles. In this regard, the evaluation of the electrocatalytic activity of Pt and Pd and the determination of the best composition of bimetallic PtPd nanoparticles for EOR in the alkaline media are controversial issues and the essential needs to produce practical DEFCs. The main objective of this study is to provide new insights to solve this debate by using a set of nanoparticles with different Pt:Pd rations synthesized in the same conditions and with very similar sizes. Thus, the EOR has been studied on mono and bimetallic Pt and Pd nanoparticles synthesized with a water-in-oil microemulsion method. Techniques such as transmission electron microscopy (TEM), energy-dispersive X-ray analysis (EDX), X-ray diffraction spectroscopy (XRD), and X-ray photoelectron spectroscopy (XPS) are used to properly characterize the different nanoparticles in term of size, bulk and atomic compositions and structure. Electrochemical techniques including cyclic voltammetry (CV) and chronoamperometry (CA) are used to explore the catalytic activity, stability, and blocking species during EOR on the surface of the synthesized nanoparticles under alkaline conditions.

2. Experimental

2.1. Materials and Methods

Analytical grade of ethanol (EtOH, 99.5%), and NaOH were purchased from Merck (Darmstadt, Germany). H2PtCl6, K2PdCl4, and NaBH4 were purchased from Sigma Aldrich (St. Louis, MO, USA). The aqueous solutions were prepared with ultrapure water. Electrochemical experiments were performed on a standard three-electrode cell system including a modified glassy carbon electrode (2 mm in diameter, GCE), Pt wire, and a saturated Ag/AgCl as working, counter and reference electrodes, respectively. Electrochemical experiments were carried out with a µ-Autolab potentiostat/galvanostat 101 controlled by Nova software (Metrohm, Switzerland).
The morphology and structure of the synthesized nanoparticles were studied by using an energy dispersive spectrometer (EDX, OXFORD, INCA model system, Oxford Instruments, Oxon, UK), transmission electron microscopy (TEM, JEOL JEM-2010 microscope working at 200 kV, JEOL, Tokyo, Japan), X-ray diffraction spectroscopy (XRD, Bruker D8 advance diffractometer, using Cu Kα radiation, Bruker, Billerica, MA, USA), and X-ray photoelectron spectroscopy (XPS, VG Microtech Multilab electron spectrometer, Thermo Fisher Scientific, Waltham, MA, USA) methods.

2.2. Synthesis of Nanoparticles and Modification of GCE

The mono and bimetallic Pt and Pd nanoparticles with different atomic composition and rather uniform size were synthesized with a water-in-oil microemulsion (water/polyethylene glycol dodecyl ether (Brij®30)/n-heptane) method according to previous works [33,34]. The synthesis was achieved by mixing equal volumes of the two microemulsions containing an aqueous solution of the metallic precursors and hydrazine as the reducing agent. In order to have micelles of the same size, i.e., nanoparticles of approximately the same size, the water to surfactant (ω0 = 3.8) molar ratio and the surfactant concentration were maintained constant. After reduction, nanoparticles were precipitated by adding NaOH and the precipitated metallic nanoparticles were washed several times with acetone and finally kept in ultra-pure water as a suspension. For the preparation of alloyed nanoparticles, an aqueous solution of H2PtCl6/K2PdCl4 with a convenient atomic proportion of the two elements was employed. Before testing, the GCE was polished with Al2O3 powder (Sigma Aldrich, 45 μm), rinsed with distilled water, and dried at a temperature of 40 °C. This mechanically cleaning was performed to remove the nanoparticles from prior experiments. The synthesized nanoparticles were ultrasonically suspended in double distilled water and the surface of clean GCE was covered homogenously with 5 μL ink of each nanoparticle sample. The modified GCE was used as the working electrode after drying at a temperature of 40 °C [20,33,35,36,37]. The synthesized nanoparticles were denoted as the Pt, Pt4Pd, Pt3Pd2, Pt2Pd3, PtPd4, and Pd which correspond to a theoretical Pt:Pd ratio of 100:0, 80:20, 60:40, 40:60, 20:80, and 0:100, respectively.

3. Results and Discussion

3.1. Characterization of the Nanoparticles

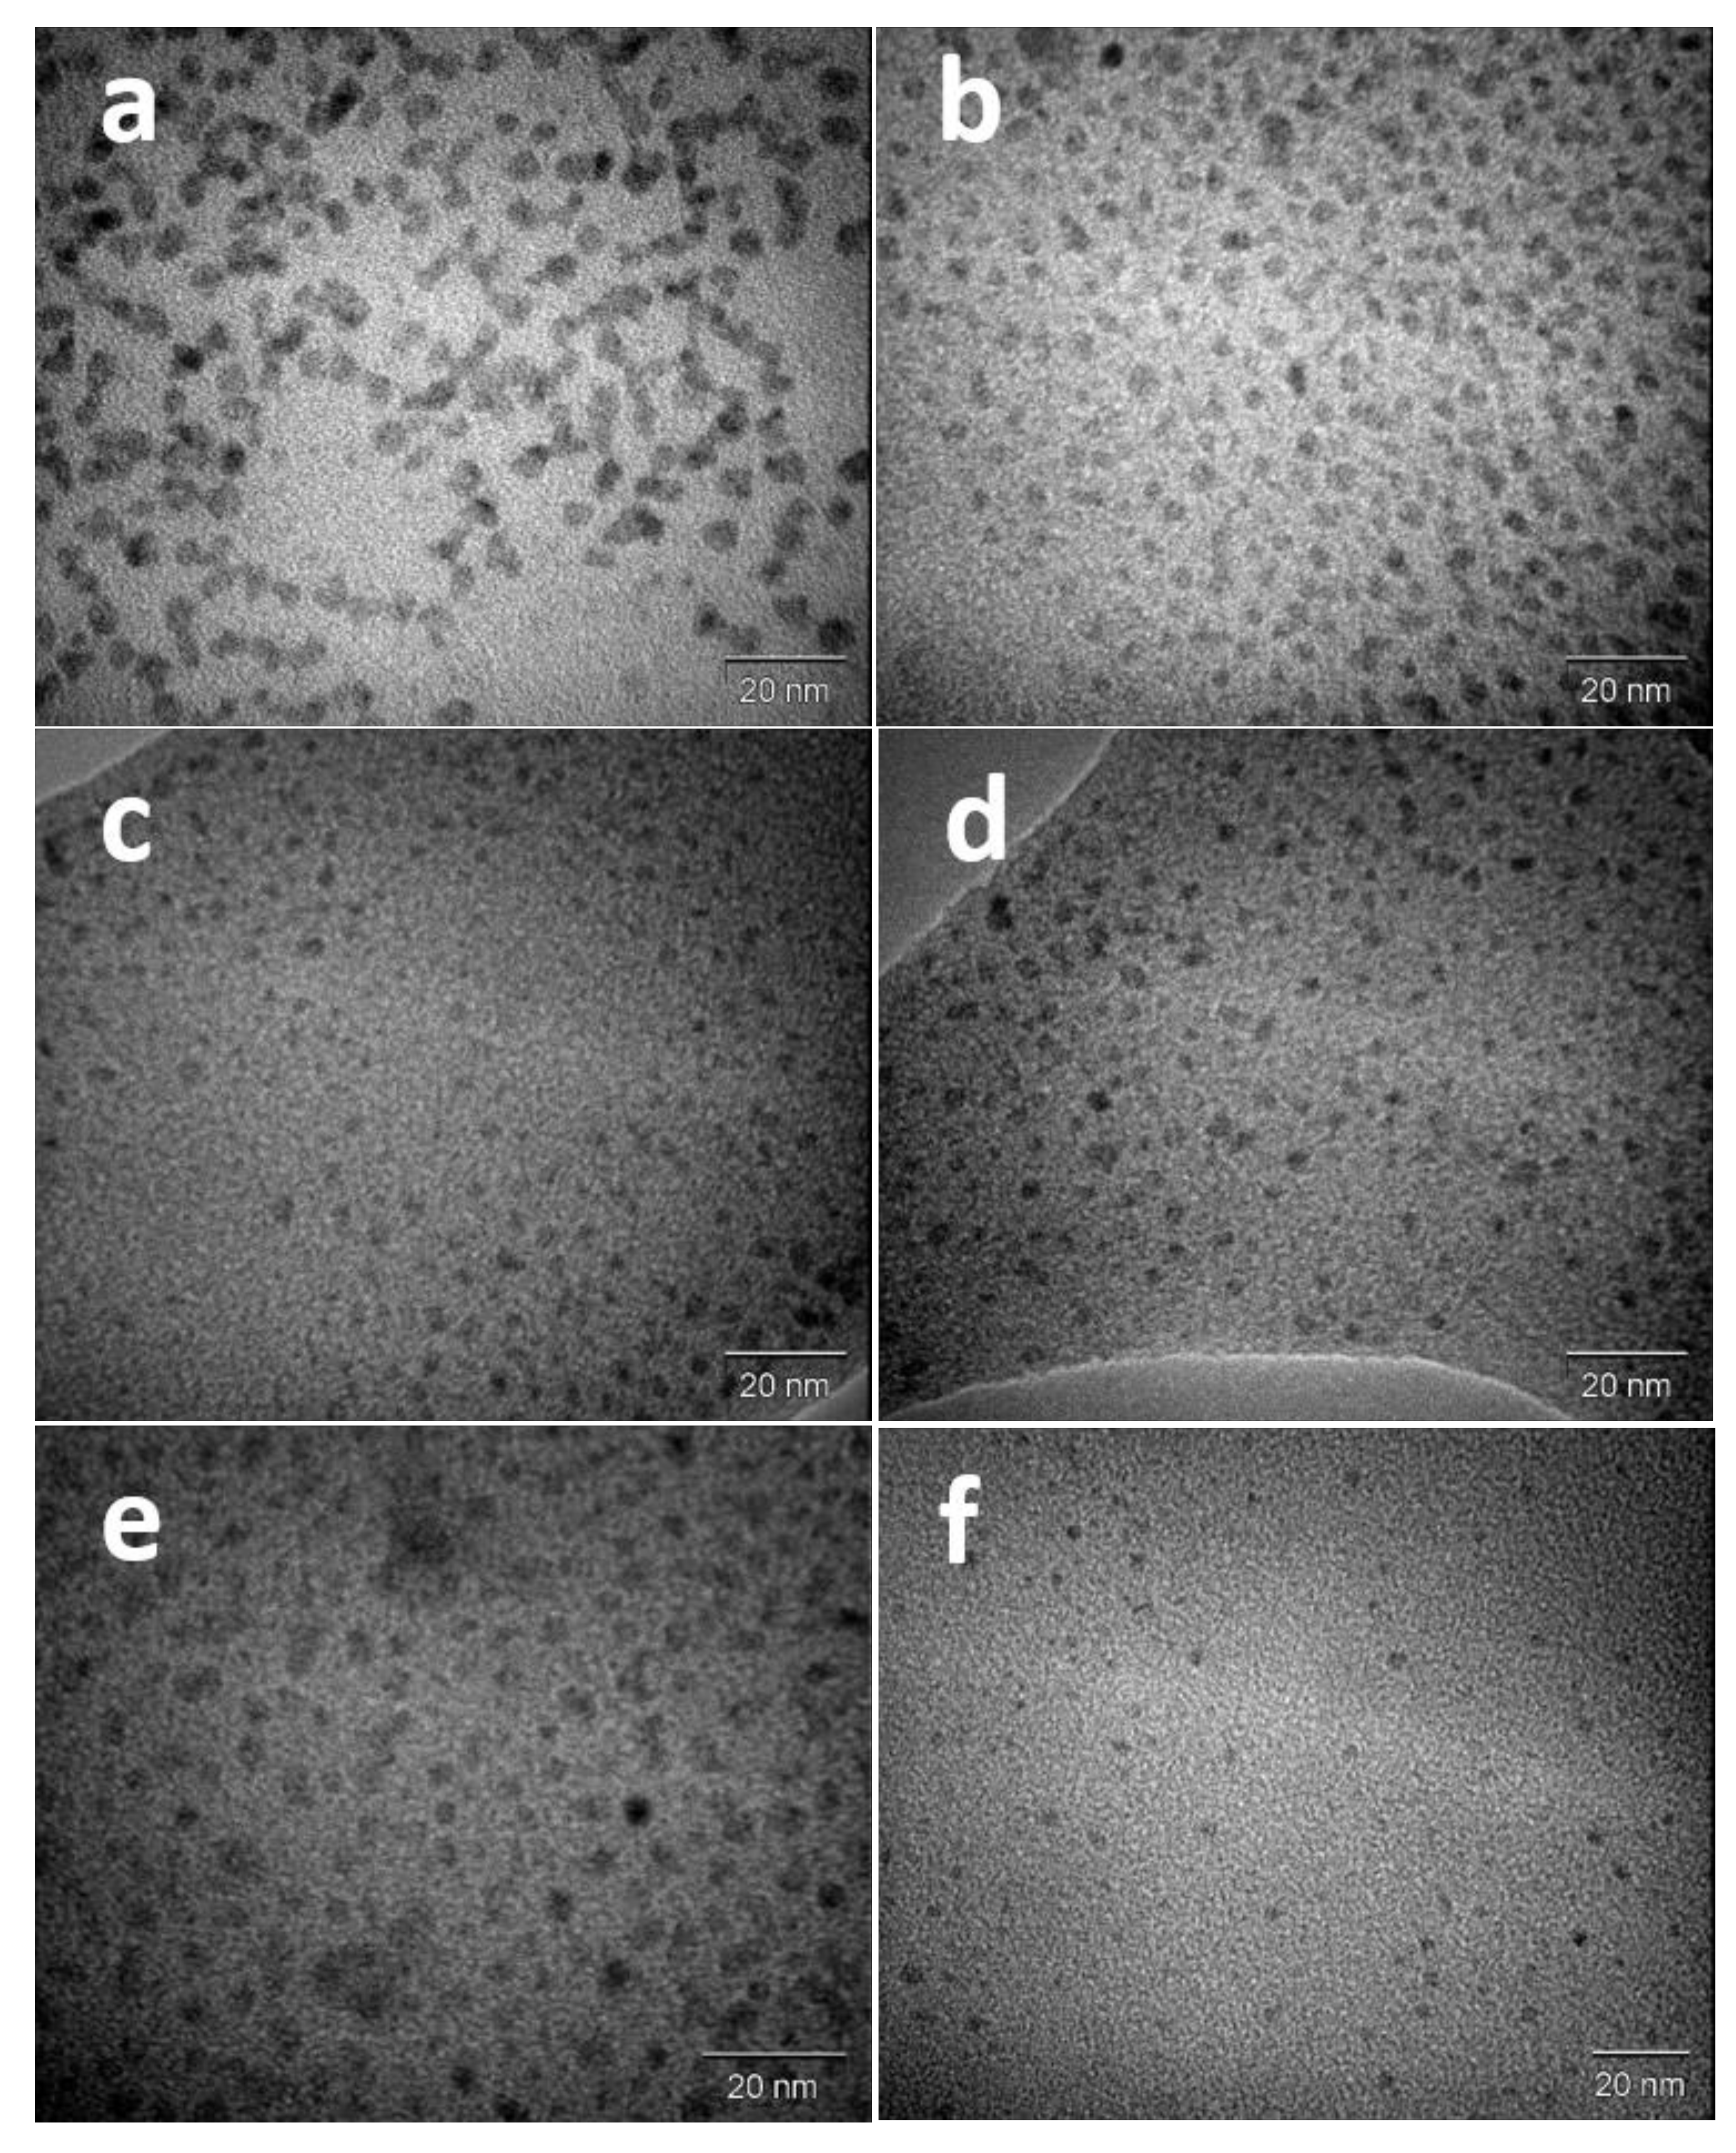
Figure 2 shows some representative TEM images of the synthesized nanoparticles with different compositions. As can be seen, nanoparticles have a diameter below 5 nm (Figure 2a–f), with no significant changes in the morphology of the nanoparticles. In fact, the analysis of the structure of the nanoparticles carried out by TEM showed no visible differences due to the small difference between the lattice parameter of Pt and Pd nanoparticles, which is beyond the resolution of the images [23]. The mean particle size of the nanoparticles is reported in Table 1. This mean particle size was obtained from the analysis of more than 200 nanoparticles per sample from different parts of the grid and using ImageJ (Wayne Rasband, public domain) and Origin software (OriginLab, Northampton, MA, USA). The average size of synthesized nanoparticles according to the analysis of the TEM images is 3.4 ± 1 nm, and the biggest and smallest particle sizes were observed for the Pt and Pd nanoparticles with 4.5 ± 0.7 nm and 1.6 ± 0.4 nm, respectively.
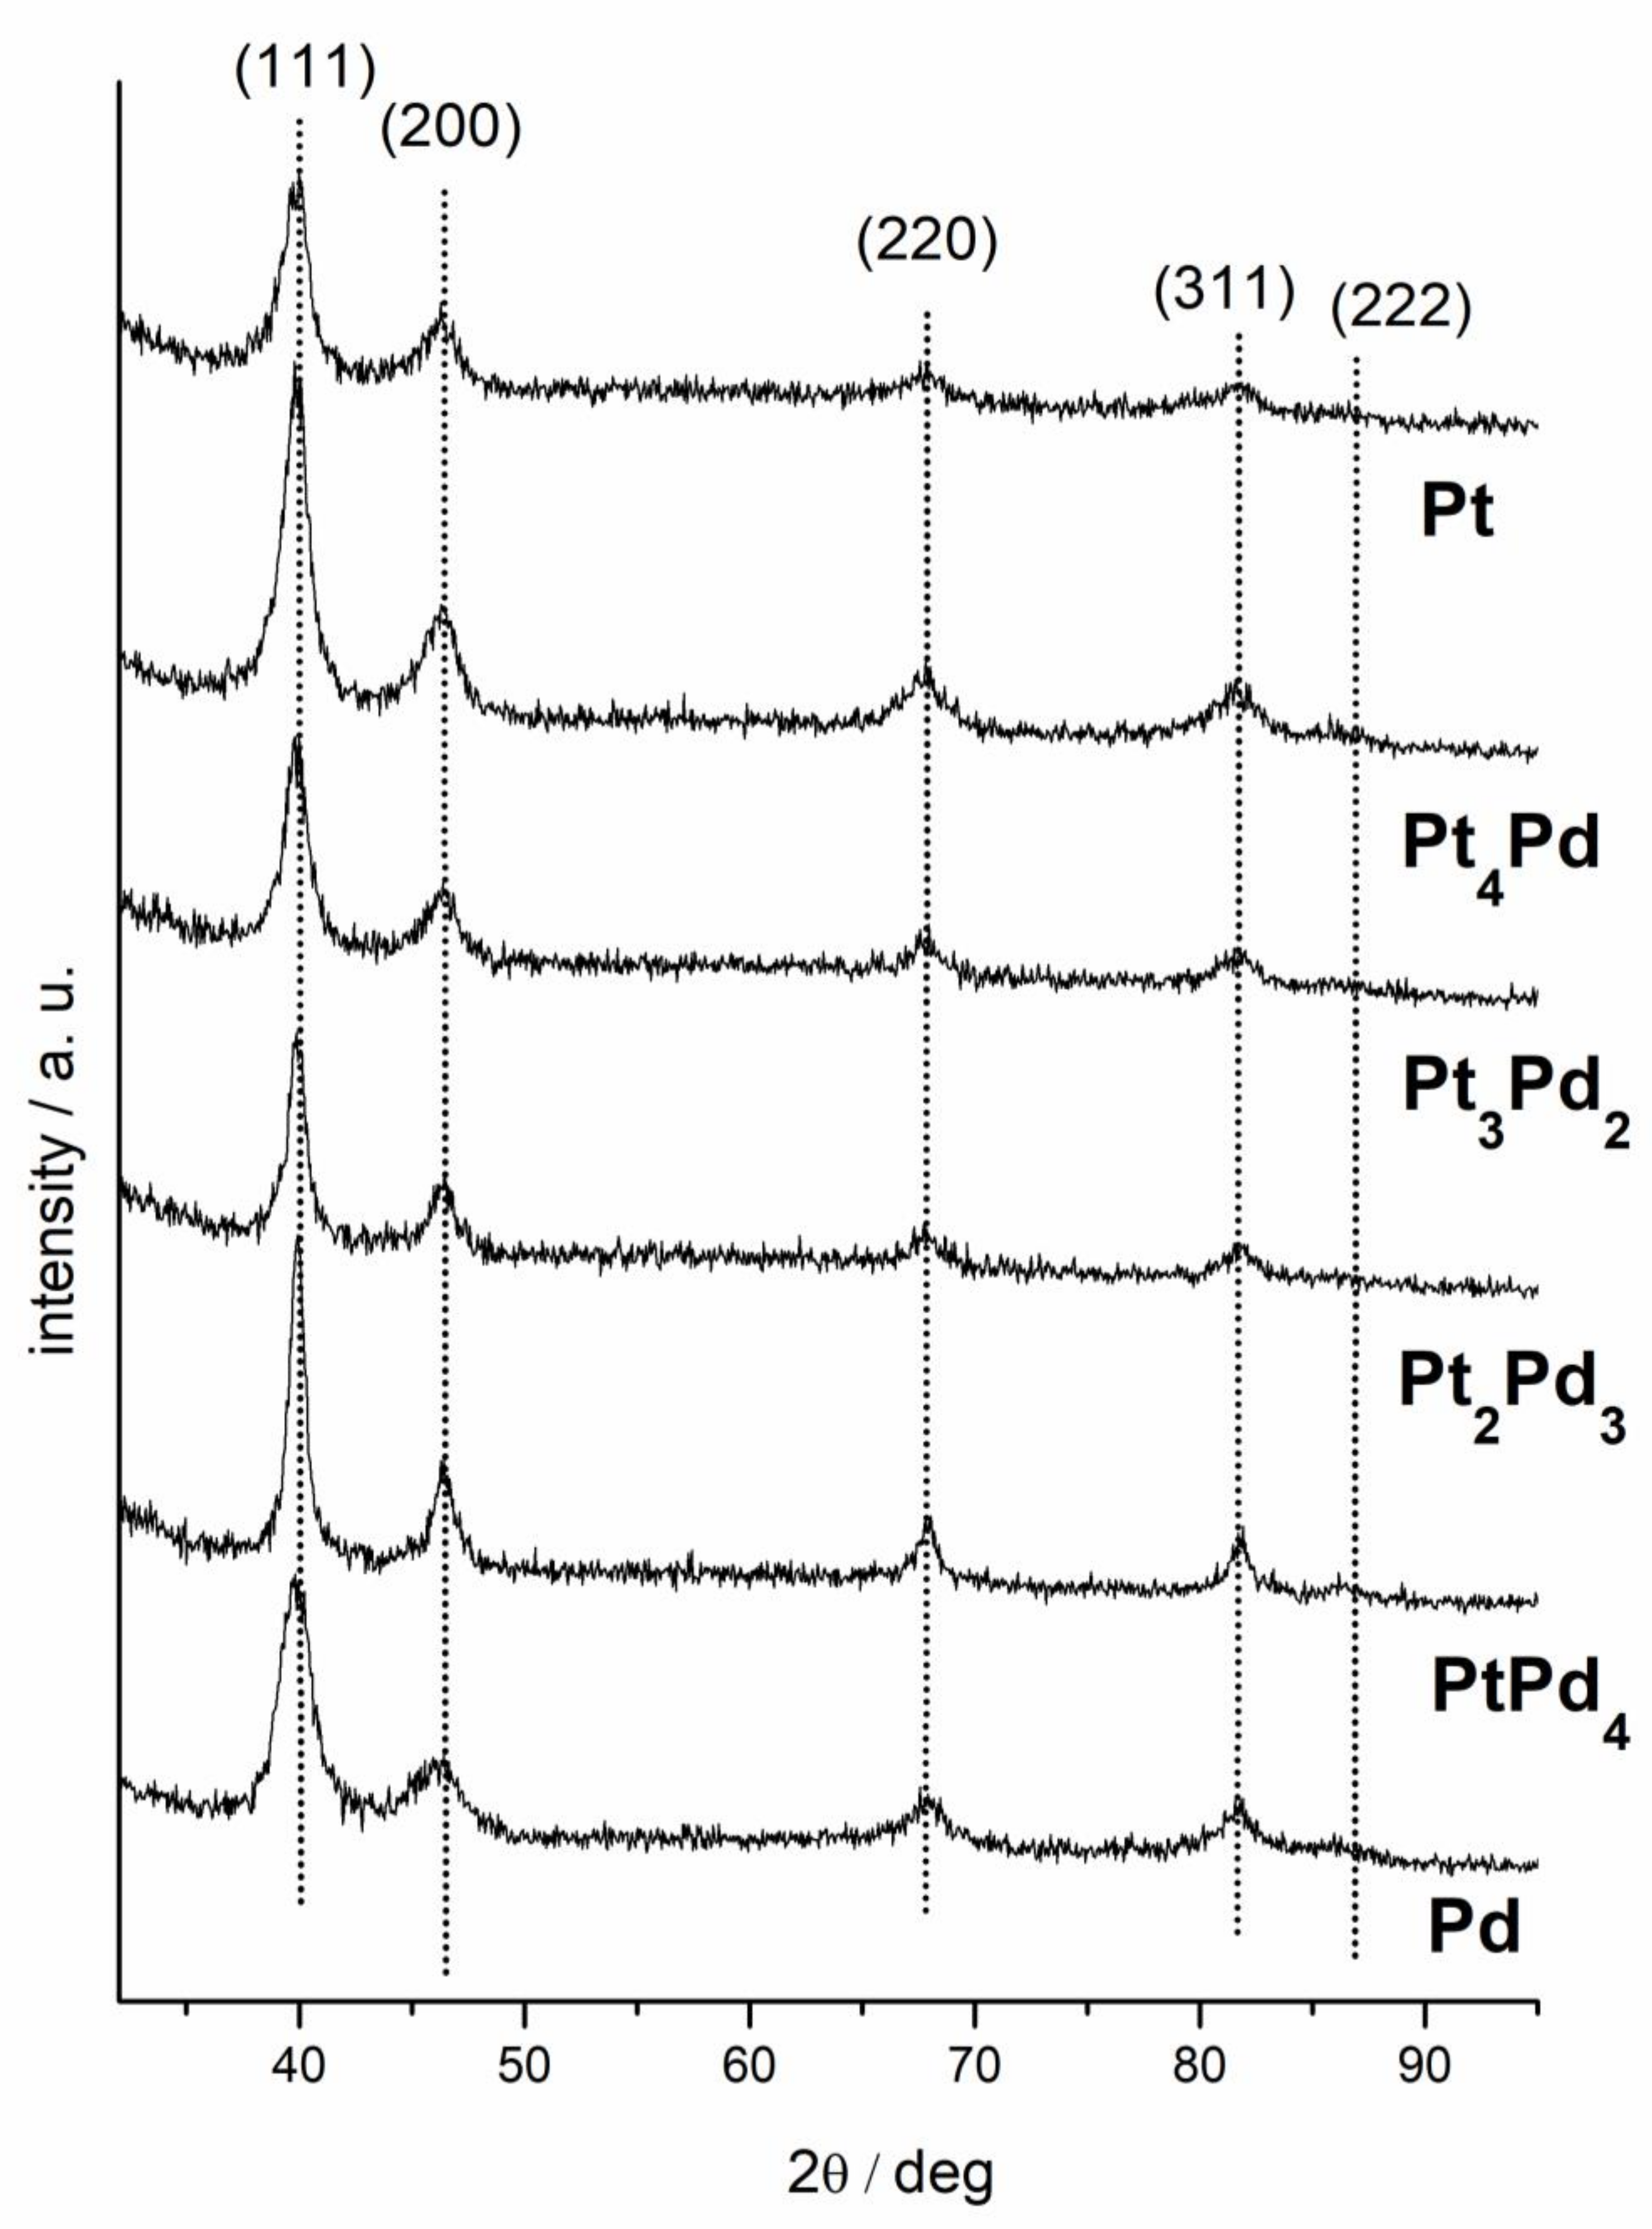
Figure 3 shows the XRD patterns of the different nanoparticles. All the diffraction peaks can be indexed with the face-centered cubic (fcc) bulk structure of Pt and Pd. The nanoparticle size was also calculated by using the (200) lattice plane of the XRD measurements, using the Scherrer equation. The calculated sizes are also reported in Table 1. The results obtained are in good agreement with the TEM analysis. In this respect, it should be noted that the estimation of the particle size with the XRD for particle sizes lower than 5 nm is always “approximate” and small discrepancies can be observed with those obtained by TEM since the averaging and definition of size is different.
The real atomic composition of synthesized nanoparticles was calculated with AAS, UV-Vis, and EDX techniques. All of the calculated atomic compositions were in good agreement with the nominal values. The results have been represented in Table 2.
The XPS experiments were performed to determine the electronic properties of the nanoparticles, as shown in Figure 4. In some cases, XPS can also be used to characterize the surface composition. However, it is important to note that XPS is not a pure surface method because the electrons penetrate a few nanometers into the material. For nanoparticles with an average size of about 3.4 nm, the spectra contain information from the whole nanoparticle [35]. We profit this property to determine the composition of synthesized nanoparticles by XPS [34]. The results are shown in the last column of Table 2. As can be seen, the values agree, within the error of the techniques, with the nominal values and those measured by AAS, UV-Vis, and EDX techniques. Regarding the electronic properties, the Pt 4f and Pd 3d regions of the spectra are going to be examined. The Pt 4f peaks in the spectra of Pt, Pt4Pd, and PtPd4 are shown in Figure 4a,c,e. The deconvolution of the Pt 4f peaks shows two pairs of doublets. The pair located at 71 eV ( 4 f 7 2 ) and 74.7 eV ( 4 f 5 2 ) are attributed to Pt0 and the second pair at 72.9 eV ( 4 f 7 2 ) and 76.4 eV ( 4 f 5 2 ) are related to Pt2+ species. The analysis of the region corresponding to the Pd 3d region displays very similar results. Pd0 shows a doublet with a binding energy of 335 eV ( 3 d 5 2 ) and 341 eV ( 3 d 3 2 ), whereas the pair of peaks at 337.1 eV ( 3 d 5 2 ) and 342.8 eV ( 3 d 3 2 ) are related to the presence of Pd2+ [38,39]. The ratio of the intensity of Pt2+ and Pt0 (and also for Pd2+ and Pd0) proves that Pt and Pd are mostly in their reduced form. On the other hand, the analysis of the peak position indicates that the formation of the PtPd alloys modifies the peak positions. As the Pd ratio increases, the Pt 4f peaks shift to lower binding energies. On the other hand, the increase of the Pd ratio shifts the binding energy of Pd 3d electrons to lower values. The changes in the binding energy observed with the Pt:Pd ratio demonstrates the change of electronic structure due to the formation of a PtPd alloy and the presence of electronic effects [32,40].

3.2. Electrochemical Experiments

3.2.1. Electrochemical Characterization: Background Examination in the Alkaline Media

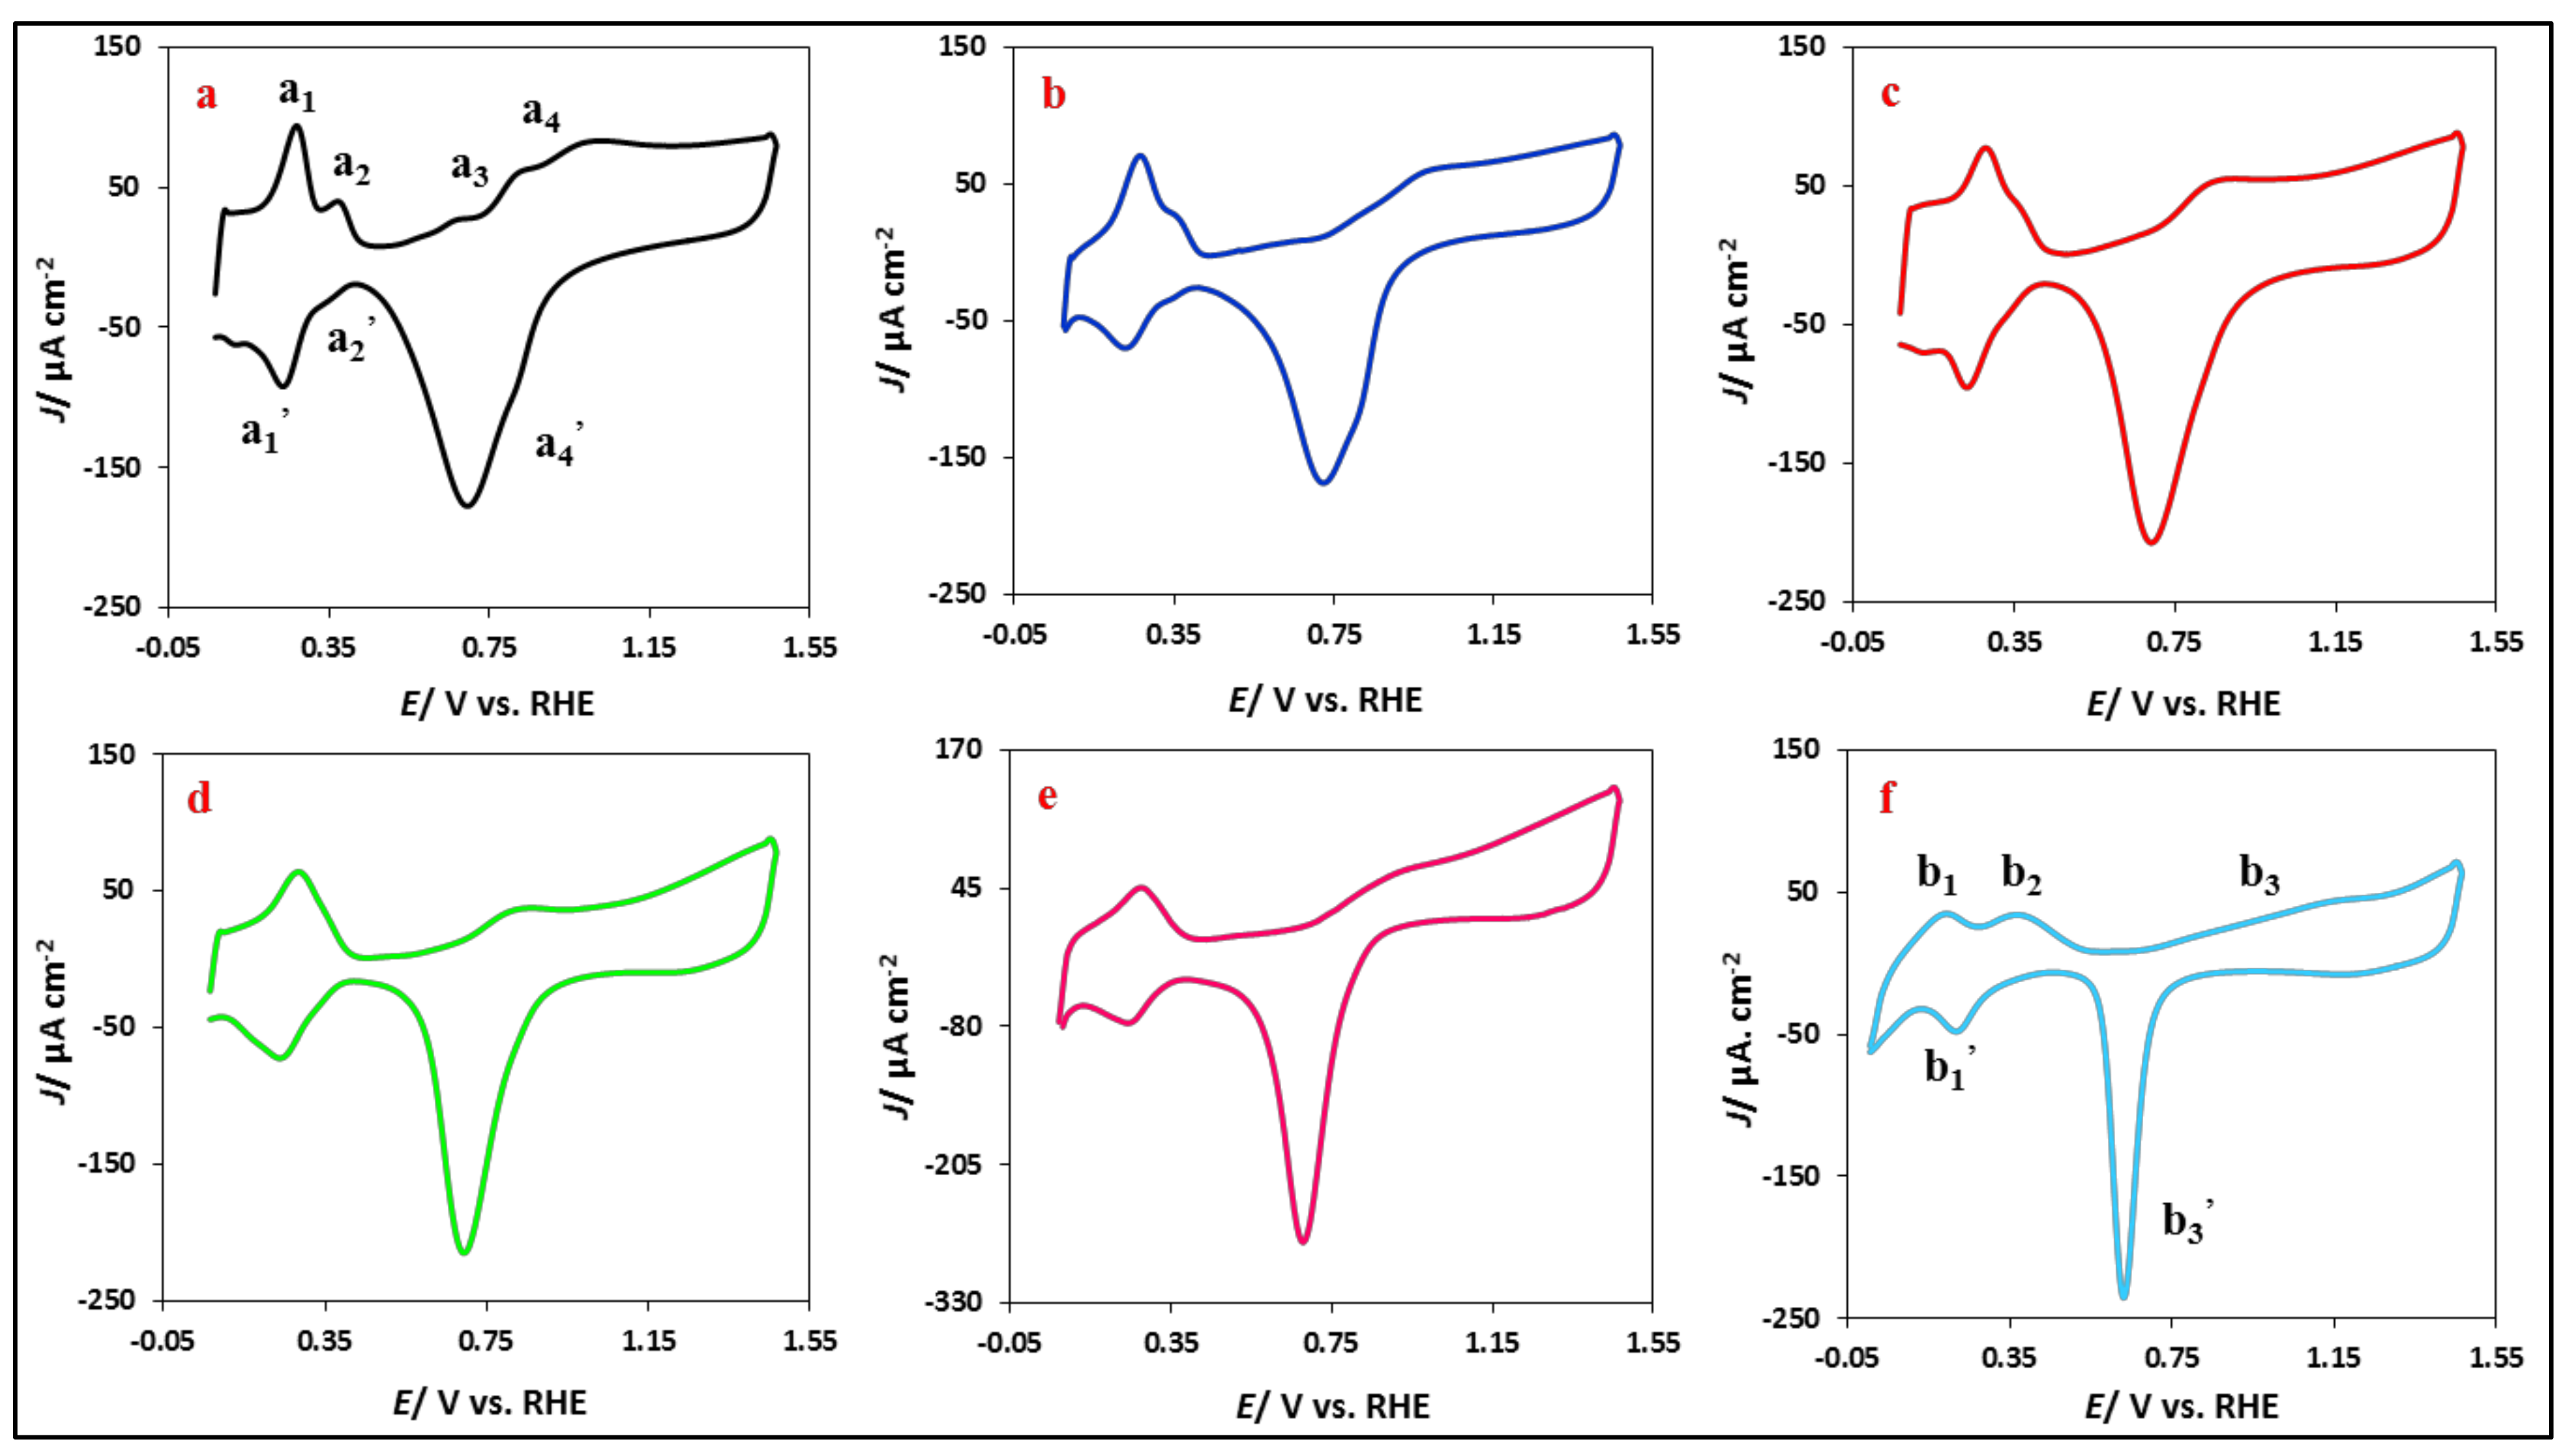
The electrochemical characterization of the nanoparticles was carried out by cyclic voltammetry in a 0.1 M NaOH solution at a scan rate of 0.05 V s−1 (Figure 5a–f). The sharpness, good definition, and the symmetry of the adsorption states in all nanoparticles are clear evidence of the effective surface cleanliness [36,37,41,42,43,44]. The observed signals in the profiles correspond to hydrogen ad(b)sorption-desorption (Had(b)s-Hdes), OH adsorption (OHads), metal oxidation, and reduction processes. The position and definition of those signals depend on the ratio of Pt:Pd in the synthesized nanoparticles. For the pure Pt nanoparticles, the pairs of peaks in the positive potential sweep (a1,a2) and their symmetric pairs of peaks in the negative potential sweep (a1’,a2’) corresponds to the desorption and the adsorption of H on the surface of Pt nanoparticles, respectively [20,29,36]. On the other hand, the formation of Habs and Hads on the surface of Pd nanoparticles takes place in a single peak in the negative potential sweep (b1’), whereas the desorption of Habs and Hads split into two peaks (b1,b2) in the positive scan direction (Figure 5f) [45,46,47,48,49]. The OH adsorption, oxidation of Pt-OH to Pt-O, and reduction of PtO to Pt are associated with peaks a3, a4, and a4’, respectively, in Figure 5a. On Pd, the adsorption of OH is not well defined, and the process corresponding to the Pd oxidation/reduction processes are marked by peaks b3 and b3. The comparison between Figure 5a and f demonstrates the reduction of PtO (a4’) takes place at more positive potential than that of PdO (b3’) on the nanoparticles. The potential values of the Pt(Pd)O reduction peak of the synthesized nanoparticles have been compared in the 4th column of Table 3. This observation reveals a higher tendency towards surface oxidation for Pd than for Pt nanoparticles [50]. Although the reduction of metal oxide represents a sharp peak on the surface of Pd nanoparticles (Figure 5f), the reduction of metal oxide exhibits a broader peak at more positive potentials on the surface of Pt nanoparticles (Figure 5a). This process can be also understood from the comparison between values of width at half height of Pt(Pd)O reduction peak reported in the 3rd column of Table 3 [46,47,50]. The peak asymmetry of the oxidation/reduction reaction of the Pt and Pd surfaces clearly indicates that these are irreversible processes. Thus, in this potential region, the actual surface state depends on the scan direction. For the bimetallic nanoparticles, as seen in Figure 5, the profile changes according to the Pt:Pd ratio. Although a1 and a1’ peaks are entirely separate from the peaks of a2 and a2’ for the synthesized nanoparticles with Pt percentage above 80%, they merge in a single peak as the Pd ratio increases [33,37,51]. The potential of the metal oxide formation also shifts according to the composition [20,29,51,52].

3.2.2. Ethanol Electrooxidation: Potentiodynamic Measurements

The catalytic properties of Pt, Pt4Pd, Pt3Pd2, Pt2Pd3, PtPd4, and Pd for the EOR were analyzed by voltammetry in a 0.1M NaOH solution containing 0.1 M ethanol, as shown in Figure 6. The analysis of the profiles aims to address these four issues: (1) the comparison between the intrinsic activity of Pt and Pd nanoparticles towards the EOR (2); the influence of the interfacial electronic structures of PtPd nanoparticles on EOR activity; (3) the trend of synthesized nanoparticles for the deactivation; and (4) the identification of the intermediate species which are responsible for the electrocatalyst poisoning and the current diminution upon cycling.
The specific activities were calculated via the normalizing of the currents to the active surface area of the nanoparticles [46]. As it is seen in Figure 6, the peaks attributed to H ab(d)sorption/desorption are suppressed and two well-defined anodic peaks appear in the forward and backward scans. The disappearance of the hydrogen peaks is attributed to the adsorption of the resultant ethoxy species, such as (CH3CO)ads, which blocks the electroactive sites. The activity for the positive scan direction reaches a maximum at ca. 0.8 V and then decrease as potential increases. The downfall of the current density corresponds to the formation of the Pd and Pt oxide layers, which block the adsorption of the reactive species onto the catalyst surface and lead to a decrease in the electrocatalytic activity. At 1.2 V, the surface of the nanoparticles is completely covered with PdO or PtO, which is inactive for the EOR, and the current density at this potential coincides with that recorded in absence of ethanol. When the scan is reversed and PdO or PtO is reduced, the electrode recovers its activity. This phenomenon results in the appearance of a peak in the negative scan direction [20,29]. There is a hysteresis between the positive and negative scan directions. First, the peak intensity is lower in the negative scan direction. This diminution can be due to two different reasons: (i), the surface in the negative scan direction is still partially covered by PtO or PdO and/or (ii) the surface has been poisoned by the polymerization of the acetaldehyde (which is the result of the partial oxidation of ethanol) through the aldol condensation. On the other hand, at ca. 0.5 V, which is the onset of the EOR, currents in the negative scan direction are higher, which reveals that in the positive scan direction the surface may be blocked by some ethoxy adsorbed species, which have been oxidized at higher potentials. Regarding the evolution of the current densities with the PtPd ratio (Figure 6), PtPd binary catalysts exhibit considerable improvements over pure Pt and Pd [22,53]. In other words, the electrocatalytic activity of Pt nanoparticles improves by the incorporation of Pd on the nanoparticle and reaches a maximum at a Pt:Pd ratio of 60:40. Not only peak currents are higher but also the onset potential diminishes. After that ratio, the electrocatalytic activity of PtPd nanoparticles decreases. These results are in good agreement with the reports by other groups [20,53].
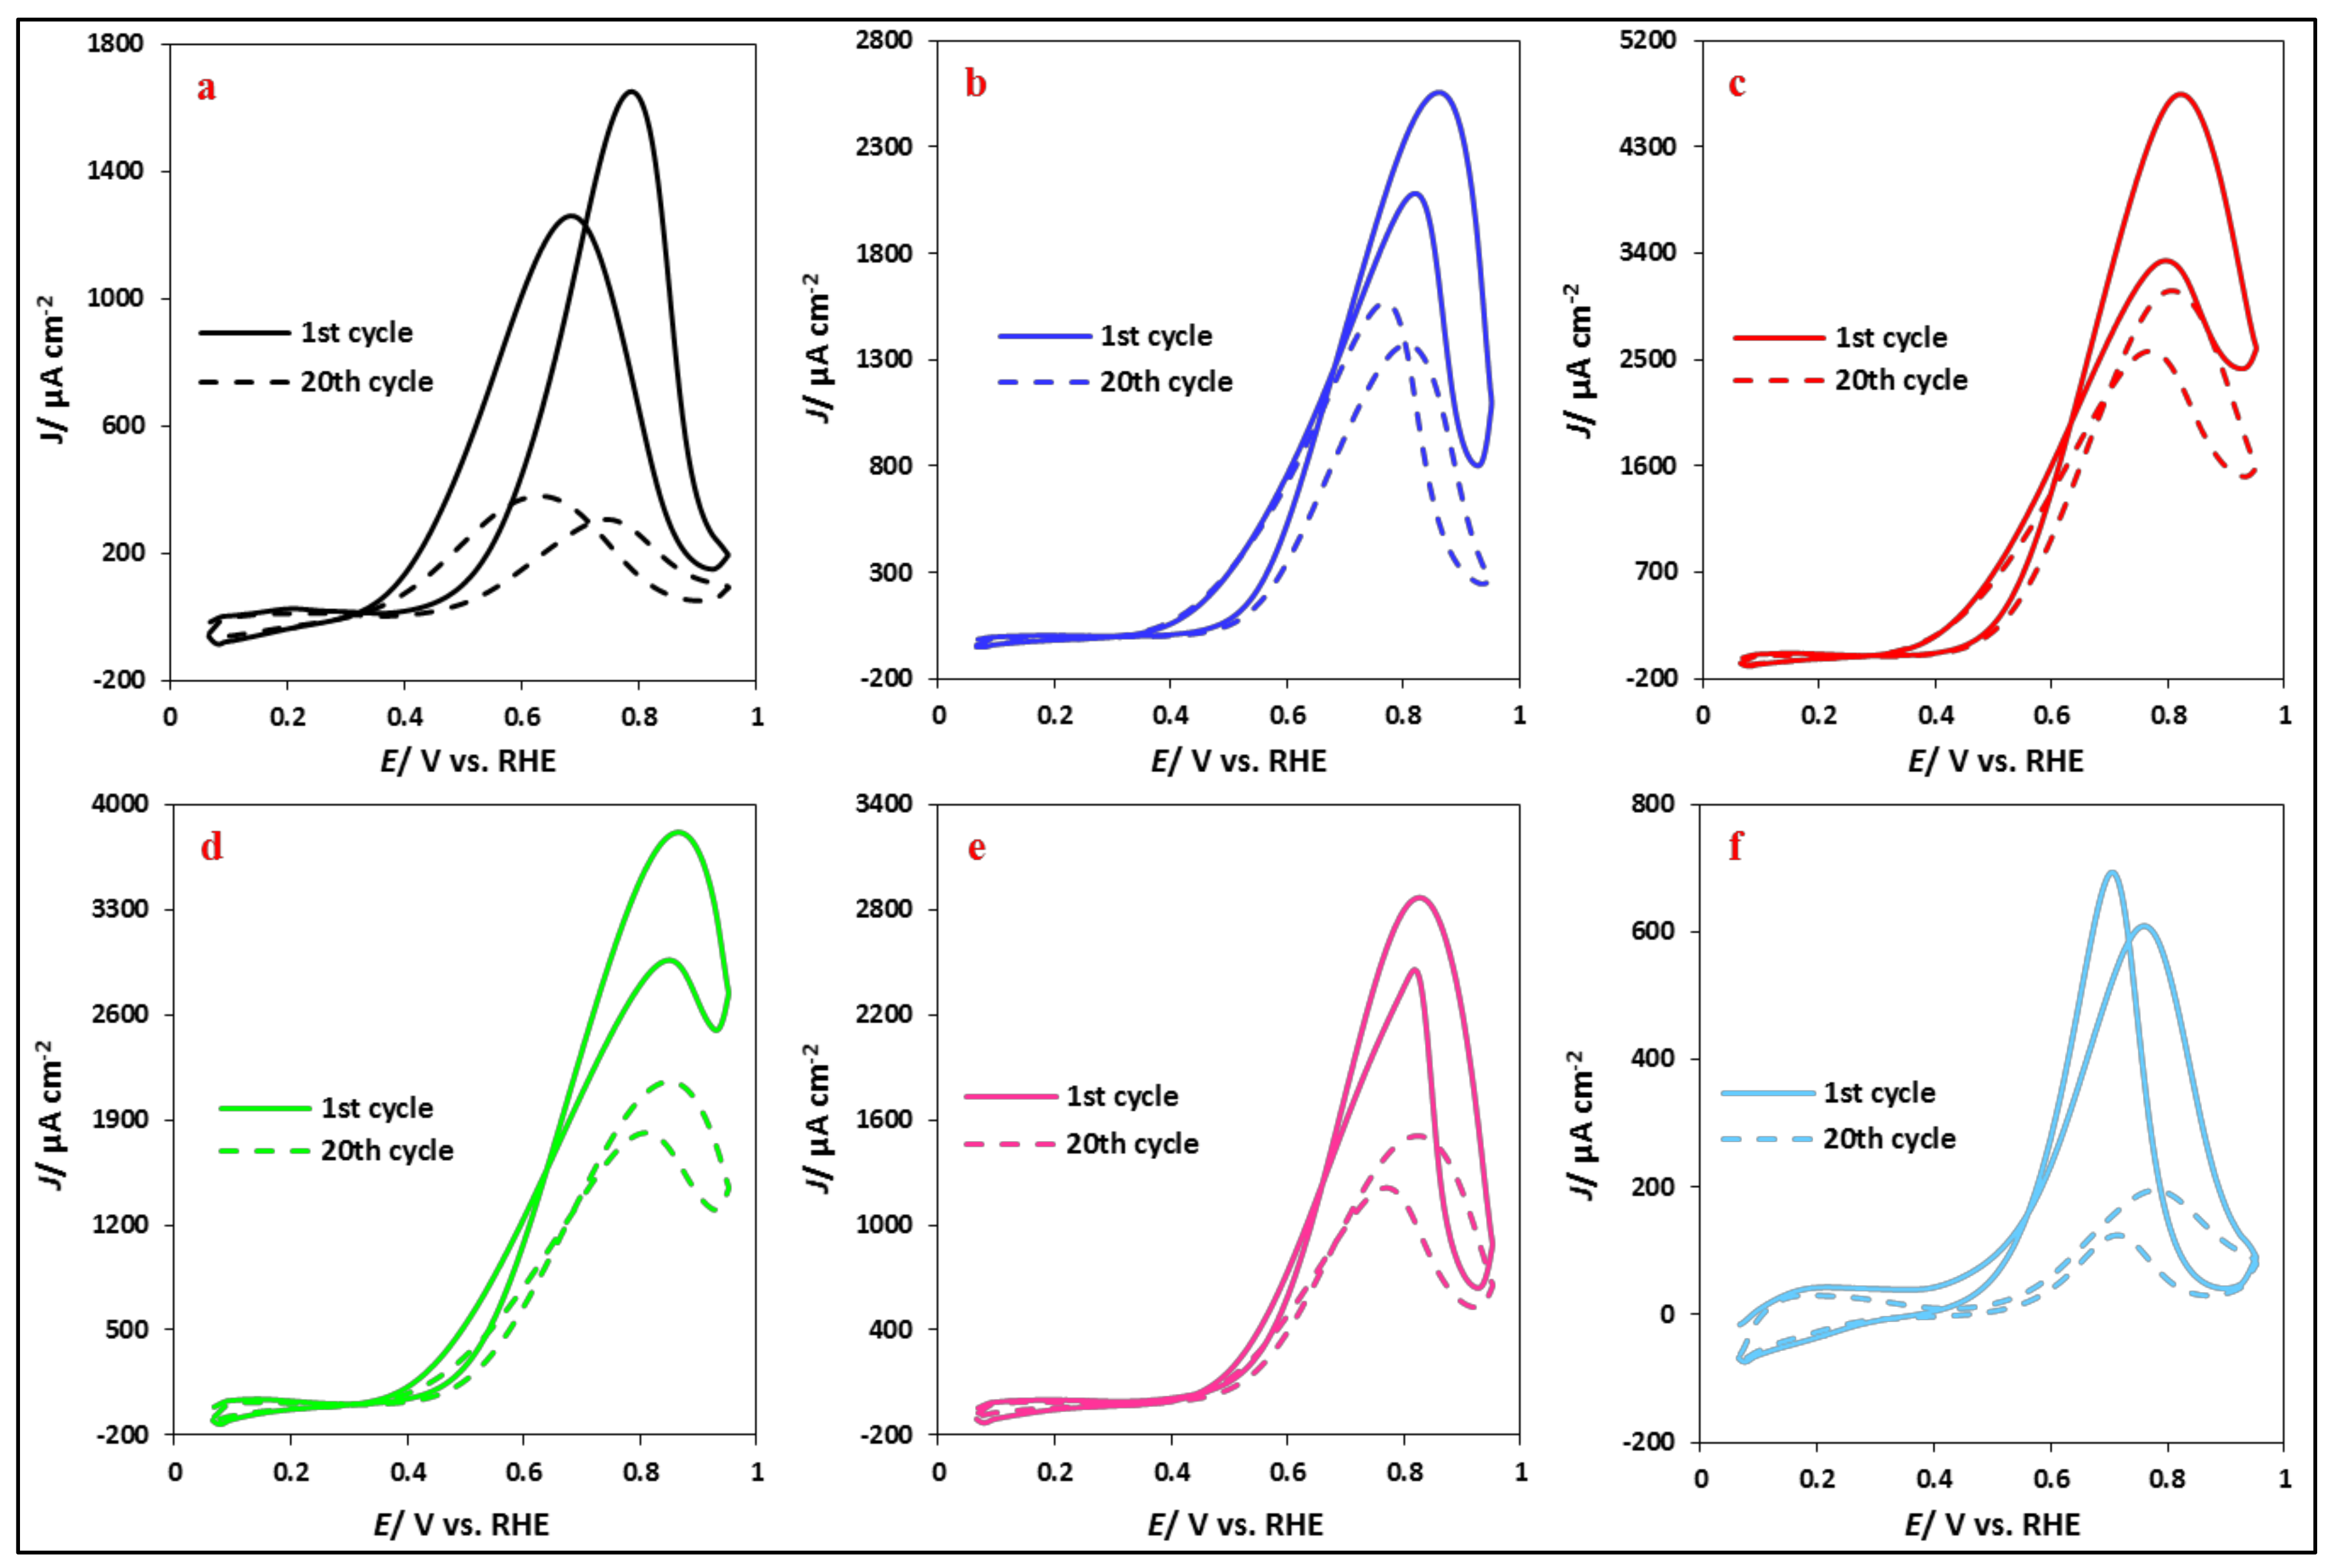
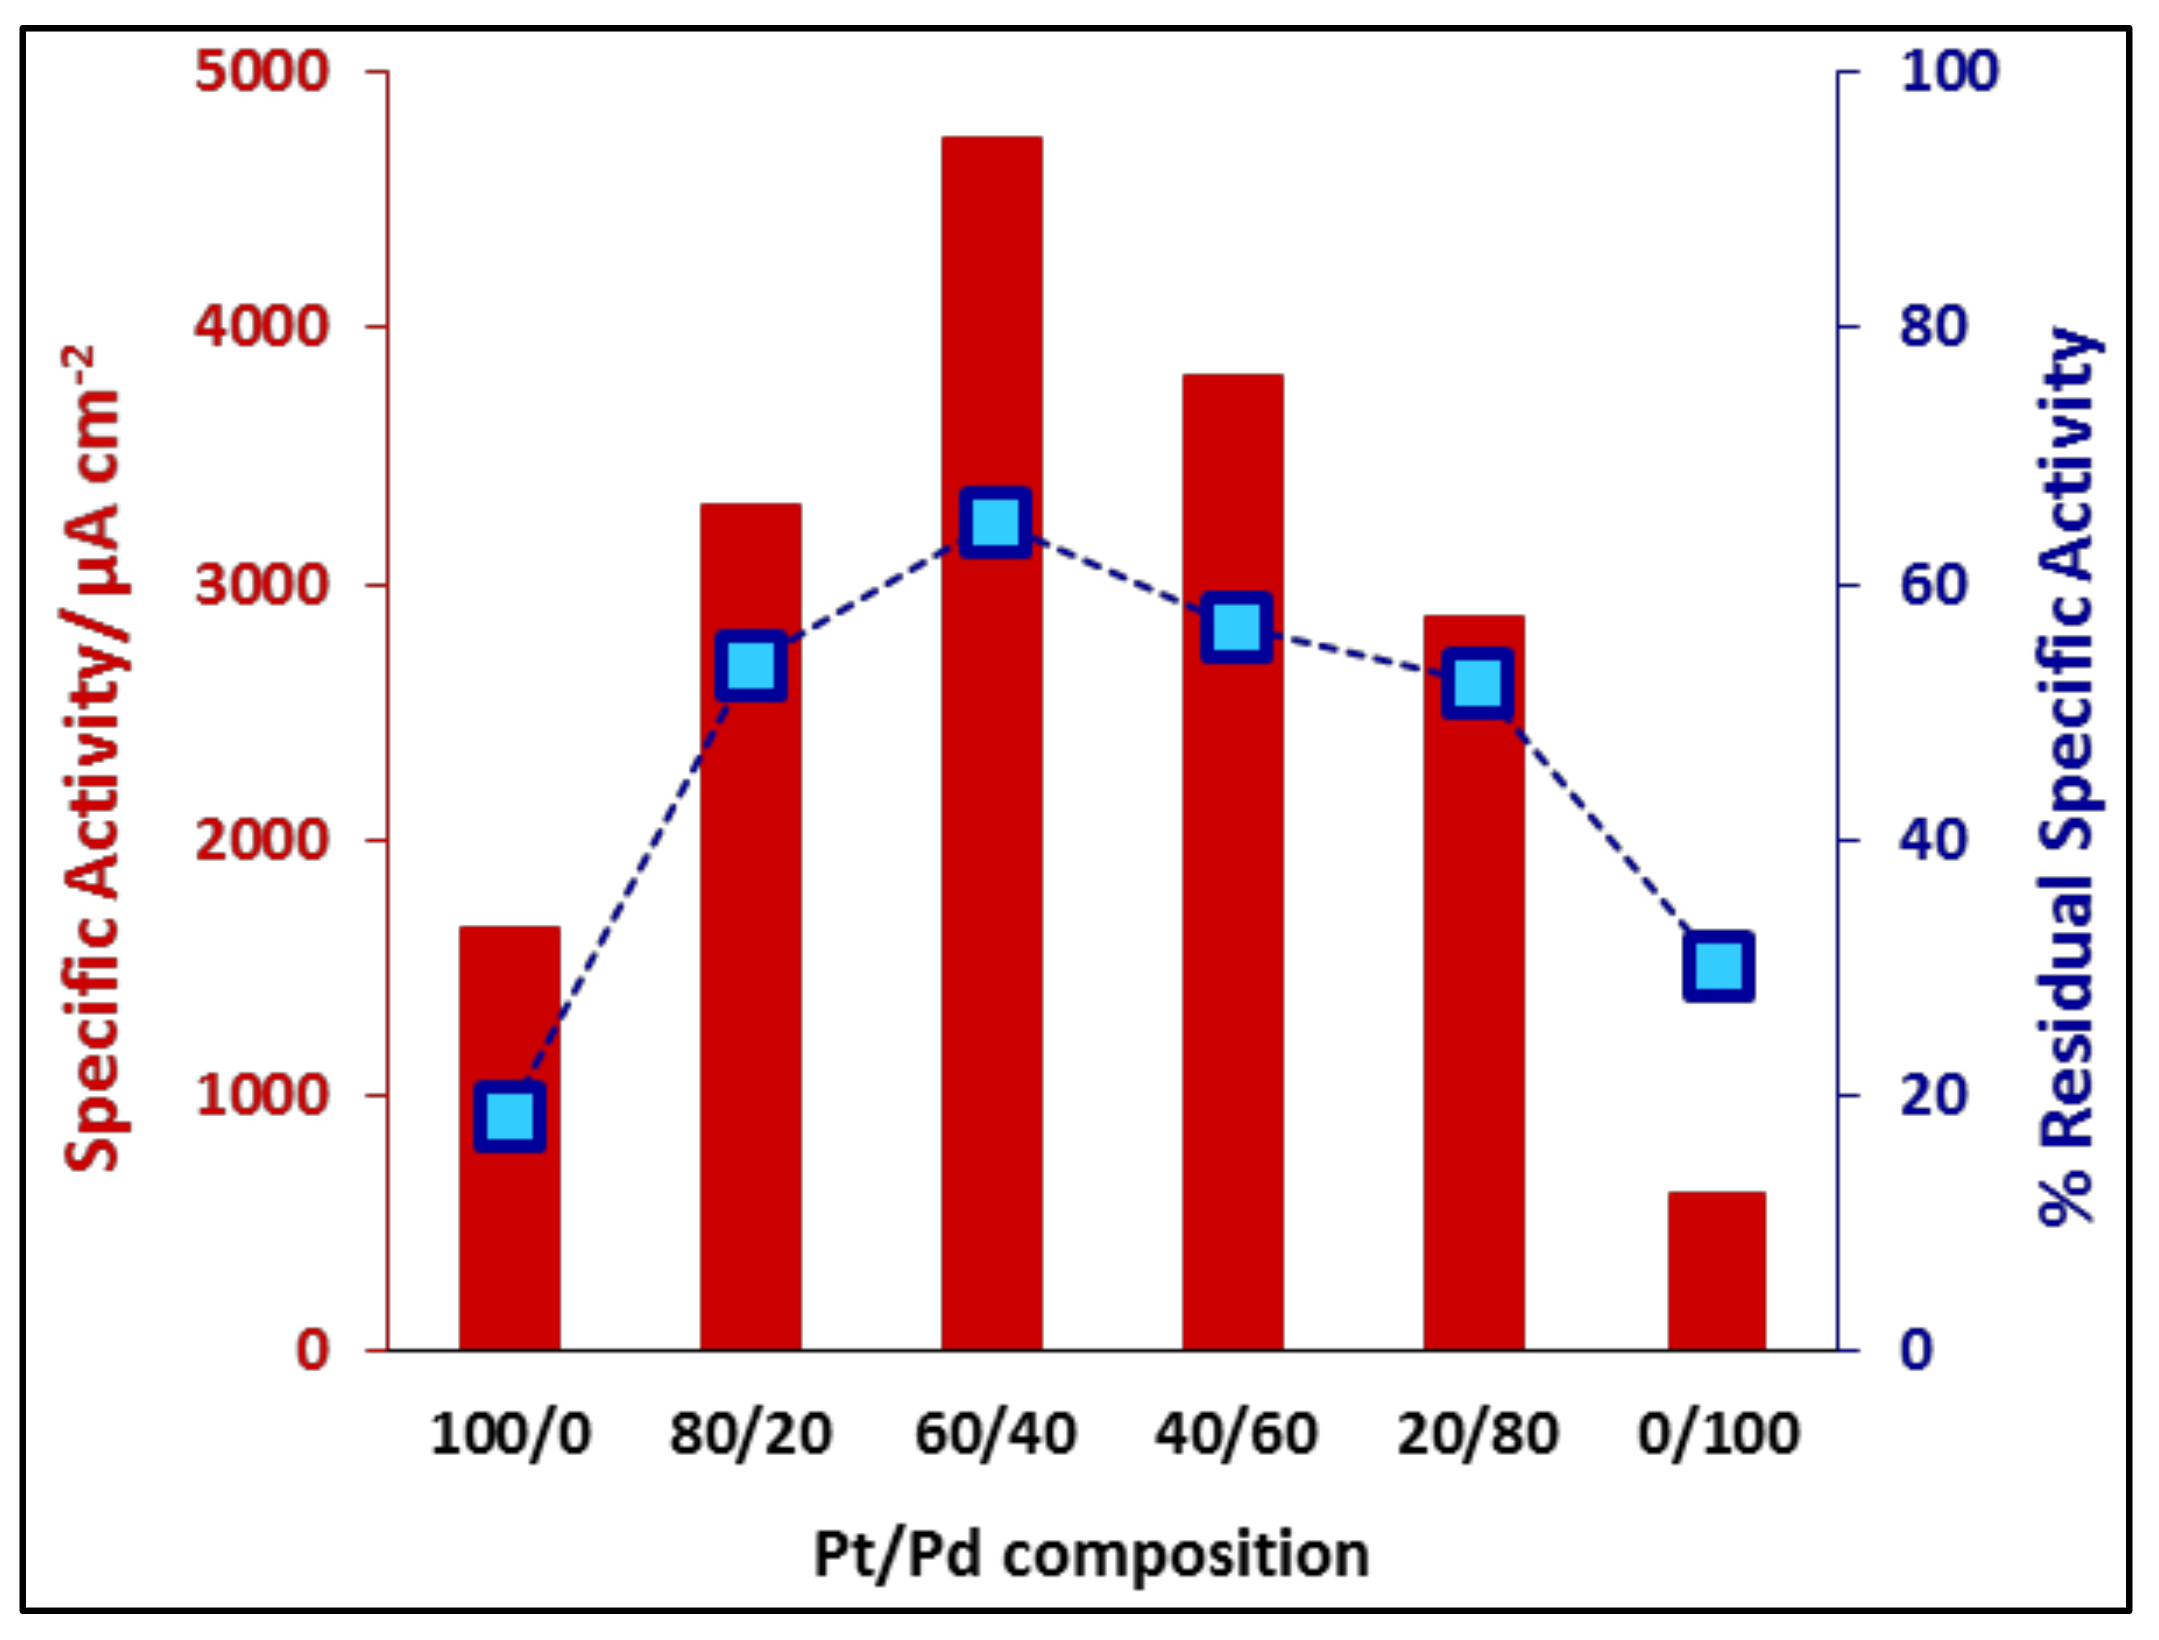
In the following, the stability of the electrocatalytic activity of the nanoparticles was assessed by comparing the currents recorded in the first voltammetric scan with those recorded after 20 scans (Figure 7). The residual specific activities increase from 18.4% for the Pt nanoparticles to 65% for the Pt3Pd2 nanoparticles, implying that these nanoparticles have the best poison resistance property. When the ratio of Pd on the nanoparticle composition exceeds 40%, the residual activity decreases. This trend is in agreement with that obtained for the catalytic activity in the first scan. The electrocatalytic activity and poison resistance properties of the synthesized nanoparticles obtained from Figure 6 and Figure 7 are summarized in Figure 8. From this figure, several conclusions can be extracted. First, pure Pt is more active than Pd for the oxidation of ethanol, although it shows a lower poison resistance. Since the decrease of the catalytic activity upon cycling is linked to the polymerization of acetaldehyde [19,20,54,55], a lower deactivation rate indicates a higher efficiency in the oxidation of acetaldehyde to acetate. This fact implies that Pt is more active in the first step in the formation of acetaldehyde, but the oxidation of acetaldehyde to acetate seems to be more facile on Pd. The further oxidation of acetaldehyde to acetate requires the transfer of an oxygen group. As shown in Figure 5, Pd oxide is formed at a lower potential than the Pt oxide. Since the previous step in the surface oxidation is the adsorption of OH, OH adsorption on Pd should take place also at a lower potential, probably just after the desorption of hydrogen. Thus, the higher amount of adsorbed OH on the surface facilitates the second step. The increase of the electrocatalytic activity and poison resistance with the incorporation of Pd on the Pt nanoparticles should be then connected to a bifunctional effect. Pt atoms are effective in the dehydrogenation step to yield CH3COads and then Pd surface atoms transfer the required oxygen group required to form acetate. This effect explains the higher currents measured in the first scan because the presence of Pd increases the effective number of electrons transferred in the oxidation and the higher poison resistance. For pure Pt nanoparticles, the main product is acetaldehyde, and the mean number of electrons is close to two. When Pd is added, the oxidation of acetaldehyde to acetate is facilitated which has two effects: (i) the mean number of transferred electrons increases with the concomitant current increase and (ii) the polymerization rate of acetaldehyde, which is responsible for the current diminution upon cycling, diminishes.

3.2.3. Ethanol Electrooxidation: Potentiostatic Measurements

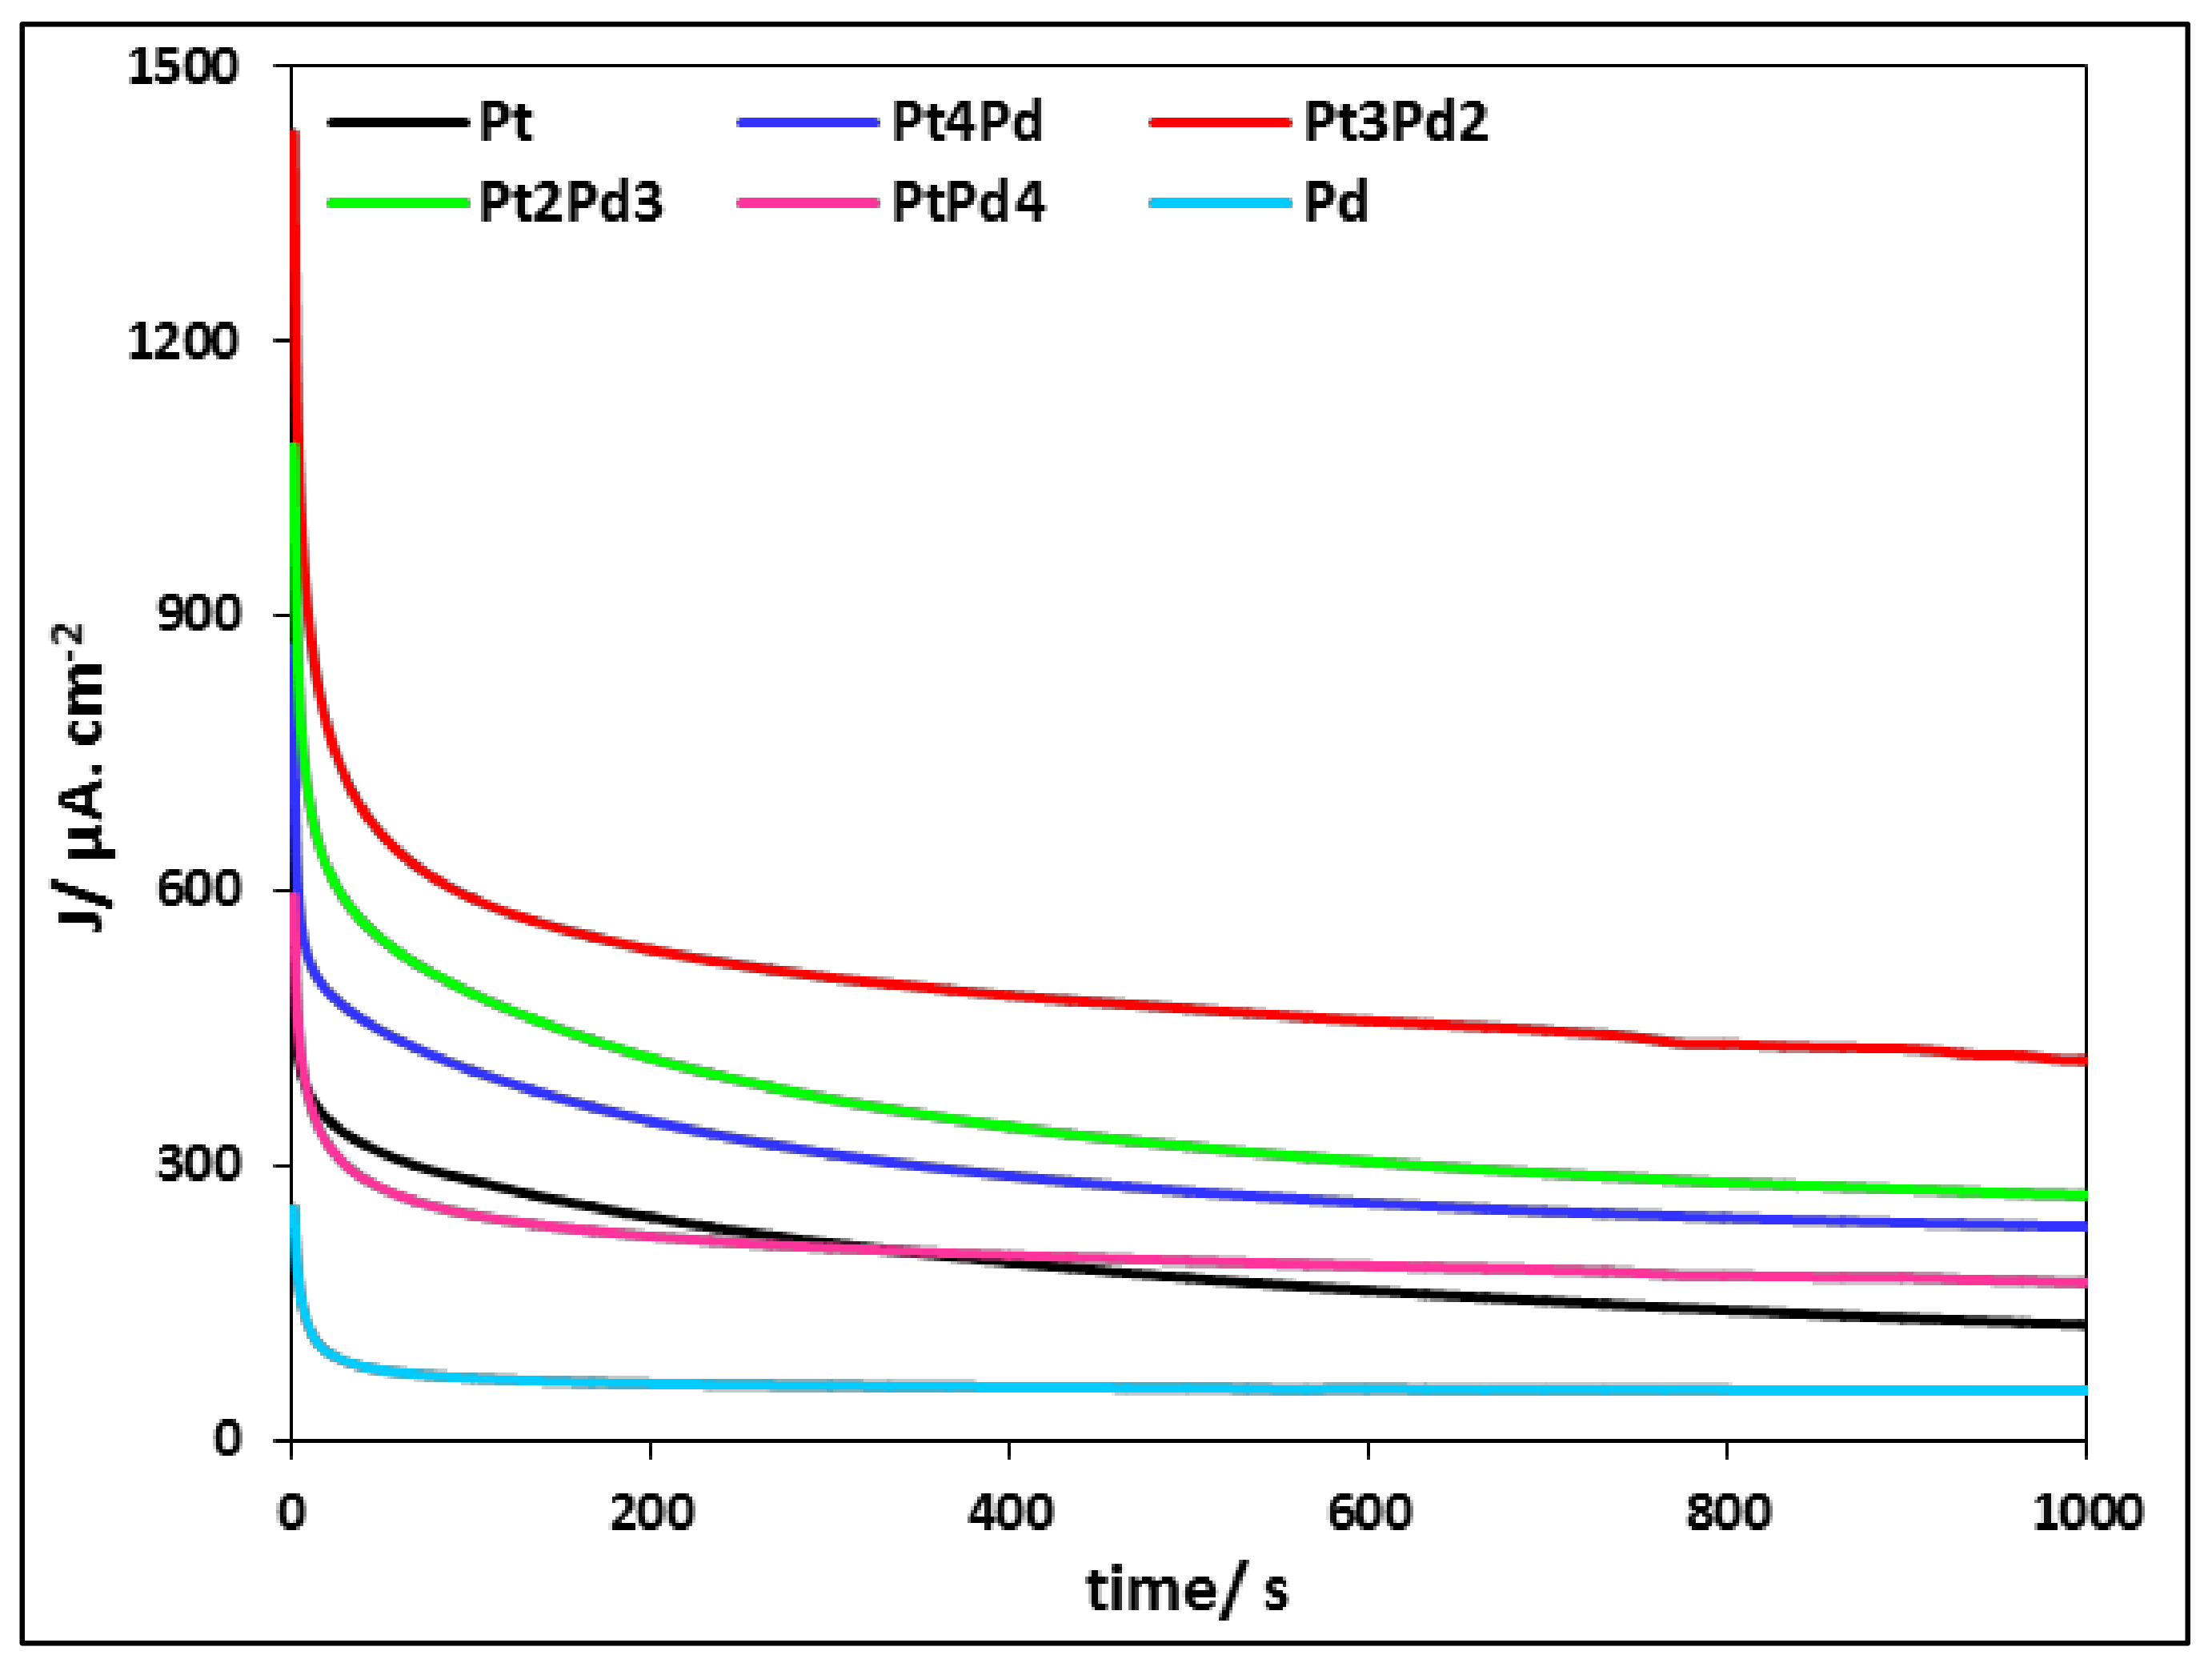
In order to consider the stability of mono and bimetallic Pt and Pd nanoparticles towards ethanol oxidation in the alkaline media, the chronoamperometric experiments were performed at a constant potential of 0.56 V vs. RHE. This potential was selected since the electrocatalytic oxidation of ethanol has been begun at this potential, but the current is not controlled by the ethanol diffusion, so that any diminution of the current cannot be attributed to this phenomenon [19,20]. Figure 9 shows the transients measured at 0.56 V for each nanoparticle sample for 1000 s. The general behavior of the transients shows a fast current decay during the first minute followed by a quasi-steady state in the middle region. Additionally, the reactivity trend follows the same behavior as that recorded in Figure 6 and Figure 7. The highest and lowest current densities during CA experiments are obtained for Pt3Pd2 and Pd nanoparticles, respectively. The highest ratio of the current at 1000 s to the initial current corresponds to the Pt3Pd2 nanoparticles. This result indicates that the general behavior obtained for the voltammetry is also applicable to the potentiostatic currents, that is, PtPd alloy acts as a bifunctional catalyst in which Pt sites are used to dehydrogenate ethanol to produce acetaldehyde, and Pd sites proved the oxygen group required to oxidize acetaldehyde to acetate.

4. Conclusions

In this study, mono and bimetallic Pt and Pd nanoparticles were synthesized and their electrocatalytic activity towards ethanol oxidation in the alkaline media was studied. In the behavior of the synthesized nanoparticles, the electrocatalytic activity, and poisoning resistance properties were analyzed. The results indicated that the highest electrocatalytic activity and poison resistance for the EOR in alkaline media is obtained for the Pt3Pd2 nanoparticles. The acetaldehyde–acetate route was in all cases the dominant path for ethanol oxidation in the alkaline media and the PtPd nanoparticles act as a bifunctional catalyst.

Author Contributions

Conceptualization and supervision, J.S.-G. and E.H.; methodology, M.A.K., J.S.-G. and E.H., formal analysis M.A.K., J.S.-G. and E.H.; investigation, S.J., M.A.K., and J.S.-G.; writing—original draft preparation, S.J. and M.A.K.; writing—review and editing, M.A.K.; J.S.-G. and E.H. All authors have read and agreed to the published version of the manuscript.

Funding

This research was funded by Ministerio de Ciencia e Innovación (Spain) grant number PID2019-105653GB-100), Generalitat Valenciana (Spain) grant number PROMETEO/2020/063, and the University of Zanjan Research Council.

Institutional Review Board Statement

Not applicable.

Informed Consent Statement

Not applicable.

Data Availability Statement

The data presented in this study are available on request from the corresponding author.

Conflicts of Interest

The authors declare no conflict of interest.

References

  1. Inci, M.; Türksoy, O. Review of fuel cells to grid interface: Configurations, technical challenges and trends. J. Clean. Prod. 2019, 213, 1353–1370. [Google Scholar] [CrossRef]
  2. Rana, M.; Patil, P.K.; Chhetri, M.; Dileep, K.; Datta, R.; Gautam, U.K. Pd-Pt alloys nanowires as support-less electrocatalyst with high synergistic enhancement in efficiency for methanol oxidation in acidic medium. J. Colloid Interface Sci. 2016, 463, 99–106. [Google Scholar] [CrossRef] [PubMed]
  3. Huang, L.; Zhang, X.; Wang, Q.; Han, Y.; Fang, Y.; Dong, S. Shape-Control of Pt-Ru nanocrystals: Tuning surface structure for enhanced electrocatalytic methanol oxidation. J. Am. Chem. Soc. 2018, 140, 1142–1147. [Google Scholar] [CrossRef] [PubMed]
  4. Ong, B.C.; Kamarudin, S.K.; Basri, S. Direct liquid fuel cells: A review. Int. J. Hydrog. Energy 2017, 42, 10142–10157. [Google Scholar] [CrossRef]
  5. Fadzillah, D.M.; Kamarudin, S.K.; Zainoodin, M.A.; Masdar, M.S. Critical challenges in the system development of direct alcohol fuel cells as portable power supplies: An overview. Int. J. Hydrog. Energy 2019, 44, 3031–3054. [Google Scholar] [CrossRef]
  6. Christensen, P.A.; Jones, S.W.M. An in situ FTIR study of ethanol oxidation at polycrystalline platinum in 0.1 M KOH at 25 and 50 °C. J. Phys. Chem. C 2014, 118, 29760–29769. [Google Scholar] [CrossRef]
  7. Jua, K.J.; Liu, L.; Feng, J.J.; Zhang, Q.L.; Wei, J.; Wang, A.J. Bio-Directed one-pot synthesis of Pt-Pd alloyed nanoflowers supported on reduced graphene oxide with enhanced catalytic activity for ethylene glycol oxidation. Electrochim. Acta 2016, 188, 696–703. [Google Scholar] [CrossRef]
  8. Qian, W.; Wilkinson, D.P.; Shen, J.; Wang, H.; Zhang, J. Architecture for portable direct liquid fuel cells. J. Power Sources 2006, 154, 202–213. [Google Scholar] [CrossRef]
  9. Li, N.H.; Sun, S.G. In situ FTIR spectroscopic studies of the electrooxidation of C4 alcohol on a platinum electrode in acid solutions Part, I. Reaction mechanism of 1-butanol oxidation. J. Electroanal. Chem. 1997, 436, 65–72. [Google Scholar]
  10. Jin, Z.; Wang, Q.; Zheng, W.; Cui, X. Highly ordered periodic Au/TiO2 hetero-nanostructures for plasmon-induced enhancement of the activity and stability for ethanol electro-oxidation. ACS Appl. Mater. Interfaces 2016, 8, 5273–5279. [Google Scholar] [CrossRef]
  11. Kamyabi, M.A.; Mohammadian, H.; Jadali, S.; Moharramnezhad, M. Hydrothermal syntheses of NiO-GO nanocomposite on 3D nickel foam as a support for Pt nanoparticles and its superior electrocatalytic activity towards methanol oxidation. Electroanalysis 2019, 31, 1484–1493. [Google Scholar] [CrossRef]
  12. Kamyabi, M.A.; Nosratabad, E.T.; Jadali, S. A Pt-Polymer nanocomposite as the excellent electro-catalyst: Synthesis, characterization, and electrochemical behavior towards methanol oxidation in the alkaline media. Synth. Met. 2019, 255, 116110–116117. [Google Scholar] [CrossRef]
  13. Kamyabi, M.A.; Ebrahimi Qaratapeh, K.; Jadali, S.; Moharramnezhad, M. Decorating the carbon felt electrode with polymeric platinize nanocomposite: Characterization and electrocatalytic activity towards methanol oxidation reaction. J. Chem. Sci. 2019, 131, 1–9. [Google Scholar] [CrossRef] [Green Version]
  14. Kamyabi, M.A.; Jadali, S. A sponge like Pd arrays on Ni foam substrate: Highly active non-platinum electrocatalyst for methanol oxidation in alkaline media. Mater. Chem. Phys. 2021, 257, 123626. [Google Scholar] [CrossRef]
  15. Chumillas, S.; Busó-Rogero, C.; Solla-Gullón, J.; Vidal-Iglesias, F.J.; Herrero, E.; Feliu, J.M. Size and diffusion effects on the oxidation of formic acid and ethanol on platinum nanoparticles. Electrochem. Commun. 2011, 13, 1194–1197. [Google Scholar] [CrossRef]
  16. Kowal, A.; Li, M.; Shao, M.; Sasaki, K.; Vukmirovic, M.B.; Zhang, J.; Marinkovic, N.S.; Liu, P.; Frenkel, A.I.; Adzic, R.R. Ternary Pt/Rh/SnO2 electrocatalysts for oxidizing ethanol to CO2. Nat. Mater. 2009, 8, 325–330. [Google Scholar] [CrossRef] [Green Version]
  17. Li, M.; Zhou, W.P.; Marinkovic, N.S.; Sasaki, K.; Adzic, R.R. The role of rhodium and tin oxide in the platinum-based electrocatalysts for ethanol oxidation to CO2. Electrochim. Acta 2013, 104, 454–461. [Google Scholar] [CrossRef]
  18. Figueiredo, M.C.; Santasalo-Aarnio, A.; Vidal-Iglesias, F.J.; Solla-Gullón, J.; Feliu, J.M.; Kontturi, K.; Kallio, T. Tailoring properties of platinum supported catalysts by irreversible adsorbed adatoms toward ethanol oxidation for direct ethanol fuel cells. Appl. Catal. B Environ. 2013, 140–141, 378–385. [Google Scholar] [CrossRef] [Green Version]
  19. Busó-Rogero, C.; Herrero, E.; Feliu, J.M. Ethanol oxidation on Pt single-crystal electrodes: Surface-structure effects in alkaline Medium. ChemPhysChem 2014, 15, 2019–2028. [Google Scholar] [CrossRef] [Green Version]
  20. Busó-Rogero, C.; Solla-Gullón, J.; Vidal-Iglesias, F.J.; Herrero, E.; Feliu, J.M. Oxidation of ethanol on platinum nanoparticles: Surface structure and aggregation effects in alkaline medium. J. Solid State Electrochem. 2016, 20, 1095–1106. [Google Scholar] [CrossRef] [Green Version]
  21. Liang, Z.X.; Zhao, T.S.; Xu, J.B.; Zhu, L.D. Mechanism study of the ethanol oxidation reaction on palladium in alkaline media. Electrochim. Acta 2009, 54, 2203–2208. [Google Scholar] [CrossRef]
  22. Cheng, Y.; Guo, M.; Yu, Y.; Zhai, M.; Guo, R.; Hu, J. Fabrication of coral-like Pd based porous MnO2 nanosheet arrays on nickel foam for methanol electrooxidation. Ind. Eng. Chem. Res. 2018, 57, 10893–10904. [Google Scholar] [CrossRef]
  23. Wang, J.; Cheng, N.; Banis, M.N.; Xiao, B.; Riese, A.; Sun, X. Comparative study to understand the intrinsic properties of Pt and Pd catalysts for methanol and ethanol oxidation in alkaline media. Electrochim. Acta 2015, 185, 267–275. [Google Scholar] [CrossRef]
  24. Yang, X.; Yang, Q.; Xu, J.; Lee, C.S. Bimetallic PtPd nanoparticles on nafion–graphene film as catalyst for ethanol electro-oxidation. J. Mater. Chem. 2012, 22, 8057–8062. [Google Scholar] [CrossRef]
  25. Ren, F.; Wang, H.; Zhai, C.; Zhu, M.; Yue, R.; Du, Y.; Yang, P.; Xu, J.; Lu, W. Clean method for the synthesis of reduced graphene oxide-supported PtPd alloys with high electrocatalytic activity for ethanol oxidation in alkaline medium. ACS Appl. Mater. Interfaces 2014, 6, 3607–3614. [Google Scholar] [CrossRef]
  26. Chen, X.; Cai, Z.; Chen, X.; Oyama, M. Green synthesis of graphene-PtPd alloy nanoparticles with high electrocatalytic performance for ethanol oxidation. J. Mater. Chem. A 2014, 2, 315–320. [Google Scholar] [CrossRef]
  27. Li, S.S.; Zheng, J.N.; Ma, X.; Hu, Y.Y.; Wang, A.J.; Chen, J.R.; Feng, J.J. Facile synthesis of hierarchical dendritic PtPd nanogarlands supported on reduced graphene oxide with enhanced electrocatalytic properties. Nanoscale 2014, 6, 5708–5713. [Google Scholar] [CrossRef]
  28. Yang, G.; Zhou, Y.; Pan, H.B.; Zhu, C.; Fu, S.; Wai, C.M.; Du, D.; Zhu, J.J.; Lin, Y. Ultrasonic-assisted synthesis of Pd-Pt/carbon nanotubes nanocomposites for green enhanced electro-oxidation of ethanol and methanol in alkaline medium. Ultrason. Sonochem. 2016, 28, 192–198. [Google Scholar] [CrossRef] [Green Version]
  29. Fan, J.; Qi, K.; Zhang, L.; Zhang, H.; Yu, S.; Cui, X. Engineering Pt/Pd interfacial electronic structures for highly efficient hydrogen evolution and alcohol oxidation. ACS Appl. Mater. Interfaces 2017, 9, 18008–18014. [Google Scholar] [CrossRef]
  30. Huang, Z.; Zhou, H.; Chang, Y.; Fu, C.; Zeng, F.; Kuang, Y. Improved catalytic performance of Pd nanowires for ethanol oxidation by monolayer of Pt. Chem. Phys. Lett. 2013, 585, 128–132. [Google Scholar] [CrossRef]
  31. Zhang, Q.; Chen, T.; Jiang, R.; Jiang, F. Comparison of electrocatalytic activity of Pt1-xPdx/C catalysts for ethanol electro-oxidation in acidic and alkaline media. RSC Adv. 2020, 10, 10134–10143. [Google Scholar] [CrossRef] [Green Version]
  32. Luo, W.; Zhou, H.; Fu, C.; Huang, Z.; Gao, N.; Kuang, Y. Preparation and characterization of porous sponge-like Pd@Pt nanotubes with high catalytic activity for ethanol oxidation. Mater. Lett. 2016, 173, 43–46. [Google Scholar] [CrossRef]
  33. Solla-Gullón, J.; Rodes, A.; Montiel, V.; Aldaz, A.; Clavilier, J. Electrochemical characterisation of platinum/palladium nanoparticles prepared in a water-in-oil microemulsion. J. Electroanal. Chem. 2003, 554–555, 273–284. [Google Scholar] [CrossRef]
  34. Solla-Gullón, J.; Montiel, V.; Aldaz, A.; Clavilier, J. Synthesis and electrochemical decontamination of platinum-palladium nanoparticles prepared by water-in-oil microemulsion. J. Electrochem. Soc. 2003, 150, E104–E109. [Google Scholar] [CrossRef]
  35. Vidal-Iglesias, F.J.; Solla-Gullon, J.; Montiel, V.; Feliu, J.M.; Aldaz, A. Screening of electrocatalysts for direct ammonia fuel cell: Ammonia oxidation on PtMe (Me: Ir, Rh, Pd, Ru) and preferentially oriented Pt(1 0 0) nanoparticles. J. Power Sources 2007, 171, 448–456. [Google Scholar] [CrossRef]
  36. Vidal-Iglesias, F.J.; Aran-Ais, R.M.; Solla-Gullo, J.; Herrero, E.; Feliu, J.M. Electrochemical characterization of shape-controlled Pt nanoparticles in different supporting electrolytes. ACS Catal. 2012, 2, 901–910. [Google Scholar] [CrossRef] [Green Version]
  37. Solla-Gullón, J.; Vidal-Iglesias, F.J.; Montiel, V.; Aldaz, A. Electrochemical characterization of platinum-ruthenium nanoparticles prepared by water-in-oil microemulsion. Electrochim. Acta 2004, 49, 5079–5088. [Google Scholar] [CrossRef]
  38. Zhang, Y.; Zhao, L.; Walton, J.; Liu, Z.; Tang, Z. Facile fabrication of PtPd alloyed worm-like nanoparticles for electrocatalytic reduction of oxygen. Int. J. Hydrog. Energy 2017, 42, 17112–17121. [Google Scholar] [CrossRef]
  39. Yang, Y.; Luo, L.M.; Guo, Y.F.; Dai, Z.X.; Zhang, R.H.; Sun, C.; Zhou, X.W. In situ synthesis of PtPd bimetallic nanocatalysts supported on graphene nanosheets for methanol oxidation using triblock copolymer as reducer and stabilizer. J. Electroanal. Chem. 2016, 783, 132–139. [Google Scholar] [CrossRef]
  40. Xue, Q.; Bai, J.; Han, C.; Chen, P.; Jiang, J.X.; Chen, Y. Au nanowires@Pd-polyethylenimine nanohybrids as highly active and methanol-tolerant electrocatalysts toward oxygen reduction reaction in alkaline media. ACS Catal. 2018, 8, 11287–11295. [Google Scholar] [CrossRef]
  41. Farias, M.J.S.; Vidal-Iglesias, F.J.; Solla-Gullón, J.; Herrero, E.; Feliu, J.M. On the behavior of CO oxidation on shape-controlled Pt nanoparticles in alkaline medium. J. Electroanal. Chem. 2014, 716, 16–22. [Google Scholar] [CrossRef] [Green Version]
  42. Montiel, M.A.; Vidal-Iglesias, F.J.; Montiel, V.; Solla-Gullón, J. Electrocatalysis on shape-controlled metal nanoparticles: Progress in surface cleaning methodologies. Curr. Opin. Electrochem. 2017, 1, 34–39. [Google Scholar] [CrossRef] [Green Version]
  43. Solla-Gullón, J.; Montiel, V.; Aldaz, A.; Clavilier, J. Electrochemical and electrocatalytic behaviour of platinum-palladium nanoparticle alloys. Electrochem. Commun. 2002, 4, 716–721. [Google Scholar] [CrossRef]
  44. Solla-Gullón, J.; Montiel, V.; Aldaz, A.; Clavilier, J. Electrochemical characterisation of platinum nanoparticles prepared by microemulsion: How to clean them without loss of crystalline surface structure. J. Electroanal. Chem. 2000, 491, 69–77. [Google Scholar] [CrossRef]
  45. Guerin, S.; Attard, G.S. Electrochemical behavior of electrodeposited nanostructured palladium + platinum films in 2 M H2SO4. Electrochem. Commun. 2001, 3, 544–548. [Google Scholar] [CrossRef]
  46. Alexeyeva, N.; Sarapuu, A.; Tammeveski, K.; Vidal-Iglesias, F.J.; Solla-Gullón, J.; Feliu, J.M. Electroreduction of oxygen on Vulcan carbon supported Pd nanoparticles and Pd–M nanoalloys in acid and alkaline solutions. Electrochim. Acta 2011, 56, 6702–6708. [Google Scholar] [CrossRef]
  47. Erikson, H.; Sarapuu, A.; Alexeyeva, N.; Tammeveski, K.; Solla-Gullón, J.; Feliu, J.M. Electrochemical reduction of oxygen on palladium nanocubes in acid and alkaline solutions. Electrochim. Acta 2012, 59, 329–335. [Google Scholar] [CrossRef]
  48. Pandey, R.K.; Lakshminarayanan, V. Electro-Oxidation of formic acid, methanol, and ethanol on electrodeposited Pd-polyaniline nanofiber films in acidic and alkaline medium. J. Phys. Chem. C 2009, 113, 21596–21603. [Google Scholar] [CrossRef]
  49. Jiang, R.; Tran, D.T.; McClure, J.P.; Chu, D. A class of (Pd-Ni-P) electrocatalysts for the ethanol oxidation reaction in alkaline media. ACS Catal. 2014, 4, 2577–2586. [Google Scholar] [CrossRef]
  50. Chen, Z.; He, Y.C.; Chen, J.H.; Fu, X.Z.; Sun, R.; Chen, Y.X.; Wong, C.P. PdCu alloy flower-like nanocages with high electrocatalytic performance for methanol oxidation. J. Phys. Chem. C 2018, 122, 8976–8983. [Google Scholar] [CrossRef]
  51. Lin, Y.; Tian, N.; Xiao, C.; Sheng, T.; Li, G.; Zhang, F.; Ye, J.; Xu, B.; Zhou, Z.; Sun, S. Effects of atom arrangement and thickness of Pt atomic layers on Pd nanocrystals for electrocatalysis. Electrochim. Acta 2018, 271, 519–525. [Google Scholar] [CrossRef]
  52. Ma, L.; Chu, D.; Chen, R. Comparison of ethanol electro-oxidation on Pt/C and Pd/C catalysts in alkaline media. Int. J. Hydrog. Energy 2012, 37, 11185–11194. [Google Scholar] [CrossRef]
  53. Zhang, H.; Xu, L.; Tian, Y.; Jiao, A.; Li, S.; Liu, X.; Chen, M.; Chen, F. Convenient synthesis of 3D fluffy PtPd nanocorals loaded on 2D h-BN supports as highly efficient and stable electrocatalysts for alcohol oxidation reaction. ACS Omega 2019, 4, 11163–11172. [Google Scholar] [CrossRef] [PubMed]
  54. Buso-Rogero, C.; Brimaud, S.; Solla-Gullon, J.; Vidal-Iglesias, F.J.; Herrero, E.; Behm, J.R.; Feliu, J.M. Ethanol oxidation on shape-controlled platinum nanoparticles at different pHs: A combined in situ IR spectroscopy and online mass spectrometry study. J. Electroanal. Chem. 2015, 763, 116–124. [Google Scholar] [CrossRef] [Green Version]
  55. Busó-Rogero, C.; Solla-Gullón, J.; Vidal-Iglesias, F.J.; Herrero, E.; Feliu, J.M. Adatom modified shape-controlled platinum nanoparticles towards ethanol oxidation. Electrochim. Acta 2016, 196, 270–279. [Google Scholar] [CrossRef] [Green Version]
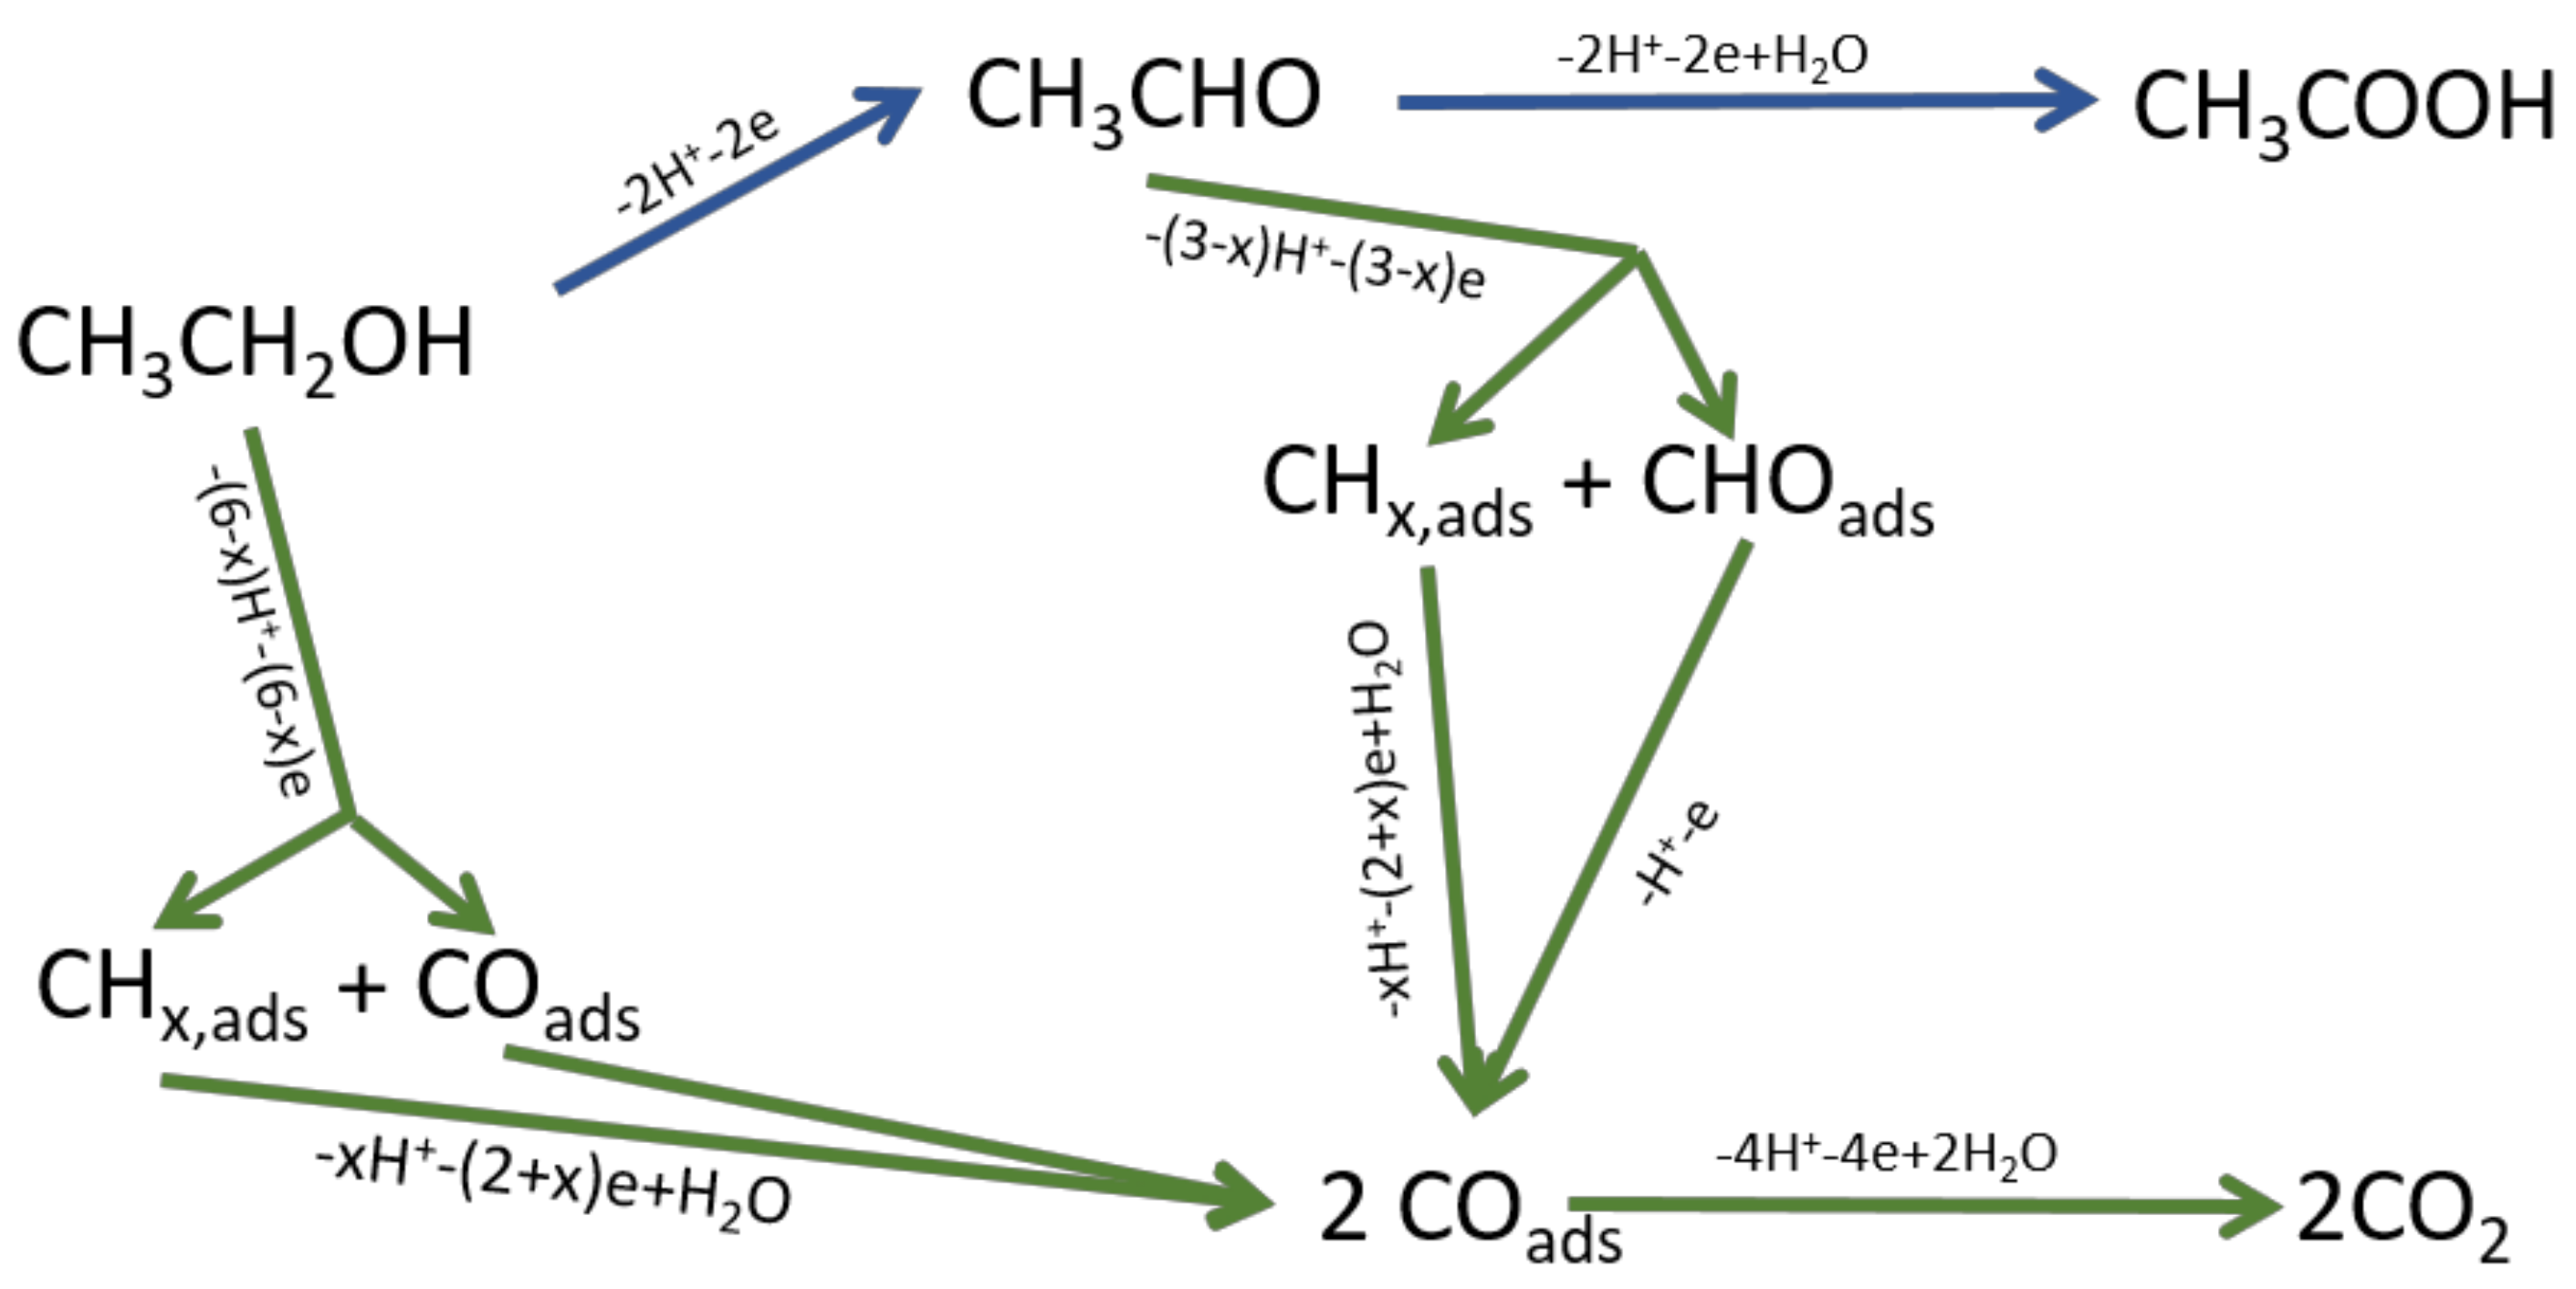
Figure 1. The parallel pathway of ethanol oxidation.
Applsci 11 01315 g001
Figure 2. Representative transmission electron microscopy (TEM) micrographs of Pt (a), Pt4Pd (b), Pt3Pd2 (c), Pt2Pd3 (d), PtPd4 (e), and Pd (f) nanoparticles.
Applsci 11 01315 g002
Figure 3. X-ray diffraction (WRD) patterns of the Pt, Pd, and PtPd nanoparticles employed in this work.
Applsci 11 01315 g003
Figure 4. XPS spectra of Pt 4f for Pt (a), Pt4Pd (c), PtPd4 (e), and Pd 3d for Pd (b), Pt4Pd (d), and PtPd4 (f).
Applsci 11 01315 g004
Figure 5. Voltammetric profile of the modified glassy carbon electrode (GCE) with (a) Pt, (b) Pt4Pd, (c) Pt3Pd2, (d) Pt2Pd3, (e) PtPd4, and (f) Pd nanoparticles in 0.1 M NaOH solution at the scan rate of 0.05 V s−1.
Applsci 11 01315 g005
Figure 6. Cyclic voltammograms of the synthesized nanoparticles in a 0.1 M NaOH solution containing 0.1 M EtOH at a scan rate of 0.05 V s−1.
Applsci 11 01315 g006
Figure 7. Comparison of the first and twentieth voltammograms for the oxidation of 0.1 M EtOH in 0.1 M NaOH solution for (a) Pt, (b) Pt4Pd, (c) Pt3Pd2, (d) Pt2Pd3, (e) PtPd4 and (f) Pd nanoparticles at a scan rate of 50 mV s−1.
Applsci 11 01315 g007
Figure 8. Evolution with the nanoparticle composition of the specific activity (red histogram) and residual specific activity after 20 consecutive cycles (blue line) for the EOR. Data obtained from Figure 6 and Figure 7.
Applsci 11 01315 g008
Figure 9. Chronoamperometric curves for the synthesized nanoparticles in 0.1 M NaOH solution containing 0.1 M EtOH at 0.56 V.
Applsci 11 01315 g009
Table 1. Mean particle size of the Pt, Pd, and PtPd nanoparticles employed in this work.
Nominal Atomic Composition Pt/PdParticle Size (TEM)/nmParticle Size (XRD)/nm
Pt
Pt4Pd
4.5 ± 0.7
3.5 ± 0.7
3.2 ± 0.4
3.8 ± 0.4
Pt3Pd23.4 ± 0.54.2 ± 0.4
Pt2Pt34.1 ± 0.64.9 ± 0.5
PtPd4
Pd
3.4 ± 0.5
1.6 ± 0.4
4 ± 0.4
2.7 ± 0.4
Table 2. Atomic composition of Pt/Pd nanoparticles obtained with the different analytical techniques.
Nominal Atomic
Composition Pt/Pd
Calculated with
AAS (Pd)
UV-Vis (Pt)
Calculated with EDXCalculated with
XPS
Pt (4f7/2)
Pd (3d5/2)
Pt4Pd79.6 ± 0.3/20.4 ± 0.382 ± 0.5/18 ± 0.575.3 ± 0.5/24.7 ± 0.5
Pt3Pd259.4 ± 0.3/40.6 ± 0.362 ± 0.5/38 ± 0.556.6 ± 0.5/43.4 ± 0.5
Pt2Pd340.6 ± 0.3/59.4 ± 0.340 ± 0.5/60 ± 0.538 ± 0.5/62 ± 0.5
PtPd417.8 ± 0.3/82.2 ± 0.320.6 ± 0.5/79.4 ± 0.521.4 ± 0.5/78.6 ± 0.5
Table 3. Values of the reduction peak of the Pt-Pd oxide for all the nanoparticles.
NanoparticlesQ/μCWidth at Half Heigh/VEpeak/V
Pt120.40.240.72
Pt4Pd83.50.240.72
Pt3Pd2305.50.220.70
Pt2Pd3377.80.150.70
PtPd464.10.150.70
Pd25.00.100.67
Publisher’s Note: MDPI stays neutral with regard to jurisdictional claims in published maps and institutional affiliations.