A Separation Method of Superimposed Gratings in Double-Projector Fringe Projection Profilometry Using a Color Camera

Abstract
:Featured Application
Abstract
1. Introduction
2. Materials and Methods
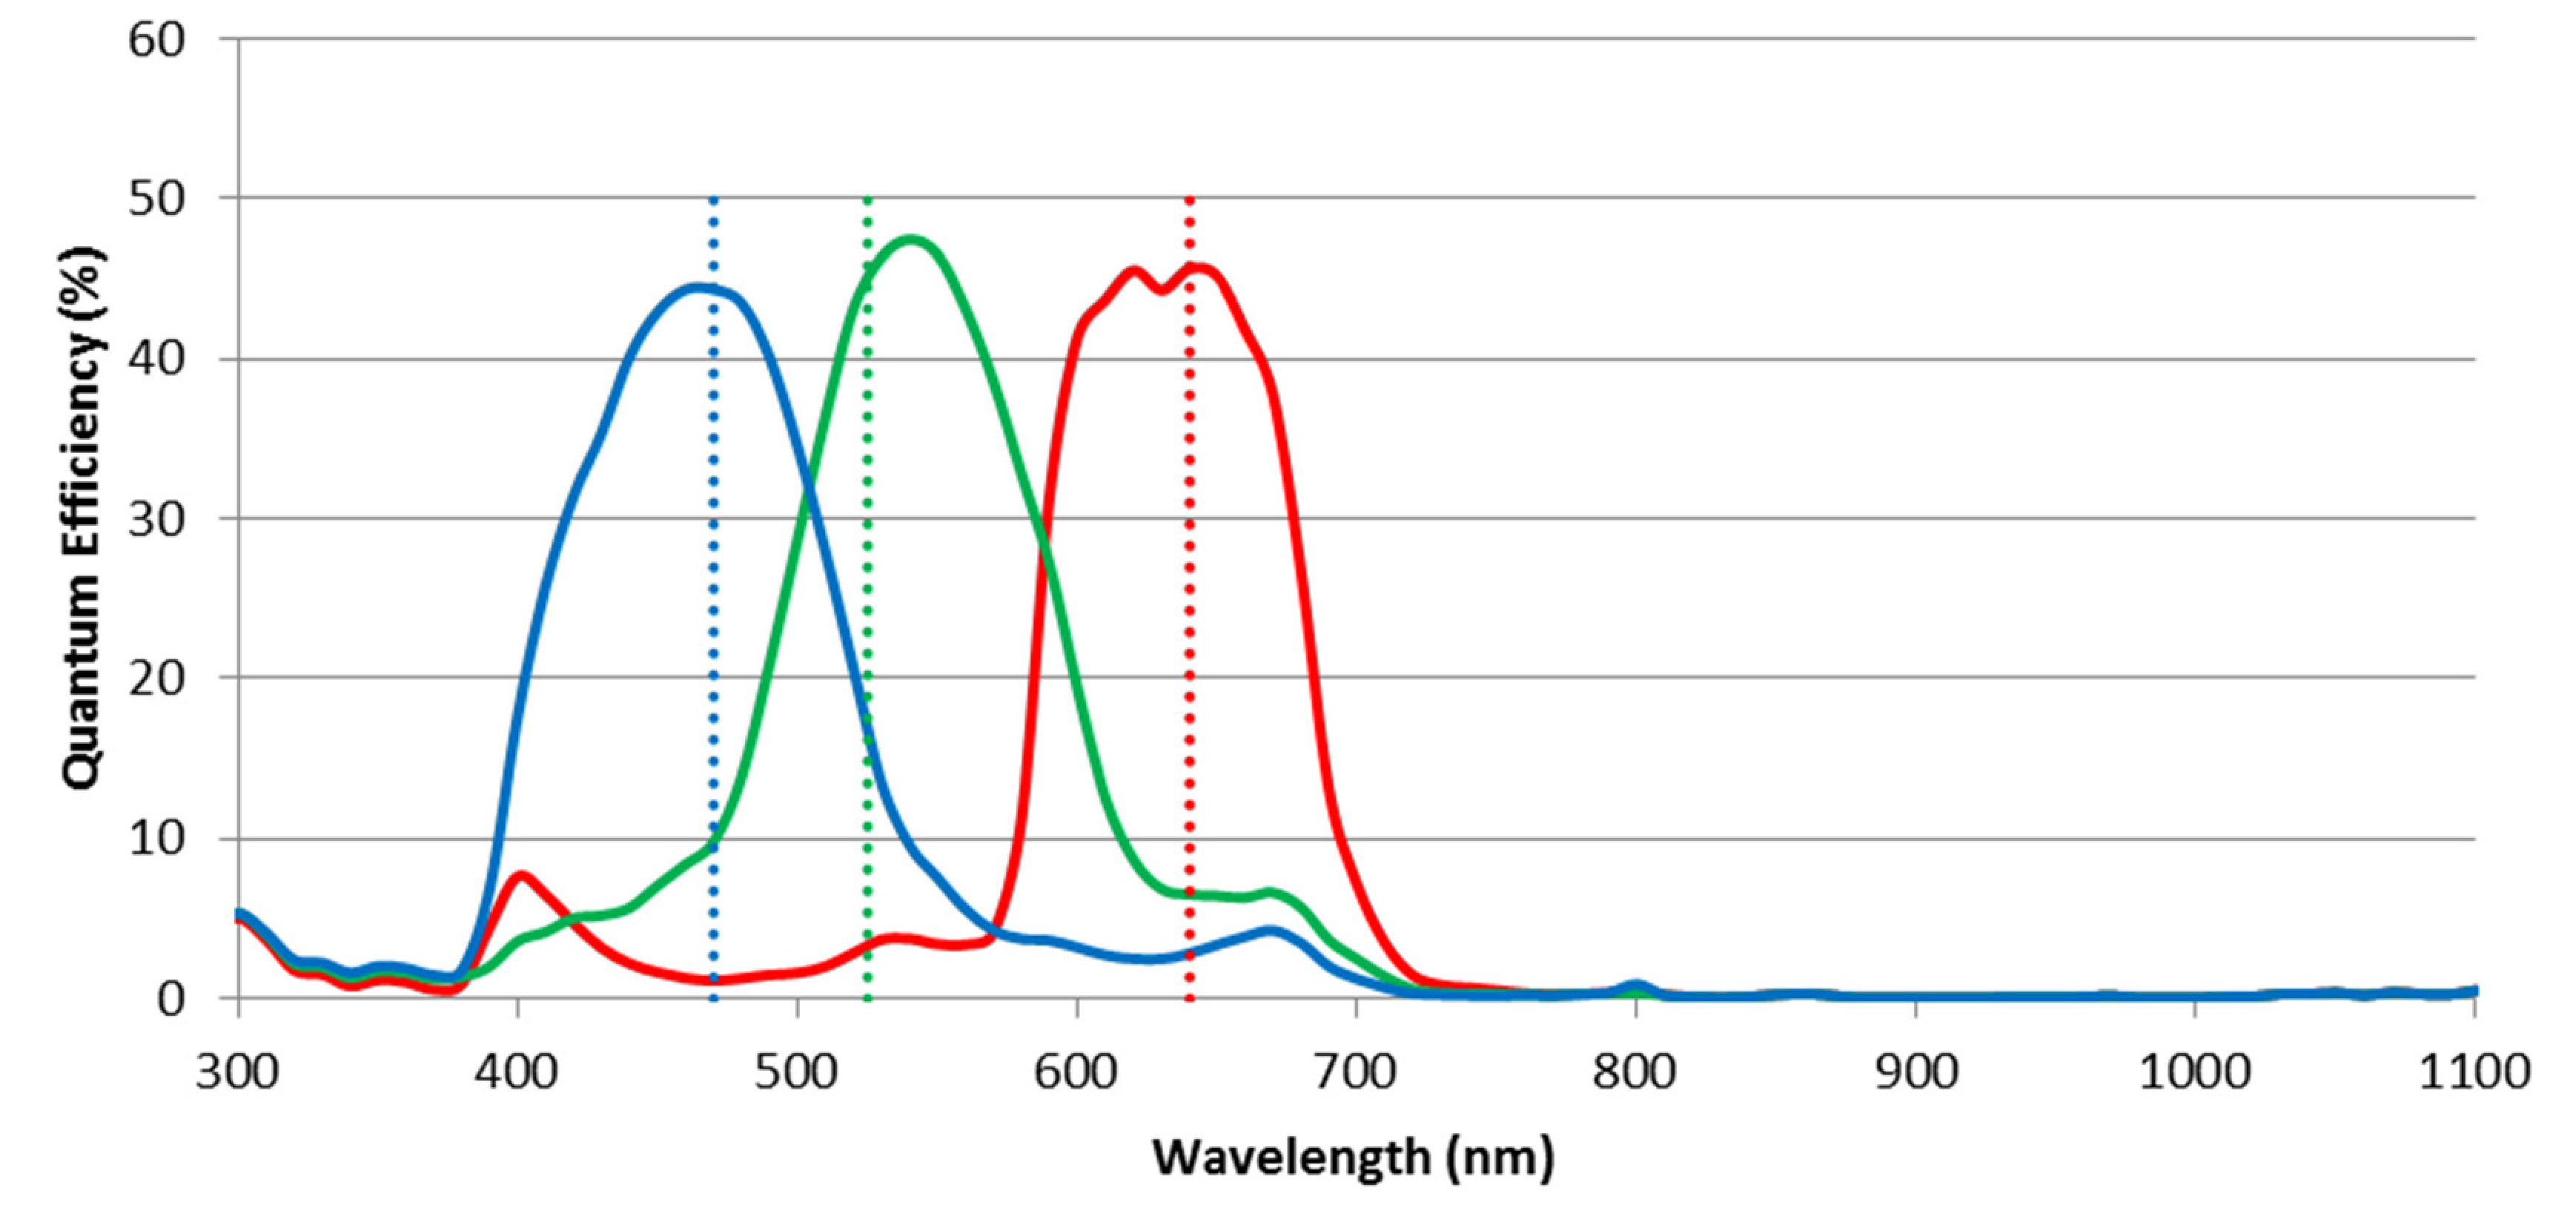
2.1. Optical Characteristics of the Color Camera
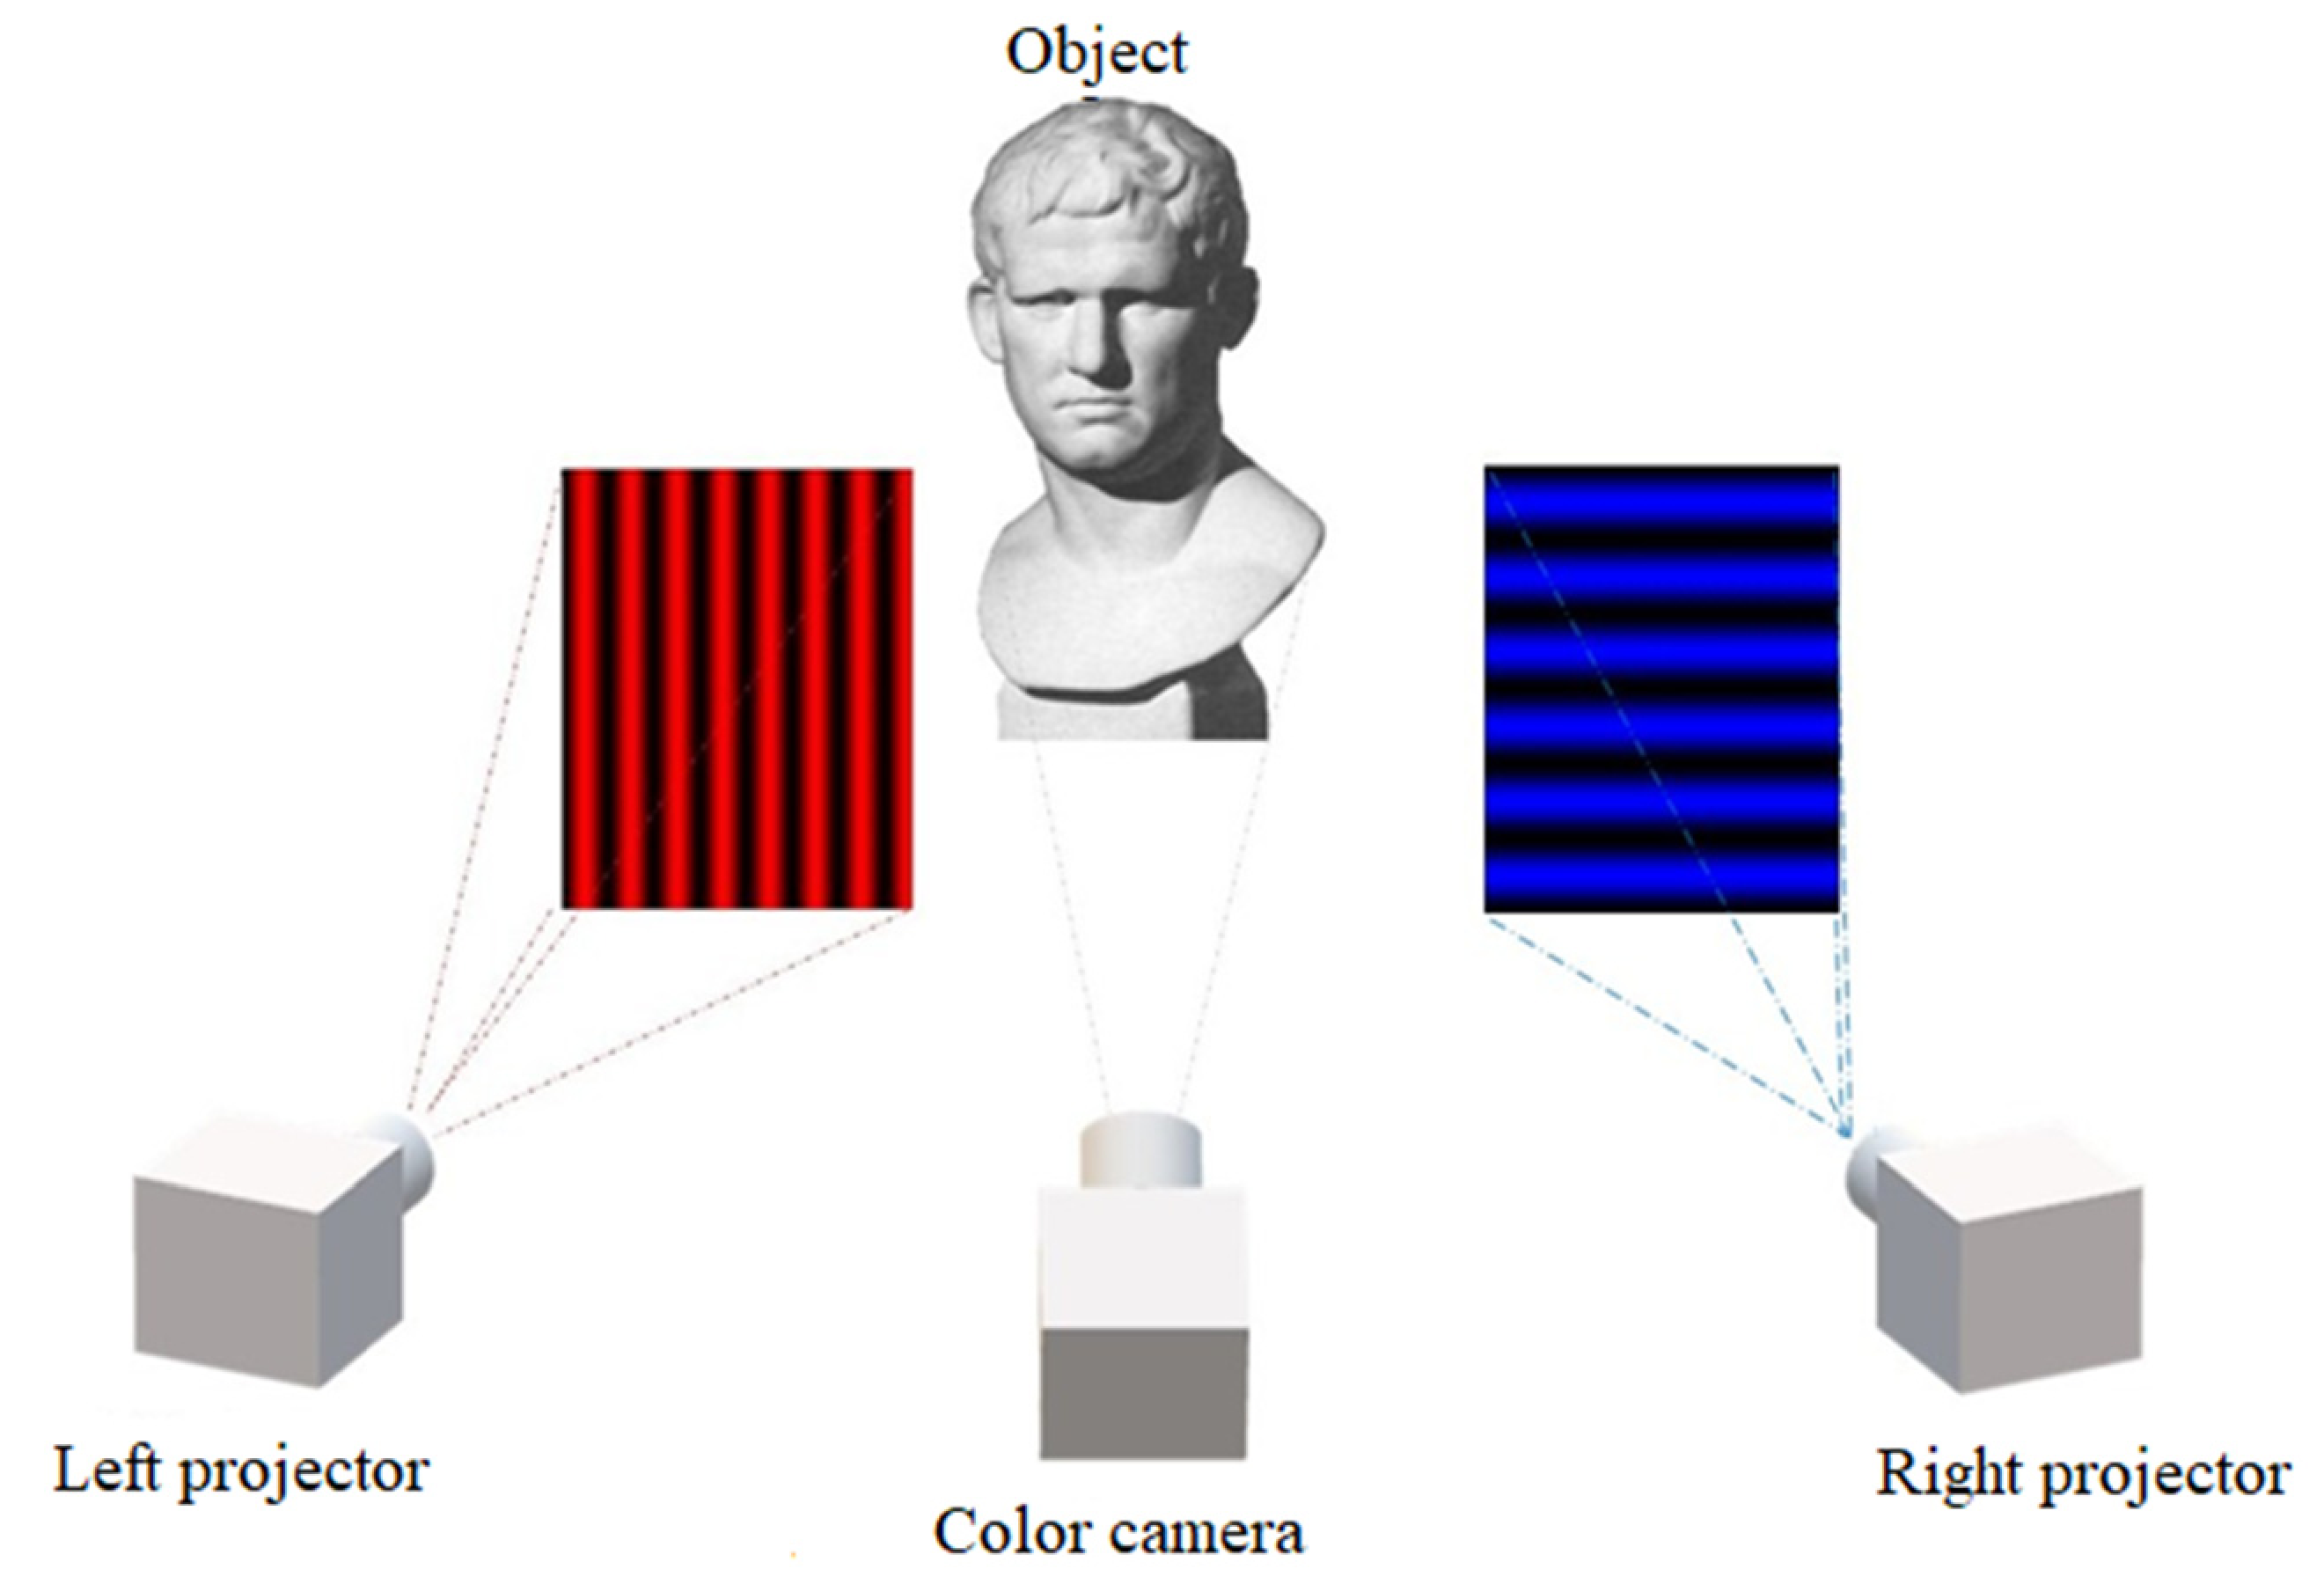
2.2. Double-Projector Fringe Projection Profilometry with Red and Blue Light
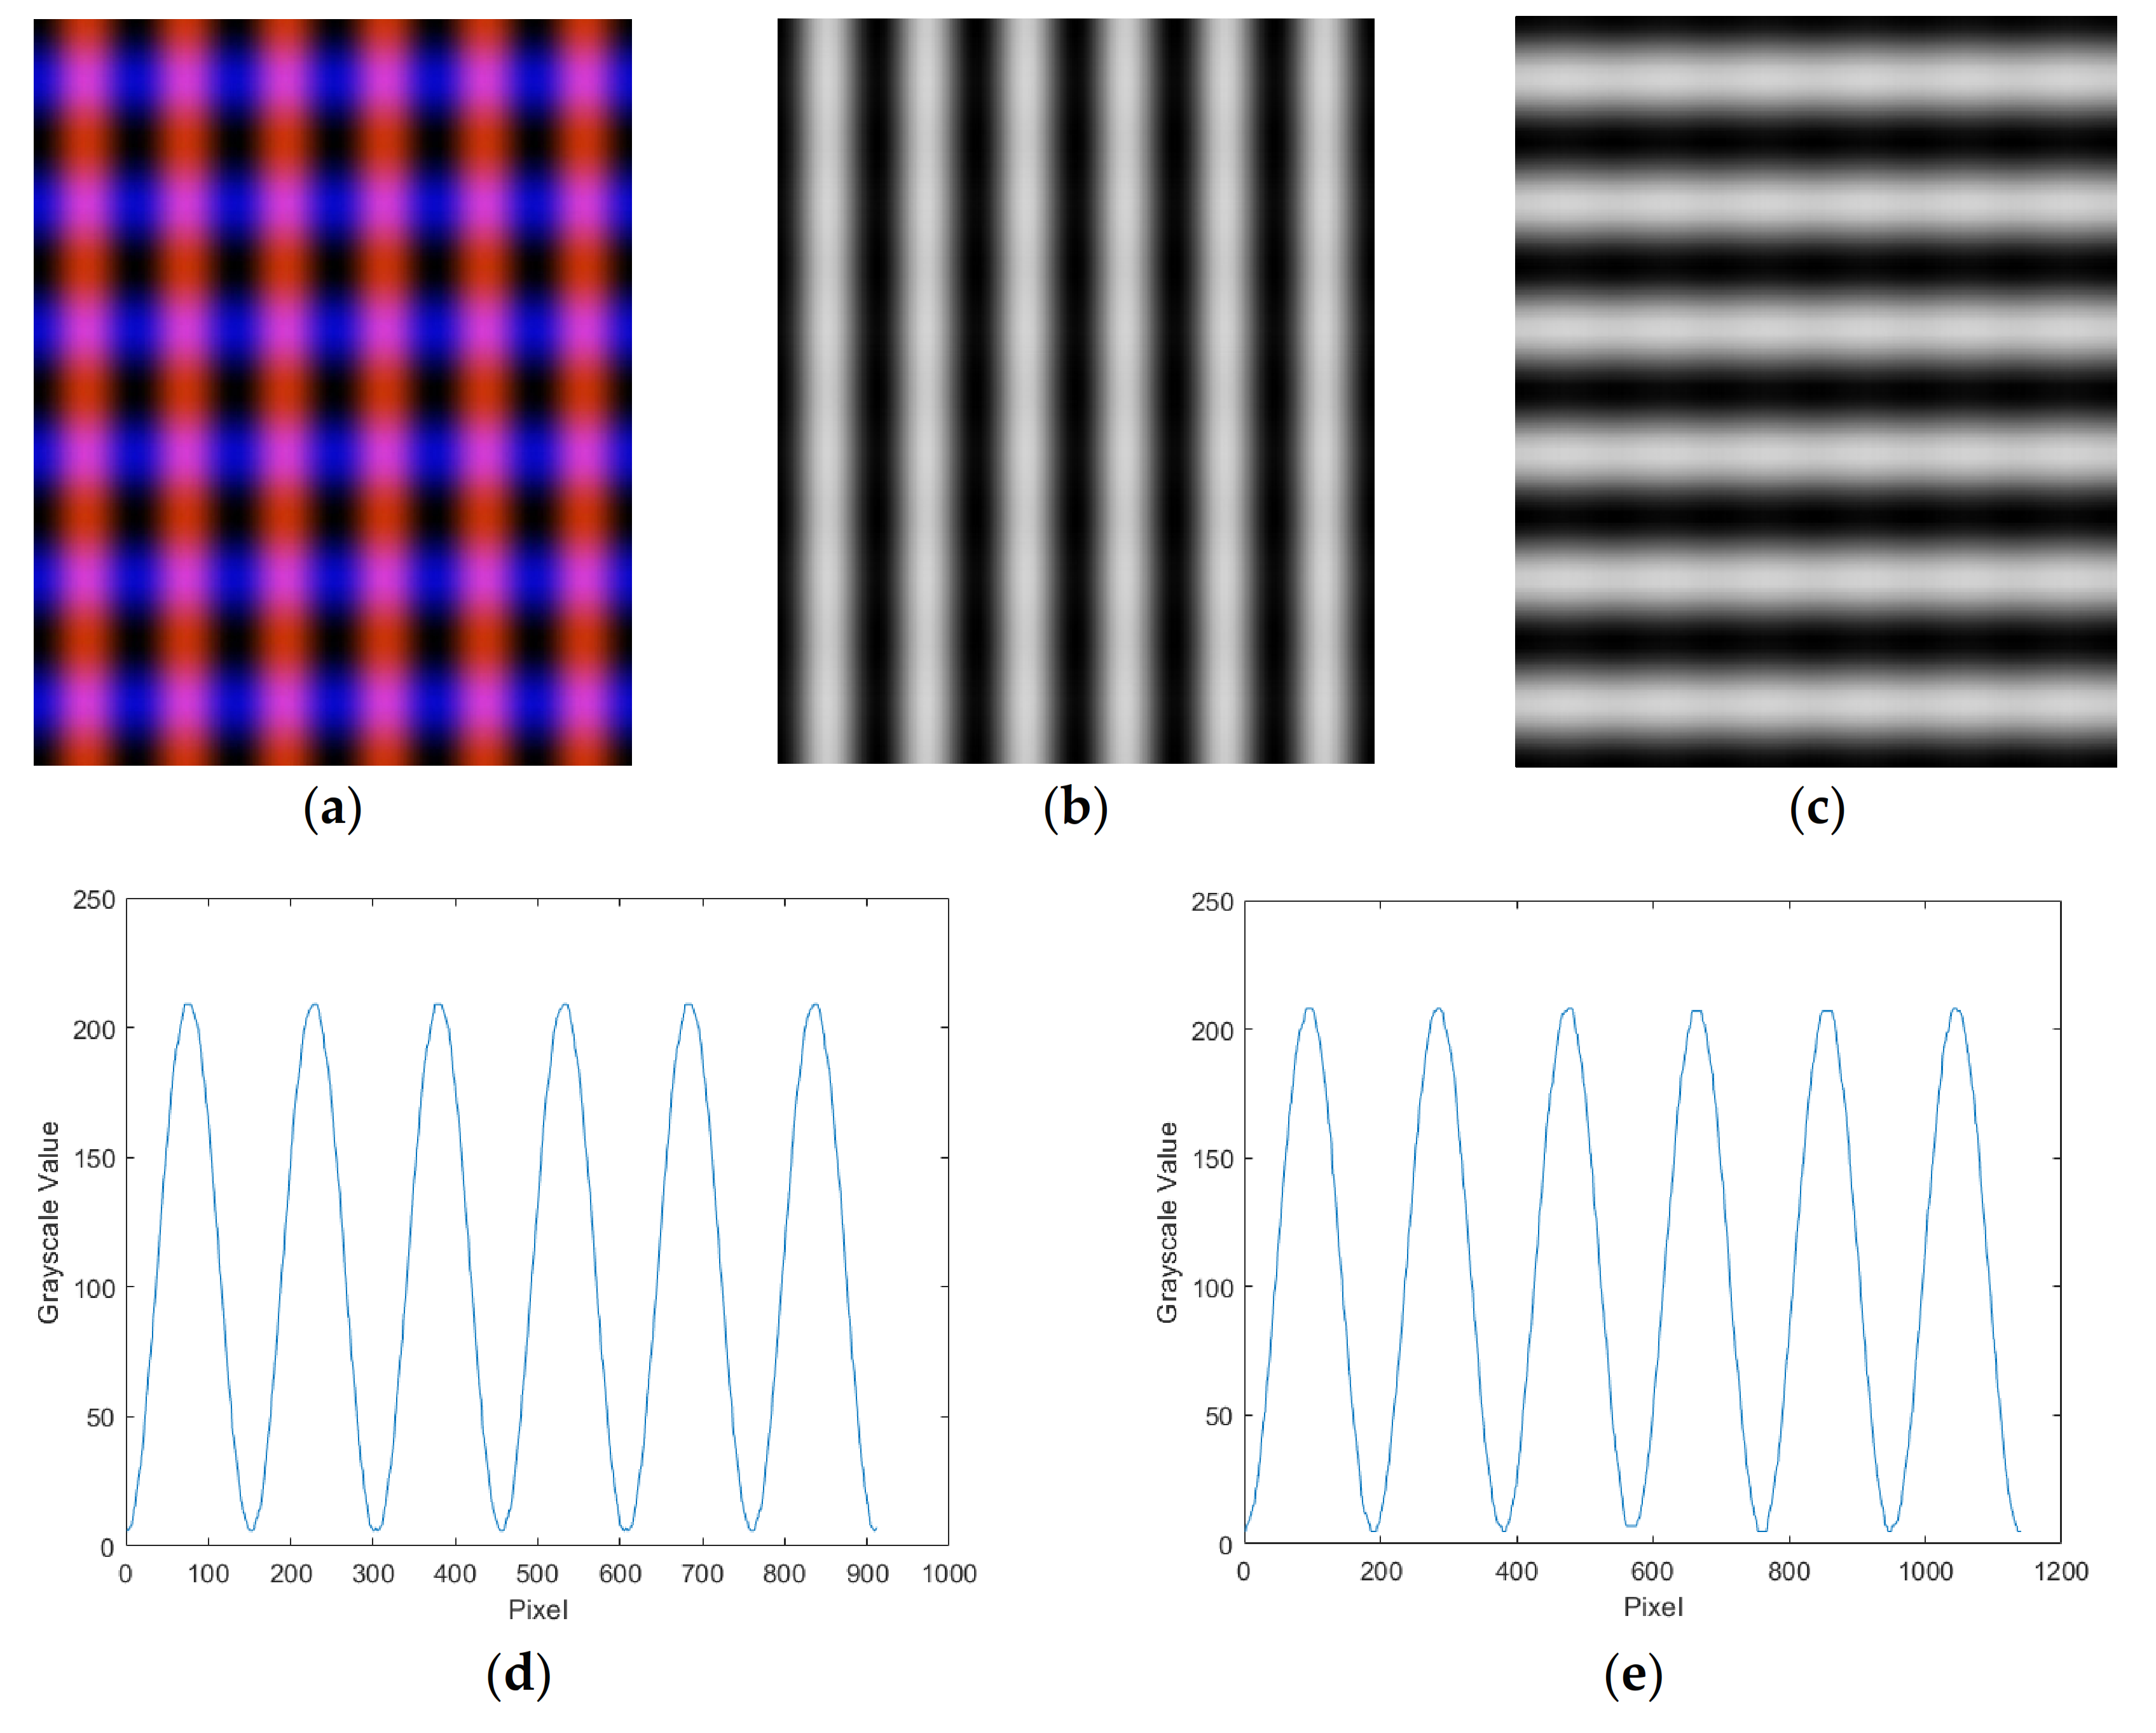
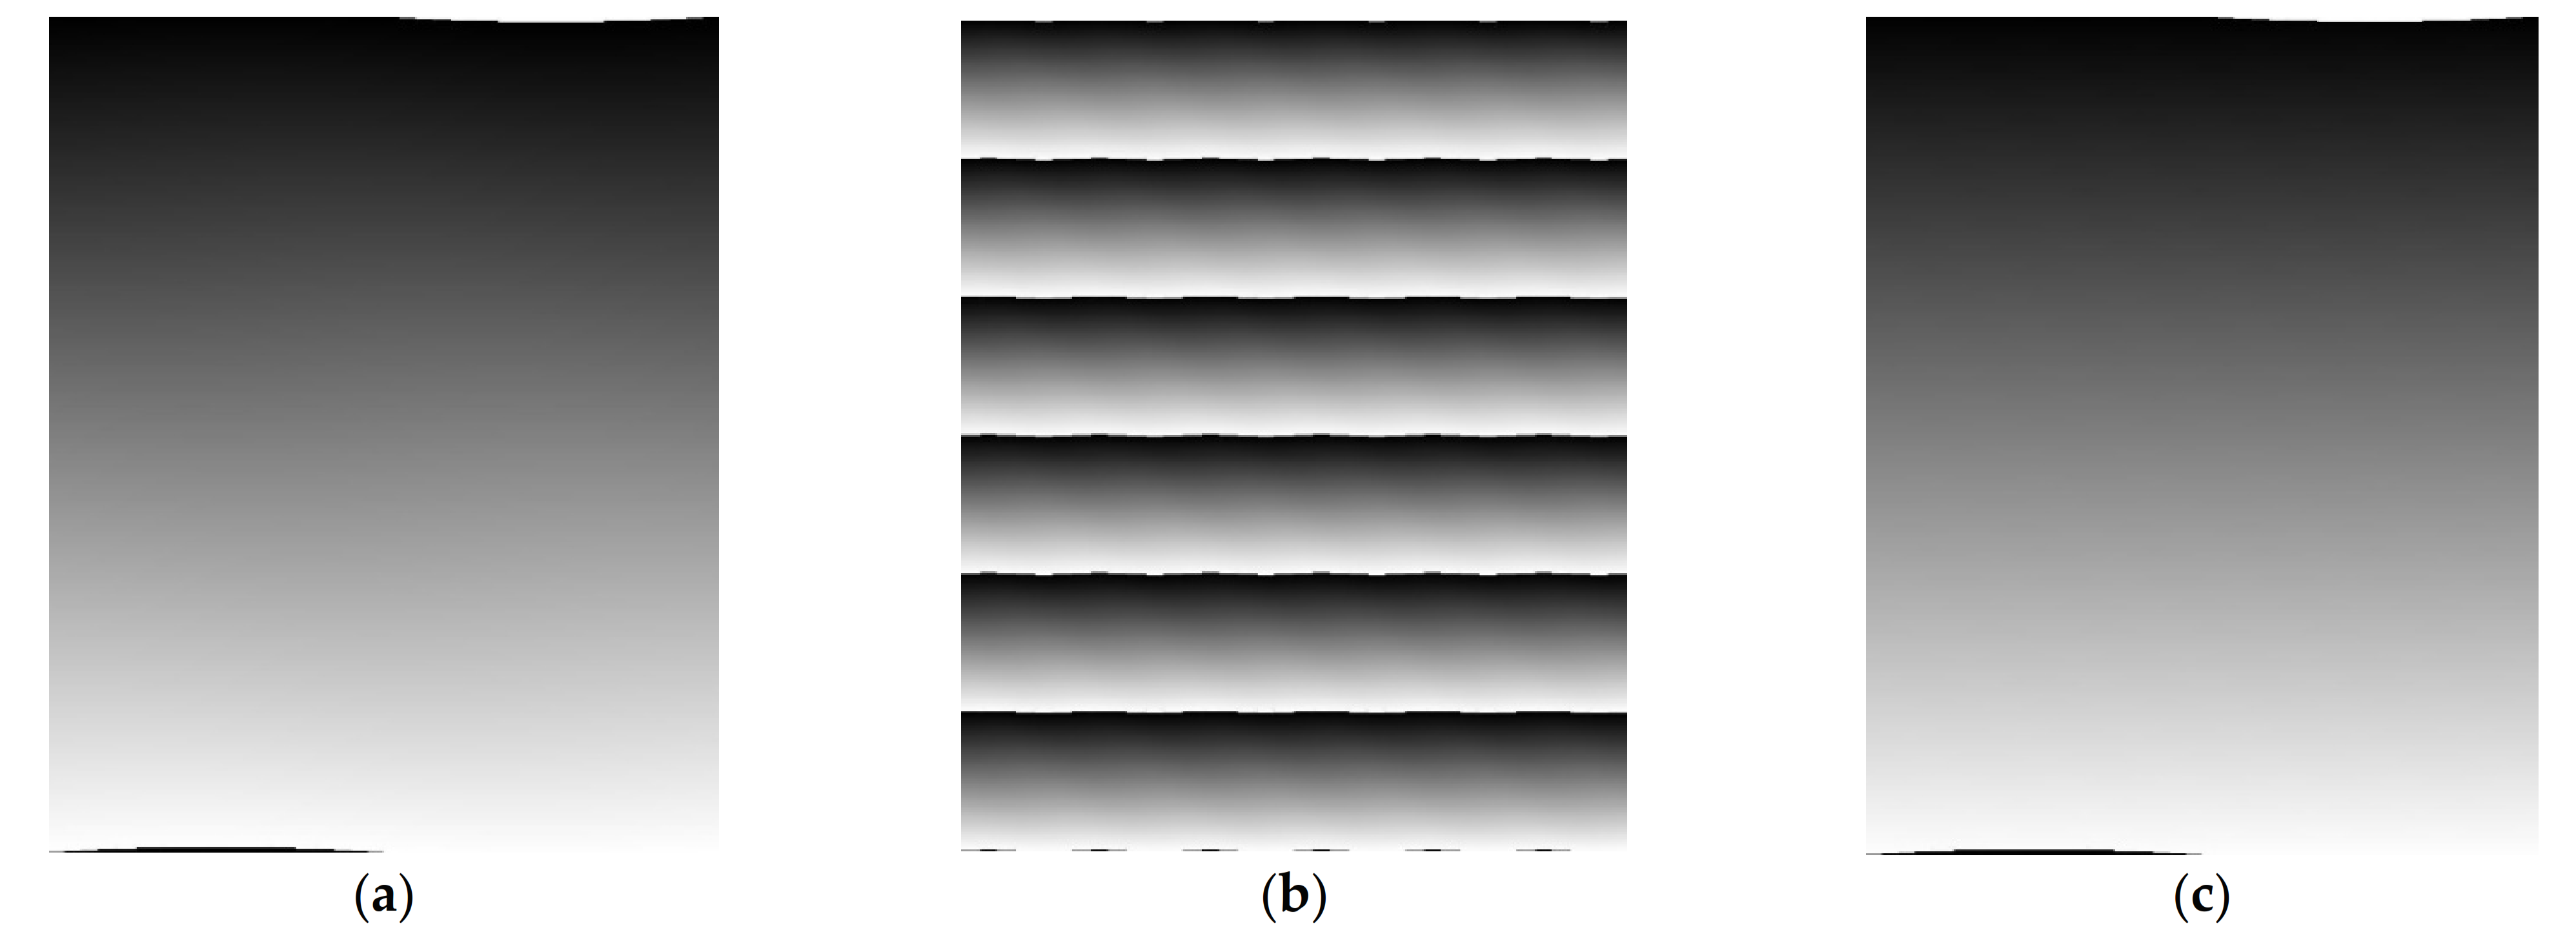
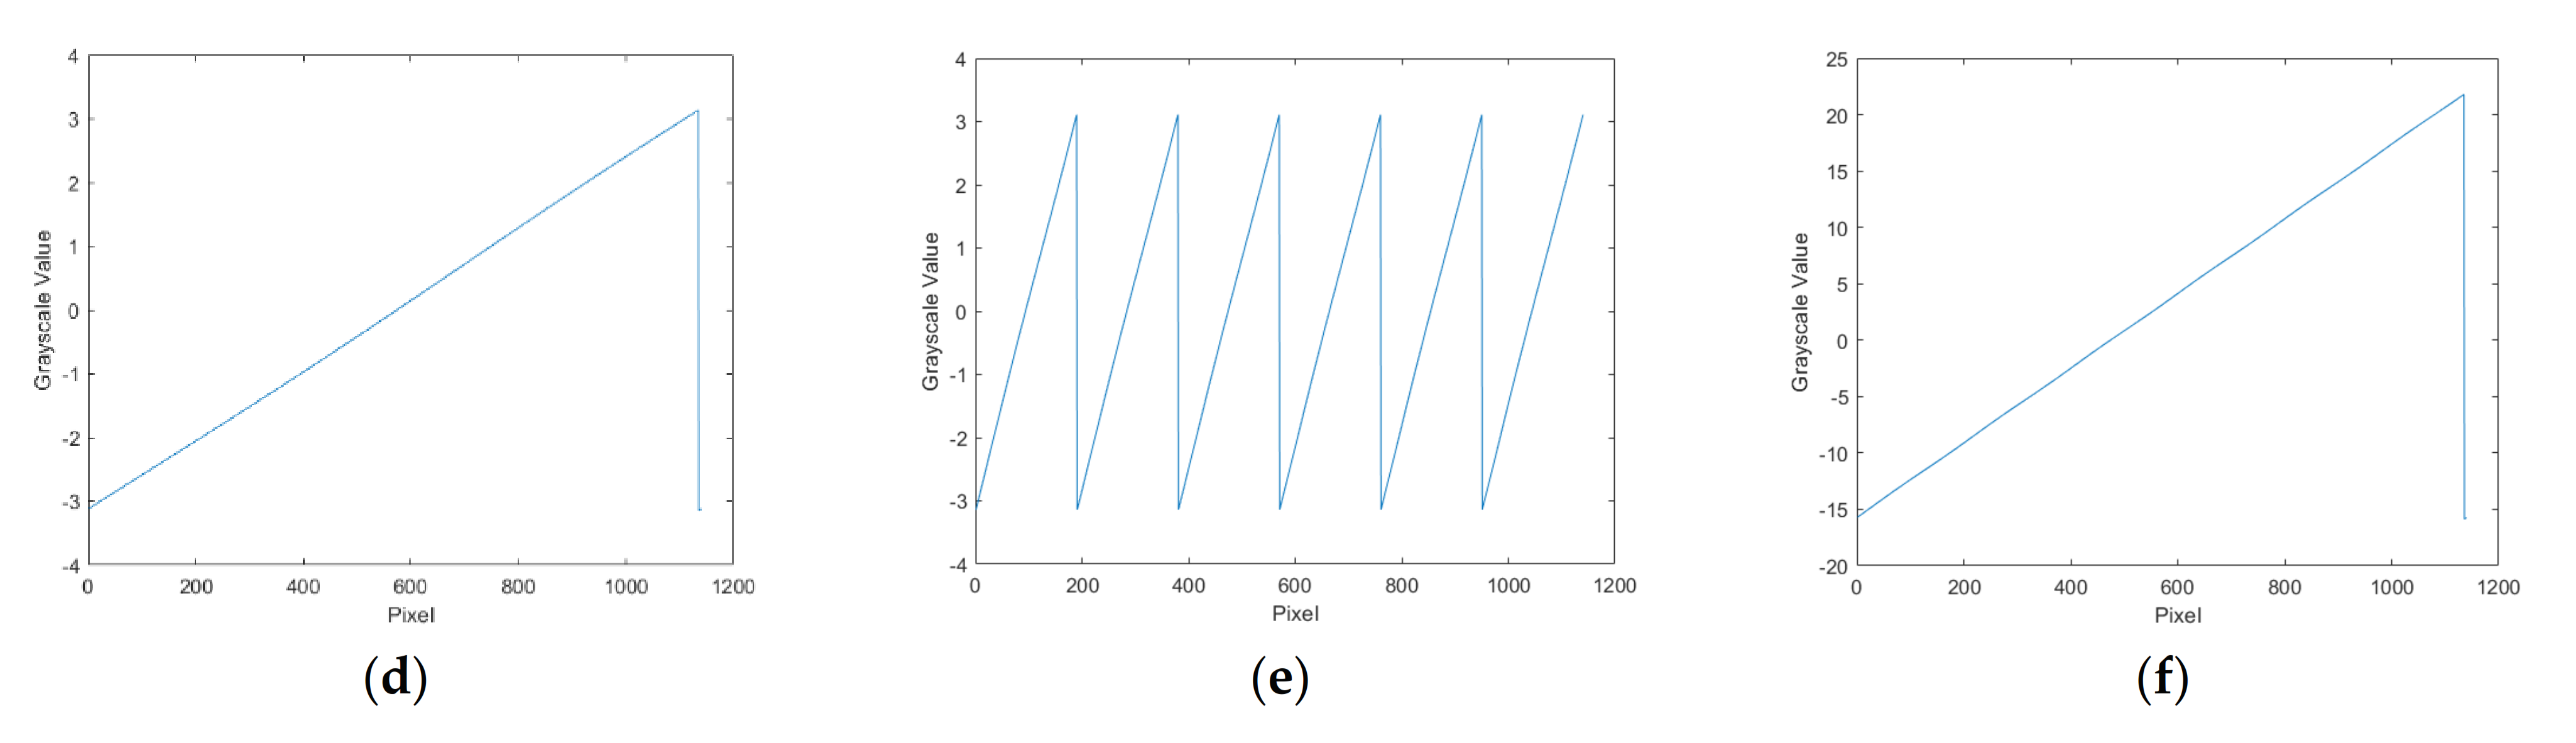
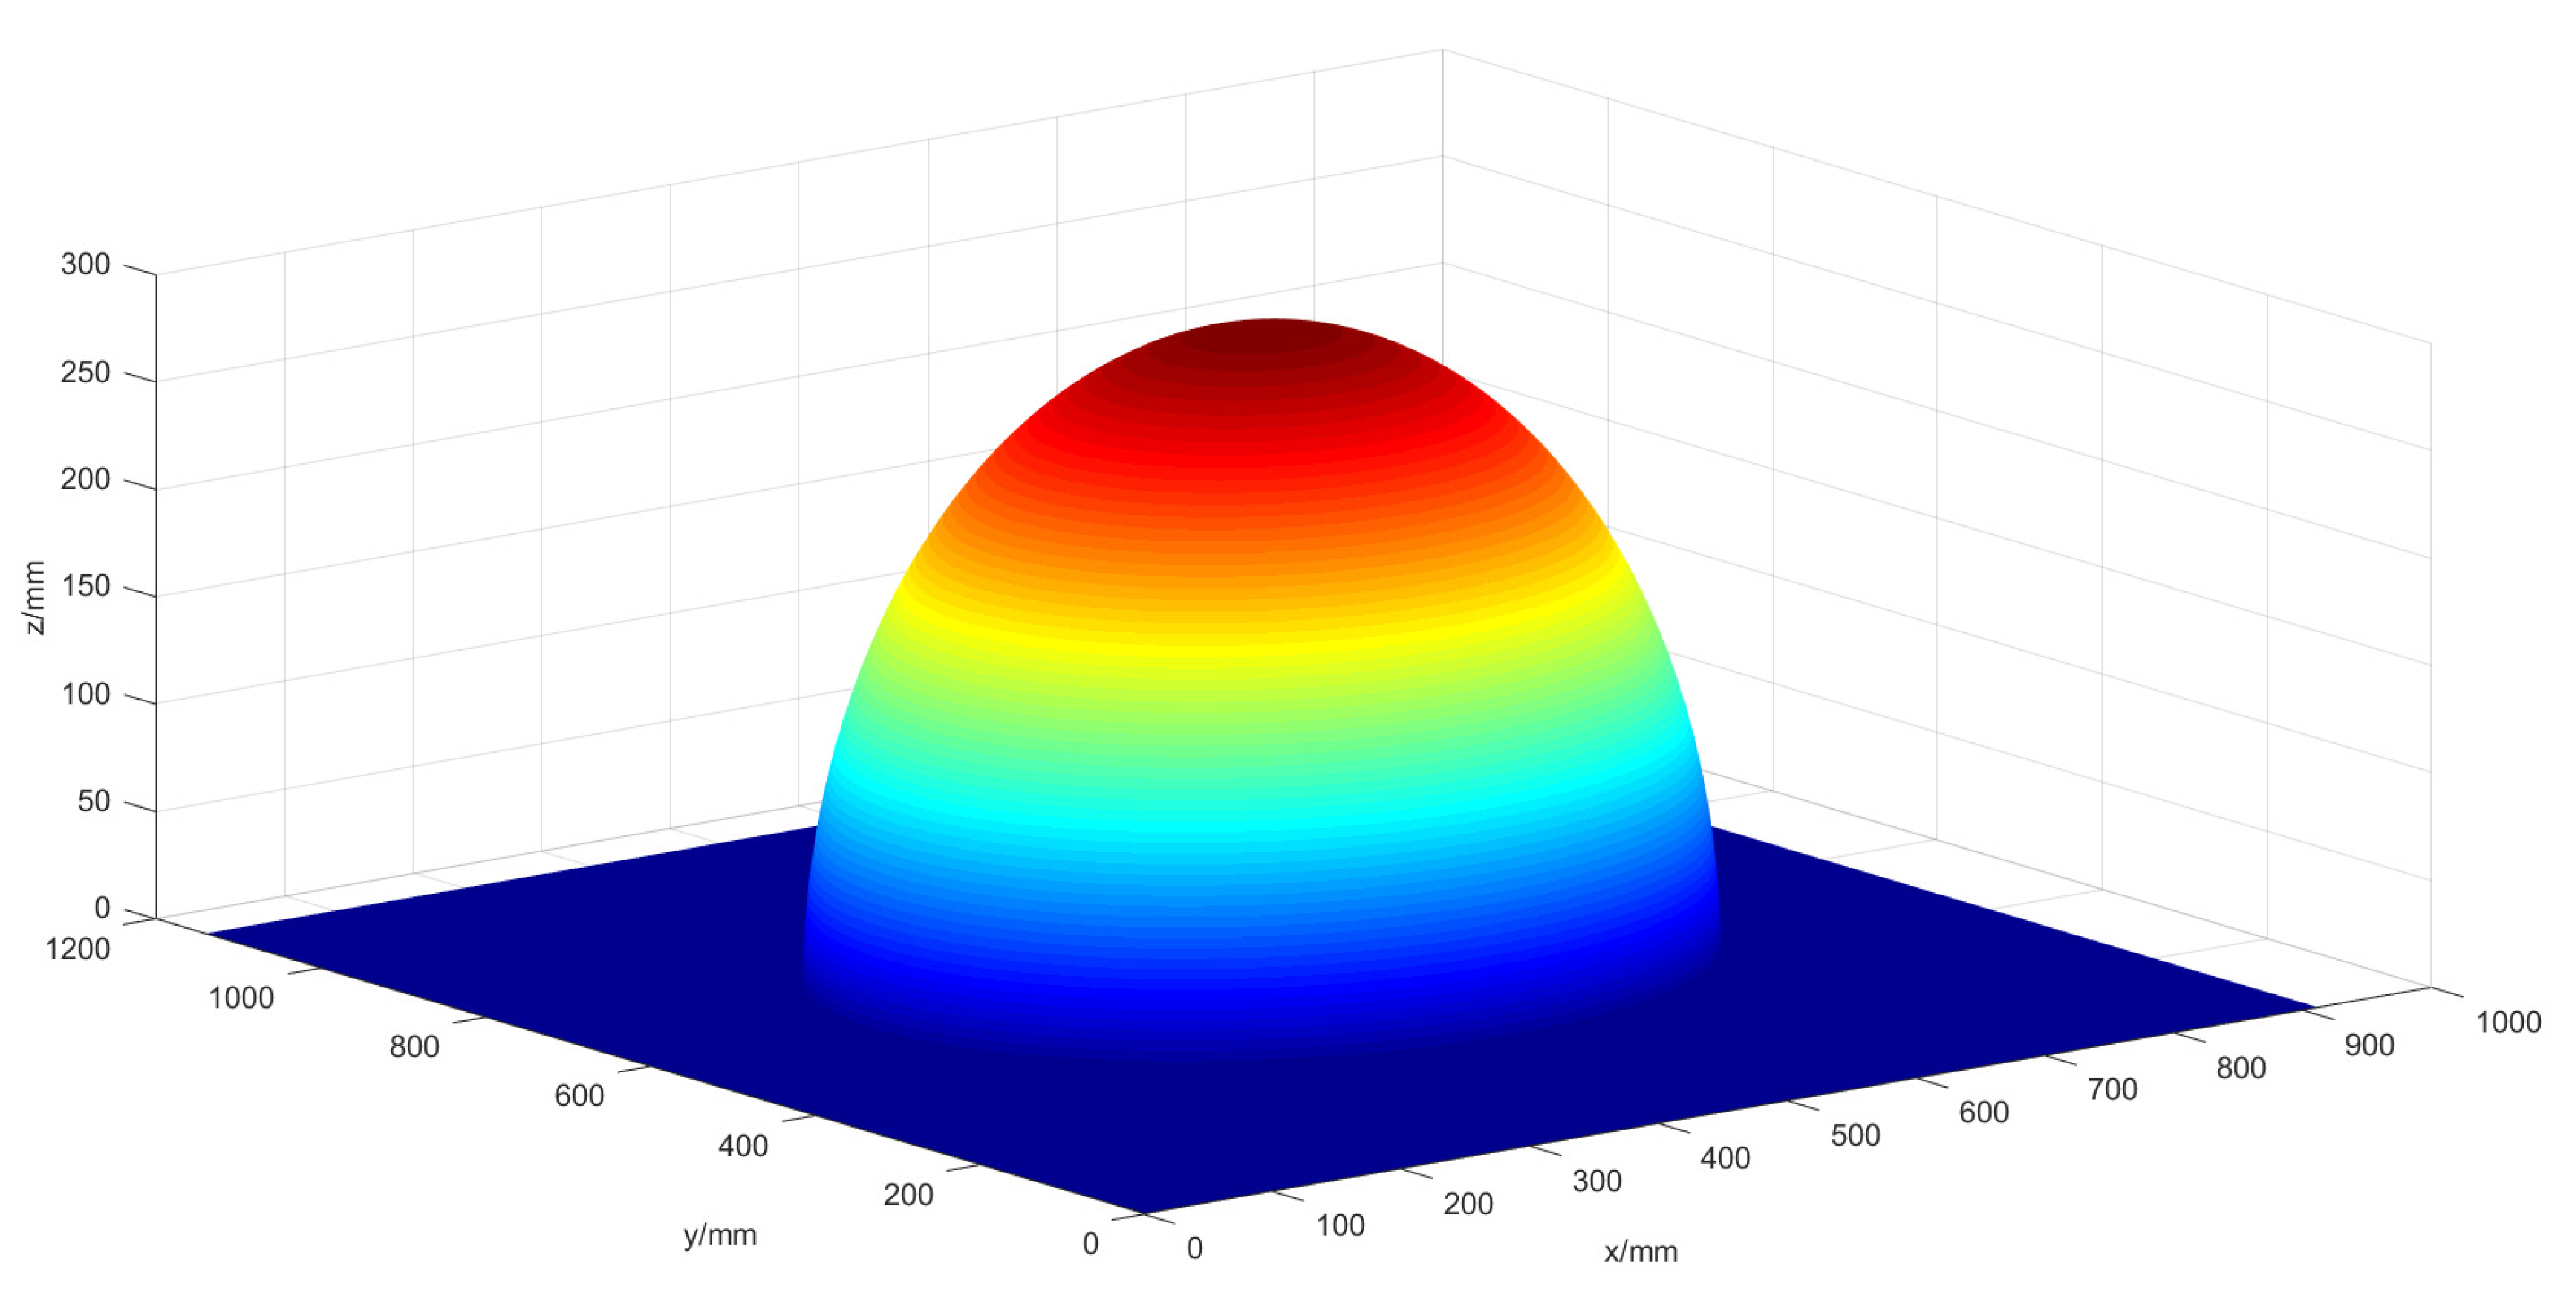
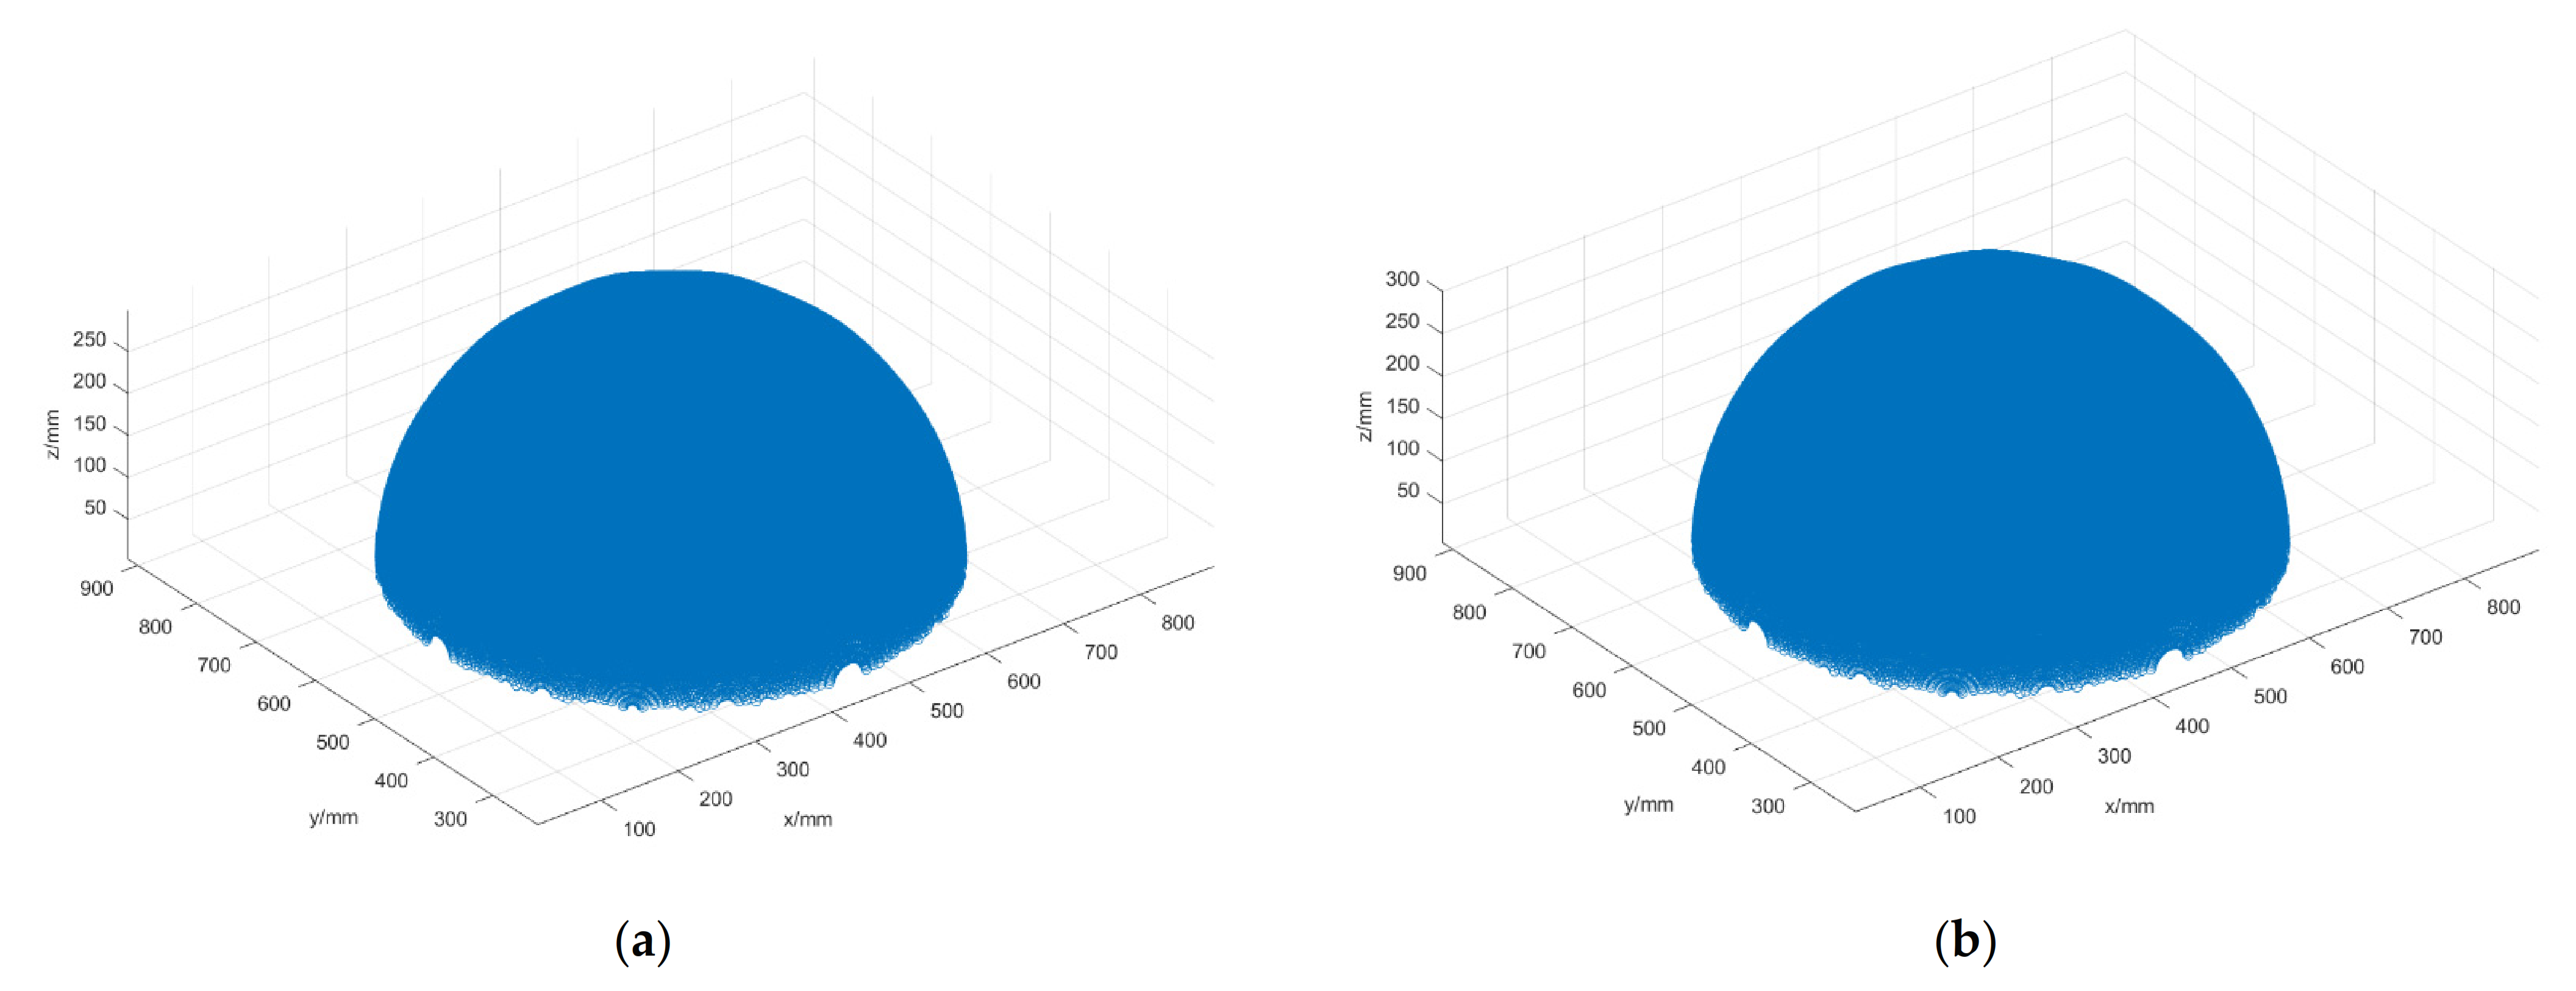
3. Simulation
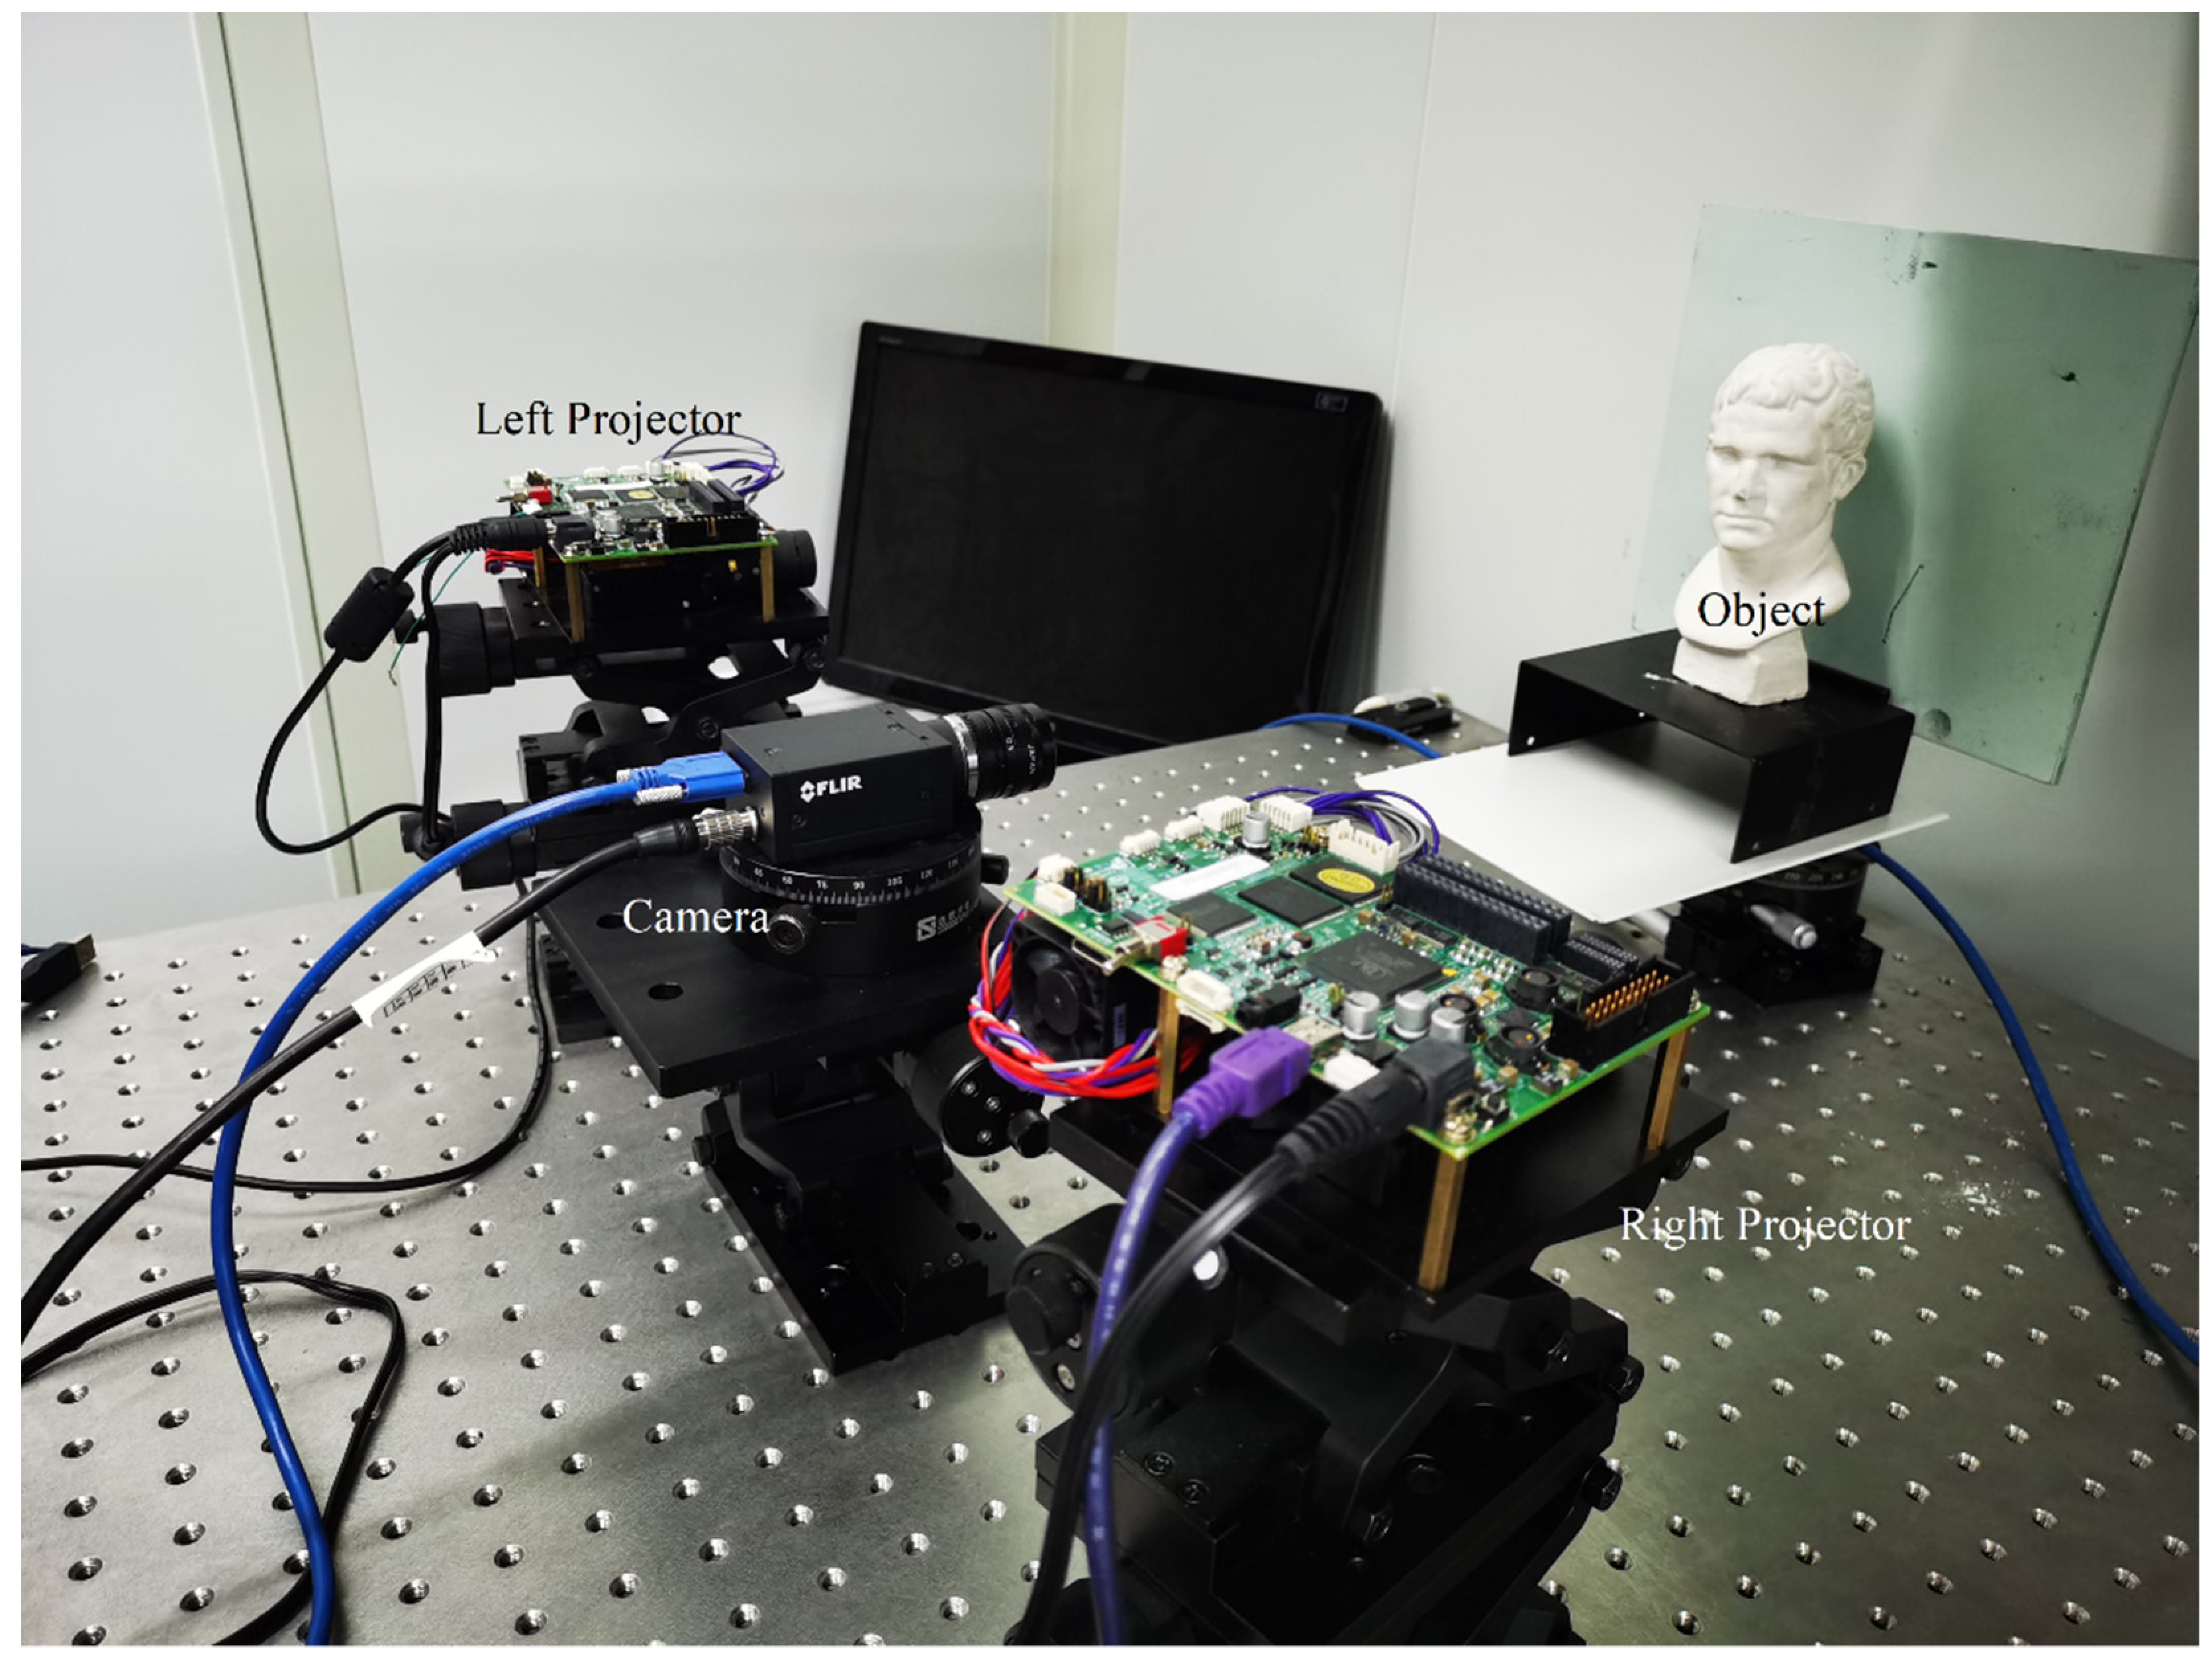
4. Results
5. Discussion
6. Conclusions
Author Contributions
Funding
Data Availability Statement
Acknowledgments
Conflicts of Interest
References
- Jin, Y.; Chang, Y.; Wang, J.; Li, M.; Ren, L.; Chen, Y. The measurement method for the size of the hole on the part surface based on grating image processing. IEEE Access 2020, 8, 29159–29168. [Google Scholar] [CrossRef]
- Yu, Y.; Lau, D.L.; Ruffner, M.P.; Liu, K. Dual-projector structured light 3d shape measurement. Appl. Opt. 2019, 59, 964–974. [Google Scholar] [CrossRef] [PubMed]
- Chufan, J.; Beatrice, L.; Song, Z. Three-dimensional shape measurement using a structured light system with dual projectors. Appl. Opt. 2018, 57, 3983–3990. [Google Scholar]
- Yu, Y.; Lau, D.L.; Ruffner, M. 3D scanning by means of dual-projector structured light illumination. In Proceedings of the Emerging Digital Micromirror Device Based Systems and Applications XI, San Francisco, CA, USA, 5–6 February 2019. [Google Scholar]
- Zhang, S.; Hu, X.; Zhong, M.; Chen, F.; Duan, P. Autofocusing method for digital fringe projection system with dual projectors. Opt. Express 2020, 28, 12609–12620. [Google Scholar] [CrossRef] [PubMed]
- Griesser, A.; Koninckx, T.P.; van Gool, L. Adaptive real-time 3D acquisition and contour tracking within a multiple structured light system. In Proceedings of the 12th Pacific Conference on Computer Graphics and Applications, PG 2004, Seoul, Korea, 6–8 October 2004; pp. 361–370. [Google Scholar]
- Maimone, A.; Fuchs, H. Reducing interference between multiple structured light depth sensors using motion. In Proceedings of the IEEE Virtual Reality Short Papers & Posters, Costa Mesa, CA, USA, 4–8 March 2012. [Google Scholar]
- Wang, J.; Zhang, C.; Zhu, W.; Zhang, Z.; Chou, P.A. 3D scene reconstruction by multiple structured-light based commodity depth cameras. In Proceedings of the IEEE International Conference on Acoustics, New York, NY, USA, 26–29 October 2012. [Google Scholar]
- Tardif, J.P.; Roy, S.; Trudeau, M. Multi-projectors for arbitrary surfaces without explicit calibration nor reconstruction. In Proceedings of the IEEE International Conference on 3-d Digital Imaging & Modeling, Tübingen, Germany, 30 August–1 September 2004. [Google Scholar]
- Yan, Z.; Yu, L.; Yang, Y.; Liu, Q. Beyond the interference problem: Hierarchical patterns for multiple-projector structured light system. Appl. Opt. 2014, 53, 3621–3632. [Google Scholar] [CrossRef] [PubMed]
- Je, C.; Lee, K.H.; Lee, S.W. Multi-projector color structured-light vision. Signal Process. Image Commun. 2013, 28, 1046–1058. [Google Scholar] [CrossRef] [Green Version]
- Xiang, S.; Yu, L.; Yang, Y.; Liu, Q.; Zhou, J. Interfered depth map recovery with texture guidance for multiple structured light depth cameras. Image Commun. 2015, 31, 34–46. [Google Scholar] [CrossRef]
- Petkovic, T.; Pribanic, T.; Donlic, M.; Sturm, P. Efficient Separation Between Projected Patterns for Multiple Projector 3D People Scanning. In Proceedings of the 2017 IEEE International Conference on Computer Vision Workshop (ICCVW), Venice, Italy, 22–29 October 2017. [Google Scholar]
- Li, Y.; Qu, X.; Zhang, F.; Zhang, Y. Separation method of superimposed gratings in double-projector structured-light vision 3d measurement system. Opt. Commun. 2020, 456, 124676. [Google Scholar] [CrossRef]
- Wegiel, M.G.; Kujawinska, M. Fast 3d shape measurement based on color structure light projection. Proc. SPIE Int. Soc. Opt. Eng. 2003, 43, 437–446. [Google Scholar]
- Huang, P.S.; Hu, Q.; Jin, F.; Chiang, F.P. Color-encoded digital fringe projection technique for high-speed 3-d surface contouring. Opt. Eng. 1999, 38, 1065–1071. [Google Scholar] [CrossRef]
- Zuo, C.; Chen, Q.; Gu, G.; Feng, S.; Feng, F.; Li, R.; Shen, G. High-speed three-dimensional shape measurement for dynamic scenes using bi-frequency tripolar pulse-width-modulation fringe projection. Opt. Lasers Eng. 2013, 51, 953–960. [Google Scholar] [CrossRef]


| Item | Coordinate of the Sphere Center/(mm, mm, mm) | Radius/mm | Error/mm |
|---|---|---|---|
| Truth value | (456, 570, 0) | 300 | N/A |
| Left projection | (4,569,983, 570.0014, 0.0650) | 299.9507 | −0.0493 |
| Right projection | (456.0021, 569.9983, −0.0191) | 300.0199 | 0.0199 |
Publisher’s Note: MDPI stays neutral with regard to jurisdictional claims in published maps and institutional affiliations. |
© 2021 by the authors. Licensee MDPI, Basel, Switzerland. This article is an open access article distributed under the terms and conditions of the Creative Commons Attribution (CC BY) license (http://creativecommons.org/licenses/by/4.0/).
Share and Cite
Zhang, Y.; Qu, X.; Li, Y.; Zhang, F. A Separation Method of Superimposed Gratings in Double-Projector Fringe Projection Profilometry Using a Color Camera. Appl. Sci. 2021, 11, 890. https://doi.org/10.3390/app11030890
Zhang Y, Qu X, Li Y, Zhang F. A Separation Method of Superimposed Gratings in Double-Projector Fringe Projection Profilometry Using a Color Camera. Applied Sciences. 2021; 11(3):890. https://doi.org/10.3390/app11030890
Chicago/Turabian StyleZhang, Yuanjun, Xinghua Qu, Yiming Li, and Fumin Zhang. 2021. "A Separation Method of Superimposed Gratings in Double-Projector Fringe Projection Profilometry Using a Color Camera" Applied Sciences 11, no. 3: 890. https://doi.org/10.3390/app11030890