1. Introduction
Craniosynostosis is one of the most common causes of cranial malformations in infants. It is a condition in which one or more cranial sutures becomes prematurely fused, resulting in an abnormal morphology as well as limited brain growth and intracranial hypertension. Craniosynostosis is classified according to the type of premature fused cranial suture involved, such as the sagittal, coronal, metopic, or lambdoid types [
1].
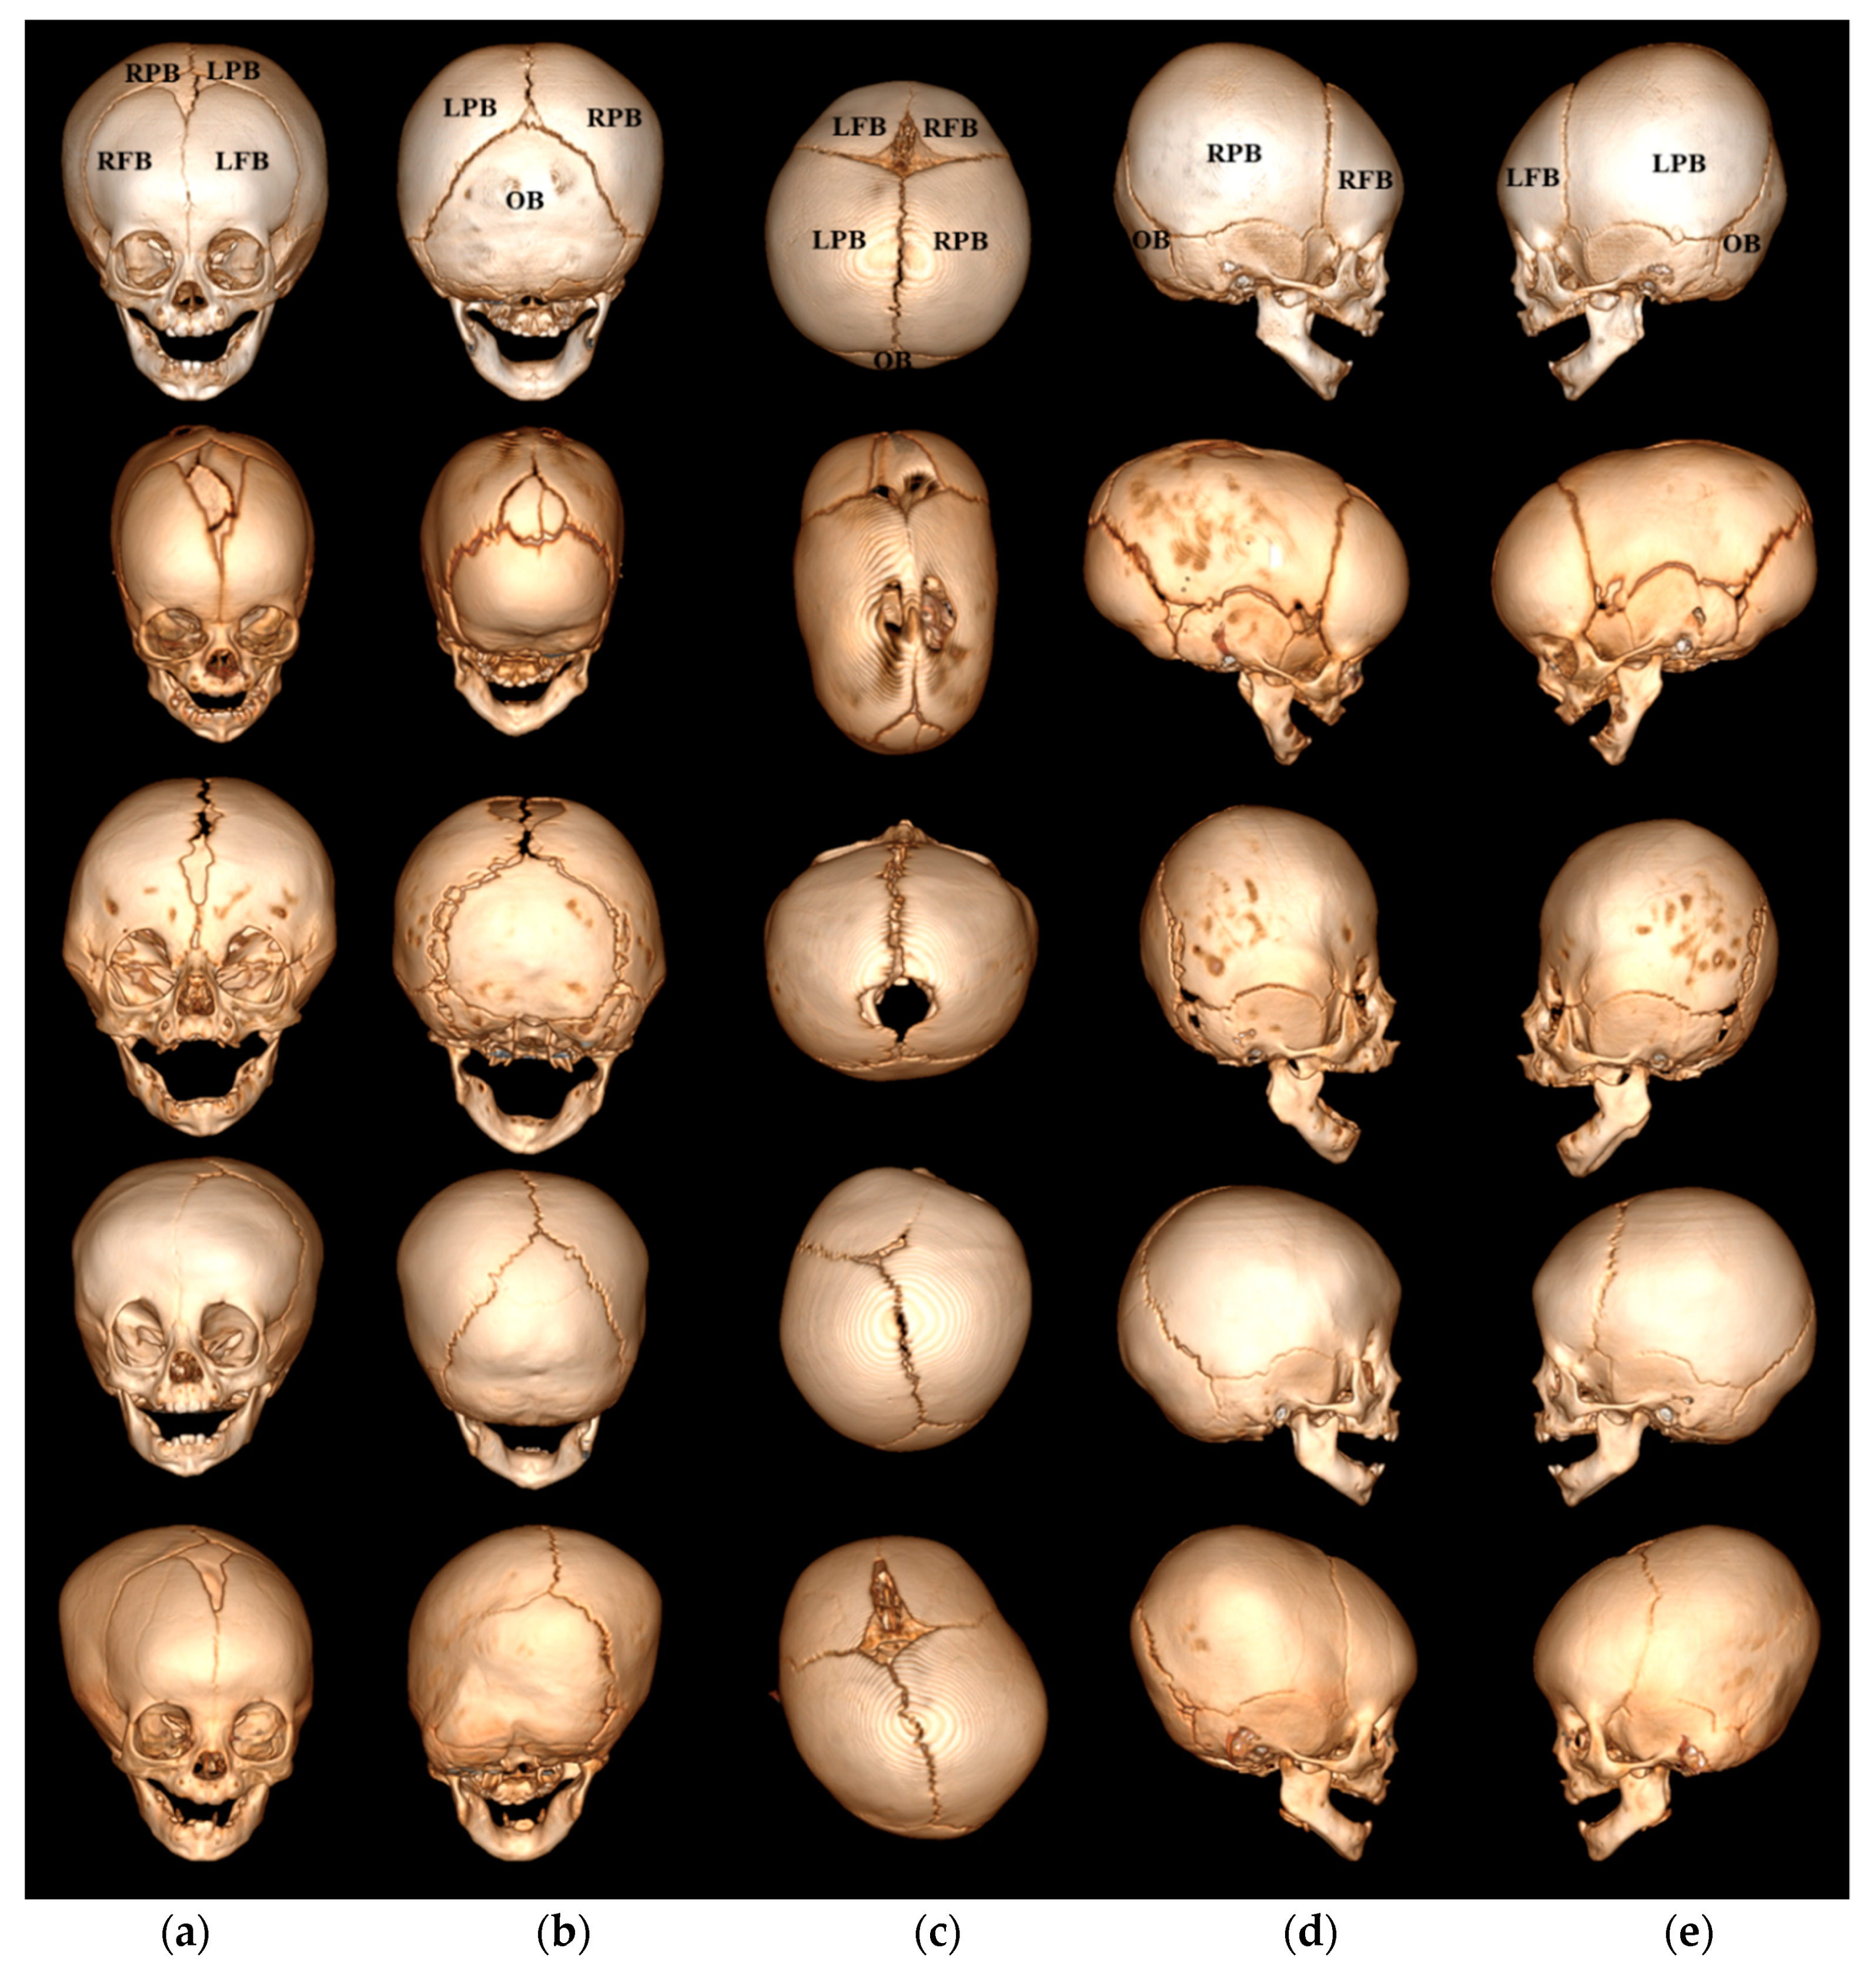
Figure 1 shows the four types of craniosynostosis used in our study, such as the sagittal, bilateral coronal and unilateral coronal, and unilateral lambdoid synotoses. The normal skull in
Figure 1a shows that all sutures are open, presenting five cranial bones, the left and right frontal bones, the left and right parietal bones, and the occipital bone where the sagittal suture is located between the two parietal bones, the coronal suture is located between the frontal and parietal bones, and the lambdoid suture is located between the parietal and occipital bones.
Figure 1b presents an example of sagittal synostosis, which accounts for 40~60% of all cases of craniosynostosis. In this type, premature fusion of the sagittal suture causes the skull shape to show biparietal narrowing and elongation, because the lateral growth of the skull is restricted and its anteroposterior growth continues. As shown in
Figure 1c, bilateral coronal synostosis accounts for 5~10% of all cases of craniosynostosis, with premature fusion of both coronal sutures causing the shape of the skull to be broad, high, and short. Unilateral coronal synostosis, shown in
Figure 1d, accounts for 20~25% of all cases of craniosynostosis, and premature fusion of one side the coronal suture flattens the forehead toward one side and causes it to protrude on the opposite side.
Figure 1e presents an example of unilateral lambdoid synostosis, which accounts for 0~5% of all cases of craniosynostosis, with premature fusion of one side of the lambdoid suture flattening the back of the skull on one side and causing it to protrude on the opposite side.
Analyzing the surgical effects of craniosynostosis requires a quantitative assessment of the morphological changes in the skull before and after the surgery, but it is still performed by a clinician’s visual inspection of the overall head shape or by measuring the cephalic index (CI) [
2,
3] and cranial vault asymmetry index (CVAI) [
4,
5]. The CI is usually calculated as the ratio of the maximum width of the skull divided by the maximum length from the top view of the volume as rendered by a 3D CT, and is commonly used as a severity index for sagittal and bilateral coronal cases characterized by a symmetric shape. However, it is difficult to determine the maximum skull width and length consistently, since the location of the most prominent points seen from the top view depends on the skull shape of synostosis [
6,
7]. The CVAI is calculated by dividing the difference between two diagonal cranial diameters, 30 degrees from the
Y-axis, by the short cranial diagonal diameter and multiplying by 100 in the cross-sectional plane at level 3. The level 3 is one-third of the distance from the reference plane including nasion and both tragion to the vertex. The CVAI is used as a severity index for unilateral coronal and unilateral lambdoid cases characterized by an asymmetric shape. However, it is difficult to reflect the deformation, in which case the position of the prominent area is different from the position of the estimated diagonal diameter with 30 degrees from the
Y-axis.
Recently, several methods by which to make quantitative assessments of the surgical effects of craniosynostosis have been suggested. Tenhagen [
8] et al. compared the measurements for nine patients with sagittal synostosis before and after surgery in 3D scan datasets, which measures the cephalic index, head circumference length passing through glabella and occipital prominence, sagittal length over the head from the nasion in the sagittal plane, coronal width over the head from the left to the right tragion in the coronal plane, and head volume above the Frankfort horizontal plane. Liaw [
9] et al. compared head volumes divided into six regions for 98 normal subjects and 30 patients with sagittal synostosis before and after surgery in 3D scan datasets. A skull is divided into three areas through two planes, passing through the pituitary fossa and rotating at two angles (84 degrees clockwise on the anterior axis and 31 degrees clockwise on the posterior axis), with the final six areas defined by dividing the mid-sagittal plane. Weathers [
10] et al. compared the measurements for two patients with metopic synostosis before and after surgery in 3D scan datasets, which included head circumference length, anterior symmetry volume ratio, posterior symmetry volume ratio, and overall symmetry volume ratio. Rodriguez-Florez [
11] et al. compared the measurements of 10 patients with metopic synostosis before and after surgery and 15 normal subjects in 3D scan datasets, which measures the forehead volume defined by the volume between the base plane and the posterior plane at 120°, interfrontoparietal–interparietal ratio and frontal angle. However, these methods using 3D scan datasets can only provide information about the overall skull surface and not regional skull information. Porras [
12] et al. used data from 18 patients (seven with sagittal, one metopic, one bicoronal, one unilateral coronal, three multiple suture synostosis, and five with the pansynostosis types) from a dataset consisting of preoperative 3D CT images and postoperative 3D scans. In the study, two shape metrics were quantified using a shape mismatch degree, referring to a difference between a normal head shape that matches the patient’s head shape and the patient’s actual head shape and a curvature mismatch, which is the curvature difference between the two shapes. However, because the matched normal head shape is selected as the closest normal head shape to the patient, this method is limited with regard to its ability accurately to reflect the shape mismatch given the selection of a similar head shape.
Since the previous methods only use 3D scan data sets, it is difficult to consider information about the regional cranial bones inside the head. In this paper, we propose a method to quantify the surgical effect on regional cranial bones by considering bone information using 3D CT images and comparing the shape of the skull before and after surgery. In order to estimate the shape deformation of the regional area of each cranial bone according various types of craniosynostosis, a mean normal skull surface model consisting of five cranial bones separated by open sutures is deformed into a preoperative skull, after which the deformed mean normal skull surface model is redeformed into a postoperative skull. In order to quantify the shape deformation of the expansion and reduction of the regional cranial bones between the preoperative skull and the postoperative skull, the reduction and expansion indices are calculated using positive and negative distance and area ratio indices.
2. Materials and Methods
As shown in
Figure 2, the proposed method consists of three main steps: (a) preprocessing through skull surface generation and mean normal skull model generation, (b) regional bone partitioning and shape deformation estimation, (c) quantification of skull shape deformation between preoperative and postoperative skulls. In the preprocessing step, the skulls of the patients with craniosynostosis and the normal subjects are semiautomatically segmented from the head CT images and generated into a skull surface model, after which the mean normal skull surface model is generated using the skull surface models of the normal subjects. In the regional bone partitioning and shape deformation estimation step, the mean normal skull surface model is initially deformed into a preoperative skull model in order to divide the preoperative skull into five regional cranial bones, such as the mean normal skull surface model. The deformed mean normal skull surface model is then redeformed into a postoperative skull model. In the step of quantifying skull shape deformation, the expansion and reduction indices are calculated using the positive and negative distance indices and the area ratio indices between the preoperative and the postoperative skulls.
2.1. Materials
This study was approved by the Institutional Review Board of Severance Hospital, Yonsei University College of Medicine, Seoul, Korea. For the evaluation of the effects of surgery, 78 pairs of head CT data from patients who underwent craniosynostosis surgery were used, consisting of 20 cases of severe sagittal synostosis, 7 of mild sagittal synostosis, 10 of severe bilateral coronal synostosis, 5 of mild bilateral coronal synostosis, 17 of unilateral coronal synostosis, and 19 of unilateral lambdoid synostosis. The levels of severity of sagittal and bilateral coronal synostoses cases were classified into cases with a CI of 0.75 or less and 1.0 or more, respectively. The mean ages of the subjects before and after surgery were 11.19 months (SD: 7.16 months, range: 2–36 months) and 27.94 months (SD: 10.44 months, range: 12–60 months), respectively, and the mean age interval before and after surgery was 17.16 months (SD: 7.64 months, range: 3–45 months). The generation of the mean normal model used CT data from 27 normal subjects, with an average age of 9.81 months (SD: 5.52 months, range: 3–22 months). CT images were acquired with six different high-speed multidetector systems (Siemens SOMATOM Sensation 64, Siemens SOMATOM Definition Flash and AS+, Munich, Germany, GE Healthcare LightSpeed VCT, GE Healthcare Revolution, GE Healthcare Discovery CT750 HD, Chicago, IL, USA). Each image had a matrix size of 512 × 512 pixels with an in-plane resolution of 0.25–0.46 mm, a slice thickness range of 0.63–3.0 mm, and 65–313 images per scan.
2.2. Preprocessing
To generate a skull surface model with which to observe the degree of bone deformation associated with the skull shape, it is necessary to segment the skull into a closed form without considering open sutures. For the generation of the outer surface of the skull in preoperative and postoperative CT images without distinguishing open sutures, bone voxels with an intensity greater than 200 Hounsfield Unit (HU) are segmented, and open suture voxels with an intensity lower than 200 HU are manually segmented. The space inside the skull is then filled by means of a hole-filling method, and the Marching Cube procedure [
13] is used to generate an outer surface model representing the entire skull morphology of the skull before and after surgery.
To divide the regional cranial bones separated by opened sutures, we generate a mean normal skull surface model from the shape of the normal skulls with clear sutures. To reflect age-specific shape differences, three mean normal skull surface models are generated for 3~6 months, 7~12 months, and 13~22 months, respectively, and each mean normal skull surface model [
14,
15] is generated through patch decomposition, patch parameterization, and correspondence establishment, as illustrated in
Figure 3a. In patch decomposition, each normal skull surface model is decomposed into five cranial bone patches (left and right frontal bones, left and right parietal bones and occipital bone) based on sutures. In patch parameterization, each cranial bone patch of a normal skull is mapped to a disc shape through barycentric mapping [
16]. In correspondence establishment, the point correspondences among corresponding cranial bone patches of reference normal skull surface model and other normal skull surface models are established through one-to-one mapping. The seven landmarks in
Figure 3a are arbitrary points on the cranial bone patch of the reference normal skull surface model and other normal skull surface models. Subsequently, the mean normal skull surface model is generated by averaging those corresponding points in the normal skull surface models.
Figure 3 shows three mean normal skull surface models and cranial bone patches, specifically left (green) and right (blue) frontal bones, left (yellow) and right (magenta) parietal bones, and occipital bone (red).
2.3. Regional Bone Partitioning and Shape Deformation Estimation
To divide each preoperative and postoperative skull surface model into five regional cranial bones and to estimate the degree of shape deformation between the preoperative and postoperative skull surface models, a mean normal skull surface model consisting of five regional cranial bones is deformed into a preoperative skull surface model and the deformed mean normal skull surface model is redeformed into the postoperative skull surface model.
To align the skull surface model and the mean-normal skull surface model, landmark-based registration is performed using five landmarks, the nasion, basion, opisthion, and two porions, selected from a relatively stable skull base, and the similarity transformations of the uniform scale, translation, and rotation are searched [
17].
To adjust the scale difference between the skull surface model and the mean normal skull surface model and to correct the position error caused by the scale transformation, alternate surface- and landmark-based registrations are performed repeatedly. The surface-based registration is accomplished by minimizing Gaussian-weighted distance measures using a Gaussian-weighted narrow-band distance map [
18]. In the Gaussian-weighted narrow-band distance map, the Gaussian weight is assigned to the surface points of the skull surface model, and the narrow-band width set to 20-pixels. To correct the positional error that arises again when scaling between the skull surface model and the mean normal skull surface model, the mean normal skull surface model is realigned into the skull surface model using landmark-based registration with translation and rotation, but not scale.
To calculate the local deformation between preoperative and postoperative skull surface models, the mean normal skull surface model is deformed in turn into a preoperative and postoperative skull surface models using B-spline interpolation [
19].
Figure 4 shows the deformation process of the mean normal skull surface model associated with preoperative and postoperative skull surface models.
2.4. Quantification of Shape Deformation
To assess the degree of skull correction after surgery, it is necessary to quantify the expansion and reduction of the regional cranial bones between the preoperative and postoperative skulls. Therefore, we propose an expansion and reduction indices using the positive and negative regional top distance indices and the positive and negative regional area ratio indices.
First, the regional distance is the distance value representing the degree of correction that has been extended or reduced from the bones of each part of the skull before surgery to the skull after surgery, and the regional area ratio is the proportion of areas where correction is expanded or reduced in the bones of each part of the skull before surgery. The regional distances and the regional area ratio indices are calculated using the local deformation calculated during the deformable registration process. The local deformation (LD) value is calculated according to the magnitude of the displacement vector of the deformable registration in Equation (1), and the sign of the local deformation is determined by the direction of movement of the mean normal skull surface model that is deformed toward the inside or outside of the postoperative skull surface model.
where
i is the point of the mean normal skull surface model and
Vi is the magnitude of the displacement vector of the deformable registration.
Second, to represent the degree of major deformation in the expansion and reduction measures of the regional cranial bone in the deformed mean-normal skull surface model, the positive and negative regional top distance indices (PTD and NTD) are calculated as the average values of the positive and negative top 20% regional distances in Equations (2) and (3), respectively.
where
LD(i) is the signed local deformation distance at point
i and
Np20 and
Nn20 are the number of points with positive and negative top 20% local deformation distances, respectively.
To represent the degree of distribution of the expanded and reduced areas of the regional cranial bones in the deformed mean normal skull surface model, the positive and negative regional area ratio indices (PAR and NAR) are calculated as the ratio of areas with corresponding positive and negative local deformation distances in the regional cranial bone area in Equations (4) and (5), respectively.
where
Nall is the number of points in each cranial bone and
Np and
Nn are the number of points with the positive and negative local deformation distances, respectively.
Finally, to consider the major degree of expanded and reduced correction in the regional cranial bone and the area distribution in which the correction occurred, the expansion and reduction indices are calculated by multiplying the positive and negative regional top distance indices by the positive and negative regional area ratio indices, respectively.
3. Results
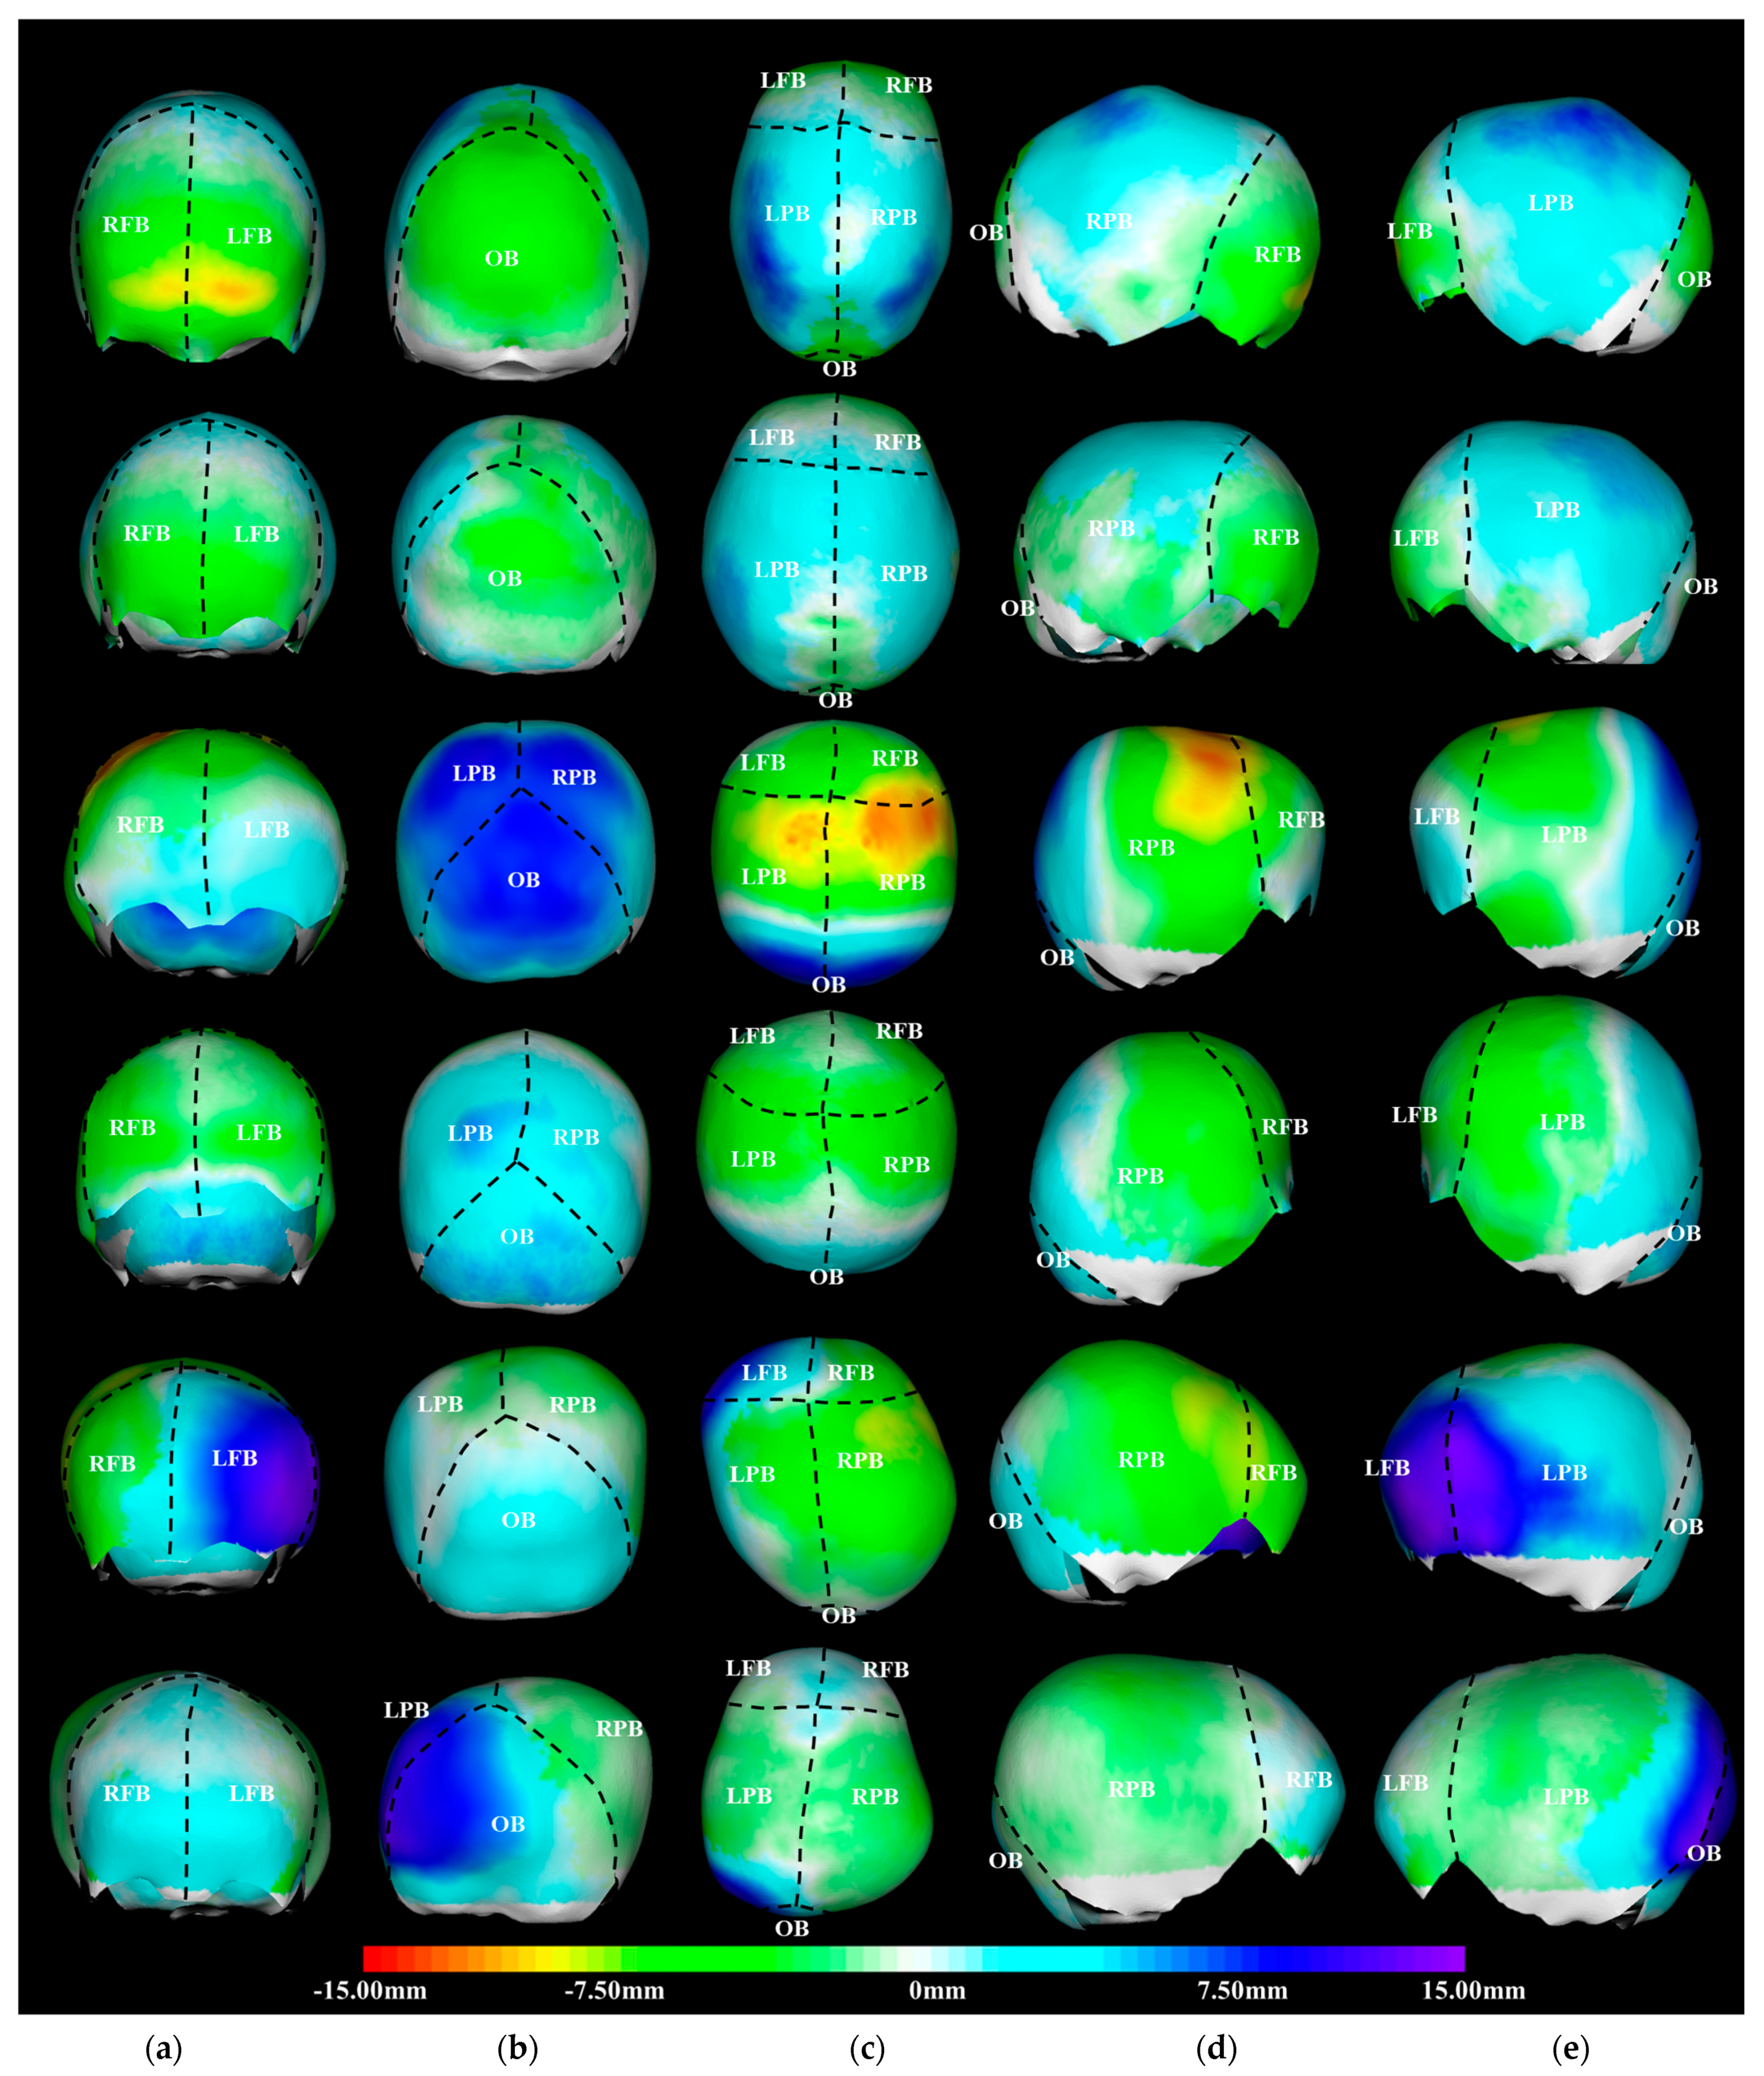
The evaluation of the shape deformation of the skull before and after surgery was performed qualitatively and quantitatively. In the qualitative evaluations, the results of the color mapping of the local deformation are visually presented for the degrees of expansion and reduction between the preoperative skull and the postoperative skull, while in the quantitative evaluations, the proposed expansion and reduction indices of the regional cranial bones are presented.
Figure 5 shows representative examples of the color-coded visualization of shape deformation (mm) in the skulls before and after surgery for severe and mild sagittal synostosis, severe and mild bilateral coronal synostosis, unilateral coronal synostosis, and unilateral lambdoid synostosis. For color-coded visualization, expansion is represented by cyan, blue, and purple, and reduction is represented by green, yellow, and red. With regard to severe sagittal synostosis, the entire parietal bones were expanded; specifically, the upper part of the parietal bone was significantly expanded, while the forehead area of the frontal bones and the entire occipital bone were reduced. In mild sagittal synostosis case, some parts of the parietal bones were slightly reduced, and the entire cranial bone was expanded and reduced but lower than in severe sagittal synostosis cases. For severe bilateral coronal synostosis, the forehead area of the frontal bones and posterior part of the parietal bones were expanded, with especially the occipital bone significantly expanded, while the upper part of frontal bones and the parietal bones overall were significantly reduced. In mild bilateral coronal synostosis case, the entire cranial bone showed less expansion and reduction than in severe bilateral coronal synostosis case. For unilateral coronal synostosis, the entire left frontal bone and the front part of the left parietal bone were significantly expanded, and the entire occipital bone was slightly expanded, while the entire right frontal and parietal bones were reduced. In unilateral lambdoid synostosis case, the entire frontal bones were slightly expanded, specifically, the posterior part of the left parietal bone and left part of the occipital bone were significantly expanded, while the anterior part of the parietal bones and the right part of the occipital bone were slightly reduced.
Table 1 shows the average values of the expansion and reduction indices for all subjects with representative synostoses of craniosynostosis. In the sagittal synostosis case, the preoperative skull has a biparietal narrow and elongated form. However, after surgery, the quantification results showed that the frontal and occipital bones were reduced, and the parietal bones were expanded. In severe case, the expansion and reduction indices were greater than those in mild case; specifically, the reduction index in the occipital bone showed a considerable difference. In the bilateral coronal synostosis case, the clinically preoperative skull has a biparietal broad and short form. However, after surgery, the quantification results showed that the frontal bones were reduced, the parietal bones were similarly expanded and reduced, and the occipital bone was expanded. In severe case, the expansion and reduction indices were greater than in mild case, and the expansion index of the occipital bone especially showed the highest among all reduction and expansion indices. With regard to unilateral coronal synostosis, the preoperative skull has a forehead asymmetry and a short form. However, after surgery, the quantification results showed that left frontal and parietal bones and occipital bone were expanded while the right frontal and parietal bones were reduced. For unilateral lambdoid synostosis, the preoperative skull shows posterior skull asymmetry. However, after surgery, the quantification results showed that the left parietal bone was expanded, while the right parietal bone was reduced and the frontal and occipital bones were expanded.
4. Discussion and Conclusions
In this paper, we proposed a quantification method for evaluating surgical effects on regional cranial bones by comparing preoperative and postoperative skull shapes. The contributions of the proposed method are threefold.
First, we quantified the effects of surgery according to the shape deformation of each cranial bone in the preoperative and postoperative skull shapes from head CT images. Most previous studies used preoperative and postoperative 3D scan datasets to quantify morphological changes of the head surface. However, quantification of morphological changes using 3D scan data is limited when quantifying the shape deformation of each cranial bone.
Second, we analyzed the effect of surgery on patients with craniosynostosis of the regional cranial bones using an age-matched mean-normal skull surface model generated from normal skulls consisting of five cranial bones based on open sutures.
Third, to compare the skull shape before and after surgery, we quantified the degree of regional expansion and reduction caused by correction of skull deformities via surgery. Here, expansion means that the reduced regional bone due to the restricted growth of the preoperative skull is expanded similarly to a normal skull after surgery, and reduction means that the expanded regional bone due to the compensatory growth of the preoperative skull shape is reduced similarly to a normal skull after surgery.
Most previous studies suggest that the CI and the CVAI are the most common measure for evaluating the surgical effects in cases of craniosynostosis. The CI is used as a severity index for sagittal and bilateral coronal cases characterized by a symmetric shape, while the CVAI is used as a severity index for unilateral coronal and unilateral lambdoid cases characterized by an asymmetric shape.
Table 2 shows the average value of the CI and CVAI for the preoperative and postoperative skulls for all subjects with representative synostoses of craniosynostosis. It showed that the CI in severe sagittal synostosis case increased similarly to a normal skull after surgery, while the CI in severe bilateral coronal synostosis case decreased similarly to a normal skull after surgery. Additionally, it showed that the CVAI in unilateral lambdoid case significantly decreased after surgery, but the CVAI of the preoperative skull in unilateral coronal case was mostly a mild deformity and slightly decreased after surgery. Thus, it can be confirmed that the two indices represent the effect of overall skull correction before and after surgery, but it is difficult to quantify regional morphological changes such as expansion or reduction of the five regional bones divided by sutures.
In this study, we analyzed the effects of surgery on patients with craniosynostosis of regional cranial bones using proposed reduction and expansion indices considering the distance and area ratio. In cases involving sagittal synostosis with a long and narrow shape, the frontal and occipital bones showed a large reduction index, and the parietal bones showed a large expansion index. In cases of bicoronal synostosis with short and high features, the frontal and parietal bones showed a large reduction index, and the parietal and occipital bones showed a large expansion index. In cases of unilateral bicoronal synostosis with an asymmetric shape, the right frontal and parietal bones showed a large reduction index, while the left frontal and parietal bones and occipital bone showed a large expansion index. In cases of unilateral lambdoid synostosis with an asymmetric shape, the right frontal and partial bones showed a large reduction index, and the left frontal and parietal bones and occipital bone showed a large expansion index. These large reduction indices indicated that the area of the regional bone was reduced after surgery, while these large expansion indices indicated that the area of the regional bone was expanded after surgery. Therefore, the proposed quantification method overcomes the limitation of quantification difficulty when using the traditional CI by analyzing regional cranial bones and providing useful information with which to quantify surgical effect for craniosynostosis patients with symmetric deformity as well as craniosynostosis patients with asymmetric deformity.


