Article

Vertical Vibrations of Footbridges Due to Group Loading: Effect of Pedestrian–Structure Interaction

1
Faculty of Civil Engineering, Wrocław University of Science and Technology, Wybrzeże Wyspiańskiego 27, 50-370 Wrocław, Poland
2
Departmento de Eng Civil e Ambiental—Campus Universitário sn, Universidade Federal da Paraíba, João Pessoa 58051-900, Brazil
3
Programa de Pos Graduação em Engenharia Civil e Ambiental—Campus Universitário sn, Universidade Federal da Paraíba, João Pessoa 58051-900, Brazil
4
Departmento de Arquitetura e Urbanismo—Campus Universitário sn, Universidade Federal da Paraíba, João Pessoa 58051-900, Brazil
*
Author to whom correspondence should be addressed.
Appl. Sci. 2021, 11(4), 1355; https://doi.org/10.3390/app11041355
Submission received: 17 December 2020 / Revised: 21 January 2021 / Accepted: 27 January 2021 / Published: 3 February 2021
(This article belongs to the Special Issue Bridge Dynamics: Volume II)

Abstract

:

Featured Application

Improvement of procedures for the vibration serviceability of footbridges in the vertical direction by taking into account the presence of pedestrians as part of the dynamics of the system.

Abstract

The vibration serviceability of footbridges has evolved from the adoption of a single pedestrian crossing in the resonance condition to load cases in which several pedestrians cross the structure simultaneously. However, in spite of this improvement, pedestrians continue to be considered as applied loads in codes of practice. Recent research has pointed out that modeling pedestrians as dynamic systems is a step further in the search for a more realistic design approach. This is explored in this paper, focusing on the case of vertical vibration. A two-span cable-stayed test structure was selected, and accelerations were measured from single and group crossings, both at the structure and at a pedestrian’s waist. Numerical simulations considering the pedestrians modeled as loads only and also as dynamic systems were implemented, and numerical and experimental time response vibration signatures were compared. Reductions of up to 25% and 20% in peak and RMS acceleration, respectively, were obtained when pedestrians were modeled as dynamic systems, in comparison with the less realistic model of pedestrians as loads only. Such reductions were shown to depend on the number of pedestrians involved in the group. The results, thus, highlight that pedestrian–structure interaction is an asset for the vibration serviceability design of footbridges.

1. Introduction

Footbridges are designed for the conveyance of pedestrians. Vibrations induced by the latter during the normal use of the structure have long been recognized as a design problem in terms of a serviceability limit state. The features of walking are such that pedestrians can cause vibrations in the vertical or lateral direction. Several case reports of footbridges that presented excessive vibrations can be found in the literature [1,2,3,4,5,6,7,8]. Two major groups of such structures can be distinguished: the group in which footbridges presented excessive vibration in the lateral direction [1,2,3,4,6], and the other group presenting excessive vibration in the vertical direction [1,5,6,7,8]. In the former, the lateral natural frequencies of such lively footbridges are within the usual range of half of pedestrian pacing rates. This is because a complete cycle of body movement in the lateral direction requires two steps to be taken. Such critical lateral natural frequencies are around 1.0 Hz and are usually associated with long-span footbridges, above 100 m long. In the latter, the structures presented natural frequencies in the vertical direction within the usual range of the pacing rates of pedestrians. These natural frequencies may be associated with footbridges having spans of around 60 m or associated with lightweight, easily excited structures [9,10]. Detailed, advanced studies on human movement when walking or running on footbridges can be found, e.g., in [11,12].
This vibration problem has been dealt with by codes of practice. One such code that first tackled vibrations in the vertical direction was the British code BS 5400 [13]. Two features of this code are worth calling attention to: a single pedestrian was considered as the design load, and the action of the pedestrian was represented as an oscillatory moving force. Later on, more realistic design conditions were conceived, in which the load case was now due to a group of pedestrians walking together or a stream (crowd) of pedestrians [14,15,16]. However, pedestrians continued to be considered as moving forces acting on the structure. A compromise of the effect regarding the presence of pedestrians not only as loads is considered by the Setra [15] and Hivoss [16] guidelines, in which a fraction of the mass of the pedestrians is added when calculating the natural frequency of the structure.
A collection of results from recent research has emphasized the role of pedestrians as dynamic systems that interact with the vibrating structure [17]. From a historical perspective, one of the first works that proposed the inclusion of pedestrians as dynamic systems was that of Archbold [18]. This was more of a procedure than an analytical formulation, in which the moving force was applied together with a single-degree-of-freedom spring-mass-damper (SMD) model to consider the pedestrian action as a dynamic system. Elaborate analytical formulations for SMD models of single pedestrians have been further proposed [19,20,21,22,23,24], in which the interaction between pedestrian and structure can be included in the formulation. These models have been discussed, and a basic SMD model has been appointed as potentially representative of the pedestrian’s dynamic action [25].
The presence of pedestrians affects at least the mass and damping of the vibrating system and has resulted in reductions in the overall vibration levels, when compared to results obtained by considering pedestrians as loads only [25,26]. However, the dynamic effect of several pedestrians crossing the structure simultaneously still remains a less investigated aspect of the design, particularly with the support of experimental data.
The aim of this paper is to deepen the investigations of pedestrian–structure interaction, applicable to the vibration serviceability of footbridges in the vertical direction. The focus is on loads due to groups walking together, which is one of the load cases considered in the design [14]. This is carried out through tests on a two-span cable-stayed footbridge, together with simulations of the structural response considering both options for modeling pedestrians, that is, force-only and dynamic systems. Time response signatures from sets of both experimental and numerical results are compared to highlight the need to model pedestrians as dynamic systems, and also to investigate the effect of the number of pedestrians in the group in terms of differences between the two modeling options.

2. Materials and Methods

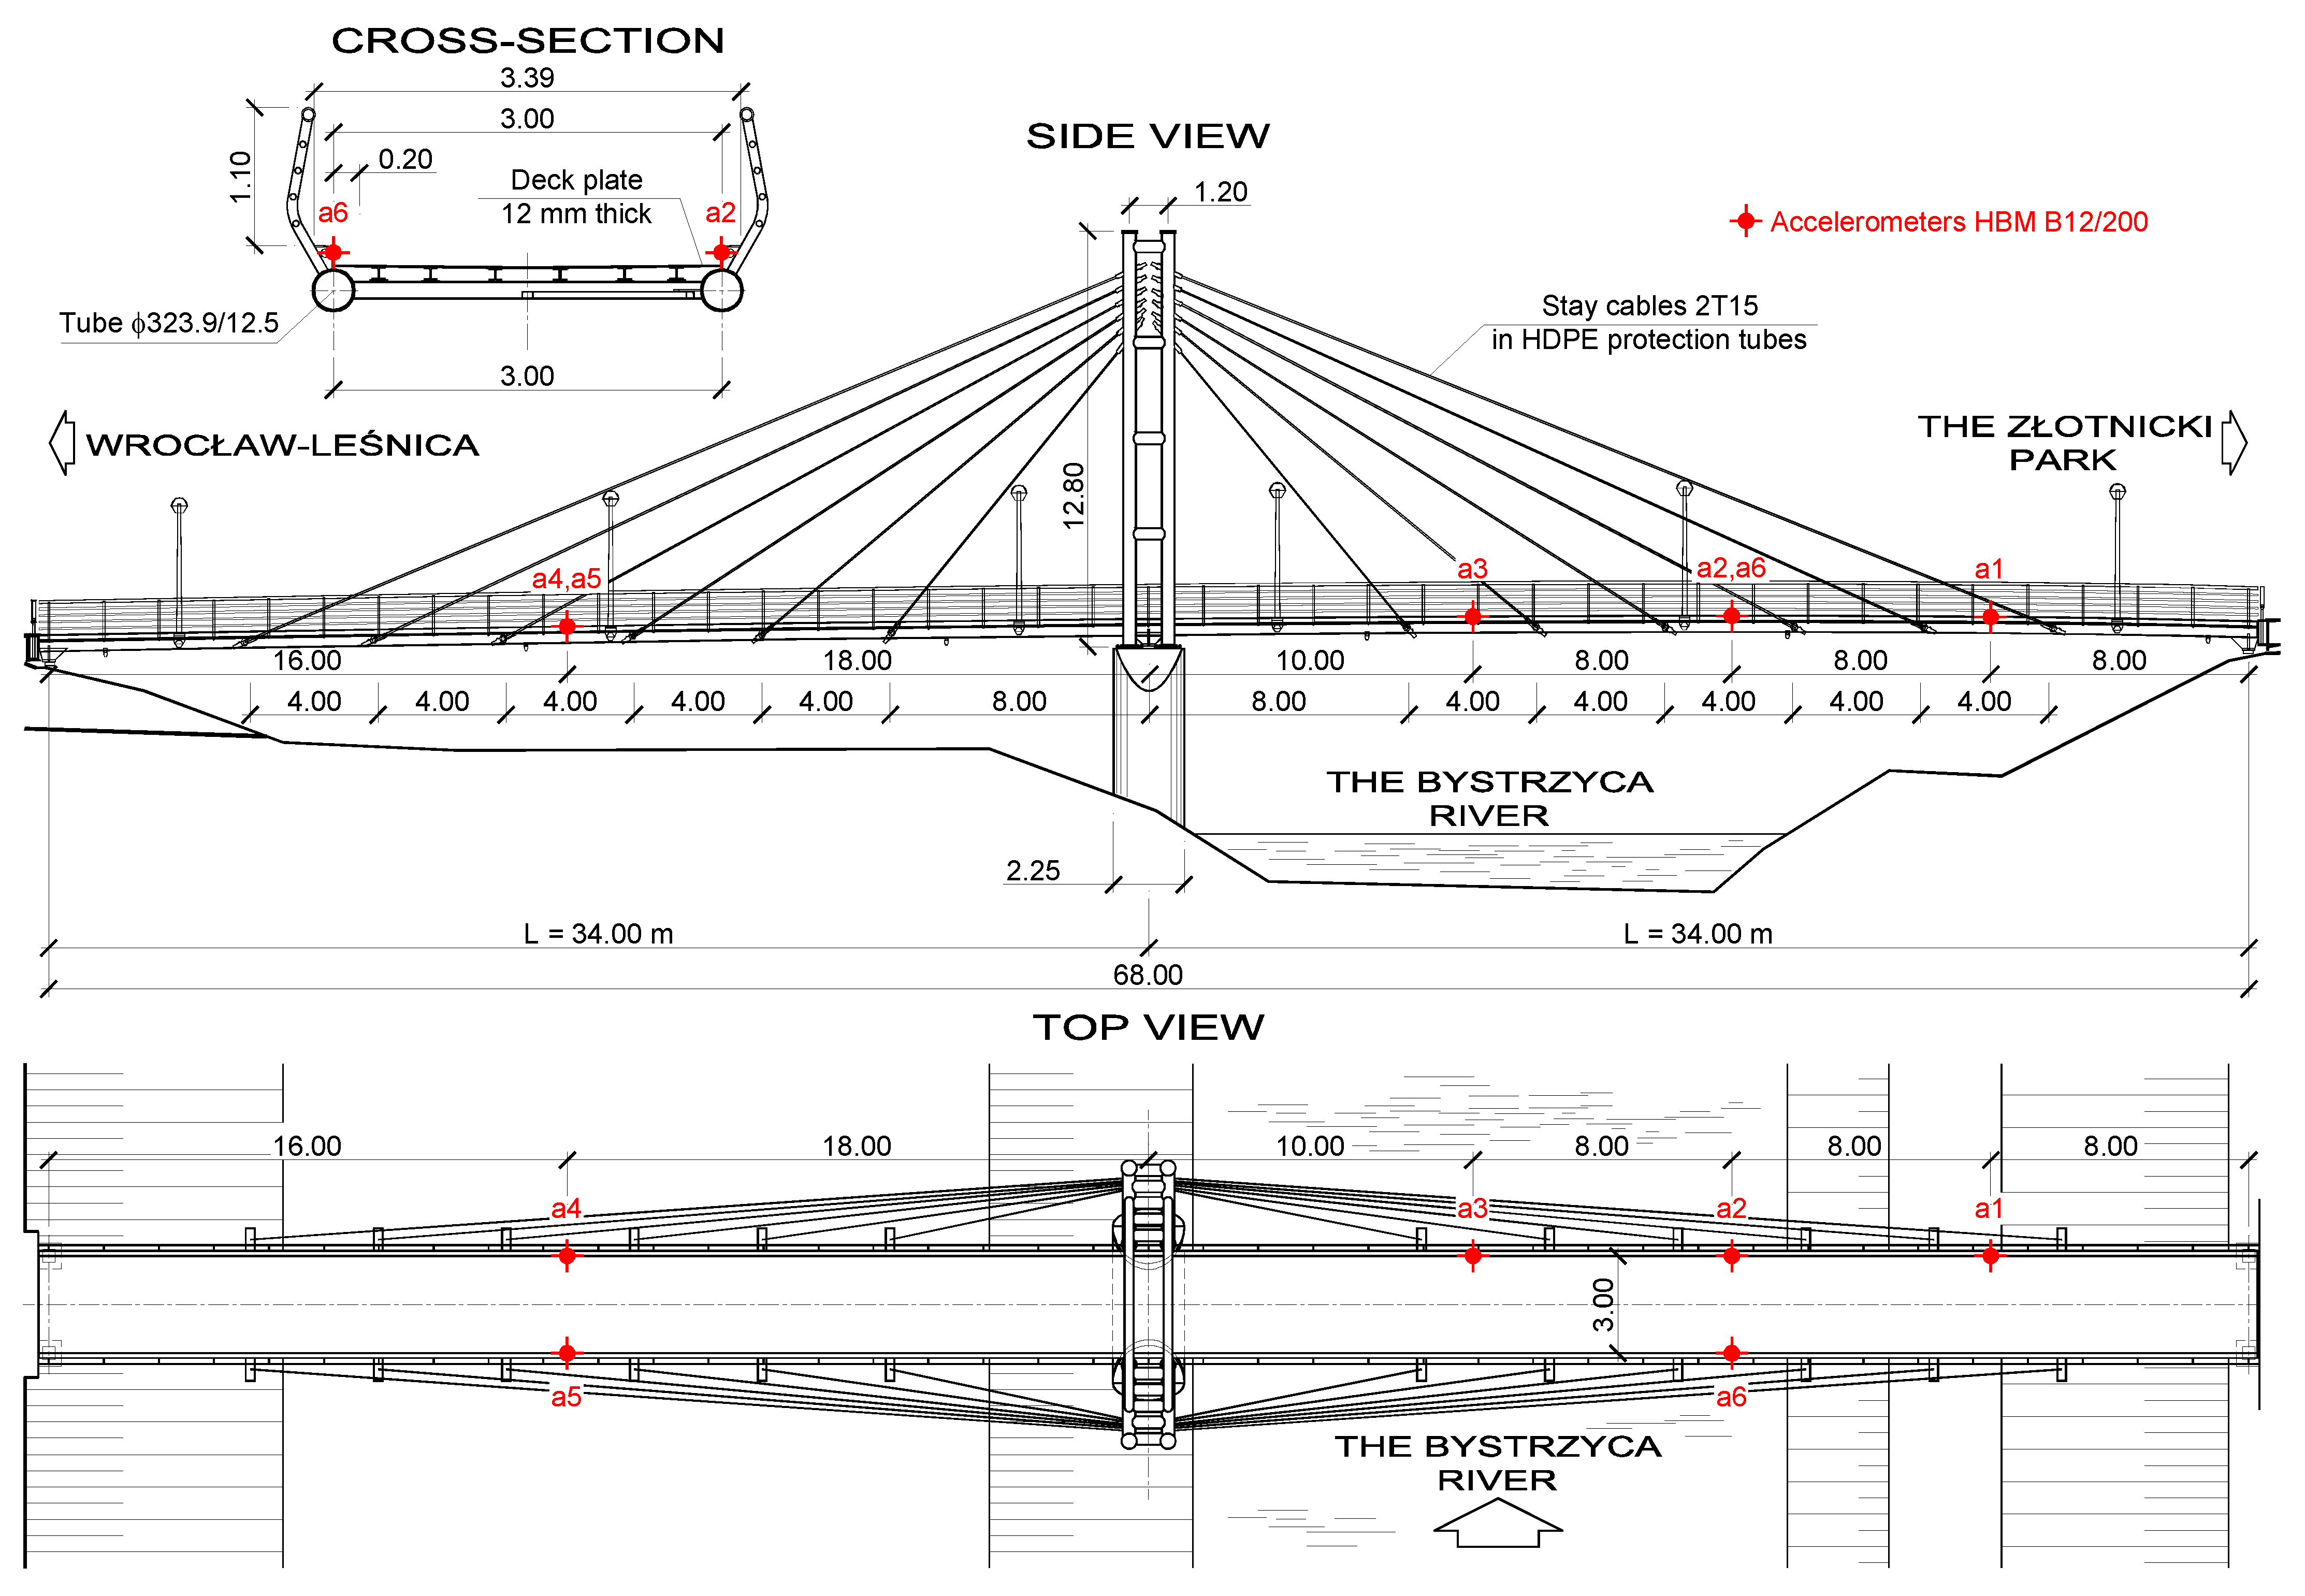
2.1. Test Structure and Pedestrian Tests

The structure selected was a 68.0 m long two-span cable-stayed footbridge named Złotnicka after its location in Złotnicki Park in Wrocław, Poland. It has central pylons to support the deck and to which the stays are attached (Figure 1 and Figure 2). Selection of the structure adhered to both technical and logistical requirements. From the technical point of view, the structure had a natural frequency in the vertical direction within the range of the pacing rates of pedestrians and presented perceptible vibrations when crossed by them. In terms of logistics, it was in quiet environment with sparse use, enabling a controlled test program to be carried out.
The following design situations were applied to this footbridge: from the Hivoss guideline [16], a traffic class TC1 (very weak traffic) was considered. On the other hand, an appointed comfort class CL3 (minimum degree of comfort) was targeted, which would be related to a limit of vertical peak accelerations between 1.0 and 2.50 m/s2. This corresponds to Traffic Class III (footbridge for standard use) and minimum comfort, according to the Setra guideline [15]. In the UK NA to BS EN 1991-2 [14], the accepted peak acceleration limit would be 1.3 m/s2, obtained by considering the structure as a suburban crossing and its respective height above ground. This vibration limit is compatible with the aforementioned range proposed in the Hivoss guideline [16].
The structure was the subject of previous investigations, and detailed information regarding its geometry and finite element (FE) modeling can be found elsewhere [27]. Herein, the focus is on the properties of interest for the purposes of this paper. A measured natural frequency of 2.07 Hz was identified, corresponding to the first vertical antisymmetric mode of vibration, with a node at the central support. Relevant mode shapes are shown in Figure 3 from the calibrated FE model. The modal mass related to this mode was also calculated from the calibrated FE model and had a value of 22,205.8 kg. By employing the natural frequency and the modal mass, the modal stiffness was calculated using the expression of the natural frequency of a single-degree-of-freedom system. This modal mass was scaled by considering a unity value for the maximum ordinate of the modal shape of the first mode. Regarding damping, the value was obtained from the tail end of the pedestrian tests and is discussed in the Section 3.
Ten test subjects volunteered to take part in the experimental campaign (Figure 4). A metronome was employed during the crossings, and the reason for this was twofold: excitation in the resonance condition is the target of the codes of practice for designing footbridges against vibration serviceability, and the level of excitation should be as high as possible for the interest of this investigation. Therefore, the beating of the metronome was set to help the test subjects to walk with a constant pacing rate in order to excite the first mode of vibration in the resonance condition.
The test subjects, eight males and two females, were arranged in military formation to help keep the distances between them constant and also characterize a group loading. The leading pedestrian was in front carrying the metronome and was instrumented with an HBM GmbH (type B12/200) accelerometer attached to his waist (Figure 4a), whereas the other accelerometers remained near the antinode of the first mode shape (see Figure 1 and Figure 3). The other test subjects were arranged according to Figure 4d. The mass of each test subject is shown in Table 1 and was employed in the numerical simulations. In addition, each test subject crossed the footbridge alone using the metronome to control the step frequency. A total of 110 tests were conducted for this experiment, 10 for the crossings of each individual (Figure 4b) plus 10 for the group crossing (Figure 4c), to account for the expected variability among the crossings, even in controlled situations.

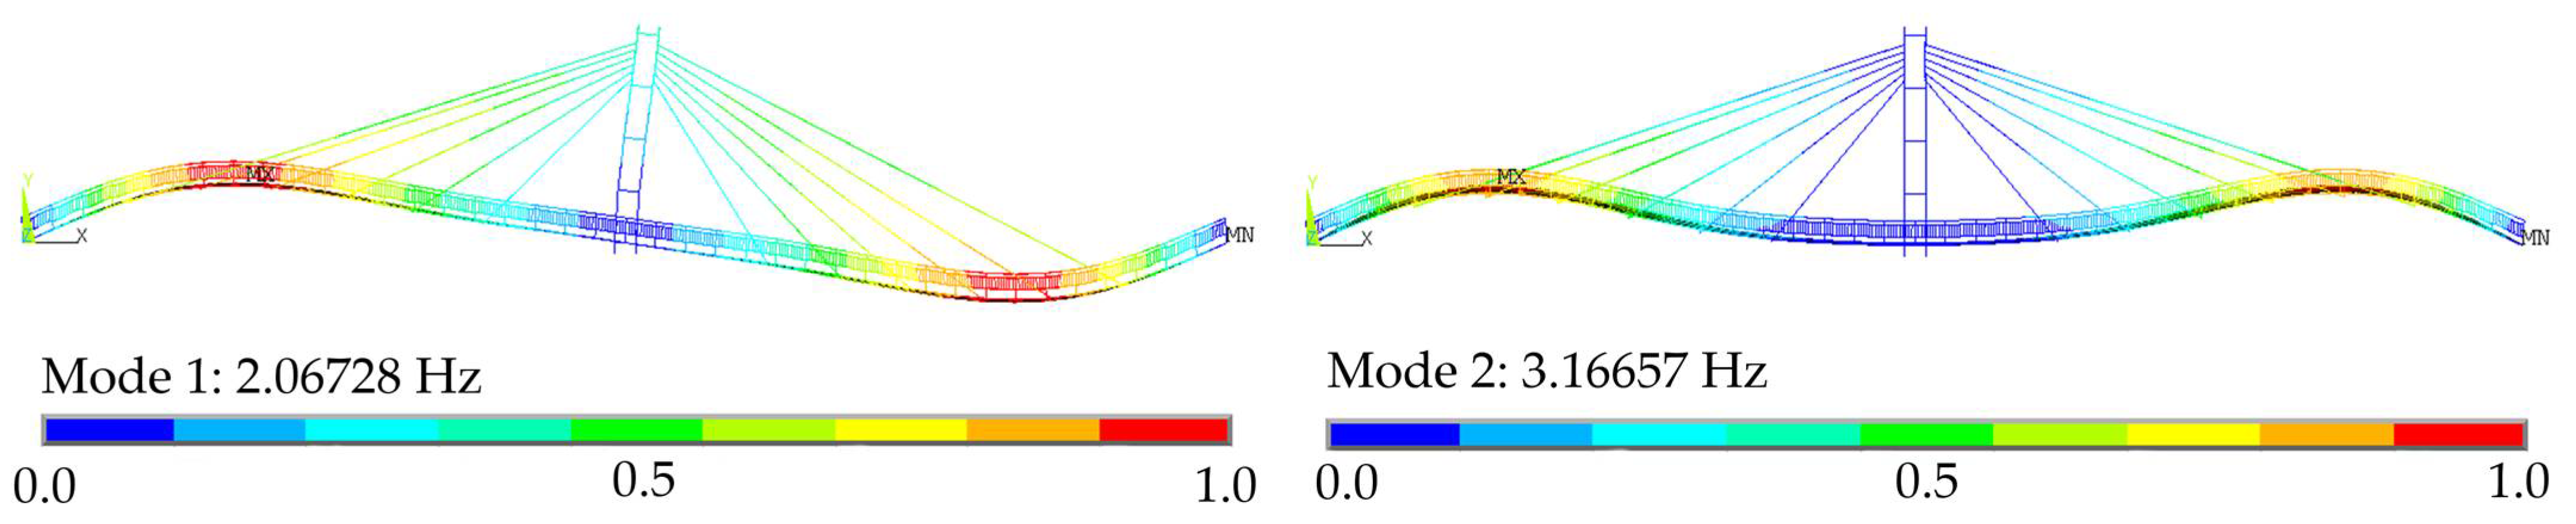
2.2. Procedure for Numerical Simulations

In order to consider pedestrian–structure interaction, a modified version of the interaction model originally proposed by Pfeil et al. [20] was selected to represent the dynamics of the pedestrian body. This is a single-degree-of-freedom model to represent the pedestrian body, and it presented good results in a previous work [25]. The parameters of the body (modal mass mp, damping cp and stiffness kp) were obtained from regression expressions [28] for each test subject as a function of the total subject mass Mp (see Table 1) and pacing rate fp. Reference values of these parameters for each pedestrian are shown in Table 2 for a pacing rate of 2.07 Hz. For the sake of completeness, the expressions employed to obtain these parameters are reproduced below:
mp = 97.082 + 0.275Mp − 37.518fp
cp = 29.041mp0.883
kp = 30351.744 − 50.261cp + 0.035 cp2
Then, by using the modal solution and considering the response of the structure due to the first mode of vibration only, a coupled system (pedestrian–structure) with two degrees of freedom was formulated, in which one degree of freedom represents the generalized displacement yi for mode i, and the second degree of freedom is called the interaction displacement up of the pedestrian’s center of mass (at waist level). The coupled system of equations reads [25]:
M   U ¨   +   C   U ˙   +   K   U   =   F
where
M   =   [ m i 0 0 m p ] ,   C   =   [ c i   +   ϕ i 2 c p ϕ i   c p ϕ i   c p c p ] ,   K   =   [ k i   +   ϕ i 2 k p ϕ i   k p ϕ i   k p k p ] , F   =   { ϕ i   F ( t ) 0 }   and   U   =   { y i u p }
In Equation (4), mi is the modal mass of the first mode of the structure, ki and ci are the respective generalized structural stiffness and damping for that mode, and φi(x) is the respective mode shape, x standing for the pedestrian position at the structure, taken with respect to the left support. It should be noted that the variable x is not shown in mode shape φi in Equation (4) for the sake of conciseness. The variable t is the time (in s), and the force F(t) stands for the ground reaction force exerted by the pedestrian when walking on a rigid surface. The classical Fourier expression of such a force was adopted [29] considering only the first harmonic of the walking load:
F ( t )   =   W   ( 1   +   D L F   sin ( 2   π   f p   t     θ ) )
In Equation (5), W is the pedestrian weight (in N), fp is the pedestrian pacing rate, θ is a phase difference, and DLF stands for the dynamic load factor, the value of which for each pedestrian is to be obtained from the tests and simulations and is presented in the Section 3. Finally, the physical displacement vp at point xp, where the measurements are taken, is obtained from the generalized displacement yi by the following expression:
vp = φi(xp) yi
Equation (4) is adapted to analyze the modeling of the pedestrians as force-only by setting the pedestrian body parameters to null values.
This modeling approach was preferred in comparison with a full finite element analysis, because it takes into account the interaction between pedestrians and the structure and considers vibrations in a single mode without loss of accuracy, but with a much quicker execution time. Full details of this approach can be found in [25].

3. Results and Discussions

The following investigations were carried out according to this sequence of steps: (a) obtaining the structural damping ratio (so as to use it in Equation (4)); (b) obtaining the DLF of each pedestrian from single crossings; (c) comparing the results for group loadings between measurements and simulations; and (d) investigating the effect of the number of pedestrians on the two modeling approaches (force-only and dynamic systems).

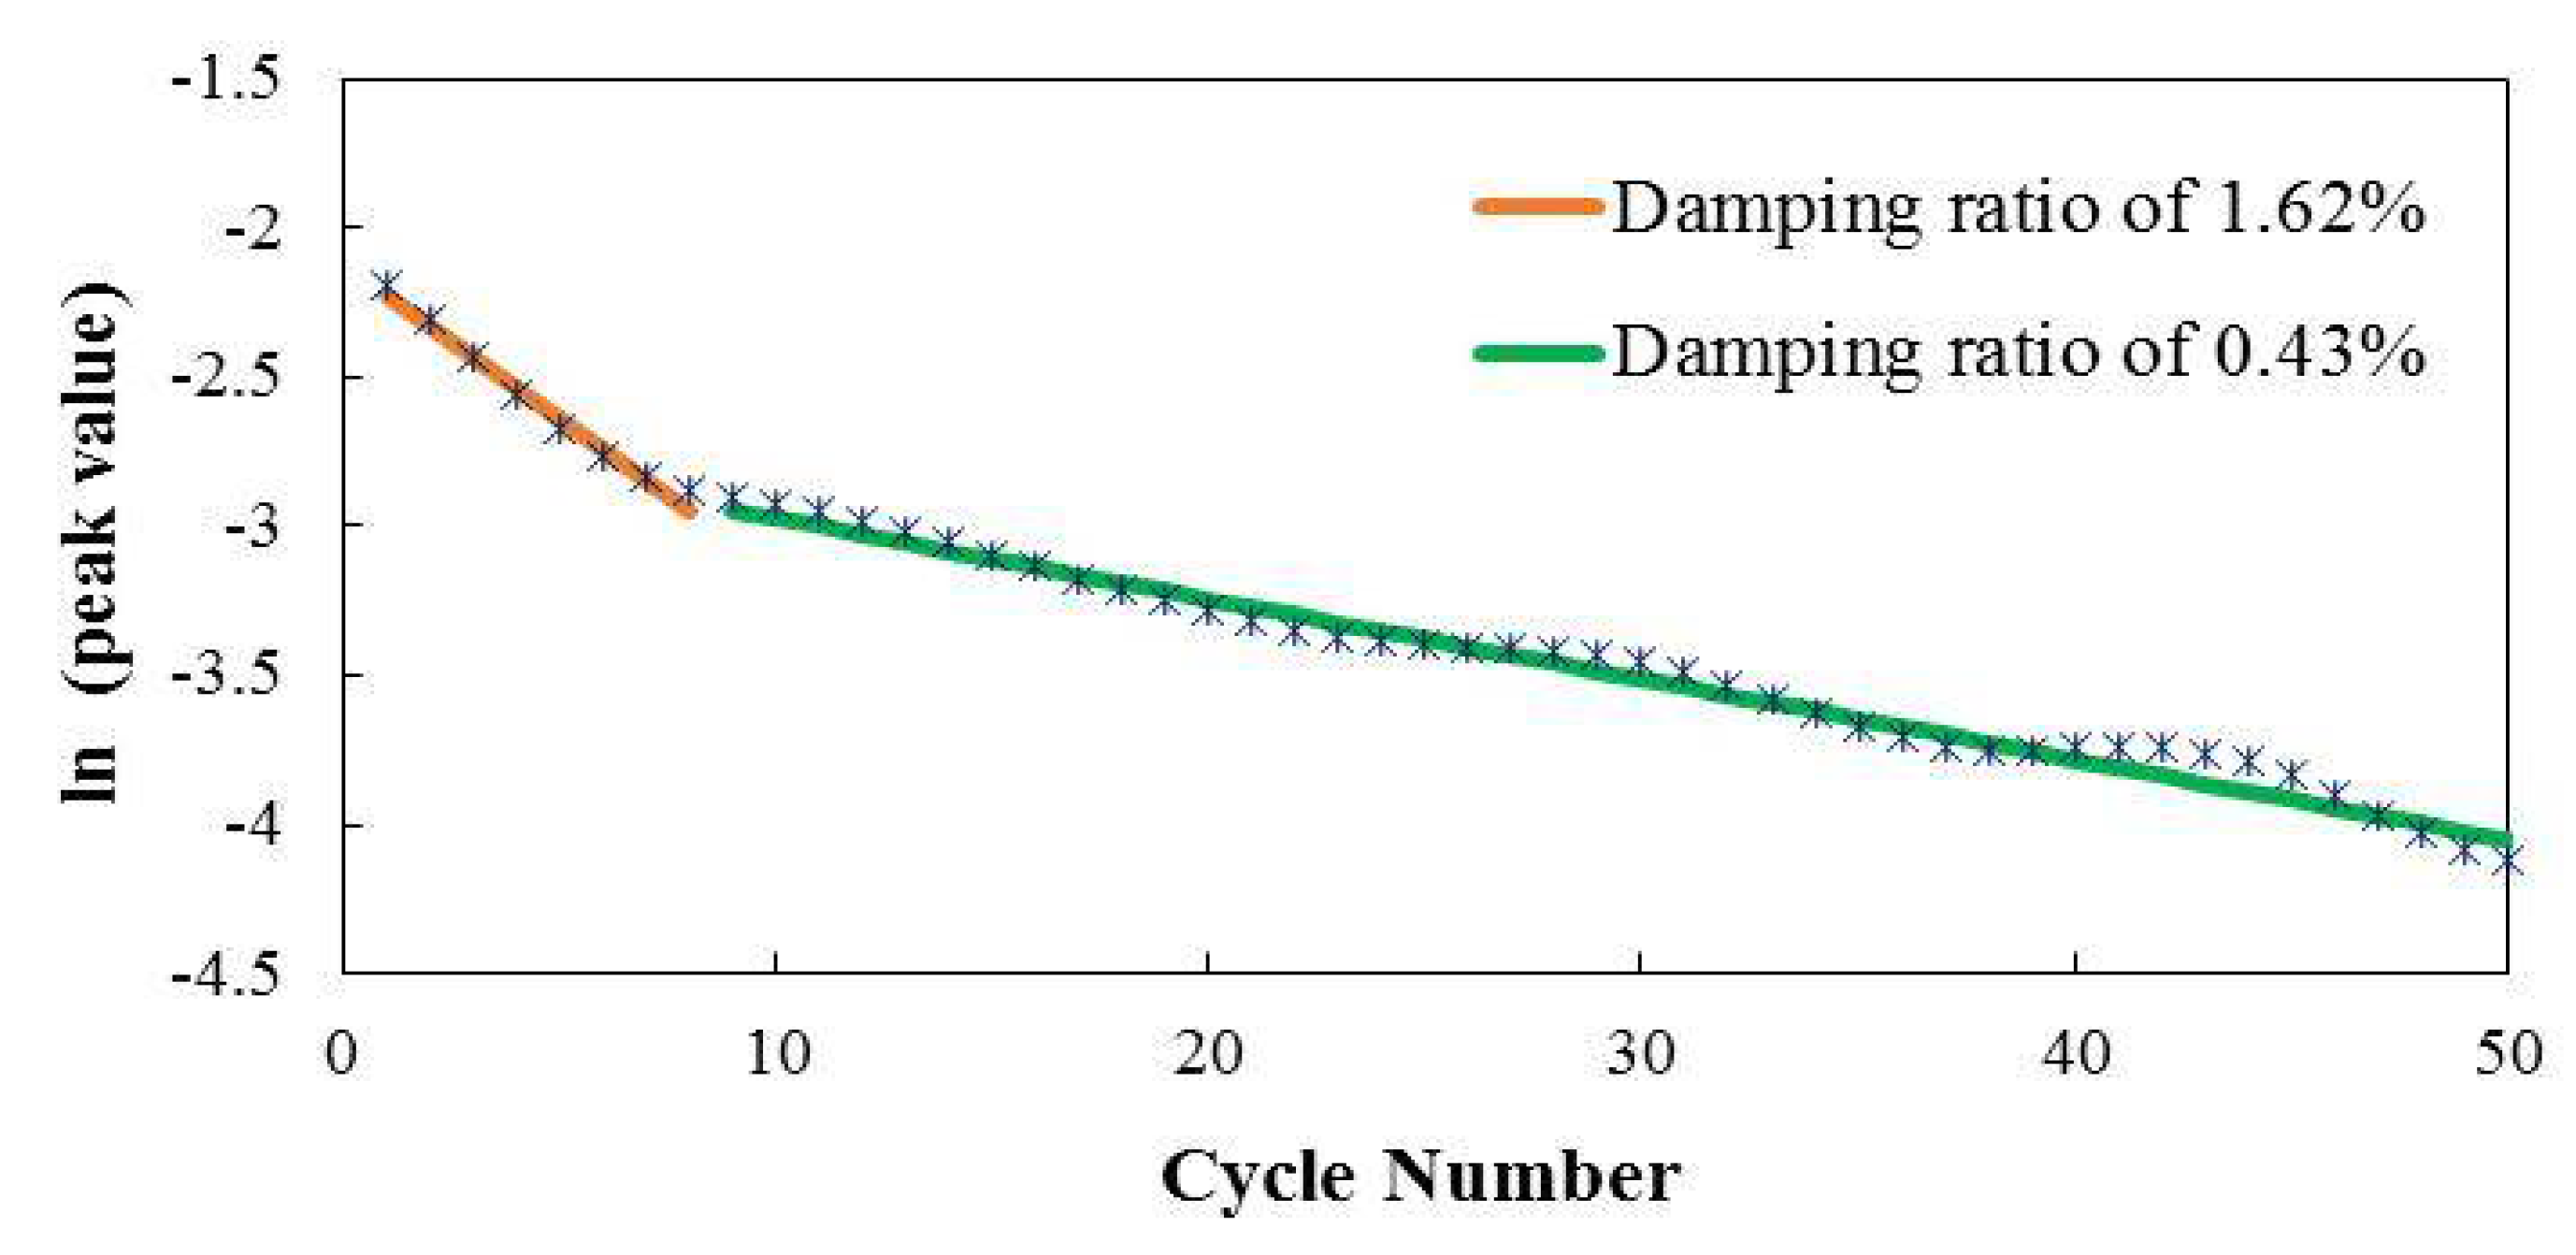
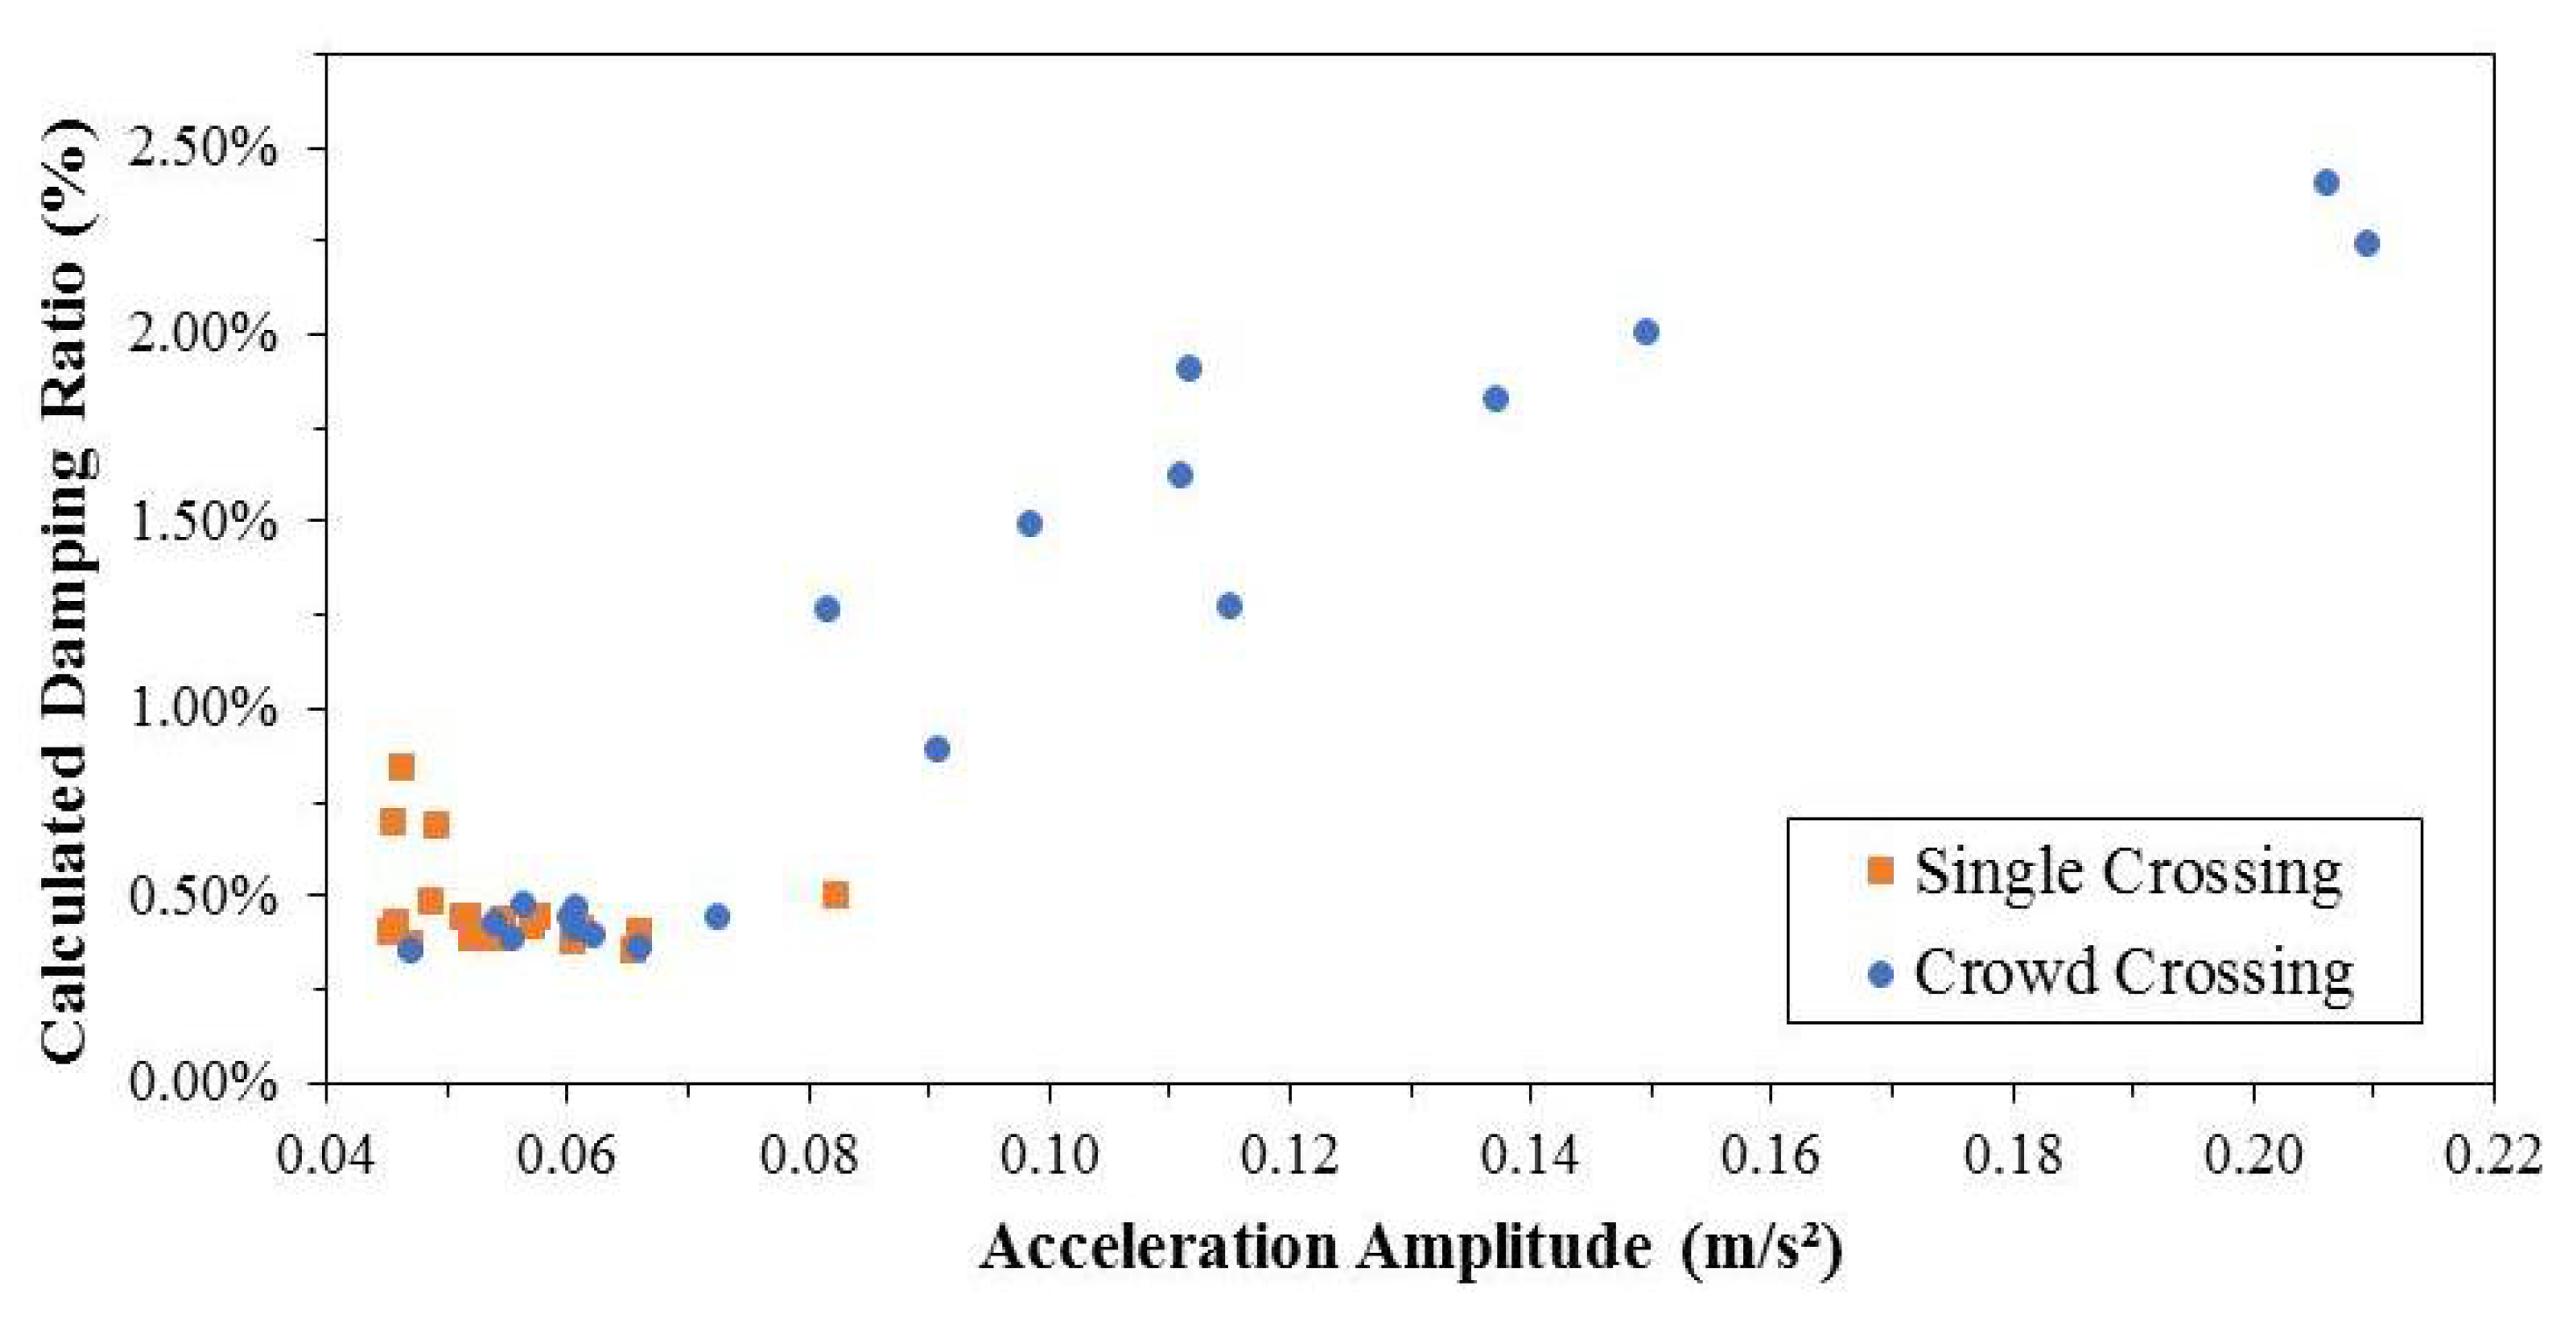
3.1. Obtaining Structural Damping and the DLF of Each Pedestrian

As previously mentioned, the structural damping was obtained from the tail end of the pedestrian tests, after the test subjects left the structure. This was carried out by adjusting straight lines to a plot of the logarithm of peak values of the decay versus number of cycles, as shown in Figure 5. The slope of the straight line is the damping, in terms of logarithmic decrement. However, it was soon realized that damping had a strong dependence on the vibration level, which can be seen from the variation in the slopes in Figure 5. This was also noted by comparing the damping ratios obtained from single and group crossing signals, the latter presenting higher vibration levels than the former. A collection of damping ratios obtained from several crossings are shown in Figure 6, taking as a reference the value of the acceleration amplitude at the beginning of the region of the decay signal that was employed for the respective calculation.
This nonlinear behavior adds a degree of uncertainty to the determination of the DLF of each pedestrian, since damping would in principle vary during the crossing. Another factor to take into account is the small changes in walking rhythm, in spite of using a metronome. The effect of these changes is considered by employing the vibration signal measured at the pedestrian’s waist to identify changes in the pedestrian pacing rate during the crossing. Such changes also imply the adjustment of the pedestrian body parameters during the crossing (see Table 2 for reference values), as they depend on the pacing rate.
The DLFs were, thus, obtained by adjusting the numerical vibration signature to the respective measured one for several crossings of each pedestrian. A trial-and-error strategy was adopted according to the following rules of thumb: (a) changes in the value of the DLF affect only the amplitude of the response signal; and (b) changes in damping affect both the shape and the amplitude of the response signal. Damping ratios were adjusted to values of around 1.6% in the majority of cases. The selection of this value for damping was based on observed acceleration amplitudes during the crossing and the corresponding values for the damping ratios shown in the plot of Figure 6.
Intra-subject variability is also expected, as shown in Figure 7 and Figure 8, which show the results from two crossings of the same test subject. Another feature that can be observed from these figures is that for the single crossings and vibration levels with peak values of around 0.15 m/s2, no substantial changes in the vibration response are noted in either the time response or spectrum between force-only and dynamic (interaction) models that represent the pedestrian action. It can also be noticed from both the time domain and spectral plots that a perfect match between measurements and simulations is not present. This is possibly related to the nonlinear behavior of the structure, as it was previously seen that damping is strongly dependent on amplitude levels, which vary throughout the crossing.
The DLFs for each of the test subjects are shown in Table 3 with their respective standard deviations (SD) due to intra-subject variability.

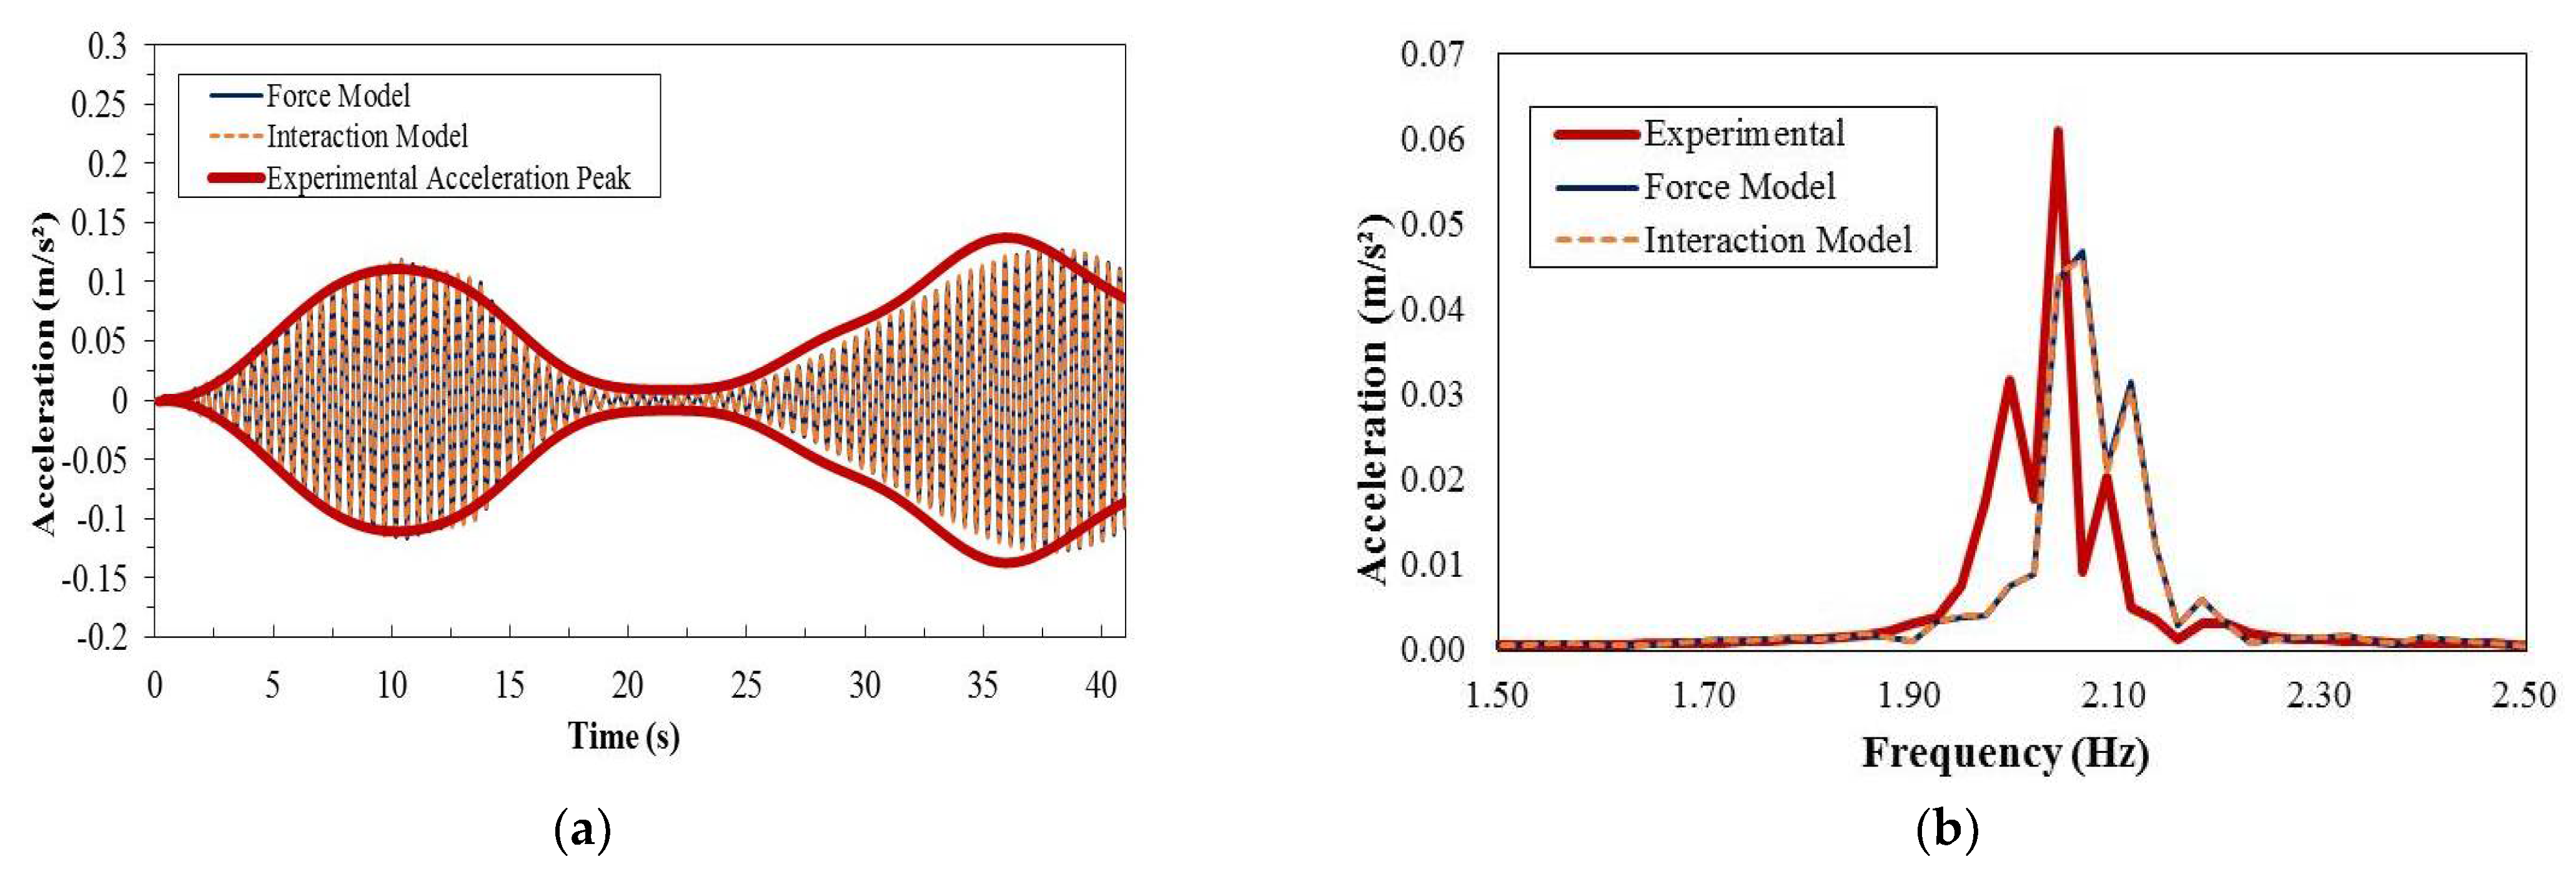
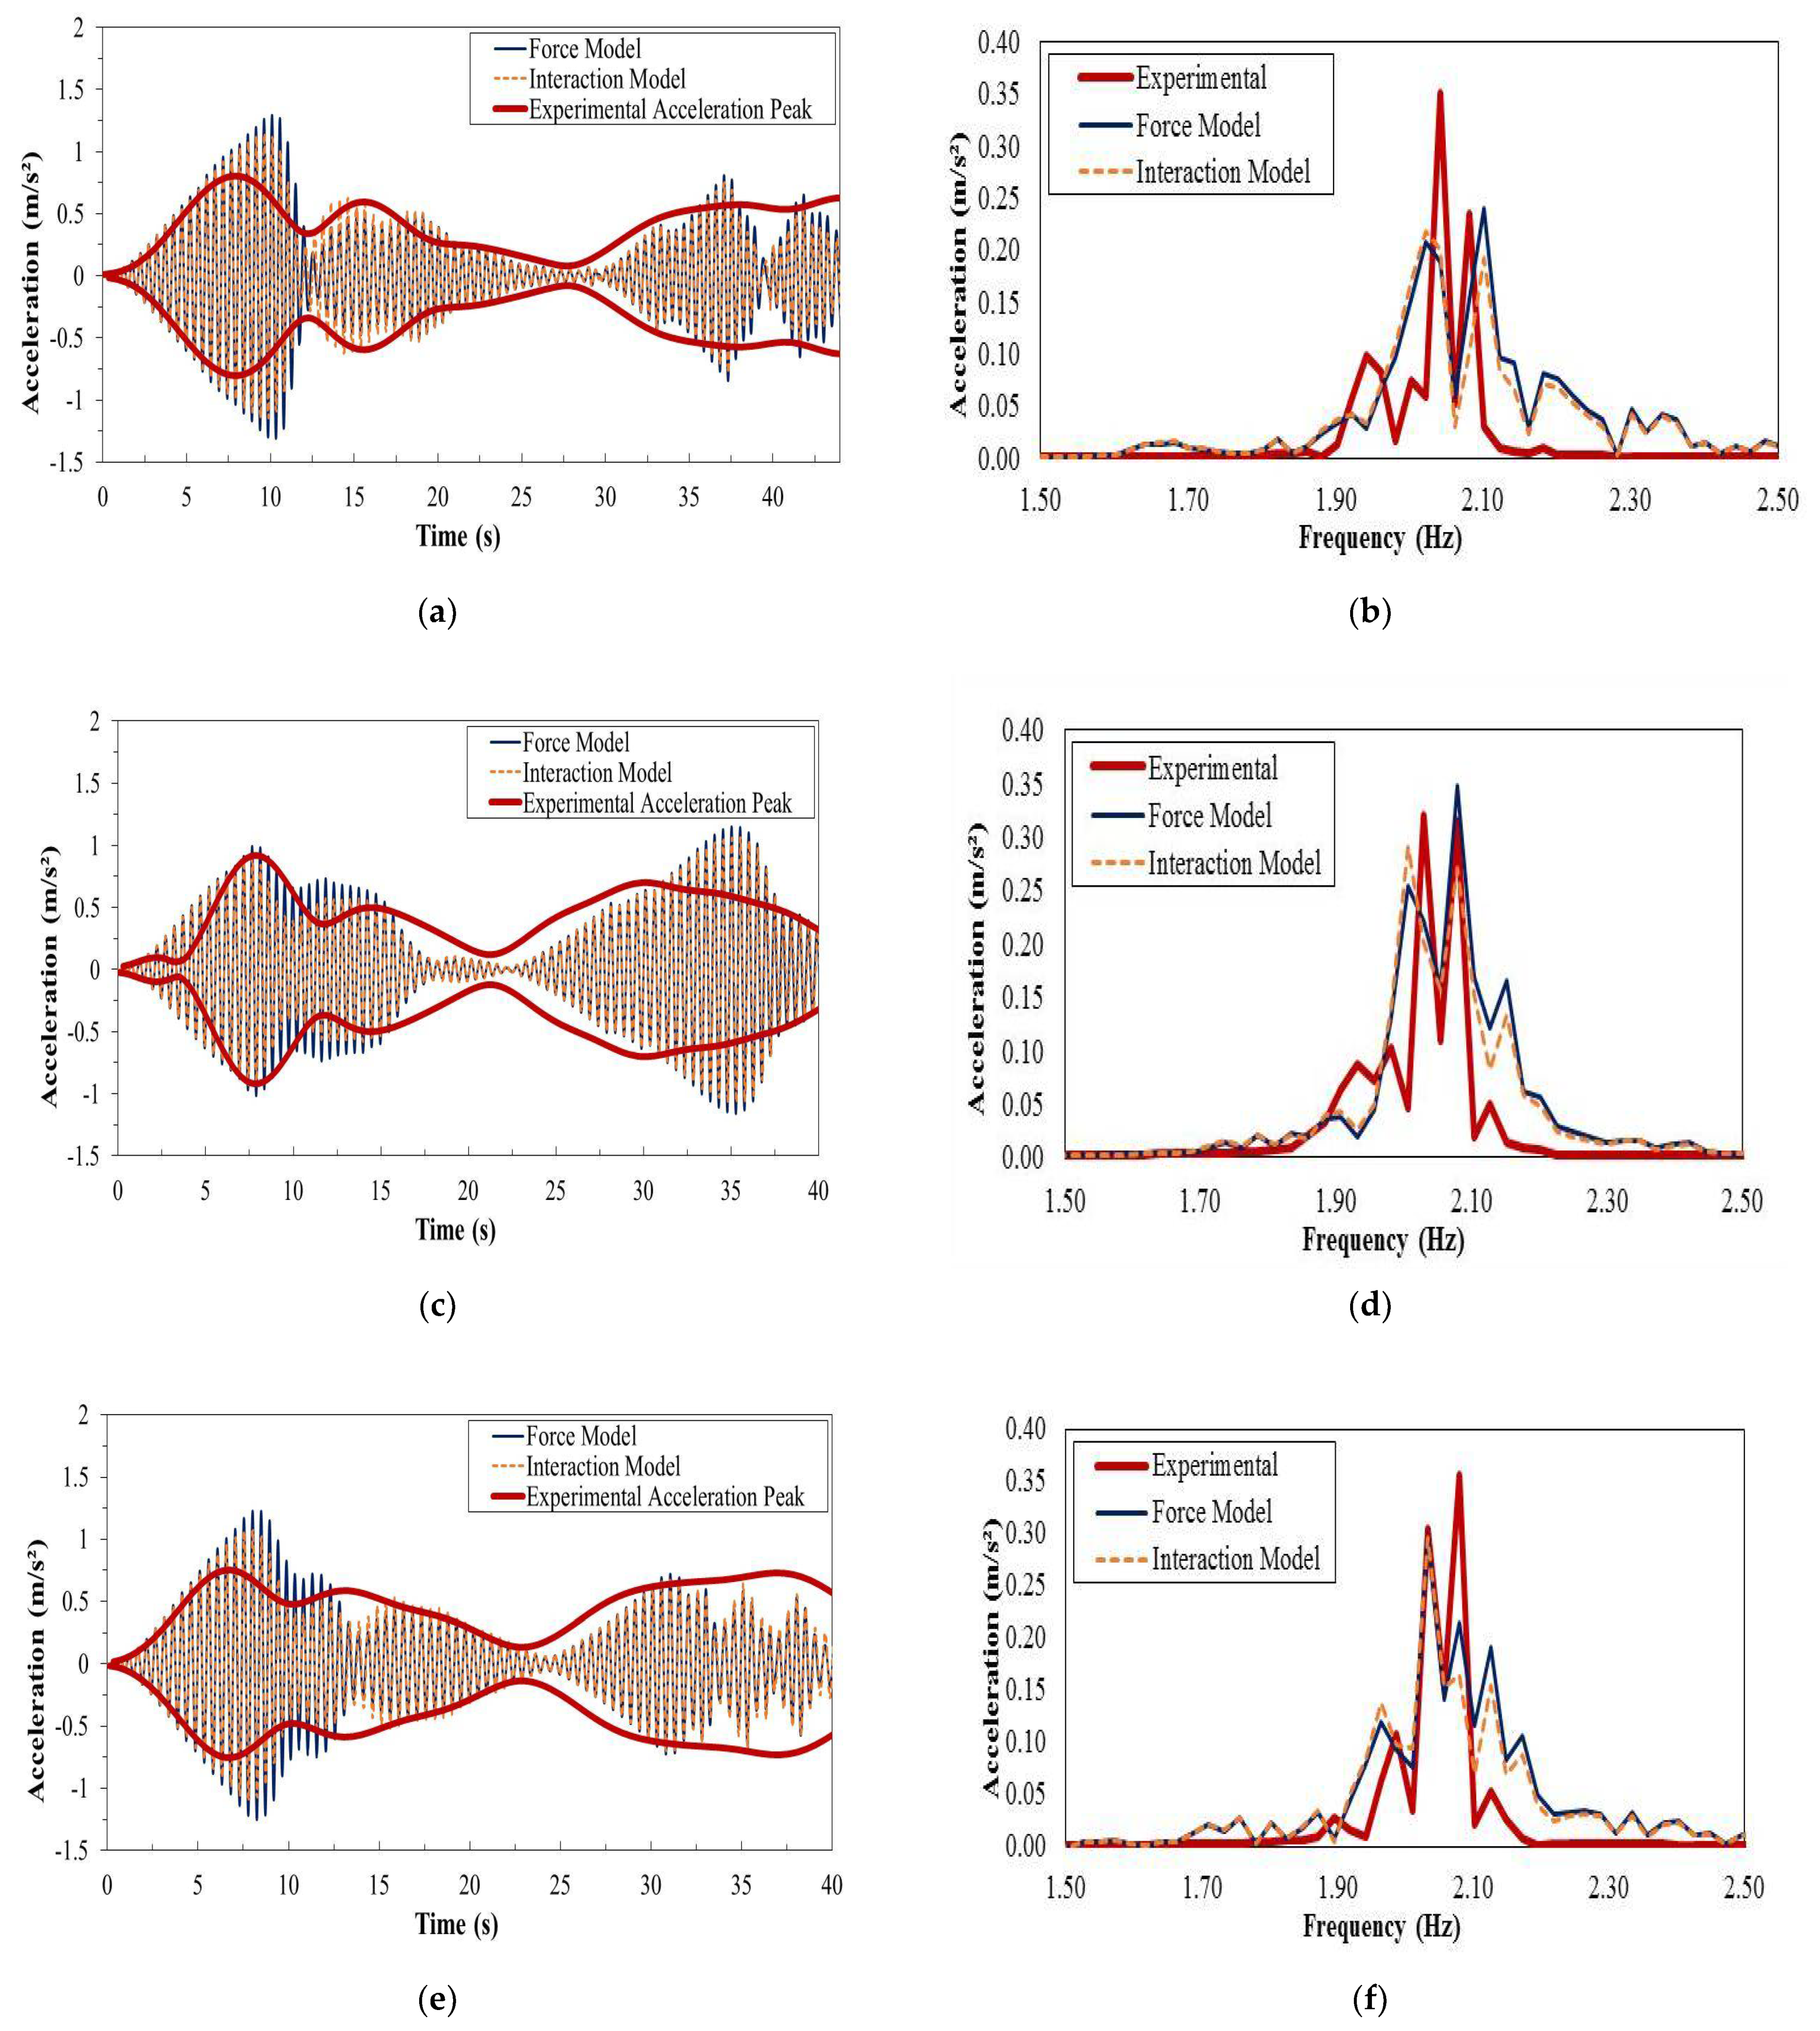
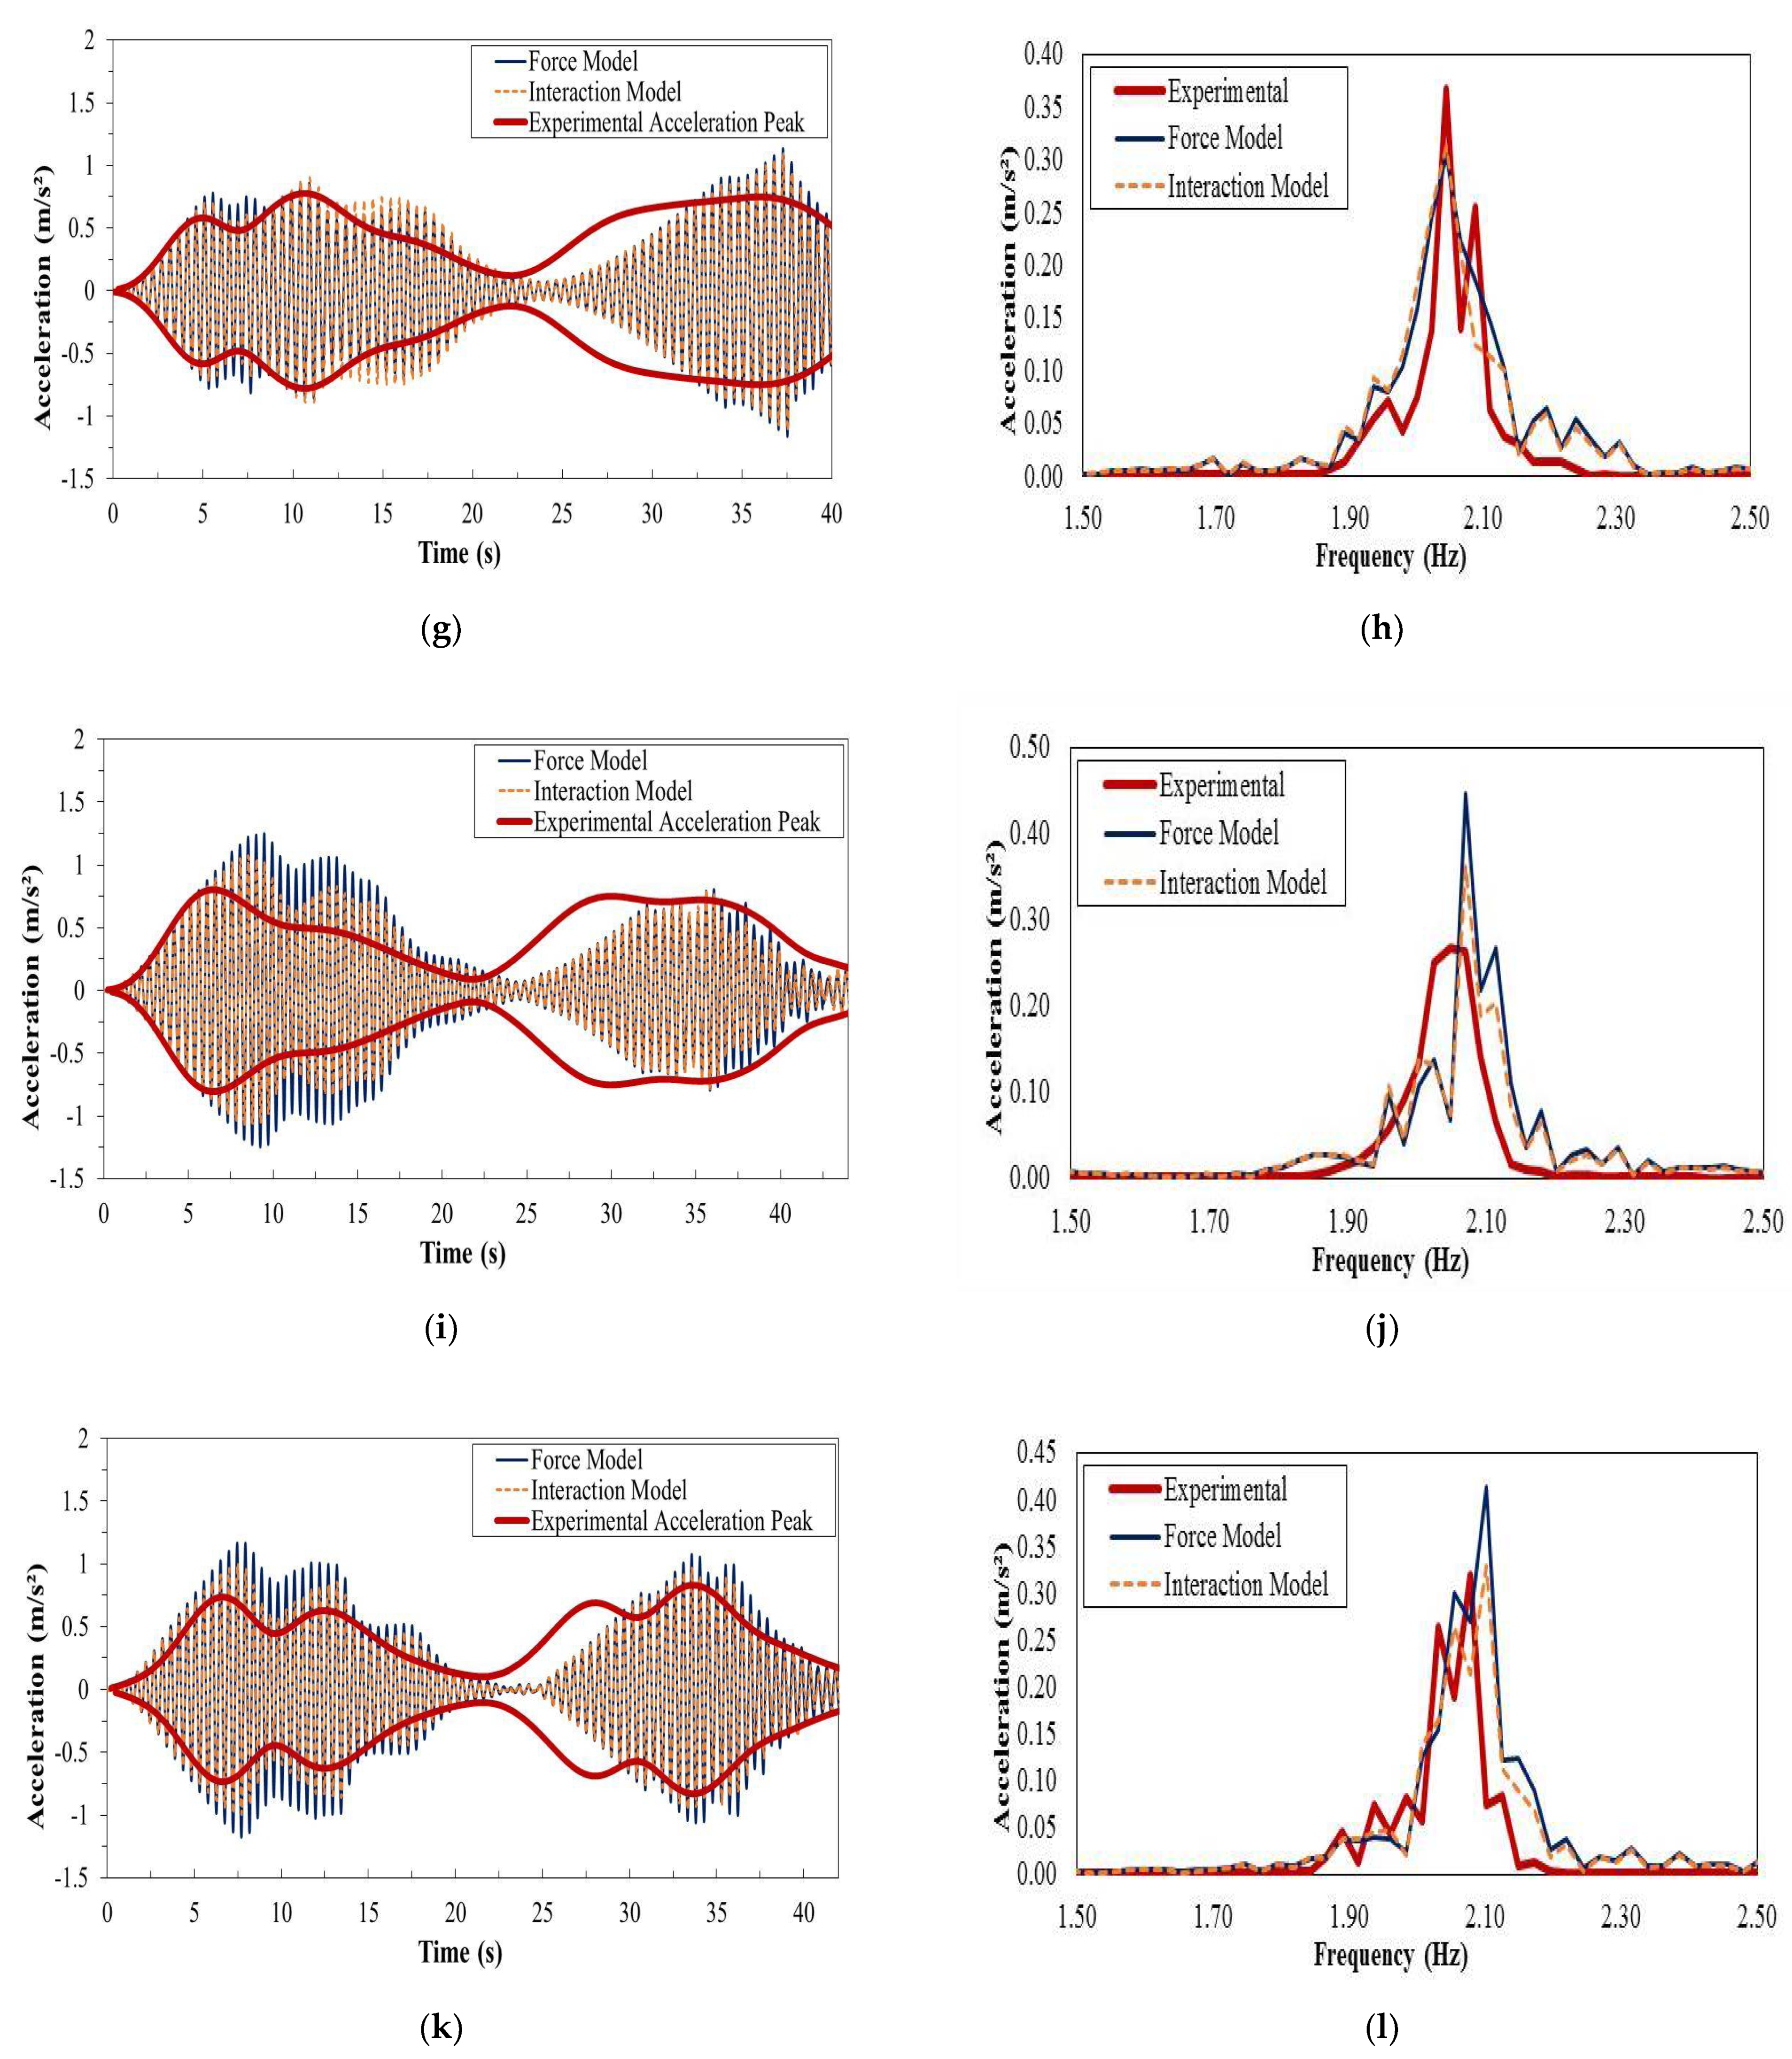
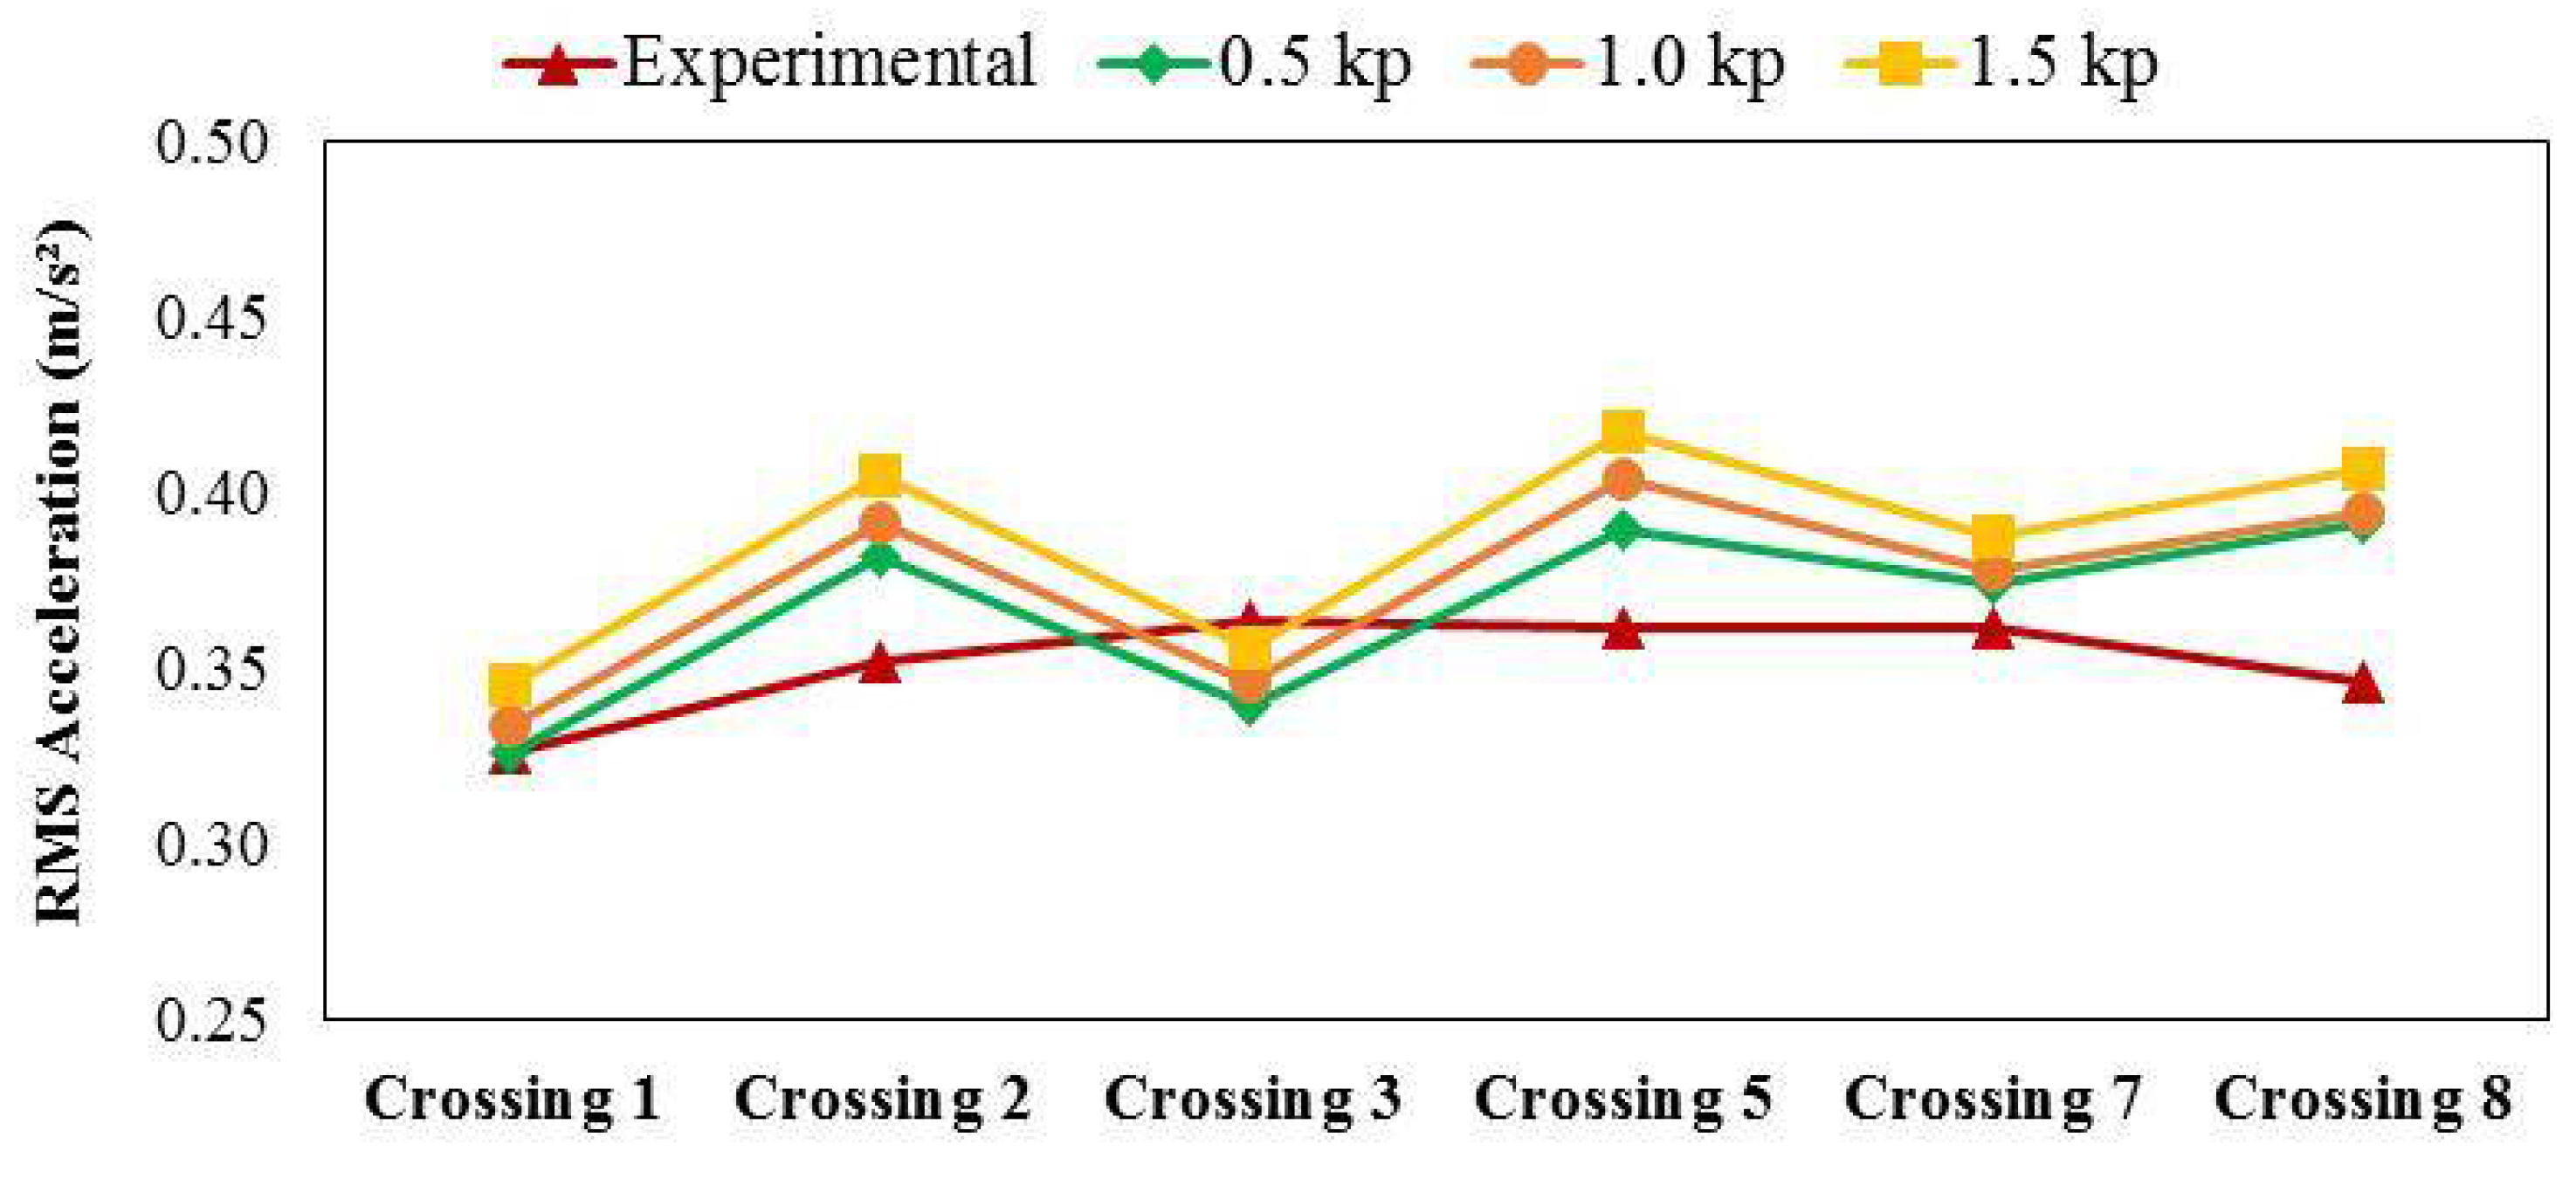
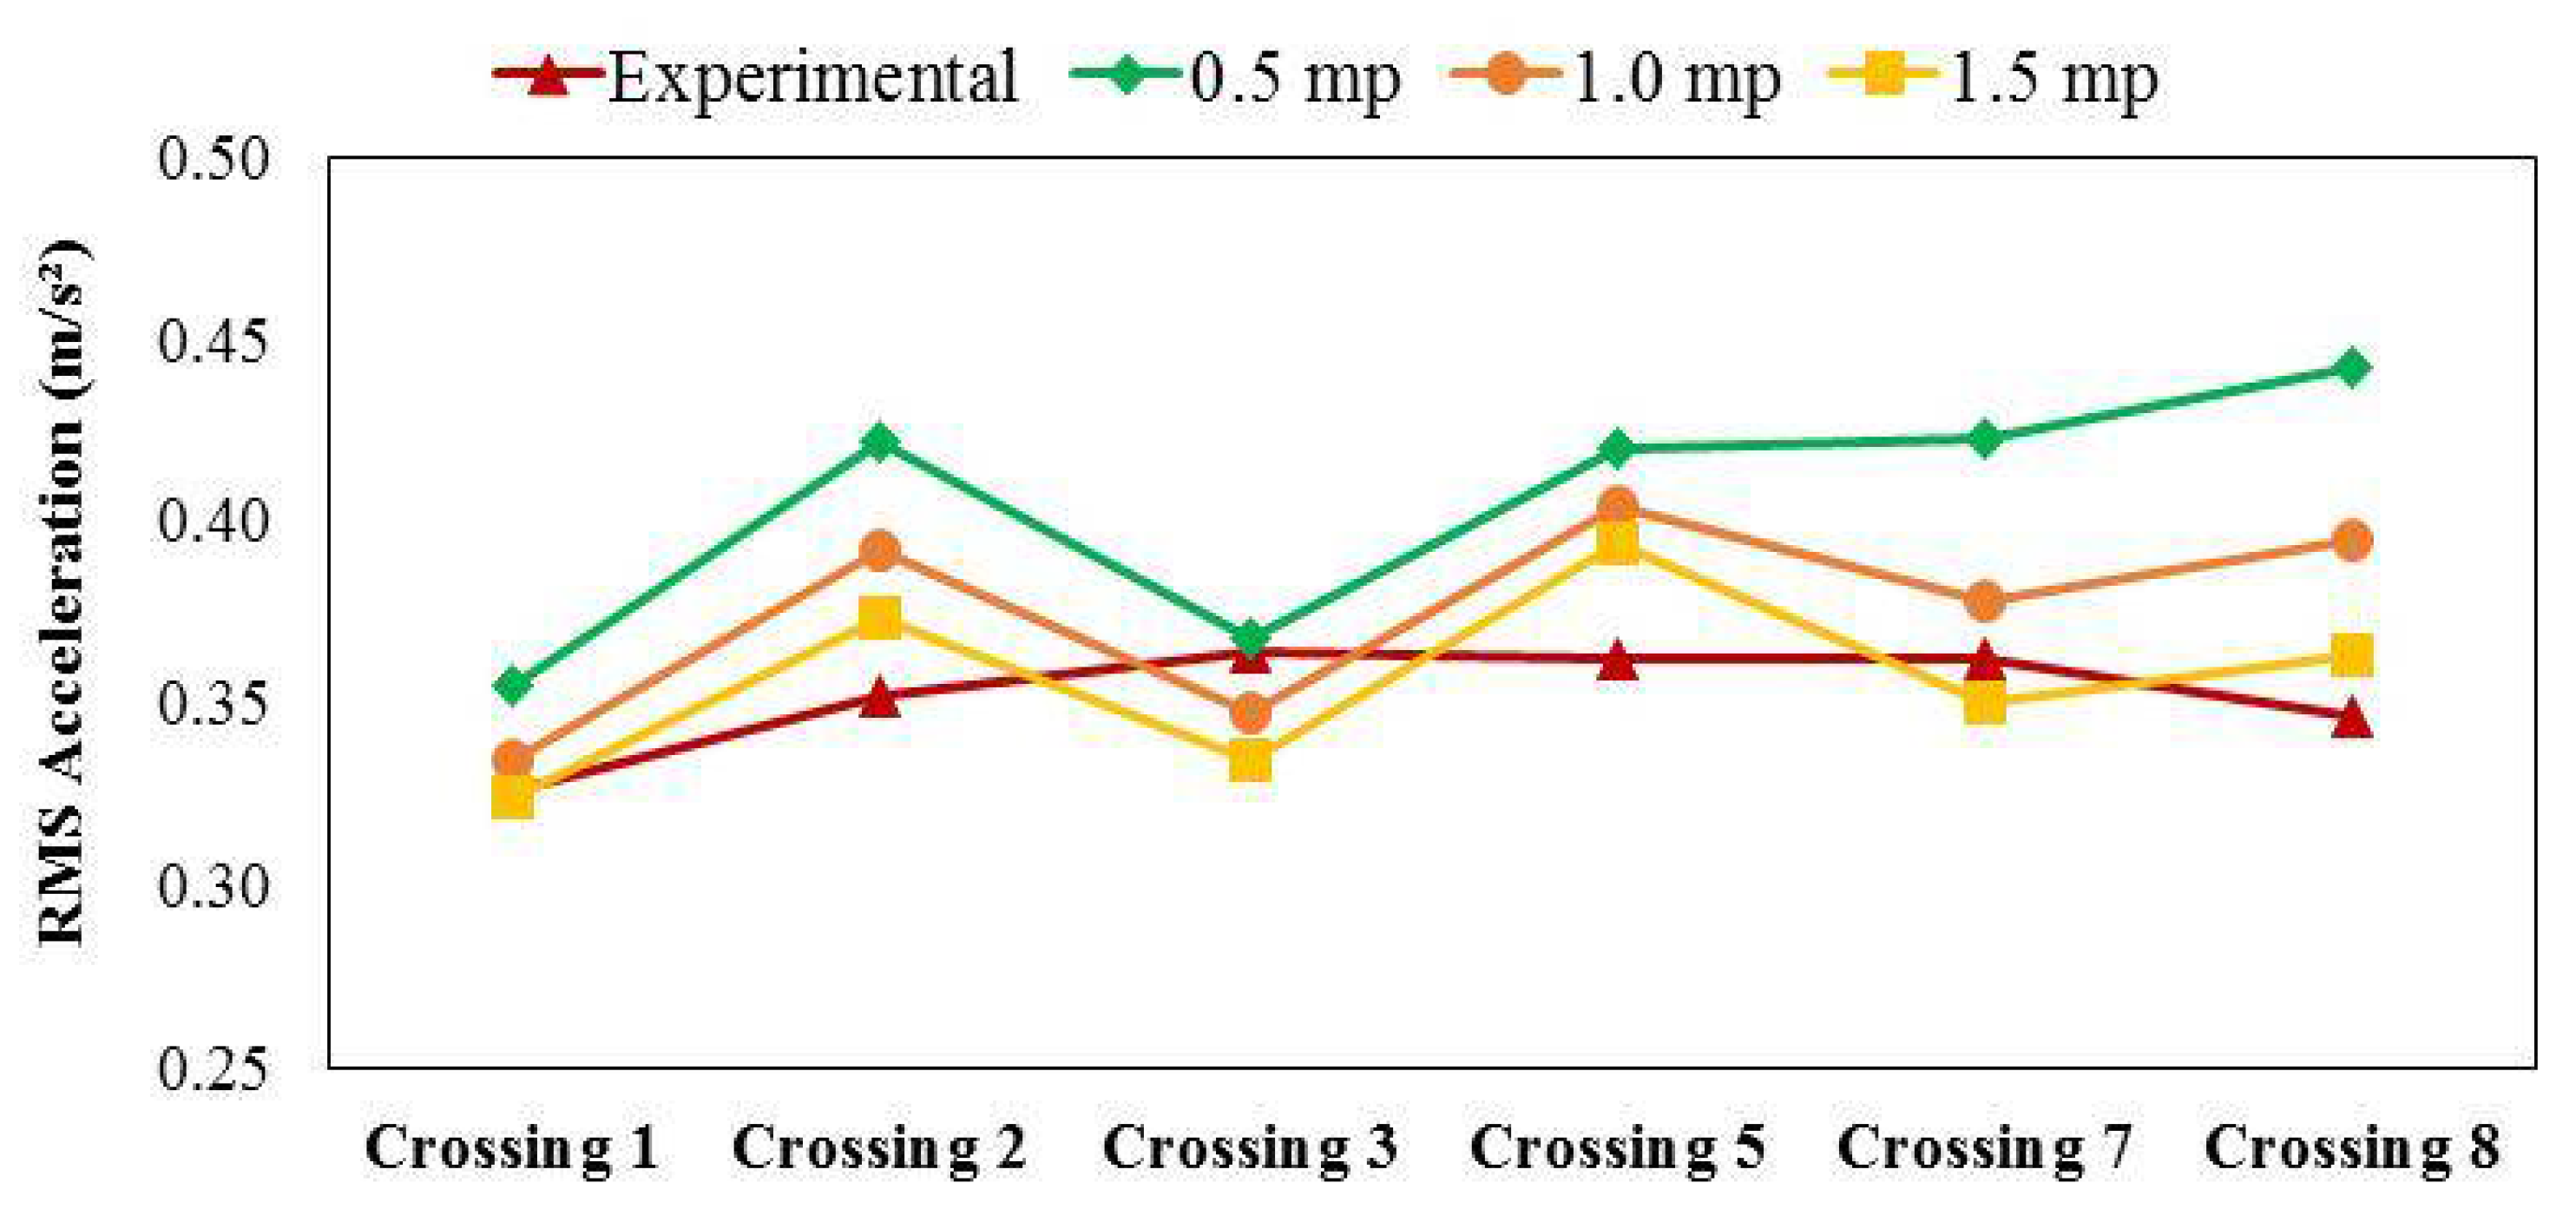
3.2. Investigation of Group Loading

After obtaining the DLF of each test subject, the case of group loading can be investigated. An additional uncertainty is present in this case, which is the potential lack of synchronization among the test subjects, in spite of the use of the metronome. This problem was tackled by employing a video camera to record the crossings. However, there was a drawback: the camera was placed near one of the footbridge supports, and observation of the images to identify phase differences was possible only for part of the crossing due to eventual occlusions and the lack of resolution when the pedestrians were far from the camera.
It is also worth mentioning the accuracy of the phase difference calculations: since the camera recorded 30 frames/s, by checking the period of the walking cycle of a typical pedestrian, a total of 29 frames corresponded to an interval of 2 cycles (for instance, the time interval between successive touches of the tip of the right foot of the pedestrian on the ground). This leads to a time interval of 0.966 s, corresponding to a period T of (0.966/2) = 0.4833 s. The corresponding pacing rate fp is equal to (1/T) = 2.069 Hz, which is in agreement with the value set in the metronome.
Therefore, each video frame covers a change in phase angle of (360°/14.5) = 24.8 degrees, or 0.433 rads. This is the maximum error in the phase by calculating the phase angles using the processing of the videos. It was noted that the majority of the test subjects had a phase difference (with respect to the leading test subject) of either null or 360°, the latter meaning that a test subject was placing the opposite foot on the ground. It should be noted that this does not make a difference when applying Equation (5), in which the load of each foot is considered to be the same.
Due to these several factors, six useful crossings of the whole group of pedestrians, identified by numbers, were selected, and the identified phase differences among each test subject and the leader were introduced to the applied loads of the respective simulations. Distances among pedestrians were disregarded, following the line of thought for group loading in the UK code [14]. A value of 2.4% for the damping ratio was adopted (highest value from Figure 6), and the root mean square (RMS) acceleration during the crossing was compared between measurements and simulations. This metric was preferred since the time response and spectral signatures from measurements and simulations are not expected to match, as can be seen in Figure 9 for all selected crossings. The RMS results obtained for the selected crossings are shown in Figure 10.
As a remark, it can be noticed from the plots in Figure 9 that the experimental peak accelerations reached during the crossings are lower than the vibration limits recommended for this footbridge, when the codes and guidelines that deal with the vibration serviceability of footbridges are applied [14,15,16].
The summation of absolute errors between the values of each numerical simulation and the experimental values confirms the visual impression of Figure 10 that the performance of the interaction model was superior. However, the difference between the results of force and interaction models is not very significant. The association between the level of vibration and the number of test subjects is a factor of relevance in such a difference. Thus, the effect of the number of pedestrians in the group will be further explored.
A sensitivity analysis was also carried out to explore the effect of the modal parameters mp, kp and cp on the response. To do this, each of these parameters was varied by half its value at a time (plus and minus 50%). It is worth mentioning that in the case of the applied changes in the modal mass, care was taken to avoid values higher than the total mass of the respective test subject. The results are shown in Figure 11, Figure 12 and Figure 13, together with the previous original values from the experimental and interaction models.
It can be noticed that among the three parameters, the modal mass of the pedestrians is the most influential one. By examining the plots of kp and mp together, it can be observed that a reduction in the natural frequency of the pedestrian body (caused by either a reduction in kp or increase in mp) reduced the level of the response. This is explained by the closer proximity between the reduced natural frequency of the body and the natural frequency of the structure. Van Nimmen et al. [26] explained this effect by an association with the behavior of tuned mass dampers, and the results shown here are consistent with this feature. This calls attention to the fact that if the natural frequency of a structure were closer to the natural frequency of the body, it is expected that the difference between interaction and force models would be more prominent than that in the case under study.

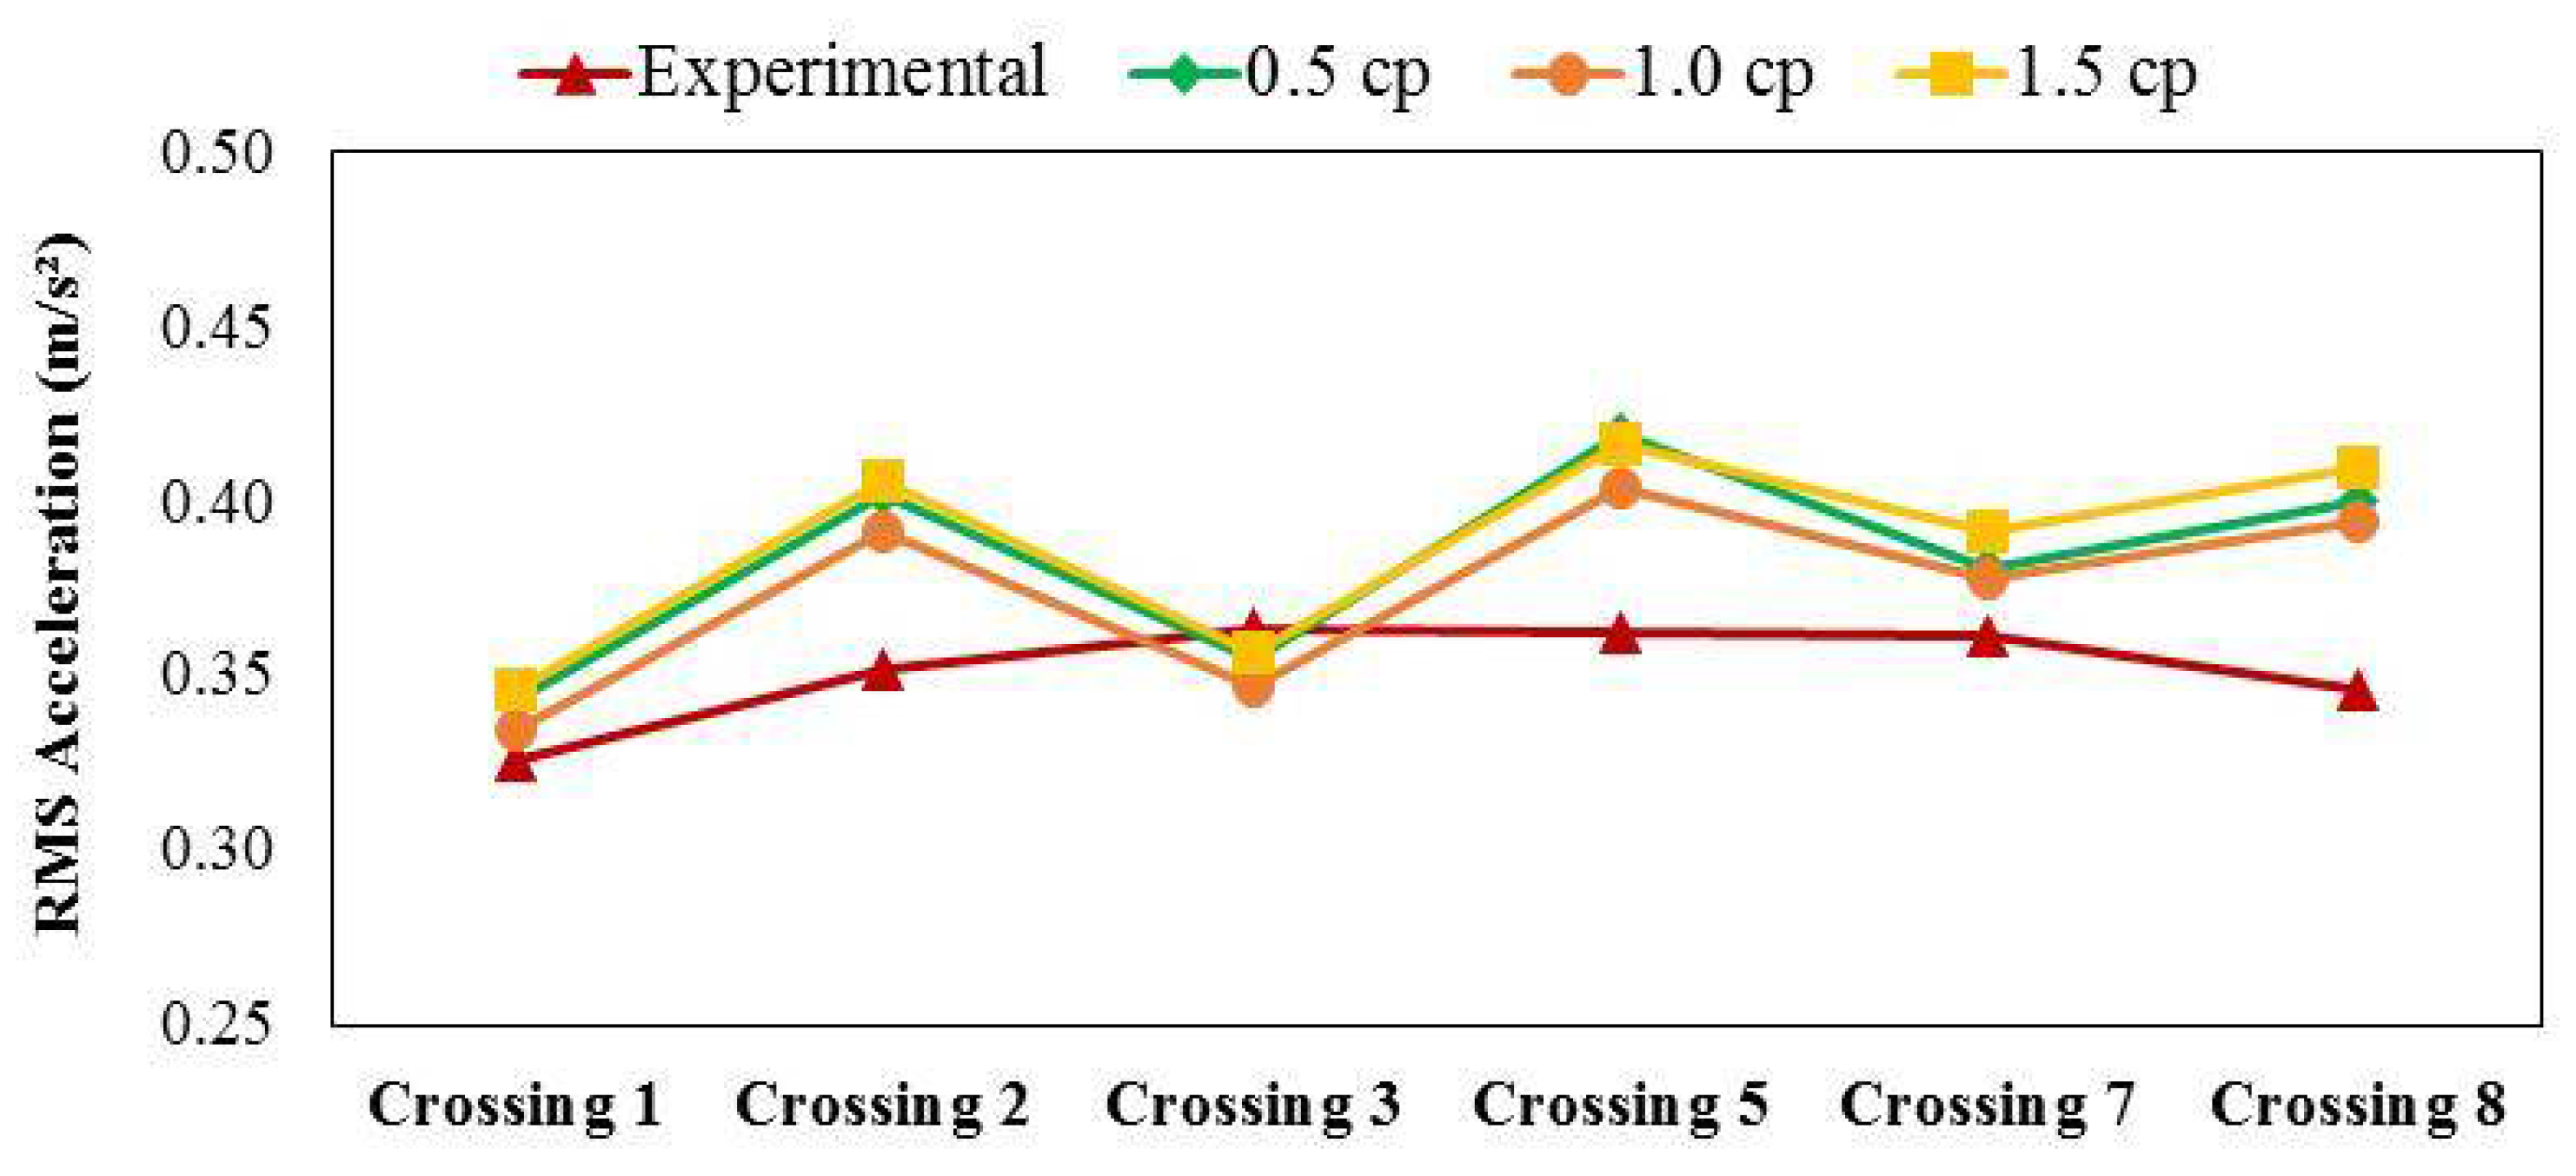
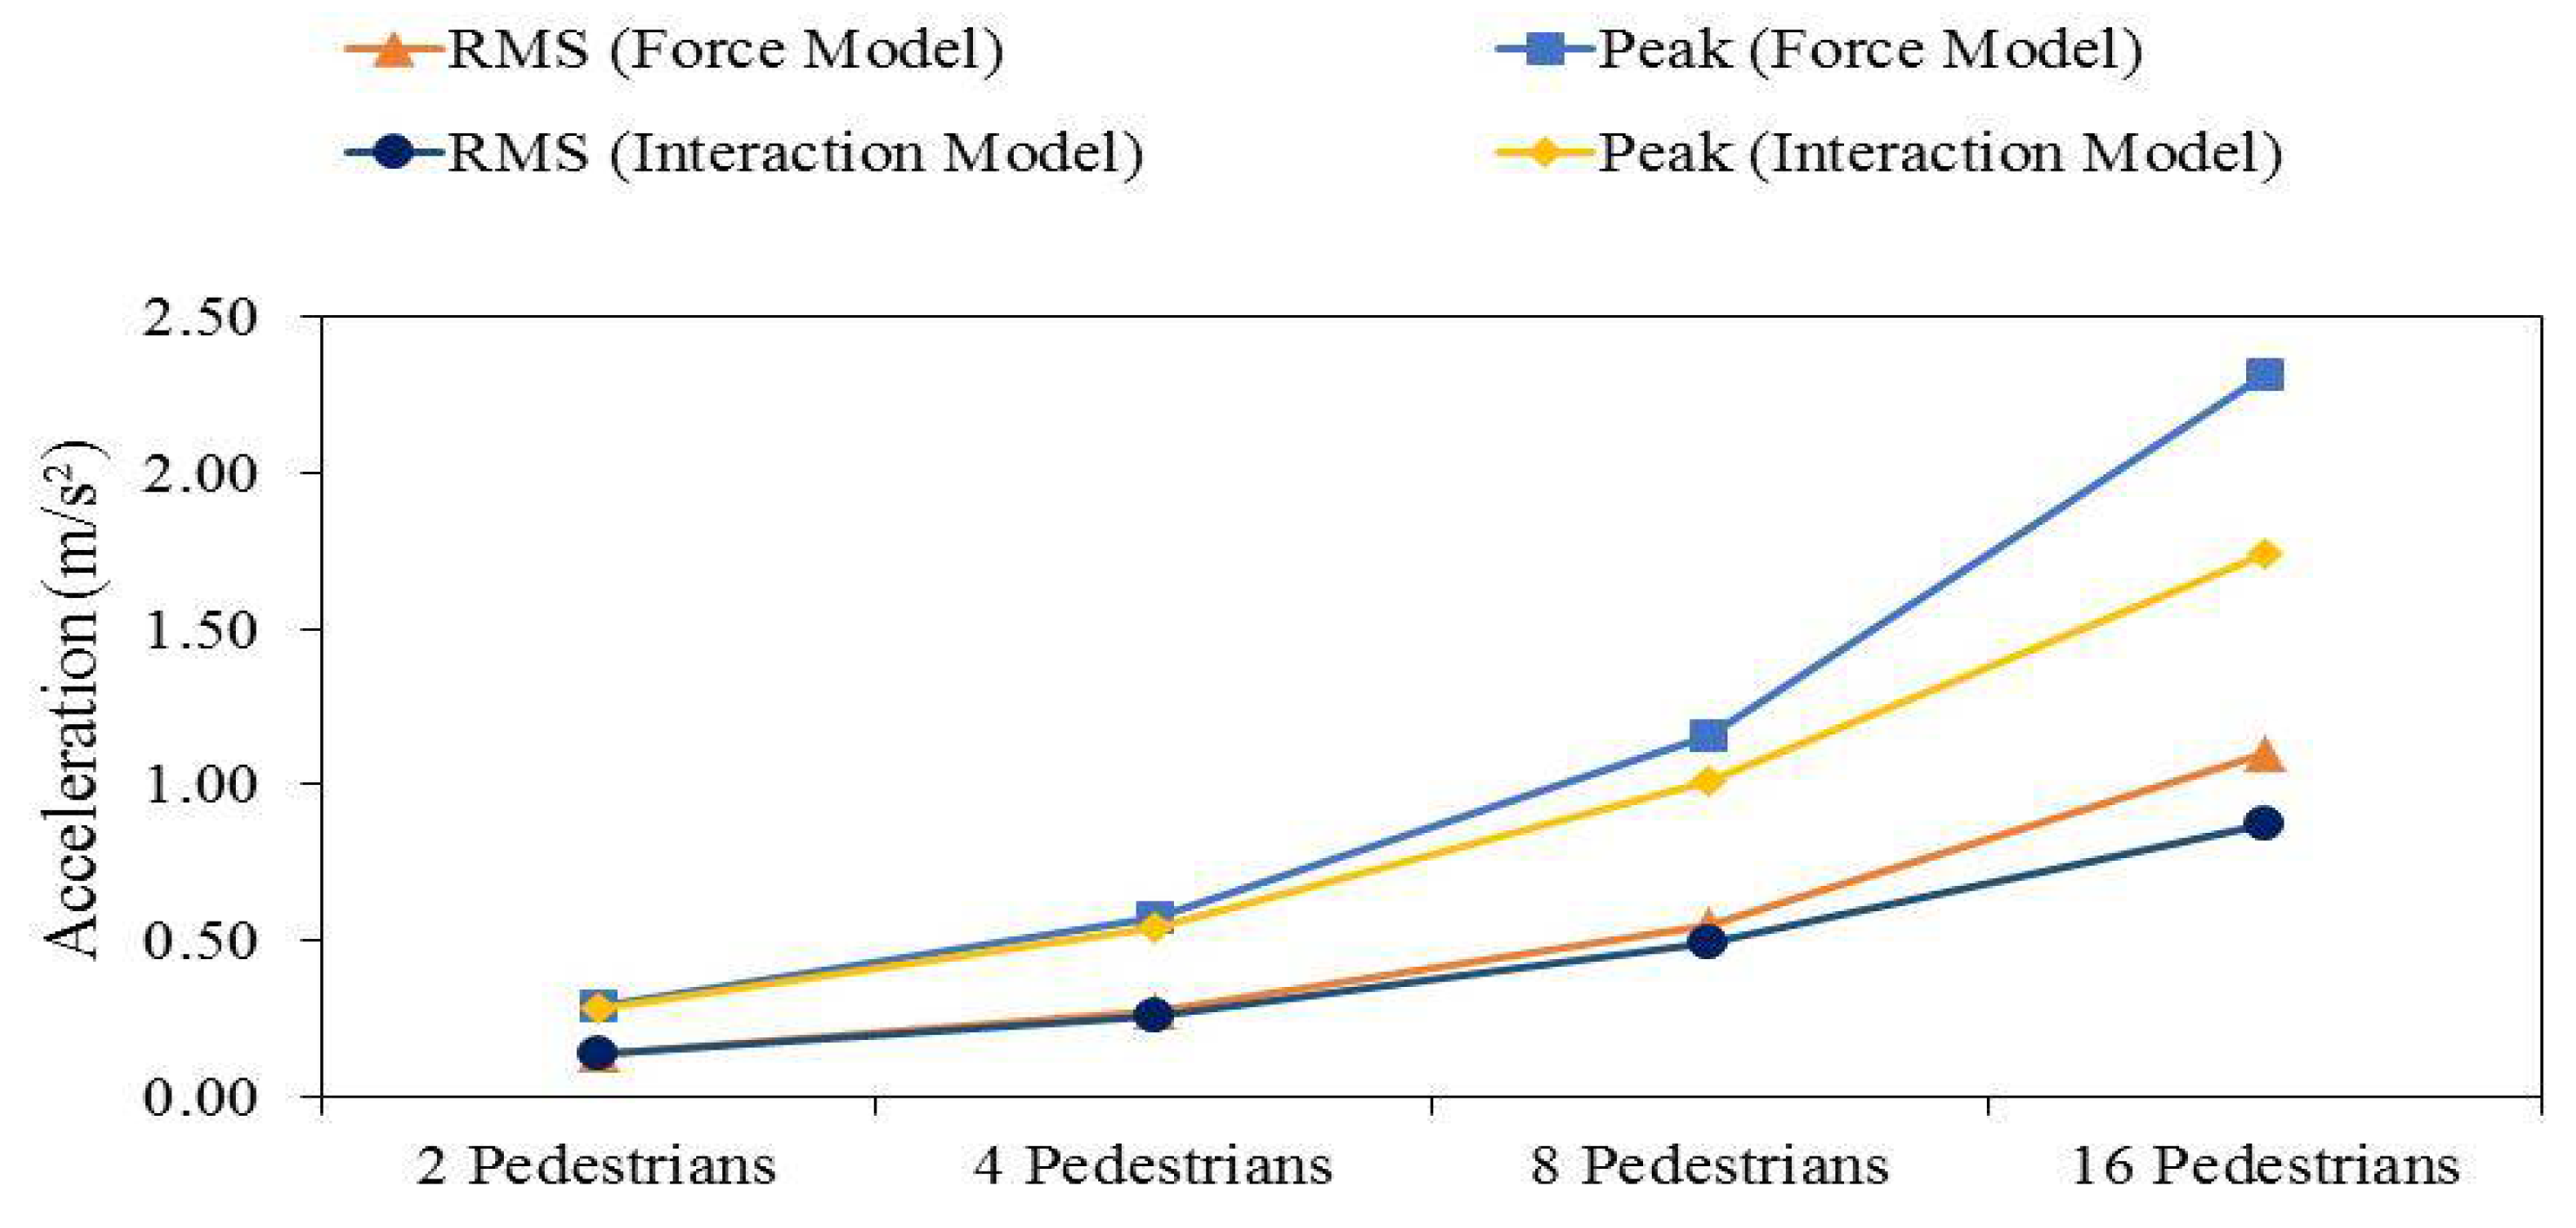
3.3. Effect of the Number of Pedestrians in the Group

By taking the UK NA to BS EN 1991-2 as a reference [14], the number of pedestrians to be considered in a group can vary from 2 (seldomly used, rurally located footbridges) to 16 (footbridges that serve as primary access to assembly facilities). Then, bearing in mind the differences previously observed in the modeling effect between force models and dynamic systems in terms of vibration response from single and group crossings, it is worth investigating the effect that the number of pedestrians may present in terms of the difference between the (code) approach of modeling the action of pedestrians as force-only and as dynamic systems interacting with the structure.
Based on the group of test subjects involved in this investigation, the average values of the pedestrian parameters were adopted, corresponding to a DLF of 0.273, an individual total mass of 72.3 kg and a crossing speed of 1.51 m/s. The pedestrians were considered fully synchronized, as synchronization would affect both modeling strategies. A word of caution is that the effect of pedestrians as dynamic systems is dependent on the level of vibration. In this analysis, peak accelerations changed from 0.29 m/s2 for the case of a group of 2 pedestrians to 2.32 m/s2 for the case of 16 pedestrians in the group. The results obtained are shown in Figure 14 in terms of the peak and also RMS acceleration.
Many significant changes occurred between the modeling strategies for the case of 16 pedestrians in the group and for peak values, the latter metric being the one adopted in UK NA to BS EN 1991-2 [14] to define comfort levels. In that case, a reduction of 25% occurred in the peak values when pedestrians were modeled as dynamic systems. On the other hand, for the small groups, the difference was not significant. It should be noted that all of these values and comments are applicable to this case study only, since this depends on the footbridge geometry and the level of accelerations produced. However, modeling pedestrians as dynamics systems was shown to be more realistic from the previous analysis and led to reductions in the calculated values.

4. Conclusions

The change in codes of practice to include several pedestrians at a time crossing a footbridge as a design case for vibration serviceability checks pushes research towards investigating the effect of pedestrians as part of the vibrating system, not only as loads.
A cable-stayed footbridge complying with vibration limits defined by codes of practice and guidelines for vibration serviceability was employed as a test structure, and it was crossed by single pedestrians and a group of 10 pedestrians, repeatedly. One finding was the dependence of damping on vibration levels, and values for the damping ratio employed in the analyses were different for the single crossings (lower vibration levels) and group crossings (higher vibration levels).
The results obtained from this investigation for a design case called group loading, that is, a group of pedestrians crossing the structure together at a close distance from each other, show that modeling pedestrians as dynamic systems interacting with the structure improves the estimation of the structural response. However, several features affect the influence of pedestrian–structure interaction on the results, in particular, the closeness or lack thereof between the natural frequency of the pedestrian body and the natural frequency of the structure, as well as the number of pedestrians in the group.
An additional simulation investigated the effect of the number of pedestrians on the group, and an expected increase in the differences between the two modeling approaches for the pedestrians, that is, the force-only model and the dynamic (interaction) model, revealed that the latter led to reductions in the structural response, which is positive from the perspective of the design. Among the investigated number of pedestrians, significant reductions due to the interaction only occurred when the group was formed by 16 pedestrians for the footbridge under investigation.

Author Contributions

Conceptualization, P.H. and R.P.; methodology, R.P., R.S. and F.S.; software, R.S. and F.S.; validation, R.P., R.S. and F.S.; formal analysis, P.H. and R.P.; investigation, P.H.; resources, P.H.; data curation, P.H. and R.S.; writing—original draft preparation, P.H. and R.P.; writing—review and editing, P.H. and R.P.; visualization, P.H. and R.P.; supervision, P.H.; project administration, P.H.; funding acquisition, P.H. All authors have read and agreed to the published version of the manuscript.

Funding

This paper is a result of Joint Research Work “Effects of modeling pedestrians as biodynamic systems”, conducted in the international cooperation between researchers of universities in Poland and Brazil. This research received no external funding.

Institutional Review Board Statement

The study was conducted according to the guidelines of the Declaration of Helsinki, and approved by the Ethics Committee of the Federal University of Paraiba (approval code 2.934.009 CAEE code 96726518.7.0000.5188, date of approval 3 October 2018).

Informed Consent Statement

Informed consent was obtained from all subjects involved in the study.

Data Availability Statement

The data presented in this study are available on request from the corresponding author.

Acknowledgments

The authors are indebted to the volunteers from the Wrocław University of Science and Technology scientific group “Young Bridge Builders” who took part in the experimental campaign.

Conflicts of Interest

The authors declare no conflict of interest. The funders had no role in the design of the study; in the collection, analyses, or interpretation of data; in the writing of the manuscript, or in the decision to publish the results.

References

  1. Pimentel, R.L.; Pavic, A.; Waldron, P. Evaluation of design requirements for footbridges excited by vertical forces from walking. Can. J. Civil Eng. 2001, 28, 769–777. [Google Scholar] [CrossRef]
  2. Dallard, P.; Fitzpatrick, T.; Flint, A.; Low, A.; Smith, R.R.; Willford, M.; Roche, M. London Millennium Bridge: Pedestrian-induced lateral vibration. J. Bridge Eng. 2001, 6, 412–417. [Google Scholar] [CrossRef]
  3. Danbon, F.; Grillaud, G. Dynamic behavior of a steel footbridge—Characterisation and modeling of the dynamic loading induced by a moving crowd on the Solferino footbridge in Paris. In Proceedings of the Footbridge 2005 Second International Congress, Venezia, Italy, 6–8 December 2005. [Google Scholar]
  4. Nakamura, S.; Kawasaki, T. Lateral vibration of footbridges by synchronous walking. J. Constr. Steel Res. 2006, 62, 1148–1160. [Google Scholar] [CrossRef]
  5. Zivanovic, S.; Pavic, A.; Reynolds, P. Finite element modelling and updating of a lively footbridge: The complete process. J. Sound Vib. 2007, 301, 126–145. [Google Scholar] [CrossRef] [Green Version]
  6. Pospíšil, S.; Hračov, S.; Urushadze, S.; Jermoljev, D. Analysis and Mitigation of Vibration of Steel Footbridge with Excessive Amplitudes. In Topics in Dynamics of Bridges Volume 3, Conference Proceedings of the Society for Experimental Mechanics Series; Cunha, A., Ed.; Springer: New York, NY, USA, 2013. [Google Scholar] [CrossRef]
  7. Tubino, F.; Carassale, L.; Piccardo, G. Human-Induced Vibrations on Two Lively Footbridges in Milan. J. Bridge Eng. 2016, 21, C4015002. [Google Scholar] [CrossRef]
  8. Caetano, E.; Cunha, A.; Moutinho, C.; Hu, W.-H. Continuous Dynamic Monitoring of Lively Footbridges. Int. J. Online Eng. 2016, 12, 49–51. [Google Scholar] [CrossRef] [Green Version]
  9. Drygała, I.J.; Polak, M.A.; Dulińska, J.M. Vibration serviceability assessment of GFRP pedestrian bridges. Eng. Struct. 2019, 184, 176–185. [Google Scholar] [CrossRef]
  10. Banaś, A.; Jankowski, R. Experimental and Numerical Study on Dynamics of Two Footbridges with Different Shapes of Girders. Appl. Sci. 2020, 10, 4505. [Google Scholar] [CrossRef]
  11. Bocian, M.; Brownjohn, J.M.W.; Racic, V.; Hester, D.; Quattrone, A.; Monnickendam, R. A framework for experimental determination of localised vertical pedestrian forces on full-scale structures using wireless attitude and heading reference systems. J. Sound Vib. 2016, 376, 217–243. [Google Scholar] [CrossRef] [Green Version]
  12. Pańtak, M. Ground Reaction Forces Generated by Runners—Harmonic Analyses and Modeling. Appl. Sci. 2020, 10, 1575. [Google Scholar] [CrossRef] [Green Version]
  13. British Standards Institute. BS5400 British Standards—Steel, Concrete and Composite Bridges: Specification for Loads; Part 2, Appendix C; BSI: London, UK, 1978. [Google Scholar]
  14. British Standards Institute. UK National Annex to Eurocode 1: Actions on Structures—Part 2: Traffic Loads on Bridges; NA to BS EN 1991-2:2003; BSI: London, UK, 2008. [Google Scholar]
  15. SÉTRA—Service d’Études Techniques des Routes et Autoroutes. Technical Guide Footbridges—Assessment of Vibrational Behaviour of Footbridges under Pedestrian Loading; Association Française de Génie Civil: Paris, France, 2006. [Google Scholar]
  16. Hivoss—Human Induced Vibrations of Steel Structures. Design of Footbridges Guideline; Research Fund for Coal & Steel, European Commission: Luxembourg, 2008. [Google Scholar]
  17. Shahabpoor, E.; Pavic, A.; Racic, V. Interaction between Walking Humans and Structures in Vertical Direction: A Literature Review. Shock Vib. 2016, 2016, 3430285. [Google Scholar] [CrossRef] [Green Version]
  18. Archbold, P.J. Interactive Load Models for Pedestrian Footbridges. Ph.D. Thesis, National University of Ireland University College, Dublin, Ireland, 2004. [Google Scholar]
  19. Caprani, C.C.; Keogh, J.; Archbold, P.; Fanning, P. Characteristic vertical response of a footbridge due to crowd loading. In Proceedings of the VIII International Conference on Structural Dynamics Eurodyn 2011, Leuven, Belgium, 4–6 July 2011. [Google Scholar]
  20. Pfeil, M.; Amador, N.; Pimentel, R.; Vasconcelos, R. Analytic-numerical model for walking person—Footbridge structure interaction. In Proceedings of the IX International Conference on Structural Dynamics Eurodyn 2014, Porto, Portugal, 30 June–2 July 2014. [Google Scholar]
  21. Jiménez-Alonso, J.F.; Sáez, A. A direct pedestrian structure interaction model to characterize the human induced vibrations on slender footbridges. Inf. Constr. 2014, 66, m007. [Google Scholar] [CrossRef] [Green Version]
  22. Venuti, F.; Racic, V.; Corbetta, A. Modelling framework for dynamic interaction between multiple pedestrians and vertical vibrations of footbridge. J. Sound Vib. 2016, 379, 245–263. [Google Scholar] [CrossRef] [Green Version]
  23. Shahabpoor, E.; Pavic, A.; Racic, V. Identification of mass–spring–damper model of walking humans. Structures 2016, 5, 233–246. [Google Scholar] [CrossRef] [Green Version]
  24. Gomez, D.; Dyke, S.J.; Rietdyk, S. Experimental Verification of a Substructure-Based Model to Describe Pedestrian–Bridge Interaction. J. Bridge Eng. 2018, 23, 04018013. [Google Scholar] [CrossRef] [Green Version]
  25. Silva, R.L.; Pimentel, R.L.; Pavic, A. Performance of biodynamic models to represent the action of a pedestrian in the vertical direction. In Proceedings of the XI International Conference on Structural Dynamics Eurodyn 2020, Athens, Greece, 23–26 November 2020. [Google Scholar] [CrossRef]
  26. Van Nimmen, K.; Lombaert, G.; De Roeck, G.; Van den Broeck, P. The impact of vertical human-structure interaction on the response of footbridges to pedestrian excitation. J. Sound Vib. 2017, 402, 104–121. [Google Scholar] [CrossRef] [Green Version]
  27. Hawryszków, P.; Pimentel, R.; Silva, F. Vibration effects of loads due to groups crossing a lively footbridge. Procedia Eng. 2017, 199, 2808–2813. [Google Scholar] [CrossRef]
  28. Silva, F.T.; Pimentel, R.L. Biodynamic walking model for vibration serviceability of footbridges in vertical direction. In Proceedings of the VIII International Conference on Structural Dynamics Eurodyn 2011, Leuven, Belgium, 4–6 July 2011. [Google Scholar]
  29. Bachmann, H.; Ammann, H. Vibration in Structures Induced by Man and Machines; Structural Engineering Document No. 3; International Association for bridge and Structure Engineering: Zurich, Switzerland, 1987. [Google Scholar]
Figure 1. Technical drawing of the structure (side view, cross-section and top view), with relevant dimensions. Selected measurement point on the left span, 16.0 m from the support.
Applsci 11 01355 g001
Figure 2. Panoramic view of the footbridge.
Applsci 11 01355 g002
Figure 3. Vertical mode shapes of the structure.
Applsci 11 01355 g003
Figure 4. Pedestrian tests: (a) instrumented leading pedestrian; (b) single crossing; (c) group crossing; (d) pedestrian arrangement.
Applsci 11 01355 g004
Figure 5. Obtaining damping ratios from the tail-end signal of pedestrian tests.
Applsci 11 01355 g005
Figure 6. Damping ratios for the first structural mode.
Applsci 11 01355 g006
Figure 7. Second crossing of Test Subject 2: (a) time response; (b) spectrum.
Applsci 11 01355 g007
Figure 8. Third crossing of Test Subject 2: (a) time response; (b) spectrum.
Applsci 11 01355 g008
Figure 9. Time response and spectral plots during the crossing of the whole group of pedestrians: (a,b) Crossing 1; (c,d) Crossing 2; (e,f) Crossing 3; (g,h) Crossing 5; (i,j) Crossing 7; (k,l) Crossing 8.
Applsci 11 01355 g009aApplsci 11 01355 g009b
Figure 10. Root mean square (RMS) results from the crossings of the group.
Applsci 11 01355 g010
Figure 11. Results from changes in the modal damping.
Applsci 11 01355 g011
Figure 12. Results from changes in the modal stiffness.
Applsci 11 01355 g012
Figure 13. Results from changes in the modal mass.
Applsci 11 01355 g013
Figure 14. Peak and RMS accelerations for the two pedestrian models.
Applsci 11 01355 g014
Table 1. Mass of the test subjects.
Pedestrian NumberMass (kg)Pedestrian NumberMass (kg)
169667
248781
385887
490970
5821044
Table 2. Reference values of pedestrian parameters.
Pedestrian NumberModal Mass mp
(kg)
Modal Stiffness kp
(N/m)
Modal Damping cp
(Ns/m)
138.4312,311.32728.21
232.6512,574.66630.68
342.8312,550.82801.36
444.2012,701.11824.04
542.0012,477.72787.72
637.8812,307.72719.00
741.7312,456.22783.16
843.3812,606.68810.44
938.7012,315.35732.81
1031.5512,701.95611.88
Table 3. Calculated dynamic load factors (DLFs) of the test subjects.
PedestrianDLFSDPedestrianDLFSD
10.250.0060.300.01
20.260.0070.280.01
30.300.0180.250.03
40.260.0190.250.01
50.230.02100.350.00
Publisher’s Note: MDPI stays neutral with regard to jurisdictional claims in published maps and institutional affiliations.

