Article

Self-Assembled MoS2/ssDNA Nanostructures for the Capacitive Aptasensing of Acetamiprid Insecticide

by
Maroua Hamami
1,2,
Noureddine Raouafi
2,* and
Hafsa Korri-Youssoufi
2,*
1
Université Paris-Saclay, CNRS, Institut de Chimie Moléculaire et des Matériaux d’Orsay (ICMMO), ECBB, Bât 420, 2 Rue du Doyen Georges Poitou, 91400 Orsay, France
2
Faculté des Sciences de Tunis El Manar, Laboratoire de Chimie Analytique et Electrochimie (LR99ES15), Campus Universitaire de Tunis El Manar, Université de Tunis El Manar, Tunis El–Manar 2092, Tunisia
*
Authors to whom correspondence should be addressed.
Appl. Sci. 2021, 11(4), 1382; https://doi.org/10.3390/app11041382
Submission received: 17 December 2020 / Revised: 21 January 2021 / Accepted: 26 January 2021 / Published: 3 February 2021
(This article belongs to the Special Issue Advanced Electrochemical Biosensors)

Abstract

:

Featured Application

Authors are encouraged to provide a concise description of the specific application or a potential application of the work. This section is not mandatory.

Abstract

The aim of this work is to detect acetamiprid using electrochemical capacitance spectroscopy, which is widely used as a pesticide in agriculture and is harmful to humans. We have designed aptasensing platform based on the adsorption of a DNA aptamer on lipoic acid-modified MoS2 nano-sheets. The biosensor takes advantage of the high affinity of single-stranded DNA sequences to MoS2 nano-sheets. The stability of DNA on MoS2 nano-sheets is assured by covalent attachment to lipoic acid that forms self-assembled layer on MoS2 surface. The biosensor exhibits excellent capacitance performances owing to its large effective surface area making it interesting material for capacitive transduction system. The impedance-derived capacitance varies with the increasing concentrations of acetamiprid that can be attributed to the aptamer desorption from the MoS2 nanosheets facilitating ion diffusion into MoS2 interlayers. The developed device showed high analytical performances for acetamiprid detection on electrochemical impedance spectroscopy EIS- derived capacitance variation and high selectivity toward the target in presence of other pesticides. Real sample analysis of food stuff such as tomatoes is demonstrated which open the way to their use for monitoring of food contaminants by tailoring the aptamer.

1. Introduction

Neonicotinoid acetamiprid is considered as one of the most efficient neuro-active insecticides, so large amounts of acetamiprid are routinely used in agriculture for treatment of numerous pests. Due to its abuse of use, the threat of pesticide residues to human health and environmental pollution are a real public concern [1]. For instance, it has been reported that acetamiprid could affect human peripheral blood lymphocytes and cause DNA damages [2] and its accumulation in agricultural products is a serious threat for human beings [3]. Thus, the detection and monitoring of acetamiprid levels in foodstuffs are of great interest for public health safety. The United States Environmental Protection Agency (EPA) and the European Food Safety Authority have set the maximum residue level (MRL) of acetamiprid from 0.01 to 3 ppm depending on the nature of the vegetables and the legislation is regularly revised regarding this MRL [4]. However, detecting pesticides at these levels is still challenging. Therefore, the development of reliable, sensitive, direct, and fast analytical methods for the acetamiprid analysis in fresh products is of paramount importance. For this purpose, various analytical methods are available such as enzyme-linked immunosorbent assays [5], gas chromatography [6], high-performance liquid chromatography [7], and gas chromatography–mass spectrometry [8]. Nevertheless, these techniques have some limitations like high equipment costs, suitable only for laboratory analysis, time-consuming due to sample preparation and require trained technicians to operate them. Hence, the development of simple, cost-effective, sensitive, and portable alternatives is necessary for the fast detection of acetamiprid in environment and agricultural field to reduce the risk of public health.
Over the last decade, electrochemical biosensors have gained increasing interest in the field of food monitoring due to their excellent properties and remarkable analytical performances [9]. Especially, oligonucleotide-based electrochemical biosensors are increasingly applied for sensitive detection of pesticide residues [10]. Aptamers are single-stranded oligonucleotides considered as excellent molecular probes, which are endowed with high affinity for various target substances, including small molecules [11], viruses [12] proteins [13], and cells [14]. In an attempt to develop electrochemical aptasensors, several acetamiprid sensing approaches based on the aptamer-target affinity have been developed. For instance, Shi et al. [15] recently reported a dual signal amplification strategy for the aptasensing of acetamiprid using reduced graphene oxide and silver nanoparticles. The electrical signal recorded by cyclic voltammetry was significantly improved after the immobilization of Prussian blue-gold nanoparticles as a catalyst for the redox reaction. In another competition-based strategy, silica nanoparticles modified dsDNA formed by the perfect match of the aptamer and a complementary sequence intercalated with methylene blue (MB) as a redox probe are used. In the presence of acetamiprid, the high affinity of aptamer toward the target induced the release of MB that is detected electrochemically using an unmodified gold electrode [16]. In the other work, Fei et al. [17] did not use a redox probe and proposed a label free impedimetric aptasensor based on complex composites of gold nanoparticles (AuNPs) decorated MWCNTs and reduced graphene oxide nanoribbons to detect femtomolar levels of the target. The aforementioned studies showed the use of conventional electrochemical techniques such as cyclic voltammetry and electrochemical impedance spectroscopy. Recent efforts focused to optimize and to enhance the signal sensitivity of these techniques and particularly of electrochemical impedance spectroscopy that needs theoretical modeling by an equivalent circuit. Accordingly, Santos et al. [18] have been working intensively on the electrochemical capacitance spectroscopy (ECS) or impedance-derived capacitance approach as a better alternative. They showed that when the system is non-faradaic or faradaic regime with an external redox probe (in solution), the electrochemical capacitance can be represented by the double layer capacitance (Cdl). In the case of a redox marker attached to the electrode surface, a pseudo-capacitance called redox capacitance (Cr) that depends on the density-of-states of the confined redox marker was considered instead the Cdl [19]. This can be explained by the fact that measuring electrochemical impedance spectroscopy (EIS) at the half-wave potential of the confined redox system, the contribution of Cr is enhanced and the Cdl remains almost constant and therefore its contribution can be neglected [20]. The Cr element corresponds to the diameter of the semicircle in Nyquist capacitive plots and its value is obtained by converting the Nyquist EIS plots. This technique has been successfully adapted for various sensing systems [21]. According to Fernandes et al. [22], the redox capacitance of a faradaic probe confined within a biological film on the surface, is sensitive to the whole system thus can be correlated to the analyte concentration when the biological film is capable of recognizing the target with high specificity. This implies that EIS-derived capacitance signal is based on the charging signal that is generated from the activity of electroactive tethered groups, which is related to its electrostatic environment.
The aim of this work was to report a new strategy based on the use of redox-active nanomaterials that will not only replace the confined redox probe but also will enhance the biosensor performances by using their capacitance properties. Particularly, two-dimensional (2D) nanomaterials have shown interesting properties that helped to improve the sensitivity and analytical performances of the developed biosensors [23]. In fact, MoS2 nanosheets attracted increasing interests for its excellent capacitive properties [24]. Their sheet-like morphology provides large surface area for charge storage that can potentially occur via faradaic charge transfer process on the Mo(+IV) metal cation. The Mo center presenting a range of oxidation states from +2 to +6 can exhibit pseudo-capacitance [25]. Hence, 2D MoS2 is an excellent choice for electrochemical capacitance spectroscopy application. Furthermore, the MoS2 possesses an ultrathin plane structure of atomic thickness making it sensitive to the surrounding environment [26]; thus, an interaction with a target biomolecule can affect its whole thickness. These properties have been explored for design of FET biosensing platform [27] as well as electrochemical biosensors [28]. Additionally, it was demonstrated that MoS2 has a high affinity towards ssDNA oligonucleotides and is able to spontaneously adsorb them via van der Waals interactions between nucleobases and the basal plane of MoS2 nano-sheets [29]. This makes MoS2 nano-sheets suitable for capacitive biosensor.
Herein, we report the design of an aptasensor platform in a two-steps process (Scheme 1) by assembling the MoS2 and ssDNA aptamer to sensitively detect acetamiprid. To assure a high stability of DNA on the surface covalent attachment was performed using lipoic acid (LA) self-assembled to MoS2 surface. The sensing platform uses EIS-derived electrochemical capacitance spectroscopy to transduce the recognition event. The novelty in this approach is to perform the electrical measurements without any confined redox probe attached to the surface or in solution as the MoS2 nanosheets exhibit an inherent pseudocapacitance behavior. Upon interaction with acetamiprid, the aptamer will desorb from MoS2 nanosheets to form aptamer/target affinity complex. The aptamer desorption facilitates ionic diffusion of the electrolytes resulting in a signal ON in ECS. The aptasensing electrode allows detecting low levels of the target pesticide and demonstrates high selectivity for the target in presence of competing pesticides. Furthermore, the aptasensor was successfully applied to detect the pesticides in tomatoes purchased form a local market.

2. Materials and Methods

2.1. Reagents

(NH4)6Mo7O24·4H2O, thiourea, lipoic acid, chloride potassium, lithium perchlorate, N-(3-dimethylaminopropyl)-N-ethylcarbodimide hydrochloride (EDC), acetamiprid, copper (II) sulfate, chlortoluron; were purchased from Sigma-Aldrich. The oligonucleotide was synthesized with an amine modification at the 5′end position and purchased from Sigma Aldrich (Germany). The sequence was originally published by He et al. [30]: 5′-H2N(CH2)6-TGTAATTTGTCTGCAGCGGTTCTTGATCGCTGACACCATATTATGAAGA-3′.
Phosphate-buffered saline (PBS) solutions 0.01 M (pH = 7.4) were prepared by dissolving one tablet in 200 mL of deionized water then filtered using a 0.22 μm membrane filter and stored at 4 °C until use. All chemicals used in this work were of analytical grade and directly used without additional purification. All solutions were prepared with Milli-Q water (18 MΩ cm−1) from a Millipore system. For the real sample assay, tomatoes were purchased from a local market (Tunisia).

2.2. Nanomaterial Preparation

2.2.1. Preparation of MoS2 Nanosheets

The preparation of ultrathin MoS2 nanosheets was achieved by a one-step hydrothermal method following the described procedure [31]. Briefly, 2.28 g (66.3 g/L) of thiourea and 1.24 g (34.4 g/L) of hexaammoniumheptamolybdate tetrahydrate (NH4)6Mo7O24·4H2O were dissolved in 36 mL of deionized water to form a homogeneous solution after stirring for 30 min. Then a tightly sealed 50 mL Teflon-lined stainless steel autoclave was filled with the obtained solution and was heated at 220 °C for 24 h. The product was cooled down to room temperature (RT), black precipitates were then collected after centrifugation and washed with distilled water and absolute ethanol for several times. Finally, the obtained MoS2 nanosheets were dried in vacuum at 60 °C for 24 h and characterized with Raman and EDX.

2.2.2. Preparation of LA-MoS2 Conjugate

MoS2 nano-sheets modified with lipoic acid were obtained following the optimized method from literature [32]. Briefly, 32 mg (1.06 g/L) of lipoic acid was dissolved in 30 mL deionized water after fixing the pH at 6.5. Then, 50 mg (1.66 g/L) of MoS2 nano-sheets was added to the resulting solution. The mixture was tip-sonicated (probe tip diameter: 13 mm, VCX 750, Sonics & Materials) for 3 h at 300 W and finally after filtration, LA-MoS2 was obtained (Scheme 2).

2.3. Modification of SPCE with MoS2

The screen-printed carbon electrode surface (SPCE) was modified with LA-MoS2nano-sheets by electrochemical deposition. The SPCE was covered with 50 µL of aqueous solution prepared with 5 mg/mL of LA-MoS2 nanosheets dispersed under sonication in 0.5 M LiClO4 solution. Then the potential was swept from 0 to −0.95 V vs. Ag/AgCl at scan rate of 50 mV s−1 for 10 cycles. After electrodeposition, the modified electrode was rinsed several times with deionized water and dried under a gentle flux of N2.

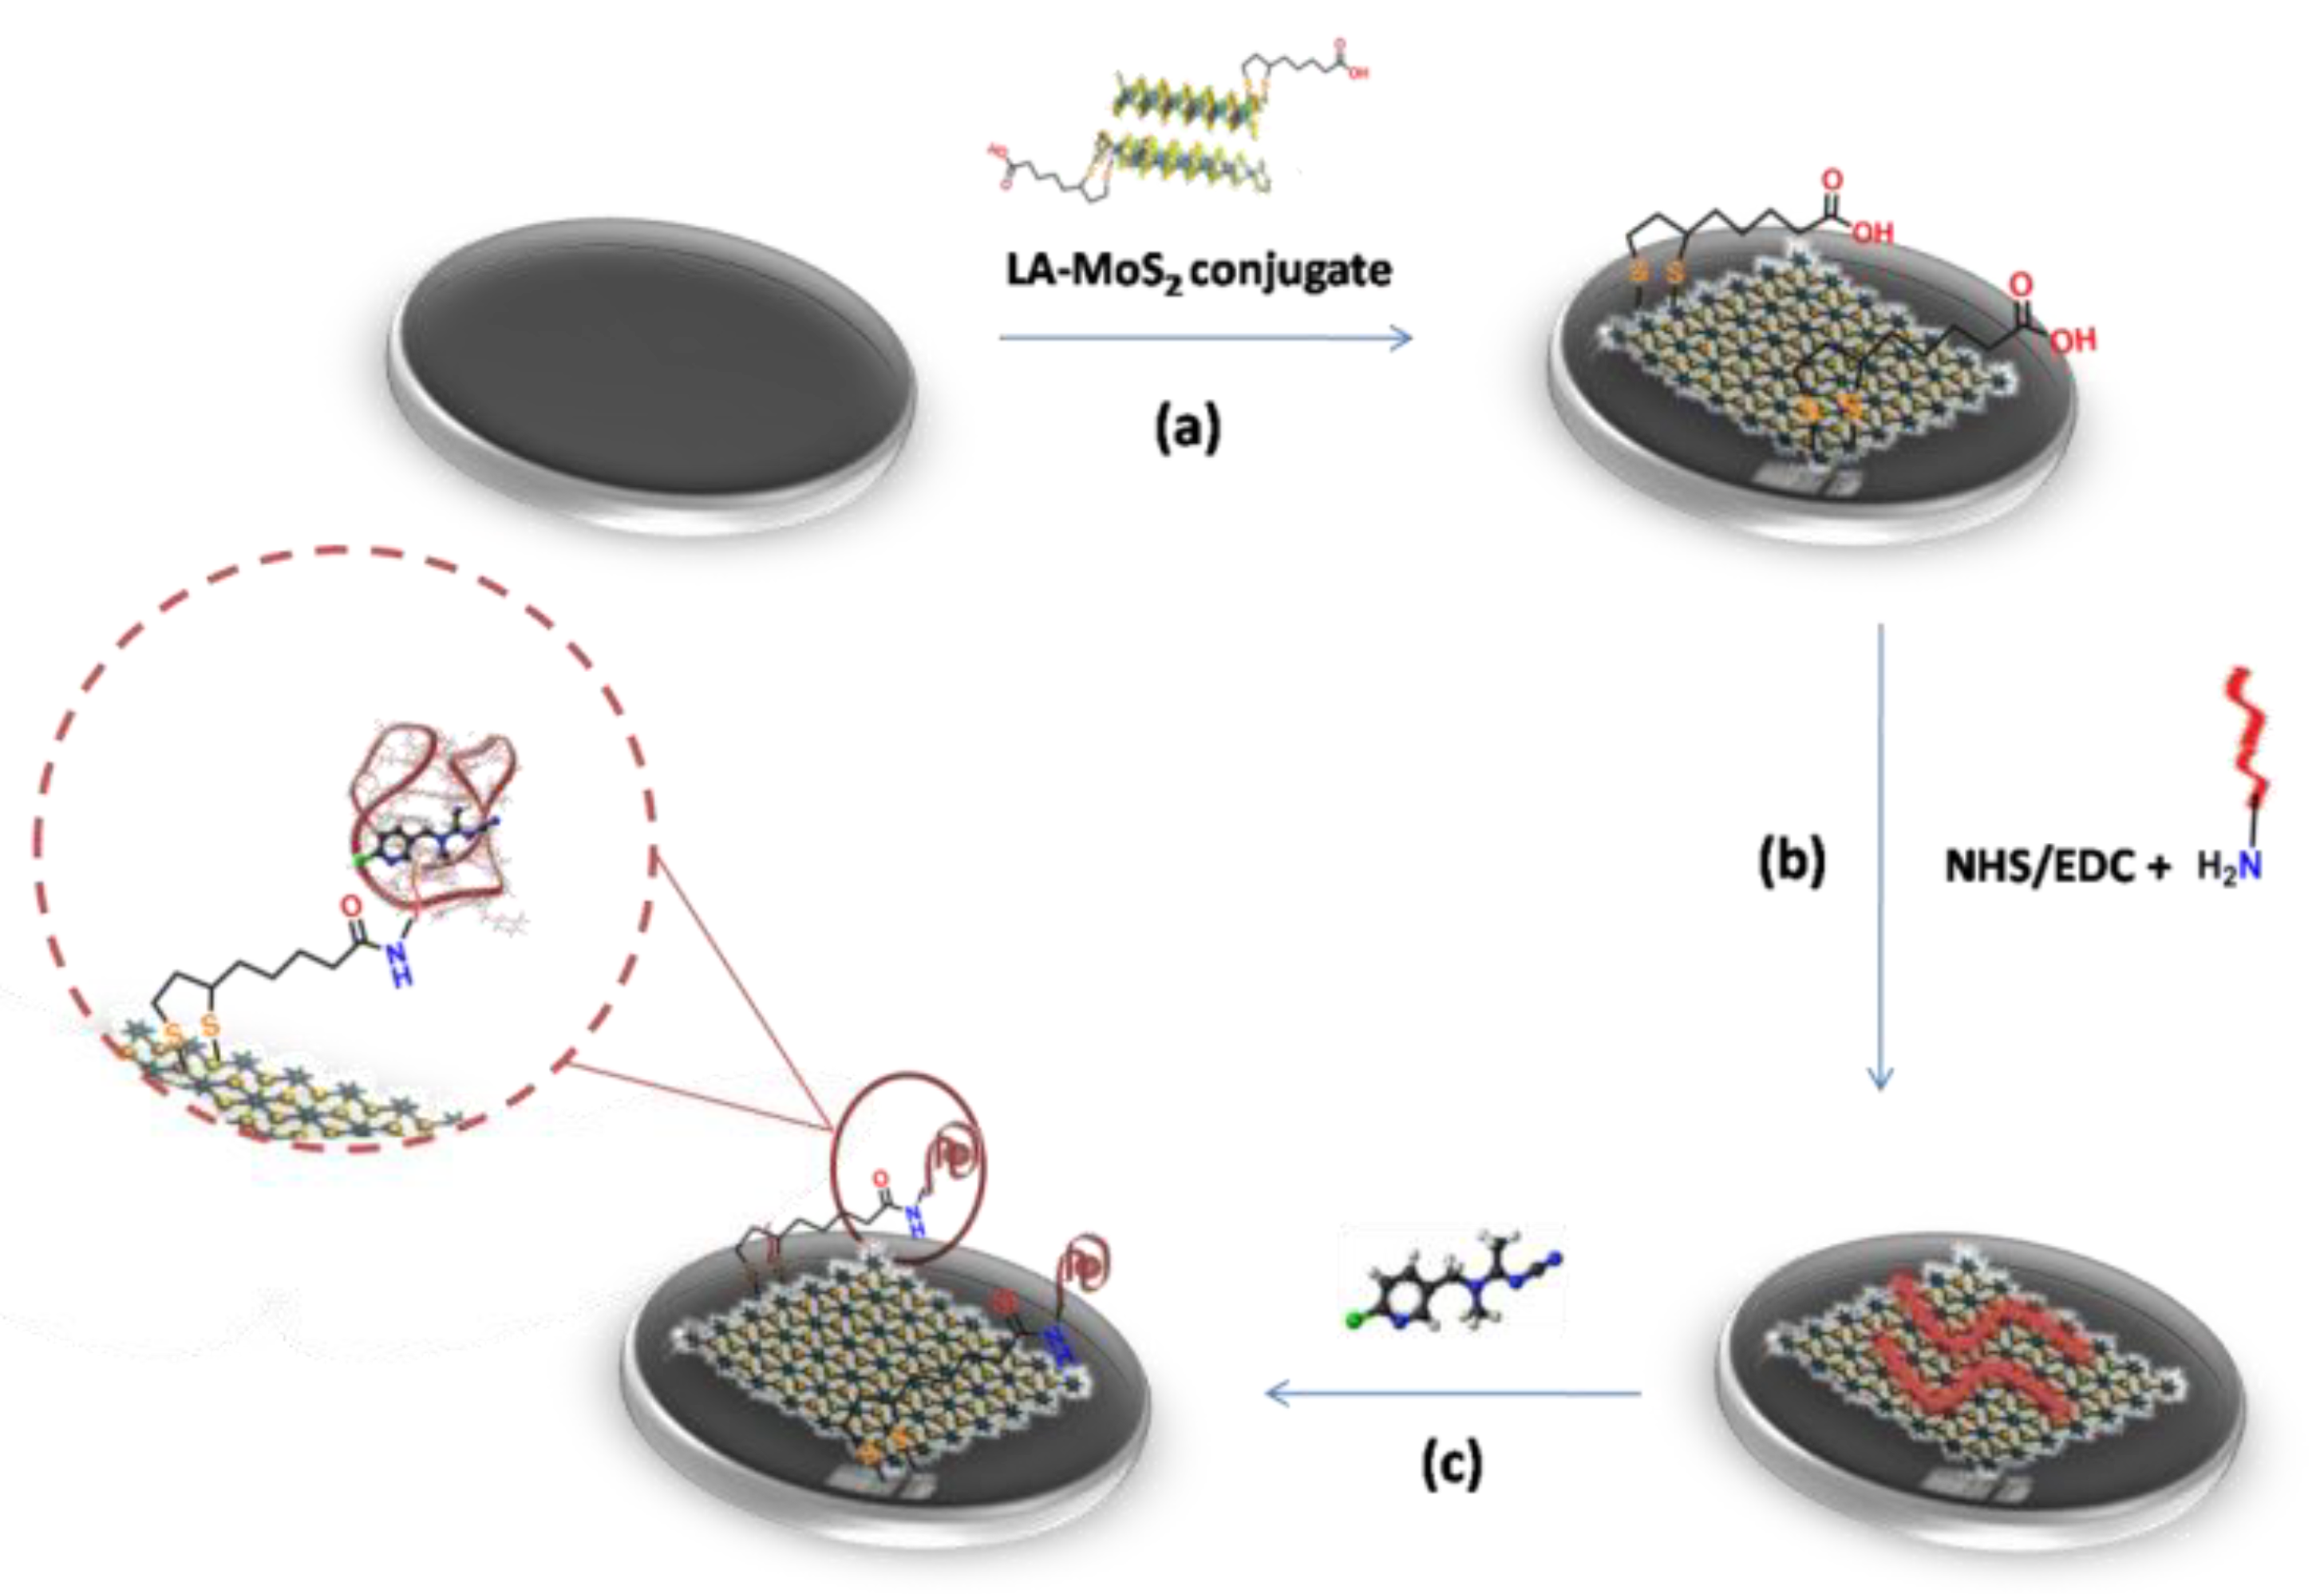
2.4. Formation of Acetamiprid Aptasensor

The aptamer functionalized with an amino group in 5′-position was covalently attached to the terminal carboxylic acid present on LA-MoS2/SPCE through an amide bond by incubating the electrode in a solution containing 5 μM of the aptamer in presence of 10 mM of the coupling agent EDC/NHS for 30 min at 35 °C following the optimized method [33]. The electrode surface was thoroughly washed with 0.01 M PBS to remove non covalently attached aptamer. Finally, the biosensor was stored overnight in PBS solution at 4 °C for stabilization.

2.5. Aptamer Binding to Acetamiprid

Aptamers are known to be very stable at RT [34]. Therefore, the aptasensing platform was incubated in 50 µL of acetamiprid solution with different concentrations ranging from 50 to 450 fM for 30 min which is enough time scale to achieve aptamer binding with the target [34]. The electrode was then washed with buffer solution before performing measurements to remove non-attached molecules.

2.6. Electrochemical Measurements

All electrochemical experiments were performed in phosphate buffer saline solutions (PBS, pH = 7.4) using PC-controlled MetrohmAutolab PGSTAT 302n electrochemical workstations with Nova software (v 1.10) to design the experiments and data collection. Screen printed carbon electrodes (SPCE) from Orion High-Tech (Madrid, Spain) were used with a conventional three-electrode configuration a 4-mm diameter-working electrode, a carbon counter electrode and an Ag/AgCl reference electrode.
The measurements were carried out in triplicate by dropping 50 µL of PBS solution onto the SPCE working surface. To characterize the stepwise modification of the surface, 50 µL of 5 mM solution of [Fe(CN)6]3/4− prepared in PBS solution was dropped on the electrode surface. The AC frequencies for impedance experiments are ranged from 100 KHz to 0.1 Hz with an applied potential of 0.1 V and DC potential of 10 mV. For all the sensing experiments, capacitance curves were measured at a potential of −0.4 V (half-wave potential of −0.4 V (Mo4+/Mo3+) reduction [18] in PBS solution without a redox marker.
The impedance complex Z*(ω) was converted into capacitance function C*(ω) through the physical equation Z*(ω) = 1/jωC*(ω) in which ω is the angular frequency. The resulting FRA data were processed and treated to obtain the real and imaginary capacitance components respectively from C″ = φZ′ and C′ = φZ″ where φ = (ω|Z|2)−1 and |Z| is the modulus of Z* [22].

2.7. Methods

Scanning electron microscope (SEM) micrographs and energy dispersive X-ray (EDX) spectra were recorded using a FEI Quanta 200 Environmental SEM. Raman spectra were obtained at room temperature by a Raman Spectrophotometer Horiba Jobin-Yvon equipped with a liquid nitrogen-cooled CCD detector. FT-IR characterizations were obtained using a Bruker Vertex FT-IR spectrometer (Bruker, Germany) equipped with a Mercury cadmium-telluride (MCT) detector and an attenuated total reflectance (ATR) germanium crystal.

3. Results and Discussions

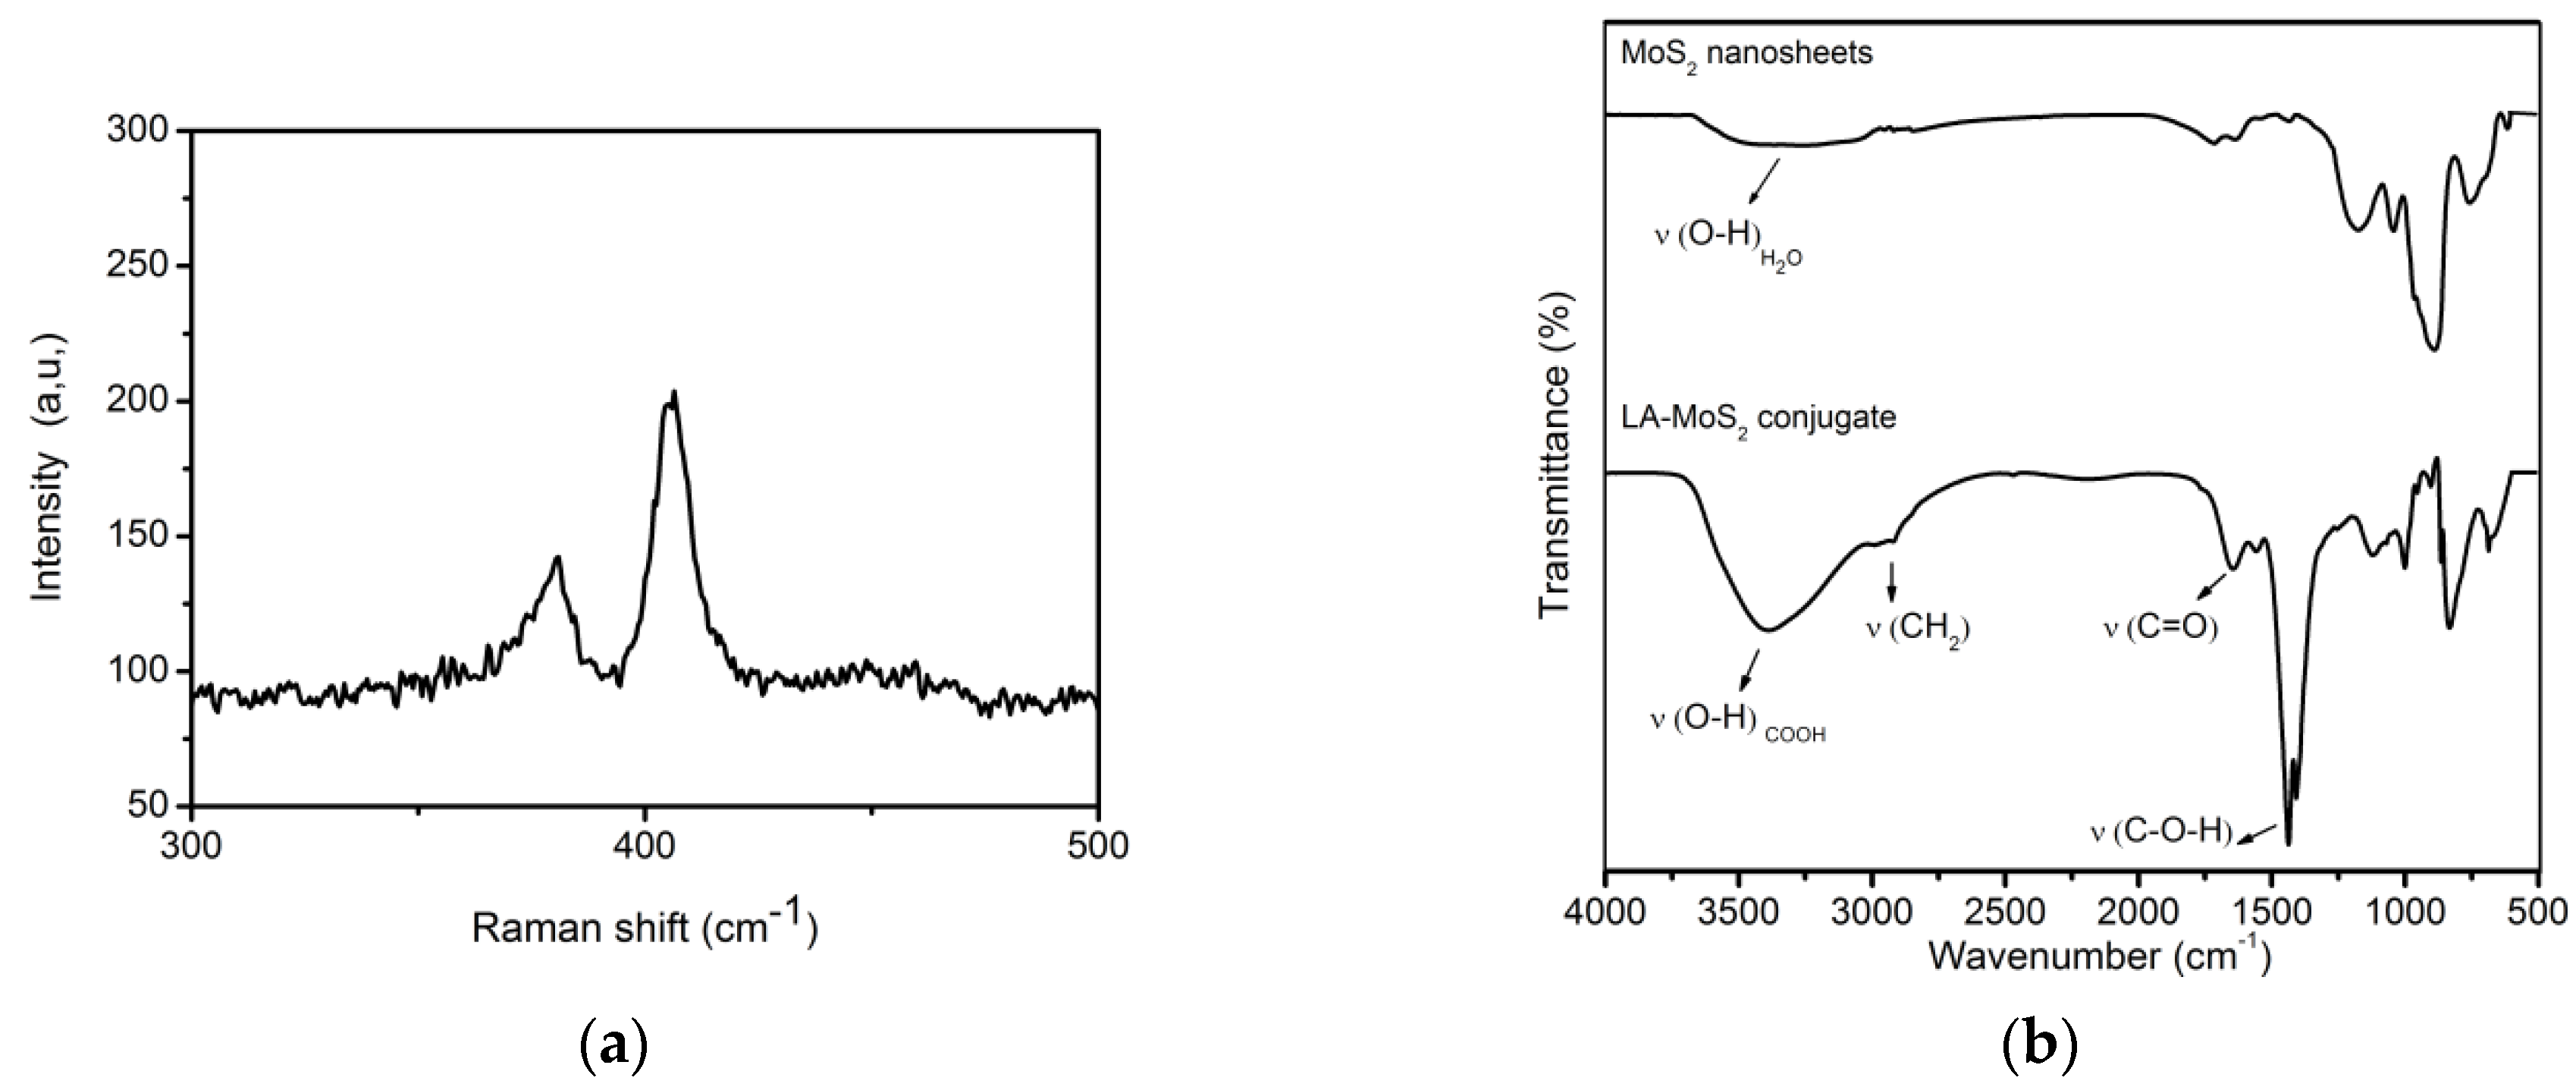
3.1. LA-MoS2 Synthesis and Structural Characterization

MoS2 was obtained by hydrothermal synthesis and was characterized by Raman spectroscopy to confirm the nano-sheets formation. The spectrum of MoS2 shows two characteristic peaks, the out-of-plane vibration of sulfur atoms (A1g) at 405.6 cm−1 and a peak characterizing the in-plane vibration of molybdenum and sulfur atoms ( E 2 g 1 ) located at 382.5 cm−1 (Figure 1a). The pic-to-pic difference of 23.1 cm−1 is consistent with obtaining one monolayer of MoS2 [35]. To introduce functional group on the surface of MoS2, the nano-sheets were treated with lipoic acid, which forms strong interaction between molybdenum and thiol group. This will provide functional acid group on the surface of MoS2 for further aptamer immobilization.
To confirm the presence of lipoic acid moieties on the MoS2 surface, FT-IR analysis was performed. The spectra displayed in Figure 1b show the characteristic bands attributed to LA such as the band located at 3500 cm−1 corresponding to O-H vibrations of carboxylic group, the band at 2925 and 2850 cm−1 corresponding to CH2 and CH stretching vibration and the band 1670 cm−1 and 1434 cm−1 corresponding to C=O and C-O vibrations, respectively of carbonyl group [36]. All above mentioned bands are absent in the control spectrum of MoS2. Furthermore, the broad band located at 3392 cm−1 corresponds to O-H stretching vibration of residual solvent in the case of unmodified MoS2 nano-sheets [37].

3.2. LA-MoS2/SPCE Surface Modification and Characterization

To build the aptasensing platform, the SPCE surface was modified with LA-MoS2 nano-sheets using an electrochemical deposition method. Indeed, LA-MoS2 was deposited using a continuous cyclic voltammetry sweep (n = 10) from the corresponding aqueous dispersion, which is an excellent general approach that allows modifying carbon surface by 2D nanomaterials through hydrophobic interaction [38]. This approach has several advantages compared to the conventional deposition methods that begin with precursors molecules. The obtained coating conserved the main properties of the deposited nanomaterials and it can be performed in aqueous solutions under mild condition, at moderate potential, and at RT. Using an electrical field, the chemical environment such as pH changes around the electrode surface due to oxidation or reduction of water. This change results on a decrease of the inter-particle repulsive forces by suppression of the nanomaterial net surface charge, which stabilizes the nanomaterial dispersion and causing its aggregation and irreversible deposition on the electrode surface [39].
The surface morphology before and after SPCE modification was probed using scanning electron microscopy (SEM) to analyze the morphology and energy-dispersive X-ray EDX (EDX) to check the surface composition. SEMs images of bare and LA-MoS2-modified SPCE are presented respectively on Figure 2a,b. The electrodeposition of LA--MoS2 led to the formation of multilayer of MoS2 nano-sheets with aggregates (Figure 2b). The vertical orientation of the MoS2 nano-sheets could be explained by the interaction between different MoS2 islands during electrodeposition. The EDX spectrum confirmed the presence of molybdenum and sulfur (Figure 2c). It also showed the Cl and O provided from ClO4 used in electrochemical deposition process and remaining in the MoS2 modified SPCE.

3.3. Biolayer Formation

The LA-MoS2 nano-sheets deposited on the SPCE contains carboxylic acid groups provided by LA that can be covalently attached to the aptamer. In a second step, the aptamer was tethered to the surface through an amide bond established between the terminal acid of the self-assembled lipoic acid on the surface of MoS2 and the amino group of the aptamer using NHS/EDC chemistry as depicted in Scheme 1 step b. The SPCE modifications steps were monitored by cyclic voltammetry (CV) and EIS using [Fe(CN)6]3/4− as a redox probe (Figure 3). The CV of LA--MoS2 showed a decrease in the peak current indicating covalent attachment of negatively charged aptamer on the surface of the electrode, which repelled the negatively charged redox probe (Figure 3a, curve b). On the other hand, electrochemical impedance spectroscopy was used to characterize the modified surface. The variation of semicircle diameter of the Nyquist plot (Figure 3b) is related to the charge transfer resistance (Rct) and reflects the status of the electrode surface. Modifying the SPCE/LA-MoS2 with aptamer, led to an increase of the Rct (Figure 3b, curve b). This can be explained by the negatively charged aptamer forming a blocking barrier to the diffusion of the redox probe ions thus confirming the CV results. This is in a good agreement with previous reports [40].

3.4. Analytical Performances

3.4.1. Acetamiprid Detection

The aptasensing platform was incubated in various concentrations of acetamiprid ranging from 50 fM to 450 fM and the ECS was used as transduction method. The capacitance signal, derived from EIS measurements, increased proportionally with the increase acetamiprid concentrations (Figure 4a). The observed behavior can be explained by strong affinity of target analyte to the aptamer, leading to desorption of the immobilized aptamer from MoS2 surface upon formation of the aptamer-target complex. This phenomenon was also observed in the case of DNA hybridization with MoS2 where hybridization reaction led to the desorption of dsDNA from the surface [29]. The loop formation of complex is distant from the surface which facilitates ion diffusion into MoS2 interlayers, where there are more sites available for ion exchange. A linear calibration curve of the average variation of normalized redox capacitance ((C0′-C/C0′)*100) with acetamiprid concentration ([ACE]) was plotted (Figure 4b). The latter shows a linear equation regression:
ΔC′/C0′ = 6733 + 0.03[ACE]/(fM) (R2 = 0.999)
High coefficient of regression in the concentration ranging from 50 to 450 fM is obtained that confirms the linearity of the measurement. Furthermore, the detection limit was calculated to be 14 fM by considering the criteria of signal-to-noise ratio equals three. The reproducibility of the sensor was determined by measuring five different electrodes. The relative standard deviation (RSD) was calculated at 5.4%, which indicates the sensor has good electrode-to-electrode reproducibility thanks to the electrodeposition method which allows high reproducibility of MoS2 layers in addition of DNA covalent attachment. This biosensor presents a good performance with comparable analytical performance with other systems described in introduction without amplification strategy where signal readout was measured directly after detection. It takes also advantage of the chemical stability of MoS2 where storage of the MoS2 and LA-MoS2 was checked within long time without any variation of properties. In addition aptamer are known to have high stability compared to others biological system [41]. The biosensor is proposed for single use without regeneration.
This detection domain obtained does not include the concentration values of the maximum levels of acetamiprid set by US EPA and EFSA. It is worthy to note that reel samples have to be diluted further before acetamiprid detection, which helps to further decrease the matrix effect. So, taking into consideration this dilution step, it is of high interest to develop aptasensor for acetamiprid detection in diluted extracted samples.

3.4.2. Comparison with Reported Acetamiprid Aptasensors

Regarding the large literature of acetamiprid detection, the analytical performances presented by SPCE/LA-MoS2 are solely compared with those of published on aptasensing (see Table 1). These studies showed the use of conventional electrochemical techniques such as CV, DPV, and EIS while in this work ECS was used for the first time to achieve sensitive detection of acetamiprid and lead to obtain signal on detection. In terms of LOD the developed analytical device showed the lowest value of 14 fM where the other biosensors are in pM range [15,16,42,43]. The biosensors achieving LOD in the femtomolar range are formed with various nanomaterials including metallic nanoparticles [17,44] which can have negative impact for environment. Moreover, the SPCE/LA-MoS2 aptasensor presents an easy fabrication process obtained by two steps where patterning through electrodeposition of LA-MoS2 on SPCE presents an advantage for biosensor conception and chemical attachment of aptamer ensures it to have a longer shelf life. This approach taking advantage of adsorption/desorption process of ssDNA and aptamer complex from MoS2 surface and the variation of capacitance readout demonstrated excellent balance between high performance, simplicity, and cost-effectiveness compared to others electrochemical biosensors.

3.4.3. Selectivity

The selectivity is an important parameter for analytical sensing devices, which characterizes the ability of the aptamer to detect the specific analyte in a sample containing other interfering molecules. The aptasensing platform was challenged by testing it with different interferents such as chlortoluron and copper (II) for copper-based pesticides as only few analytical method could discriminate the nature of remained contaminant residue [45]. Therefore, the biosensor response obtained with acetamiprid alone was compared with those obtained in presence of interferents under the same experimental conditions. The results collected from capacitance curves are presented Figure 5. The response recorded in the presence of aforementioned interferents did not show any increase of the capacitance signal. A blocking effect was observed with chlortoluron, leading to decrease in capacitance while Cu2+ induced a minor perturbation of the transduction signal leading also to decrease of ECS response. This study evidences the high selectivity of the aptasensor toward acetamiprid knowing that the interferents have concentrations 10-fold higher than that of the target.

3.5. Detection of Acetamiprid in Fortified Tomatoe Sample

Tomatoes are one of the foodstuffs that could be affected by the acetamiprid and where the EFSA legislation was fixed the MRL to 0.01 ppm [4]. To perform the detection of acetamiprid on tomatoes, the sample were prepared following the method reported by Kim et al. [46]. Briefly, 5 g of tomatoes samples were extracted with 10 mL of methanol for 30 min, and then centrifuged for 20 min at 10,000 rpm (4 °C) to remove the solids. The supernatant was filtered through a 0.45-micron membrane. Then, aliquots were doped initially with acetamiprid (ci = 65 fM) that will be confirmed later via the standard addition method. This procedure allows the calibration of analytical devices taking into consideration the matrix effects. The capacitance curves in tomatoes samples solution showed a proportional increase of the capacitance signal with the addition of increasing target concentrations (Figure 6a). The obtained calibration plot (Figure 6b) allowed to determinate ci by extrapolation to be found equal to 62.1 ± 0.51 fM. In addition, the obtained recovery values for the measurements performed in tomatoes and in PBS are gathered in Table 2. High recovery values are comprised from 95 to 104%, depending on concentration. Thus, the ability of the method to measure small amount of pesticides in food demonstrates the potential of this biosensor of the acetamiprid detection in food.

4. Conclusions

We report a platform of aptasensing based on MoS2 nanomaterials and the capacitance signal readout for the detection of acetamiprid as a pesticide widely used in agriculture. The device was built on SPCE in two steps to obtain self-assembled MoS2/ssDNA nanostructures. We demonstrated that the high affinity of MoS2 nanosheets for ssDNA and their pseudo redox properties enable the biosensor to achieve rapid detection and high sensitivity. The detection system takes advantage of the adsorption/desorption process provided by the ssDNA and the aptamer complex with the MoS2 surface. In addition, this biosensor has demonstrated high analytical performance with a signal “ON” in the presence of acetamiprid and a detection limit in the fM range, lower than that set by the UPA and EFSA. The study of the detection of spiked acetamiprid in tomatoes showed a measurement comparable with those obtained in a buffer and underlines the ability of this biosensor to measure low levels of pesticides in fresh foodstuffs. These results demonstrated that the methodology developed with these biosensors can be easily adapted to detect other targets of interest. This work paves the way for the development of different highly sensitive and cost-effective aptasensors for food control applications by simply changing the aptamer specific to other pesticides.

Author Contributions

Conceptualization M.H. and N.R.; methodology M.H., N.R., and M.H., validation, N.R. and H.K.-Y.; formal analysis, M.H.; N.R., and H.K.-Y.; writing—original draft preparation, M.H. and N.R.; writing—review and editing, M.H. and H.K.-Y. Supervision, N.R. and H.K.-Y.; project administration, H.K.-Y.; funding acquisition, H.K.-Y. All authors have read and agreed to the published version of the manuscript.

Funding

This research was funded by MEAE and MESRI PHC grand number 39382RE.

Institutional Review Board Statement

Not Applicable.

Informed Consent Statement

Not applicable.

Data Availability Statement

Data is contained within the article.

Acknowledgments

The authors acknowledge technical support from Instrumental Platform of ICMMO University Paris-Saclay.

Conflicts of Interest

The authors declare no conflict of interest.

References

  1. Imamura, T.; Yanagawa, Y.; Nishikawa, K.; Matsumoto, N.; Sakamoto, T. Two cases of acute poisoning with acetamiprid in humans. Clin. Toxicol. 2010, 48, 851–853. [Google Scholar] [CrossRef] [PubMed]
  2. Kocaman, A.Y.; Topaktaş, M. Genotoxic effects of a particular mixture of acetamiprid and alpha-cypermethrin on chromosome aberration, sister chromatid exchange, and micronucleus formation in human peripheral blood lymphocytes. Environ. Toxicol. 2010, 25, 157–168. [Google Scholar] [CrossRef] [PubMed]
  3. Qi, Y.; Xiu, F.-R.; Zheng, M.; Li, B. A simple and rapid chemiluminescence aptasensor for acetamiprid in contaminated samples: Sensitivity, selectivity and mechanism. Biosens. Bioelectron. 2016, 83, 243–249. [Google Scholar] [CrossRef] [PubMed]
  4. U.S. Environmental Protection Agency. Name of Chemical: Acetamiprid Reason for Issuance: Conditional Registration. 2002 Date Issued: March 15 Acetamiprid Proposed Interim Registration Review Decision Case Number 7617 January 2020, Docket Number EPA-HQ-OPP-2012-0329. Available online: https://www.epa.gov/sites/production/files/2020-01/documents/acetamiprid_pid.pdf (accessed on 9 September 2020).
  5. Wanatabe, S.; Ito, S.; Kamata, Y.; Omoda, N.; Yamazaki, T.; Munakata, H.; Kaneko, T.; Yuasa, Y. Development of competitive enzyme-linked immunosorbent assays (ELISAs) based on monoclonal antibodies for chloronicotinoid insecticides imidacloprid and acetamiprid. Anal. Chim. Acta 2001, 427, 211–219. [Google Scholar] [CrossRef]
  6. Zhang, B.; Pan, X.; Venne, L.; Dunnum, S.; McMurry, S.T.; Cobb, G.P.; Anderson, T.A. Development of a method for the determination of 9 currently used cotton pesticides by gas chromatography with electron capture detection. Talanta 2008, 75, 1055–1060. [Google Scholar] [CrossRef]
  7. Vichapong, J.; Burakham, R.; Srijaranai, S. Alternative Liquid–Liquid Microextraction as Cleanup for Determination of Neonicotinoid Pesticides Prior HPLC Analysis. Chromatographia 2016. [Google Scholar] [CrossRef]
  8. Mateu-Sánchez, M.; Moreno, M.; Arrebola, F.J.; Vidal, J.L.M. Analysis of Acetamiprid in Vegetables Using Gas Chromatography-Tandem Mass Spectrometry. Anal. Sci. 2003, 19, 701–704. [Google Scholar] [CrossRef] [Green Version]
  9. Zeng, L.; Peng, L.; Wu, D.; Yang, B. Electrochemical Sensors for Food Safety. In Nutrition in Health and Disease—Our Challenges Now and Forthcoming Time; IntechOpen: London, UK, 2018. [Google Scholar] [CrossRef] [Green Version]
  10. Li, Z.; Mohamed, M.A.; Vinu Mohan, A.M.; Zhu, Z.; Sharma, V.; Mishra, G.K.; Mishra, R.K. Application of Electrochemical Aptasensors toward Clinical Diagnostics, Food, and Environmental Monitoring: Review. Sensors (Basel) 2019, 19, 5435. [Google Scholar] [CrossRef] [Green Version]
  11. Ben Aissa, S.; Mars, A.; Catanante, G.; Marty, J.-L.; Raouafi, N. Design of a redox-active surface for ultrasensitive redox capacitive aptasensing of aflatoxin M1 in milk. Talanta 2019, 195, 525–532. [Google Scholar] [CrossRef]
  12. Zou, X.; Wu, J.; Gu, J.; Shen, L.; Mao, L. Application of Aptamers in Virus Detection and Antiviral Therapy. Front. Microbiol. 2019, 10, 1462. [Google Scholar] [CrossRef] [Green Version]
  13. Raouafi, A.; Sánchez, A.; Raouafi, N.; Villalonga, R. Electrochemical aptamer-based bioplatform for ultrasensitive detection of prostate specific antigen. Sens. Actuators B Chem. 2019, 297, 126762. [Google Scholar] [CrossRef]
  14. Sun, D.; Lu, J.; Zhang, L.; Chen, Z. Aptamer-based electrochemical cytosensors for tumor cell detection in cancer diagnosis: A review. Anal. Chim. Acta 2019, 1082, 1–17. [Google Scholar] [CrossRef] [PubMed]
  15. Shi, X.; Sun, J.; Yao, Y.; Liu, H.; Huang, J.; Guo, Y.; Sun, X. Novel electrochemical aptasensor with dual signal amplification strategy for detection of acetamiprid. Sci. Total Environ. 2020, 705, 135905. [Google Scholar] [CrossRef] [PubMed]
  16. Taghdisi, S.M.; Danesh, N.M.; Ramezani, M.; Abnous, K. Electrochemical aptamer based assay for the neonicotinoid insecticide acetamiprid based on the use of an unmodified gold electrode. Microchim. Acta 2017, 184, 499–505. [Google Scholar] [CrossRef]
  17. Fei, A.; Liu, Q.; Huan, J.; Qian, J.; Dong, X.; Qiu, B.; Mao, H.; Wang, K. Label-free impedimetric aptasensor for detection of femtomole level acetamiprid using gold nanoparticles decorated multiwalled carbon nanotube-reduced graphene oxide nanoribbon composites. Biosens. Bioelectron. 2015, 70, 122–129. [Google Scholar] [CrossRef]
  18. Santos, A. Fundamentals and Applications of Impedimetric and Redox Capacitive Biosensors. J. Anal. Bioanal. Tech. 2014, S7. [Google Scholar] [CrossRef]
  19. Cecchetto, J.; Fernandes, F.C.B.; Lopes, R.; Bueno, P.R. The capacitive sensing of NS1 Flavivirus biomarker. Biosens. Bioelectron. 2017, 87, 949–956. [Google Scholar] [CrossRef] [Green Version]
  20. Lehr, J.; Weeks, J.R.; Santos, A.; Feliciano, G.T.; Nicholson, M.I.G.; Davis, J.J.; Bueno, P.R. Mapping the ionic fingerprints of molecular monolayers. Phys. Chem. Chem. Phys. 2017, 19, 15098–15109. [Google Scholar] [CrossRef]
  21. Raouafi, A.; Rabti, A.; Raouafi, N. A printed SWCNT electrode modified with polycatechol and lysozyme for capacitive detection of α-lactalbumin. Microchim. Acta 2017, 184, 4351–4357. [Google Scholar] [CrossRef]
  22. Fernandes, F.C.B.; Góes, M.S.; Davis, J.J.; Bueno, P.R. Label free redox capacitive biosensing. Biosens. Bioelectron. 2013, 50, 437–440. [Google Scholar] [CrossRef]
  23. Su, S.; Sun, Q.; Gu, X.; Xu, Y.; Shen, J.; Zhu, D.; Chao, J.; Fan, C.; Wang, L. Two-dimensional nanomaterials for biosensing applications. TrAC Trends Anal. Chem. 2019, 119, 115610. [Google Scholar] [CrossRef]
  24. Patel, R.; Inamdar, A.; Kim, H.; Im, H. In-Situ hydrothermal synthesis of a MoS2 nanosheet electrode for electrochemical energy storage applications. J. Korean Phys. Soc. 2016, 68, 1341–1346. [Google Scholar] [CrossRef]
  25. Soon, J.M.; Loh, K. Electrochemical Double-Layer Capacitance of MoS2 Nanowall Films. Electrochem. Solid-State Lett. 2007, 10, A250. [Google Scholar] [CrossRef]
  26. Chen, X.; Park, Y.J.; Kang, M.; Kang, S.-K.; Koo, J.; Shinde, S.M.; Shin, J.; Jeon, S.; Park, G.; Yan, Y.; et al. CVD-grown monolayer MoS 2 in bioabsorbable electronics and biosensors. Nat. Commun. 2018, 9, 1690. [Google Scholar] [CrossRef] [Green Version]
  27. Liu, J.; Chen, X.; Wang, Q.; Xiao, M.; Zhong, D.; Sun, W.; Zhang, G.; Zhang, Z. Ultrasensitive Monolayer MoS2 Field-Effect Transistor Based DNA Sensors for Screening of Down Syndrome. Nano Lett. 2019, 19, 1437–1444. [Google Scholar] [CrossRef] [PubMed]
  28. Dalila R, N.; Md Arshad, M.K.; Gopinath, S.C.B.; Norhaimi, W.M.W.; Fathil, M.F.M. Current and future envision on developing biosensors aided by 2D molybdenum disulfide (MoS2) productions. Biosens. Bioelectron. 2019, 132, 248–264. [Google Scholar] [CrossRef] [PubMed]
  29. Zhu, C.; Zeng, Z.; Li, H.; Li, F.; Fan, C.; Zhang, H. Single-Layer MoS2-Based Nanoprobes for Homogeneous Detection of Biomolecules. J. Am. Chem. Soc. 2013, 135, 5998–6001. [Google Scholar] [CrossRef]
  30. He, J.; Liu, Y.; Fan, M.; Liu, X. Isolation and Identification of the DNA Aptamer Target to Acetamiprid. J. Agric. Food Chem. 2011, 59, 1582–1586. [Google Scholar] [CrossRef]
  31. Zhang, X.H.; Wang, C.; Xue, M.Q.; Lin, B.C.; Ye, X.; Lei, W.N. Hydrothermal synthesis and characterization of ultrathin MoS2 nanosheets. Chalcogenide Lett. 2016, 13, 27–34. [Google Scholar] [CrossRef] [Green Version]
  32. Jeong, M.; Kim, S.; Ju, S.-Y. Preparation and characterization of a covalent edge-functionalized lipoic acid–MoS2 conjugate. RSC Adv. 2016, 6, 36248–36255. [Google Scholar] [CrossRef]
  33. Haddaoui, M.; Sola, C.; Raouafi, N.; Korri-Youssoufi, H. E-DNA detection of rpoB gene resistance in Mycobacterium tuberculosis in real samples using Fe3O4/polypyrrole nanocomposite. Biosens. Bioelectron. 2019, 128, 76–82. [Google Scholar] [CrossRef] [PubMed]
  34. Feier, B.; Băjan, I.; Cristea, C.; Săndulescu, R. Aptamer-based Electrochemical Sensor for the Detection of Ampicillin. In Proceedings of the International Conference on Advancements of Medicine and Health Care through Technology, Cluj-Napoca, Romania, 12–15 October 2016; Vlad, S., Roman, N.M., Eds.; Springer International Publishing: Cham, Switzerland, 2017; pp. 107–110. [Google Scholar]
  35. Li, H.; Lu, G.; Yin, Z.; He, Q.; Li, H.; Zhang, Q.; Zhang, H. Optical Identification of Single- and Few-Layer MoS2 Sheets. Small 2012, 8, 682–686. [Google Scholar] [CrossRef] [PubMed]
  36. Nie, C.; Zhang, B.; Gao, Y.; Yin, M.; Yi, X.; Zhao, C.; Zhang, Y.; Luo, L.; Wang, S. Thickness-Dependent Enhancement of Electronic Mobility of MoS2 Transistors via Surface Functionalization. J. Phys. Chem. C 2020, 124, 16943–16950. [Google Scholar] [CrossRef]
  37. Zhou, K.; Jiang, S.; Bao, C.; Song, L.; Wang, B.; Tang, G.; Hu, Y.; Gui, Z. Preparation of poly(vinyl alcohol) nanocomposites with molybdenum disulfide (MoS2): Structural characteristics and markedly enhanced properties. RSC Adv. 2012, 2, 11695. [Google Scholar] [CrossRef]
  38. Kong, N.; Zhang, S.; Liu, J.; Wang, J.; Liu, Z.; Wang, H.; Liu, J.; Yang, W. The influence of 2D nanomaterials on electron transfer across molecular thin films. Mol. Syst. Des. Eng. 2019, 4, 431–436. [Google Scholar] [CrossRef]
  39. Rastogi, P.K.; Sarkar, S.; Mandler, D. Ionic strength induced electrodeposition of two-dimensional layered MoS2 nanosheets. Appl. Mater. Today 2017, 8, 44–53. [Google Scholar] [CrossRef]
  40. Mejri-Omrani, N.; Miodek, A.; Zribi, B.; Marrakchi, M.; Hamdi, M.; Marty, J.-L.; Korri-Youssoufi, H. Direct detection of OTA by impedimetric aptasensor based on modified polypyrrole-dendrimers. Anal. Chim. Acta 2016, 920, 37–46. [Google Scholar] [CrossRef]
  41. Wang, Y.; Ning, G.; Bi, H.; Wu, Y.; Liu, G.; Zhao, Y. A Novel Ratiometric Electrochemical Assay for Ochratoxin A Coupling Au Nanoparticles Decorated MoS2 Nanosheets with Aptamer. Electrochim. Acta 2018, 285, 120–127. [Google Scholar] [CrossRef]
  42. Yao, Y.; Wang, G.X.; Shi, X.J.; Li, J.S.; Yang, F.Z.; Cheng, S.T.; Zhang, H.; Dong, H.W.; Guo, Y.M.; Sun, X.; et al. Ultrasensitive aptamer-based biosensor for acetamiprid using tetrahedral DNA nanostructures. J. Mater. Sci. 2020, 55, 15975–15987. [Google Scholar] [CrossRef]
  43. Madianos, L.; Tsekenis, G.; Skotadis, E.; Patsiouras, L.; Tsoukalas, D. A highly sensitive impedimetric aptasensor for the selective detection of acetamiprid and atrazine based on microwires formed by platinum nanoparticles. Biosens. Bioelectron. 2018, 101, 268–274. [Google Scholar] [CrossRef]
  44. Jiang, D.; Du, X.; Liu, Q.; Zhou, L.; Dai, L.; Qian, J.; Wang, K. Silver nanoparticles anchored on nitrogen-doped graphene as a novel electrochemical biosensing platform with enhanced sensitivity for aptamer-based pesticide assay. Analyst 2015, 140, 6404–6411. [Google Scholar] [CrossRef] [PubMed]
  45. Grimalt, S.; Dehouck, P. Review of Analytical Methods for the Determination of Pesticide Residues in Grapes. J. Chromatogr. A 2016, 1433, 1–23. [Google Scholar] [CrossRef] [PubMed]
  46. Kim, H.-J.; Shelver, W.L.; Li, Q.X. Monoclonal antibody-based enzyme-linked immunosorbent assay for the insecticide imidacloprid. Anal. Chim. Acta 2004, 509, 111–118. [Google Scholar] [CrossRef]
Scheme 1. Building up strategy for the design of acetamiprid aptasensor: (a) LA-MoS2 electrodeposition, (b) covalent aptamer immobilization, and (c) acetamiprid detection.
Applsci 11 01382 sch001
Scheme 2. Schematic description of preparation of LA--MoS2 conjugate.
Applsci 11 01382 sch002
Figure 1. Spectroscopic characterization of MoS2 and LA--MoS2: (a) Spectrum of MoS2 after hydrothermal synthesis; (b) FTIR spectra of MoS2 nanosheets and LA--MoS2 conjugate.
Applsci 11 01382 g001
Figure 2. SEM images of: (a) bare screen-printed carbon electrode surface (SPCE); (b) SPCE modified LA--MoS2Nano-sheets; (c) EDX analysis of the modified SPCE with MoS2 nano-sheets.
Applsci 11 01382 g002
Figure 3. Electrochemical characterization in solution of 5 mM [Fe(CN)6]3/4− and 0.1 MKCl: (a) CVs recorded at scan rate 100 mV/s; (b) EIS obtained with frequency range: 100 KHz to 0.1 Hz with DC of 10 mV with (curve a) SPCE/LA--MoS2 and (curve b) SPCE/LA--MoS2/APT.
Applsci 11 01382 g003
Figure 4. (a) Capacitance curves before and after incubation at various acetamiprid concentrations in Phosphate-buffered saline (PBS); (b) Calibration curve of the biosensor displaying the relative variation of redox capacitance %ΔC/C0′ vs. [ACE].
Applsci 11 01382 g004
Figure 5. Histograms giving the relative variation of redox capacitance variation after incubation with different interferents.
Applsci 11 01382 g005
Figure 6. (a) Capacitance curves before (a: 0 fM) and (b to e) after incubation with various acetamiprid concentrations in fortified tomatoes samples (b: ci, c: ci + 55 fM, d: ci + 155 fM and e: ci + 255 fM); (b) Calibration curve of the biosensor displaying the relative variation of redox capacitance versus the target concentration.
Applsci 11 01382 g006
Table 1. Analytical performances of various aptasensors.
PlatformsDetection MethodDynamic RangeLODRef
GCE 1/AuNPs 2CV0.1 pM–10 nM0.077 pM[42]
PtNPs 3 microstrips modified Au IDEs 4EIS10 pM–100 nM1 pM[43]
SiNP 5-streptavidin conjugate modified MB-dsDNA 6DPV500 pM–6.5 µM1.53 pM[16]
GCE/rGO-AgNPs 7/PB-AuNPs 8CV1 pM–1 µM0.3 pM[15]
GCE/Au/MWCNT-rGONRe 9EIS50 fM–10 µM17 fM[17]
GCE/Ag NPs anchored on nitrogen-doped grapheneEIS100 fM–5 nM33 fM[44]
SPCE/LA-MoS2ECS50 fM–450 fM14 fMThis work
1. GCE:Glassy Carbone Electrode, 2 AuNPs: Gold Nanoparticles, 3 Pt NPs: Platinum Nanoparticles, 4 IDEs: interdigitated electrodes, 5 Si NPs: Silicananoparticles, 6 MB-dsDNA: Methylene Blue-double stranded DNA, 7 rGO-AgNPs: reduced grapheme oxide-Silver Nanoparticles, 8 PB-AuNPs: Prussian blue-gold nanoparticles, 9 MWCNT-rGONRe: Multiwalled carbon nanotubes-reduced graphene oxide nanoribbon.
Table 2. Recovery data for acetamiprid in fortified tomatoes sample.
Sample[ACE]added[ACE]foundRecovery (%)
1 ci65.062.1 ± 0.5195.5
2 (ci + 55.0)120.0120.2 ± 0.28100.1
3 (ci + 155.0)220.0227.0 ± 0.32103.2
4 (ci + 255.0)320.0334.0 ± 0.45104.3
Publisher’s Note: MDPI stays neutral with regard to jurisdictional claims in published maps and institutional affiliations.

