Article

Effects of Differential Subgrade Settlement on Slab Track Deformation Based on a DEM-FDM Coupled Approach

1
School of Civil Engineering, Beijing Jiaotong University, Beijing 100044, China
2
Institute of Urban Smart Transportation & Safety Maintenance, Shenzhen University, Shenzhen 518060, China
3
School of Civil Engineering, Wuhan University, Wuhan 430072, China
4
School of Computer Science and Engineering, Beihang University, Beijing 100083, China
*
Author to whom correspondence should be addressed.
Appl. Sci. 2021, 11(4), 1384; https://doi.org/10.3390/app11041384
Submission received: 30 December 2020 / Revised: 26 January 2021 / Accepted: 27 January 2021 / Published: 3 February 2021
(This article belongs to the Special Issue Interactions between Railway Subsystems)

Abstract

:
Slab track structures become deformed under the effects of differential subgrade settlement. According to the properties of the China Railway Track System (CRTS) II slab track on a subgrade, a three-dimensional (3D) coupled model based on both the discrete element method (DEM) and finite difference method (FDM) was developed. The slab track and subgrade were simulated using the FDM and DEM, respectively. The coupled model was verified. The deformation of the slab track and contact forces of gravel grains in the surface layer of the subgrade were studied under differential subgrade settlement. The effects of settlement wavelength, settlement amplitude, and other types of settlements were also discussed. The results demonstrate that the settlement amplitude and settlement wavelength of the subgrade have significant effects on track deformation. The deformation amplitude of the slab track increases nonlinearly with an increasing settlement amplitude of the subgrade. Increases in the settlement wavelength and amplitude of the subgrade significantly increase the maximum value of the contact force of the gravel grains in the subgrade. The maximum contact force of gravel grains near the boundaries of the settlement section can reach two to three times that of the unsettled condition, which makes it easy to accelerate the plastic settlement of the subgrade.

1. Introduction

Recently, high-speed railways have developed rapidly and the China Railway Track System (CRTS) II slab track has been widely used [1,2,3]. With increasing train speed, requirements for the smoothness and stability of railways have also increased [4]. However, differential subgrade settlement commonly occurs under the long-term effects of train load [5]. The differential subgrade settlement has become a key problem in the maintenance of the CRTS II slab track. Differential subgrade settlement causes track irregularities, intensifies wheel-rail interactions, and changes the mechanical properties of track structures [6,7]. Therefore, estimating the effects of differential subgrade settlement on track deformation is a crucial step for conducting an in-depth analysis of the relationship between traffic service statuses and subgrade settlement [8,9]. A site map and cross-section of the CRTS II slab track are presented in Figure 1. The CRTS II slab track system mainly consists of the rail, fastener, precast slab, cement emulsified asphalt (CA) mortar layer, and concrete base.
Some studies on the mapping relationship between subgrade settlement and track deformation have been conducted. Guo et al. [10] derived an analytical expression for the mapping relationship between subgrade settlement and track deformation based on the two-dimensional Winkler foundation beam theory. However, it had a deviation from the actual three-dimensional situation. Gou et al. [11] presented an analytical model to study the effects of the lateral and vertical settlements of bridge pier on track geometry. Sun et al. [12] studied the mapping relationship between ballast settlement and rail deformation based on a theoretical model using an iterative method. However, the subgrade was not modeled. Jiang et al. [13] studied the track deformation caused by the settlement of bridge pier based on the principle of minimum potential energy. Cai et al. [14] developed a finite element model for a double-block track by using the software ABAQUS (Dassault Systemes, Paris, France.). However, the soil was considered as a linear elastic body, which cannot accurately simulate the deformation of the soil subgrade. Xiao et al. [15] analyzed the effects of differential subgrade settlement on the stress and displacement of the CRTS III slab track based on the finite element method. In their study, the subgrade was also simplified as an elastic body. Chen et al. [16] derived an analytical expression for track deformation under pier settlement conditions for the slab track-bridge system. The dynamic responses of the vehicle-track system under bridge pier settlement were also analyzed. Zhou et al. [17] investigated the effects of vertical deformation of the continuous beam structure of the CRTS Ι slab track on rail deformation based on the principle of stationary potential energy. It can be seen from the above that there are more studies on bridge pier settlement, but relatively few studies on subgrade settlement. The subgrade is often considered as an elastic body by the previous studies, which has shortcomings in accurately simulating the cumulative deformation and rheological behavior of the actual subgrade.
Besides, many researchers have investigated the effects of subgrade settlement on the stress and dynamic responses of the track structure. Xiang et al. [18] established a numerical model for a slab track based on the finite element method and studied the effects of differential subgrade settlement on the stress of the slab track. However, the stress of the subgrade had not been paid attention to. He et al. [19] studied the dynamic responses of the vehicle-track system at the transition zones of the railway based on the vehicle-track interaction theory. Xu et al. [20] established a dynamic analysis model for a ballastless track based on the vehicle-track interaction theory and finite element method. Che et al. [21] established a numerical model for a subgrade by using the discrete element method (DEM) and studied the dynamic characteristics of the subgrade under cyclic loading. The results indicated that the subgrade plays a crucial role in the stability of railway tracks and affects the settlement of tracks. Li et al. [22] developed a coupled model that incorporates both the DEM and the finite difference method (FDM) to study the dynamic behaviors of the railway ballast assembly. The results showed the superiority of the DEM-FDM coupled model in simulating the interaction between continuum and discrete domains. Zhu et al. [23] conducted numerical triaxial tests, in which the rubber membrane and soil body were simulated by using the FDM and DEM, respectively. The modeling method of the DEM-FDM model in [22] was adopted in this paper.
In summary, the differential subgrade settlement has an important effect on the stress and deformation of the track structure. The analysis methods adopted by previous studies mainly include the analytical method and the finite element method. The nonlinear contact characteristics between layers of a track-subgrade system are often ignored in analytical methods and the mechanical properties of track structures cannot be accurately reflected. A finite element model can accurately simulate the stress and deformation of a track structure. However, the subgrade was simplified as an elastic body and the stress state of the subgrade was rarely paid attention to. The track structure undergoes the following deformation in a subgrade settlement section, which changes the load of the track structure on the subgrade and affects the continued settlement of the subgrade [24]. Therefore, there are coupling effects between subgrade and track structure that must be considered. The subgrade of a high-speed railway is largely composed of graded gravel. The subgrade may be cracked or otherwise deteriorated when the settlement is large. In this case, it is not appropriate to simulate the subgrade as a linear elastic body. In DEM, the granular material is considered as assembled particles interacting by force-displacement law and Newton-second law [25]. It is suitable for simulating discontinuous and large deformation problems, which is consistent with the situation when the subgrade produces a large settlement. The non-uniform contact between the track structure and subgrade in a settlement section cannot be accurately simulated by using the DEM-FDM coupled approach.
Based on the above analysis, the slab track was considered as a continuous domain using the FDM. The subgrade was considered as a discrete domain using the DEM. DEM-FDM coupled simulation was realized by adopting interface elements for data interaction. This paper is organized as follows. First, the description of the DEM-FDM coupled mechanism was presented. Second, the coupled model was developed and verified. Finally, the effects of differential subgrade settlement on track deformation and contact forces of gravel grains were studied. The effects of settlement wavelength, settlement amplitude, and other types of settlement were also discussed. It is expected that the obtained results could provide helpful guidance for the maintenance and optimization of high-speed railways.

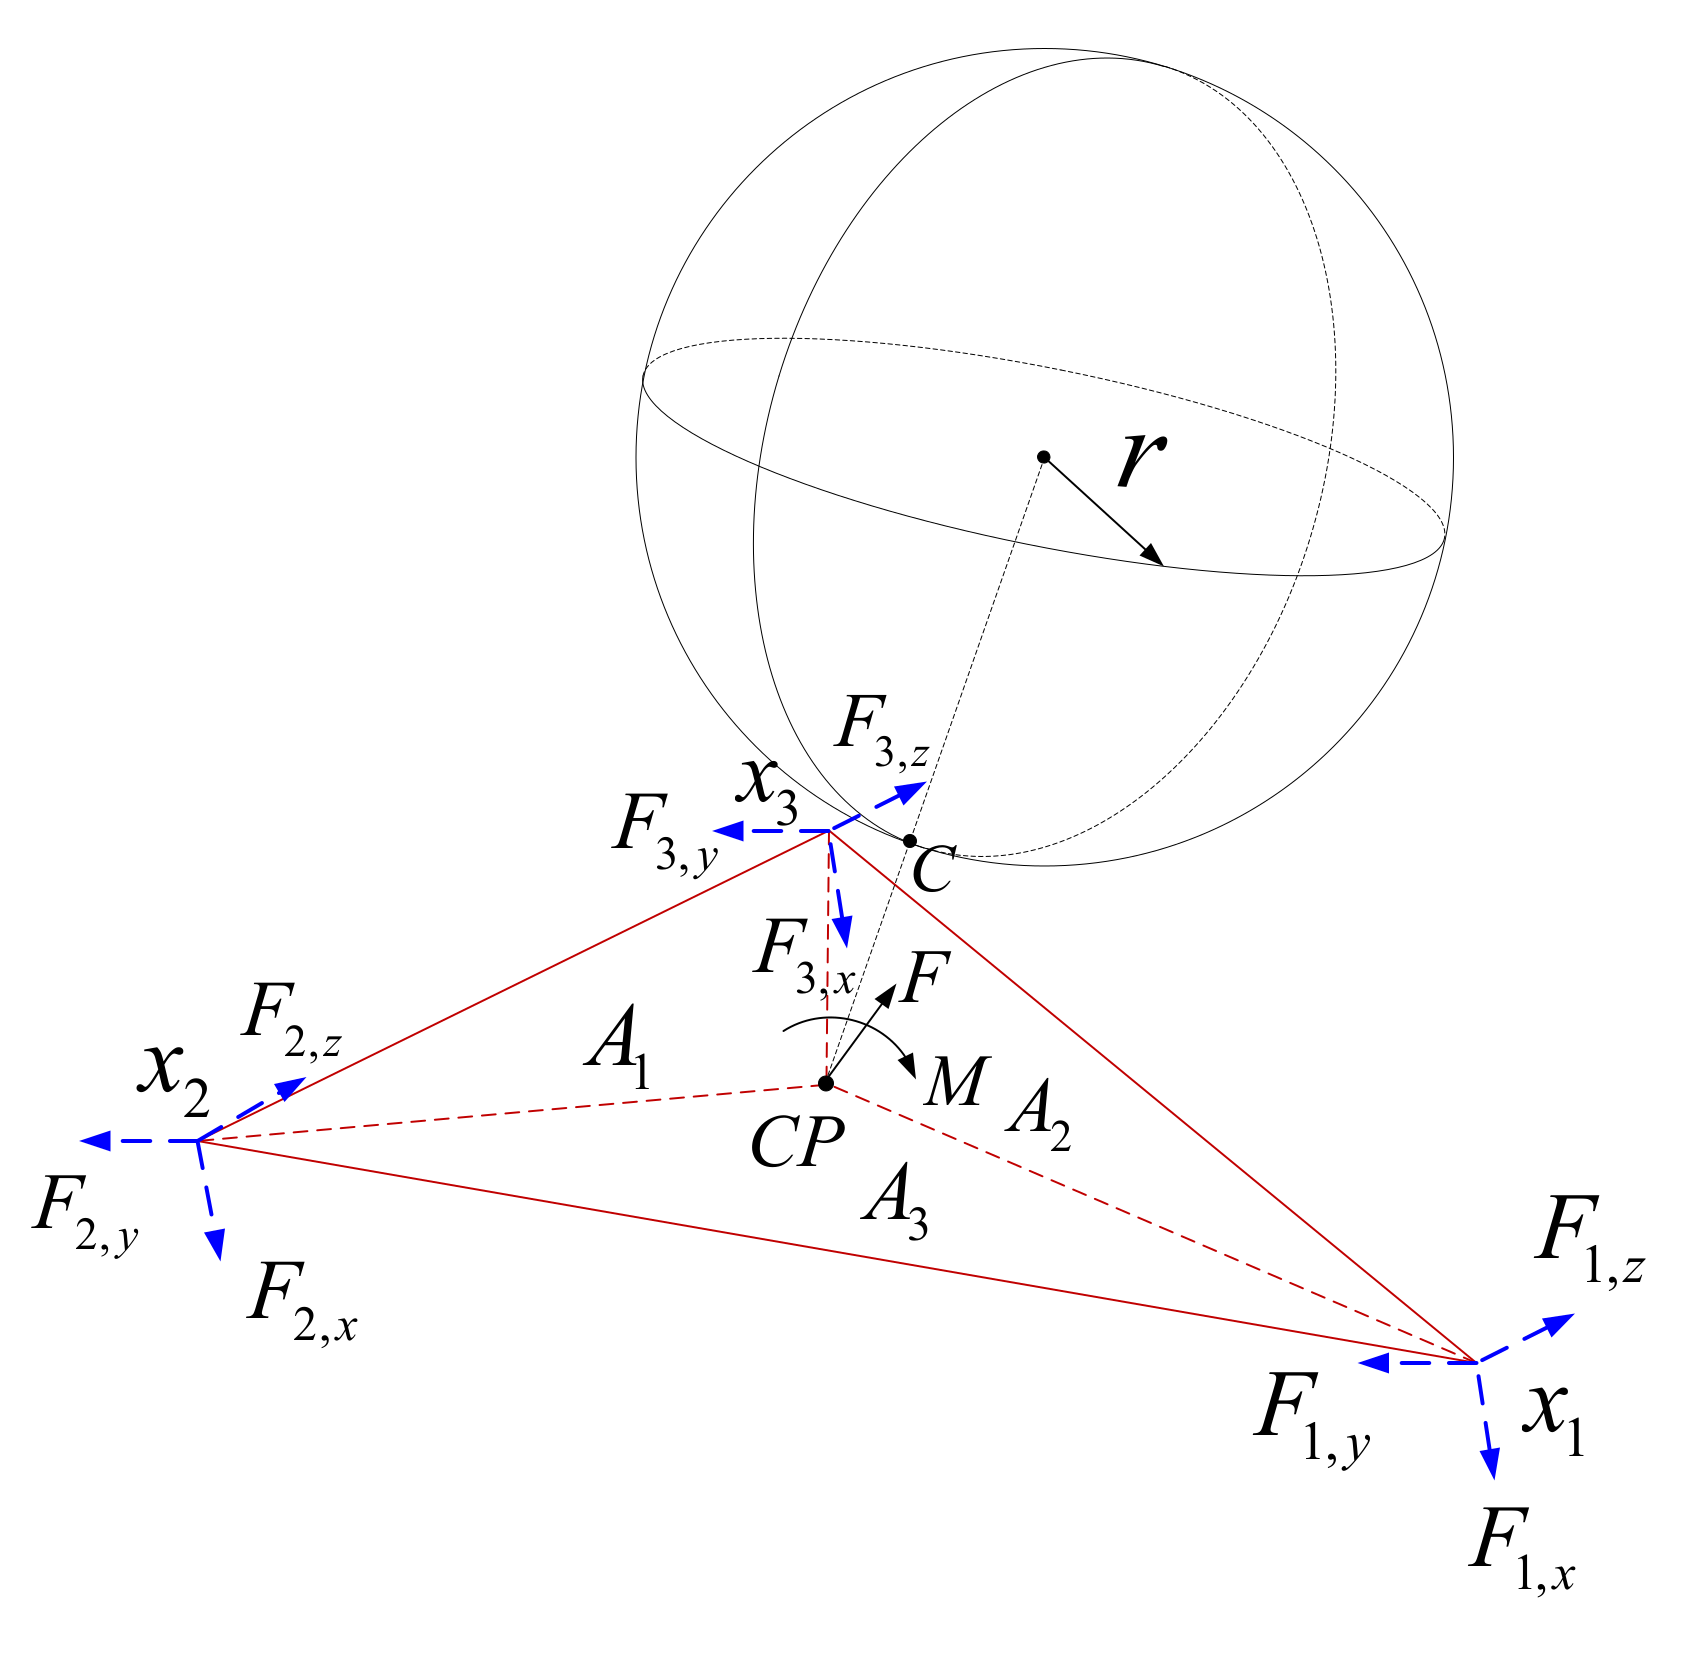
2. DEM-FDM Coupled Mechanism

The coupling of the DEM and FDM was realized by adopting interface elements between the discrete and continuous domains. Interface elements transfer the load from the discrete domain to the continuous domain and transfer the nodal velocity from the continuous domain at the interface to the discrete domain. The interface between the discrete and continuous domains is divided into triangles. A contact diagram for the discrete and continuous domains is presented in Figure 2 [26].
Figure 2 represents a ball particle in contact with a triangular interface element. C refers to the contact point and C P refers to the position of the point closest to C on the triangular interface element. The positions of the three vertices of the triangular interface element are denoted as x i ( i = 1 , 2 , 3 ). The areas of the three triangles created by connecting the three vertices of the triangle at C P are denoted as A i ( i = 1 , 2 , 3 ). The total area of the three triangles is denoted as A = i = 1 3 A i .
The weighting factors ω i for each vertex are determined by dividing the triangular area opposite from the vertex by the total area of the larger triangle as ω i = A i / A . Therefore, the expression ω i = 1 is satisfied, which ensures that the sum of the values extrapolated from C P to the vertices is equal to the value at C P .
Here r i ( i = 1 , 2 , 3 ) refers to the vectors pointing from C P to the triangle vertices (i.e., r i = x i C P ). Let the forces applied at the contact point C be denoted as F . Because the contact point C on the ball particle and the point C P on the interface element may not be at the same location, the total moment of the ball particle acting on the interface element is calculated as
M = ( C C P ) × F .
Take the forces applied on the triangle vertices to be F i ( i = 1 , 2 , 3 ), then the following equations can be obtained:
F i = F ,
r i × F i = M .
In the local coordinate system, the x component coincides with the normal direction of the triangle and the y component coincides with the tangential direction of the triangle. Therefore, in the local coordinate system, the equivalent force system on the vertices of the triangle can be expressed as
F i , x = F x ,
F i , y = F y ,
F i , z = F z = 0 ,
( r i , y × F i , z r i , z × F i , y ) = M x ,
( r i , z × F i , x r i , x × F i , z ) = M y ,
( r i , x × F i , y r i , y × F i , x ) = M z .
Additionally, the following constraints are introduced to derive a specific solution to the equations above:
( r i , z × F i , z ) = 0 .
The equations above are the basic governing equations for the adopted DEM-FDM coupled method. During the simulation process, the node velocity, displacement, and load information are continuously transmitted between the continuous and discrete domain to realize coupling calculations.

3. DEM-FDM Coupled Model
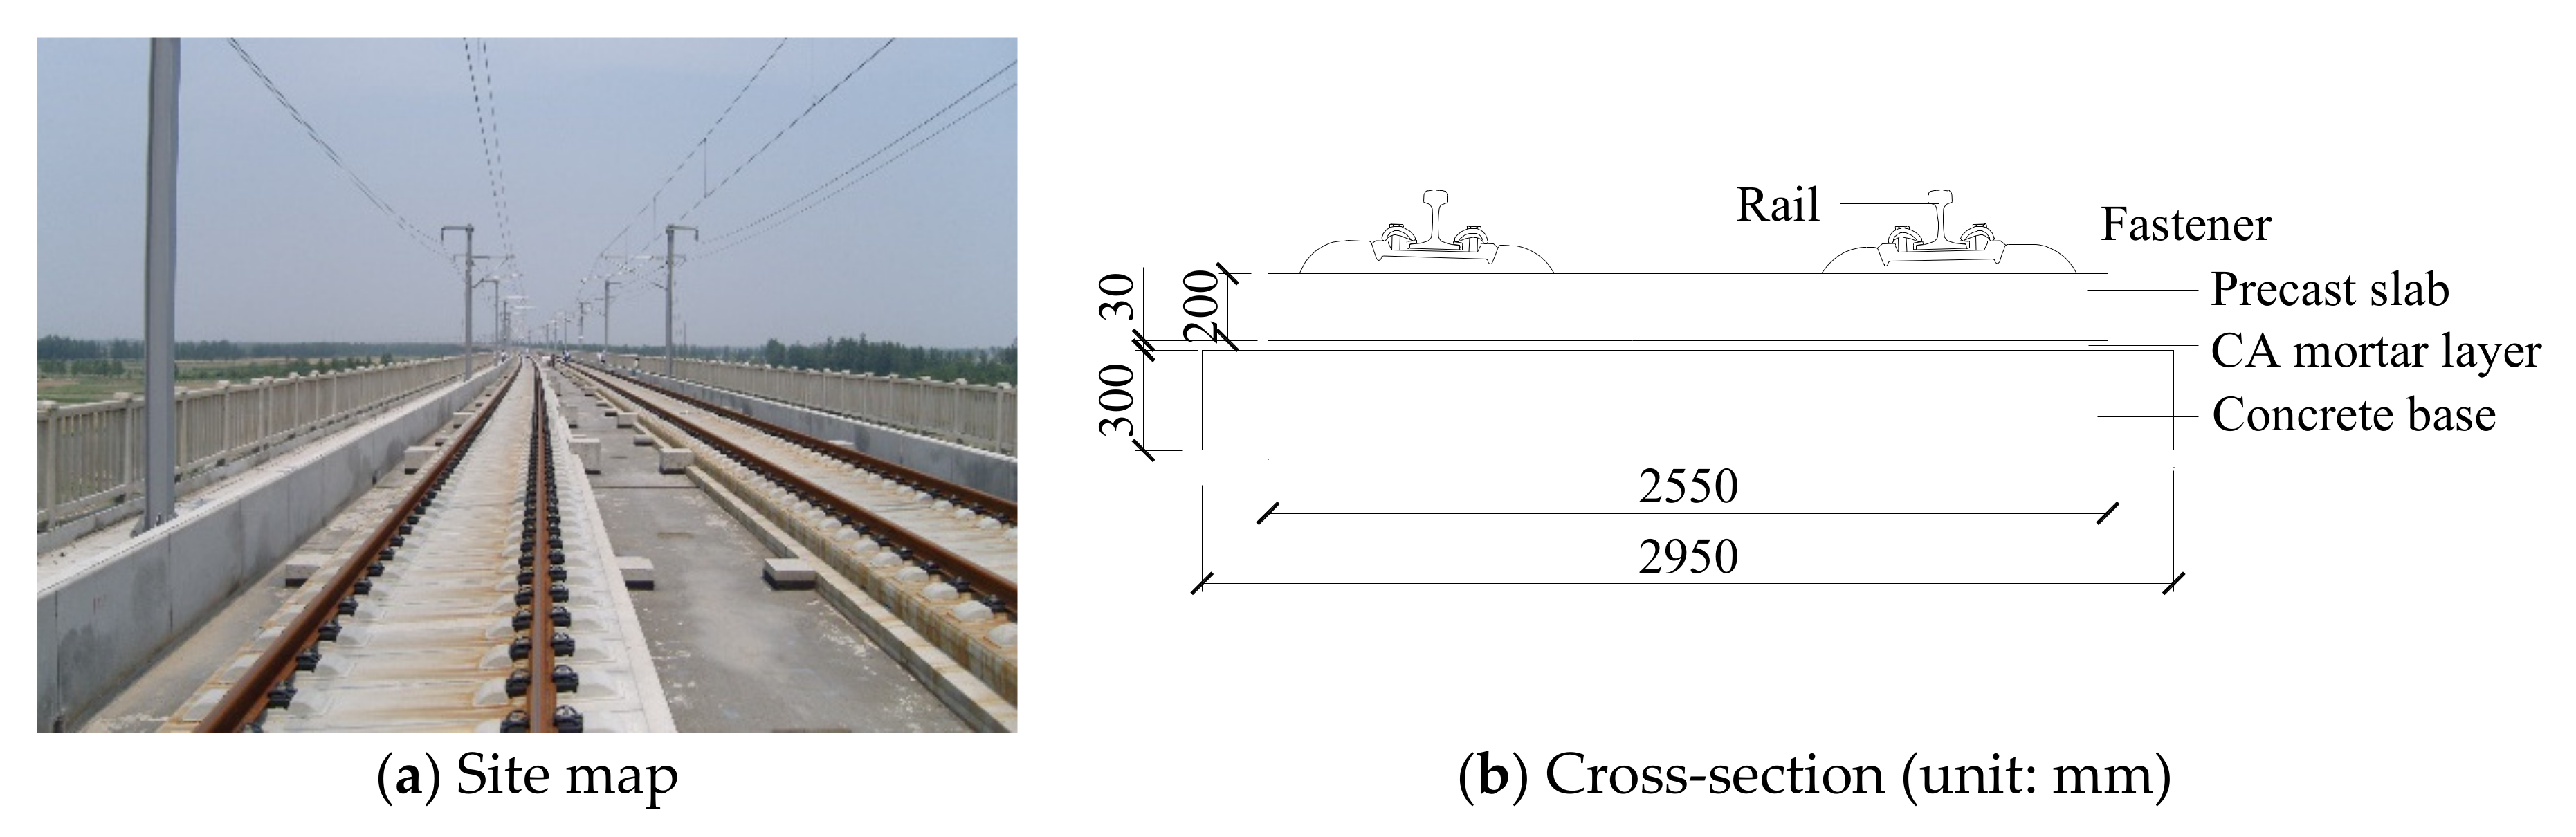
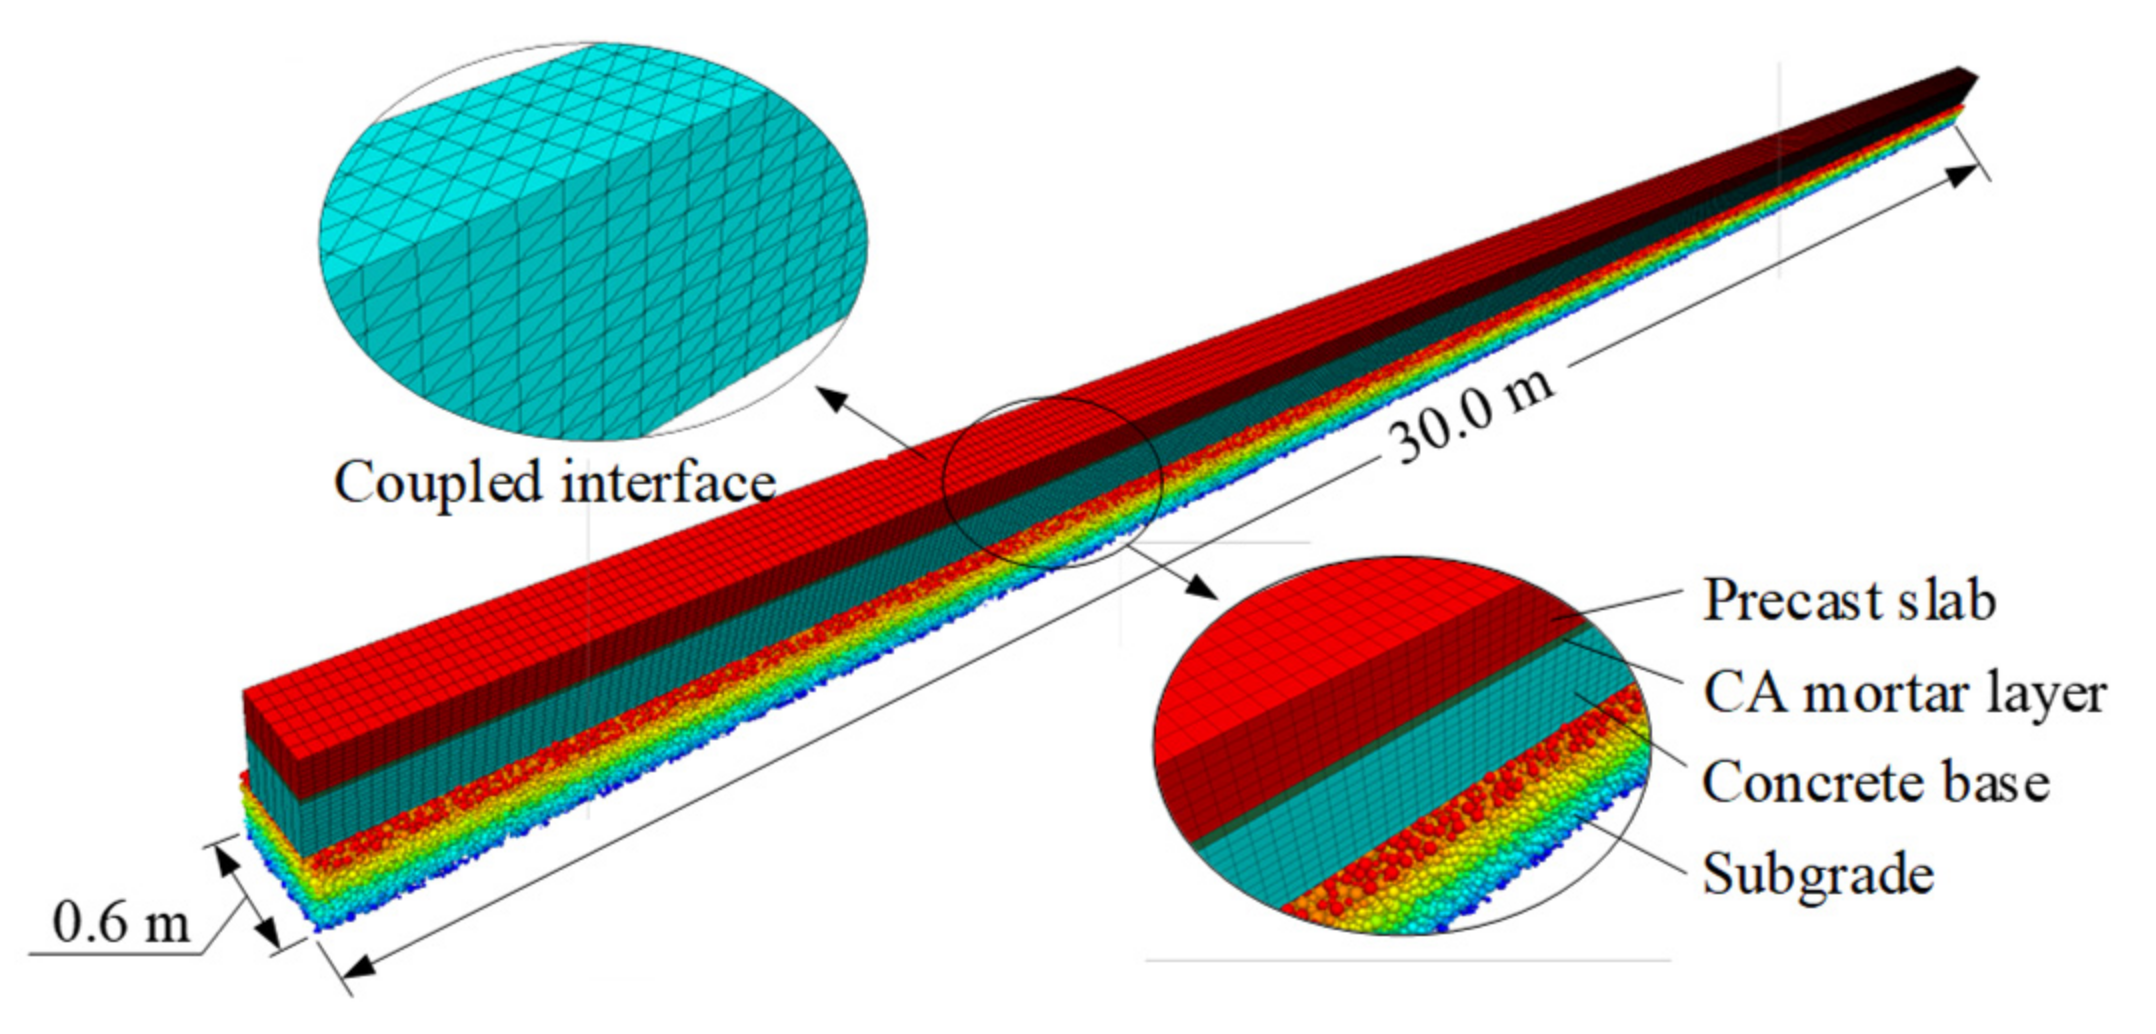
3.1. Modeling

The CRTS II slab track was considered as a continuous domain and the subgrade was considered as a discrete domain. An FD model of a CRTS II slab track was developed by using the software of FLAC3D (Itasca, Minneapolis, MN, USA). A DE model of the surface layer of the subgrade was developed by using the software of PFC3D (Itasca, Minneapolis, MN, USA). The FLAC3D can be loaded with the program load command in PFC3D 6.0 version [26]. So the PFC3D and FLAC3D can be run at the same time. The DEM-FDM coupled model is presented in Figure 3. Because the slab track mainly experiences vertical deformation under differential subgrade settlement, the lateral deformation of the track structure can be ignored. Therefore, the horizontal size of the track structure was reduced and only a strip-shaped model was established. The FD model consisted of the precast slab, CA mortar layer, and concrete base. The rails and fasteners were not taken into account. The width of the model along the transverse direction was 0.6 m. The length of the model along the longitudinal direction was 30 m. The thicknesses of the precast slab, CA mortar layer, and concrete base in the model were 0.2, 0.03, and 0.3 m, respectively. The FD model of the CTRS II slab track has meshed with solid elements. This model contained 39,600 solid elements and 50,484 nodes. It was assumed that there is no separation or slipping between the precast slab, CA mortar layer, and concrete base. The symmetry constraints were applied to the two ends of the slab track.
The surface layer of the subgrade is in direct contact with the slab track. The dynamic stress in the surface layer of the subgrade attenuates quickly under train load and the dynamic stress in the bottom layer of the subgrade is significantly reduced [27]. Therefore, only the surface layer of the subgrade was considered in this study. Ball units were used to model the gravel grains in the subgrade. Considering that the irregular shape of the particles will affect the mechanical properties, the contact behaviors between grains were simulated using the rolling resistance model to represent the interlocking between irregularly shaped grains [28]. The thickness of the surface layer of the subgrade was 0.4 m. The bottom and side boundaries of the surface layer of the subgrade model were simulated with wall elements. The gradation curve of the gravel used in this study is presented in Figure 4.
The average particle size of the gravel in the model was less than 40 mm. When the container size is greater than eight times the average particle size, the boundary effects of the container can be ignored [29]. Therefore, the boundary effects in this model can be ignored. The surface of the slab track was defined as a coupled interface for data interaction. The parameters for the model are listed in Table 1.

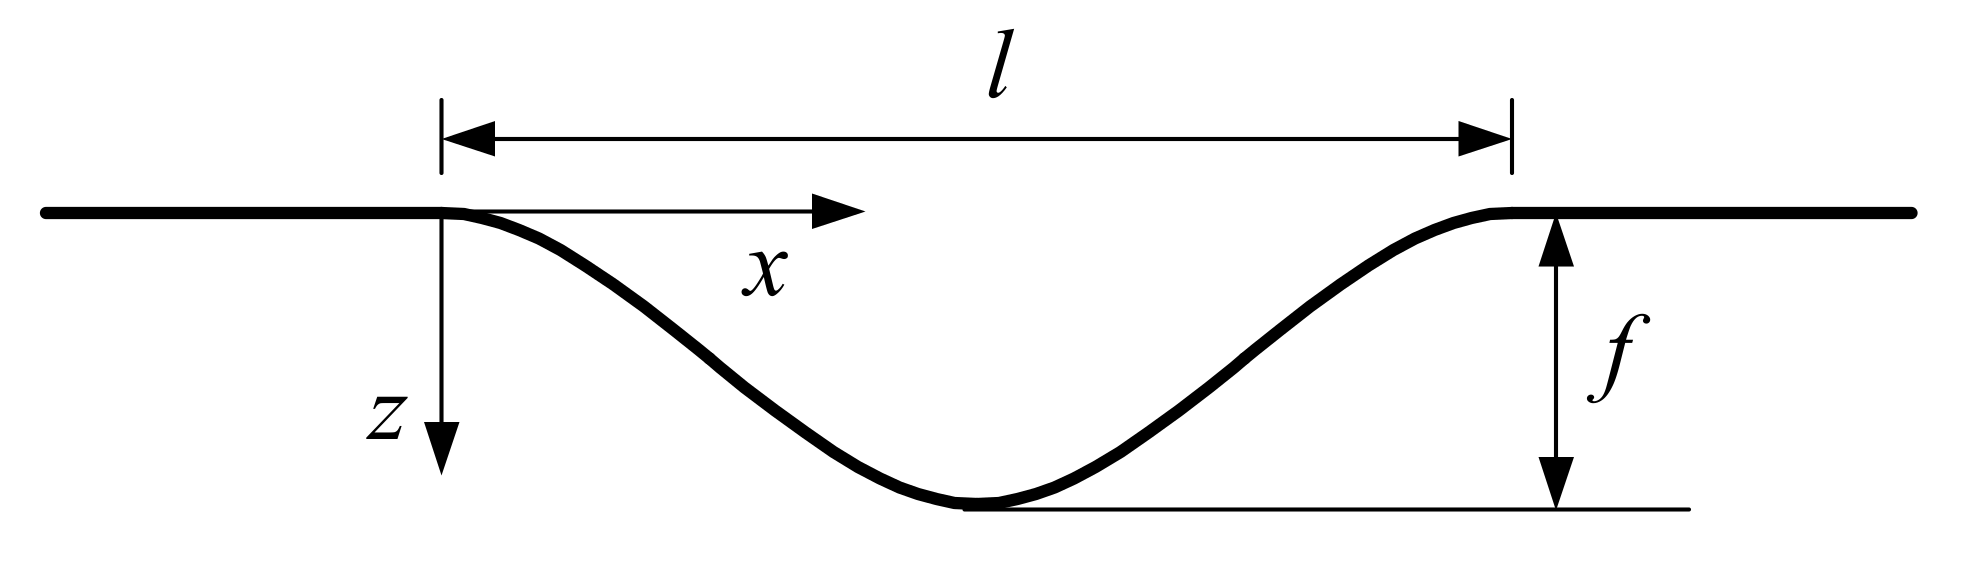
3.2. Description of Subgrade Settlement

By fitting observation data from high-speed railway subgrade settlement, it was determined that the shape of the subgrade in a settlement section is similar to a cosine curve [30]. Therefore, a cosine curve was adopted to describe the differential settlement of the bottom of the surface layer of the subgrade in this study, as shown in Figure 5.
In the settlement section, the expression for subgrade settlement along the longitudinal direction of the railway line can be written as
z = f 1 2 1 2 cos 2 π x l ,
where z refers to the value of the settlement, f refers to the settlement amplitude, x refers to the position coordinate, l refers to the settlement wavelength.

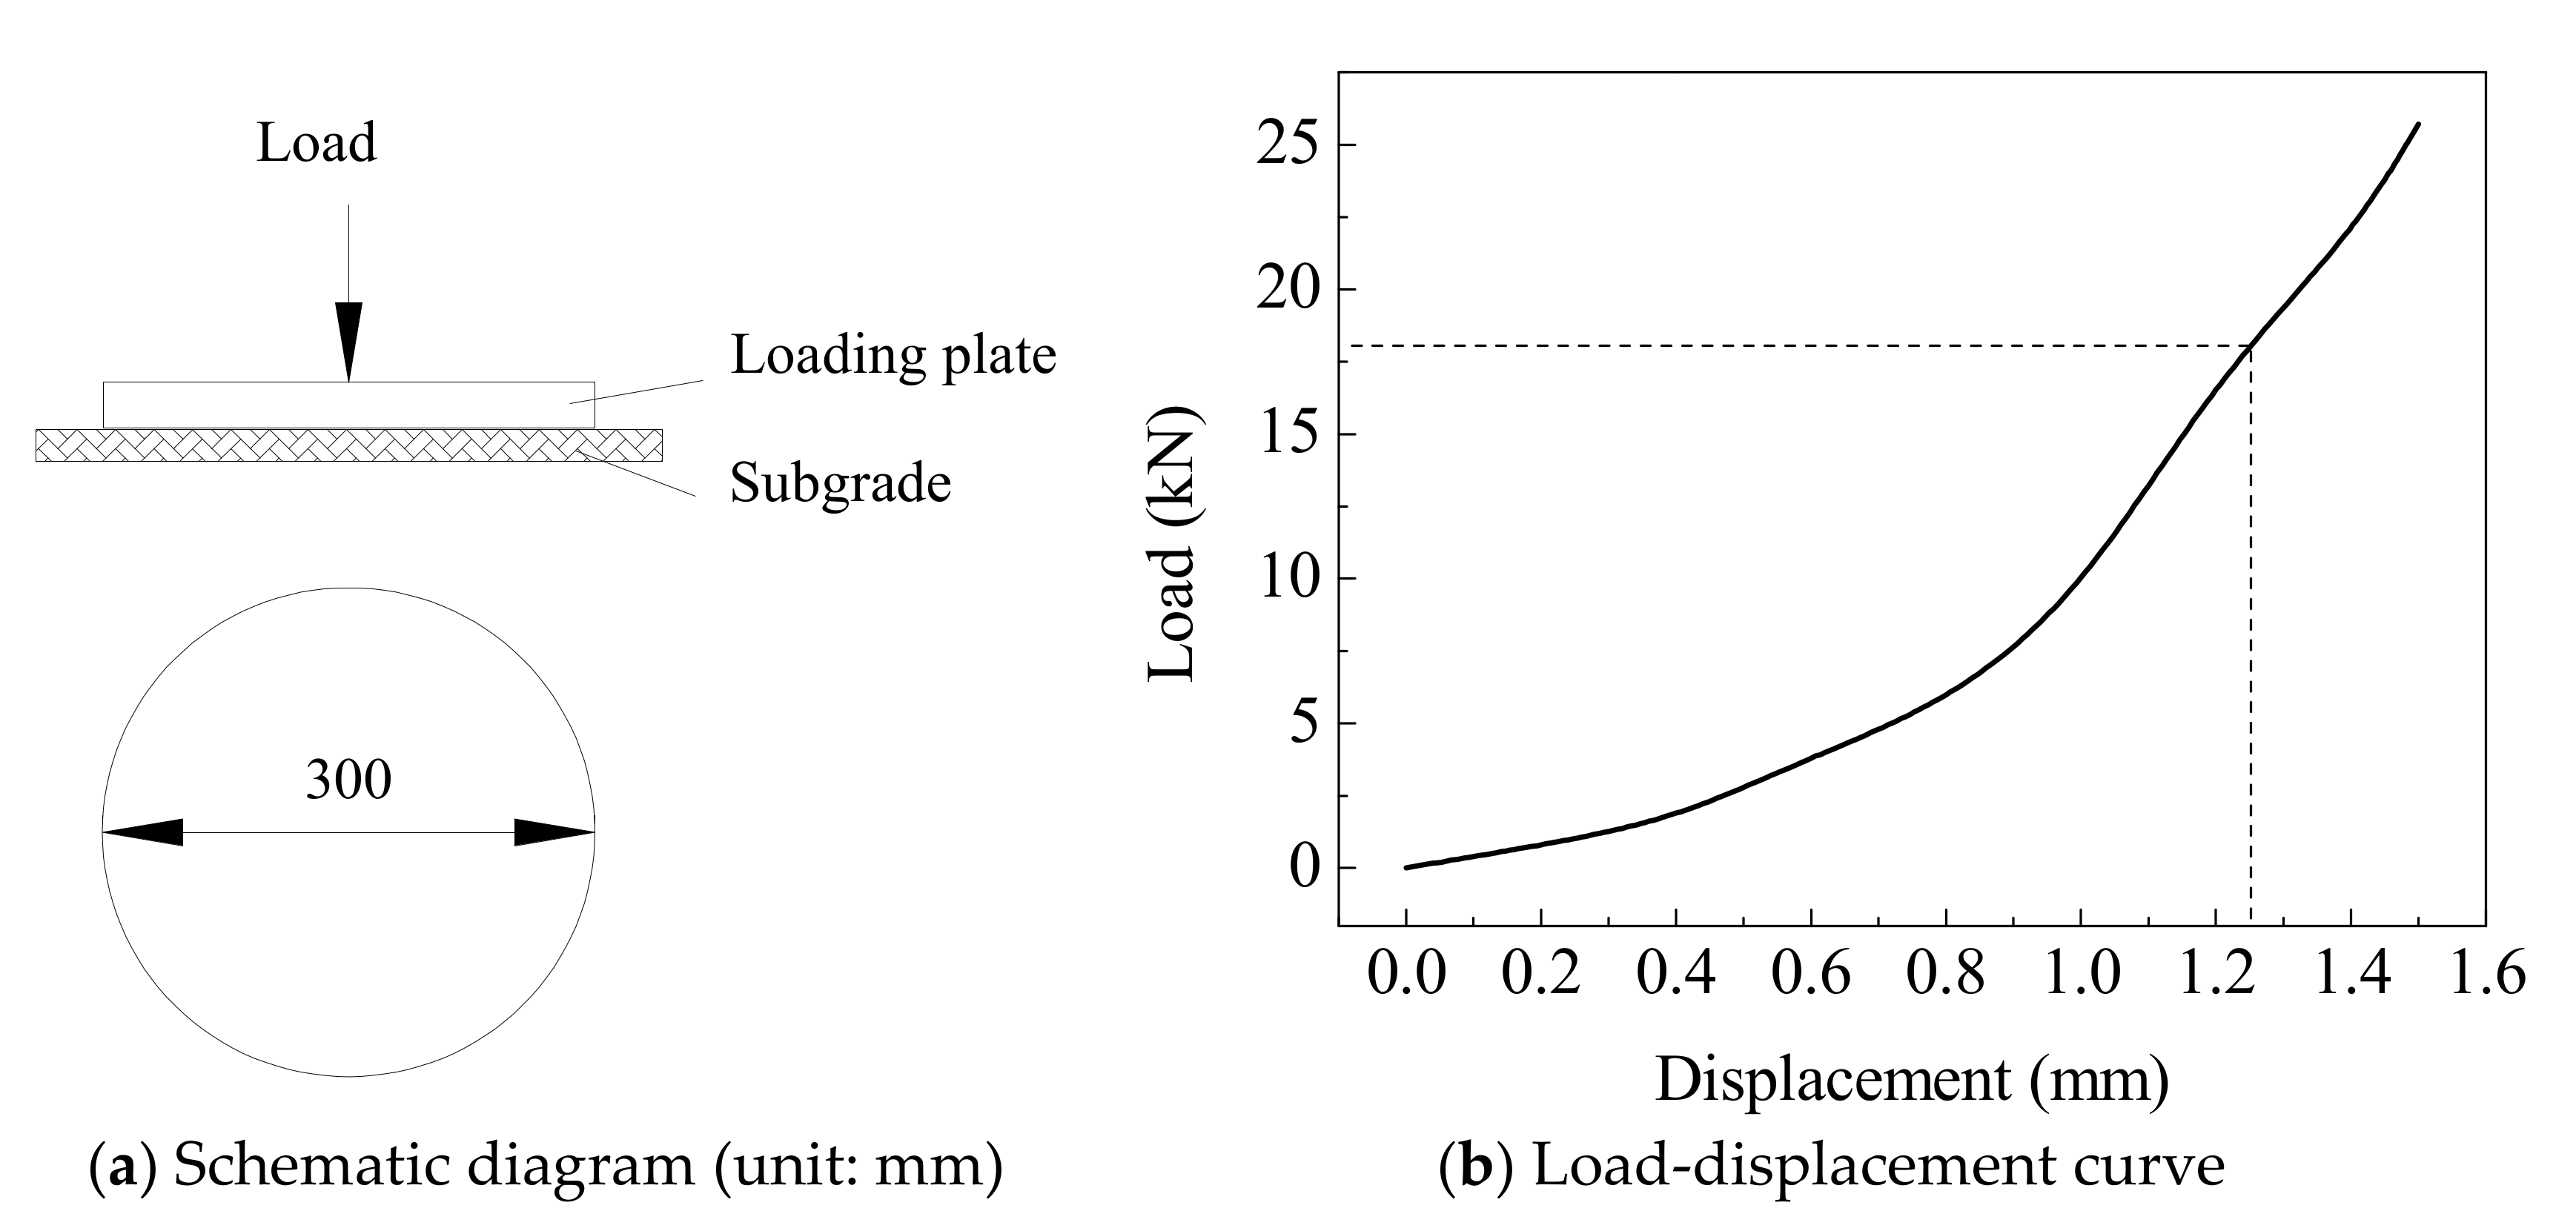
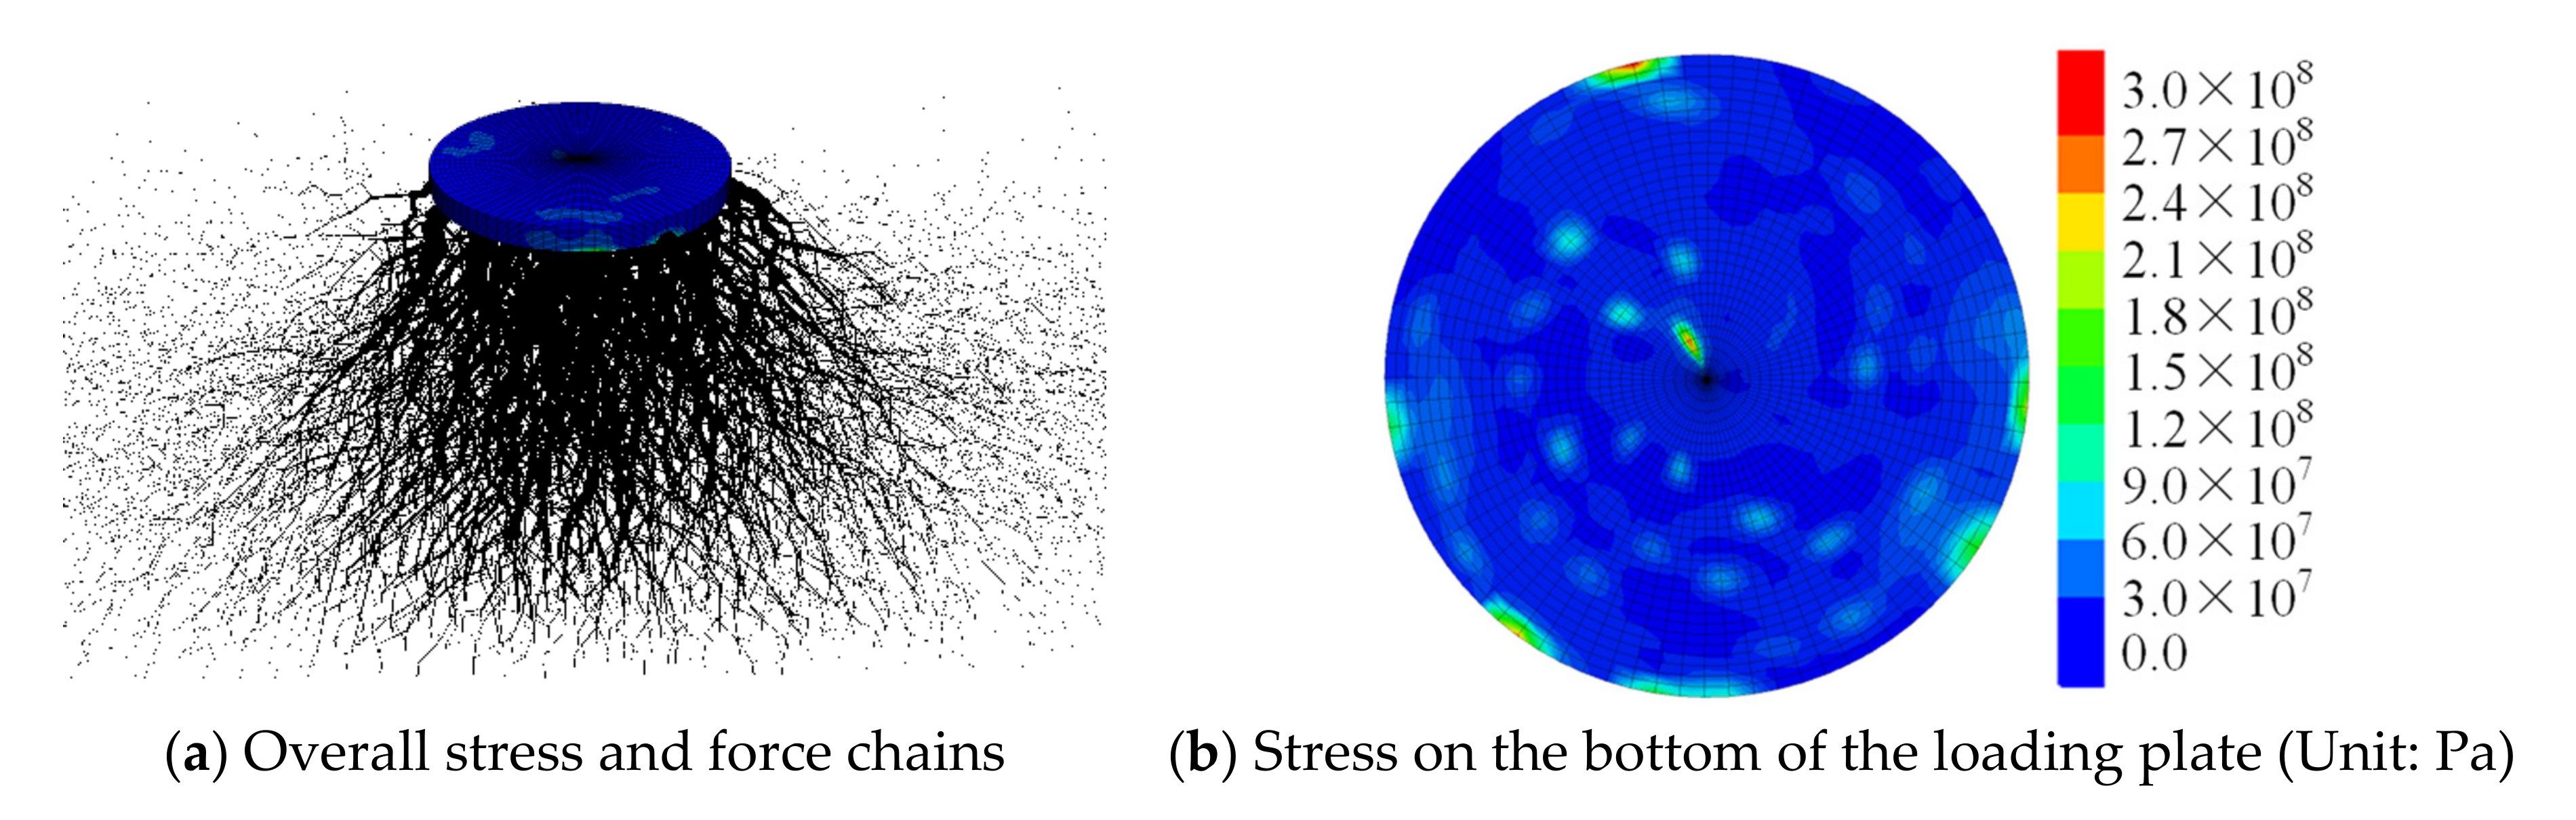
3.3. Model Verification

According to the document “Code for Soil Test of Railway Engineering TB10102-2010” [31], a foundation coefficient K 30 test was performed using the coupled model for verification. An FD model of a loading plate was established above the subgrade. According to the requirements in the aforementioned document, a preload of 0.4 MPa was first applied to the loading plate and then unloaded after the subgrade stabilized. Reloading was then performed. The load and displacement of the loading plate were recorded. The schematic diagram of the K 30 test and the resulting load-displacement curve are presented in Figure 6.
The load P s at the reference settlement value S s (1.25 mm) was obtained from the load-displacement curve in Figure 6b. The foundation coefficient K 30 can be calculated as follows:
K 30 = P s π r 2 S s ,
where r represents the radius of the loading plate (0.15 m).
The calculation results indicated that the foundation coefficient K 30 of the coupled model was 200.26 MPa/m, which meets the requirements of the document “Code for Design of High Speed Railway TB 10621-2014,” [32], which requires that the foundation coefficient K 30 of the surface layer of the subgrade should be no less than 190 MPa/m. This indicates the practicality of the coupled model in this paper.
When the displacement of the loading plate is 1.25 mm, the resulting stress on the loading plate and force chains in the surface layer of the subgrade are presented in Figure 7. In Figure 7, the force chains represent contact between gravel grains. The radius of a force chain corresponds to the value of the associated contact force.
As shown in Figure 7a, under the action of the loading plate, the strongest force chains in the surface layer of the subgrade are mainly distributed under the loading plate and have the shape of a rough truncated cone. The value of the force chain in contact with the loading plate is the largest and continues to attenuate as the chain spreads downward. It can be seen from Figure 7b that the coupled interface can transfer the supporting force of the subgrade onto the loading plate and change the stress state of the loading plate. It can be inferred that the node velocity, displacement, and load information can be stably transferred between the continuous domain and discrete domain through the coupled interface.

4. Results and Discussion

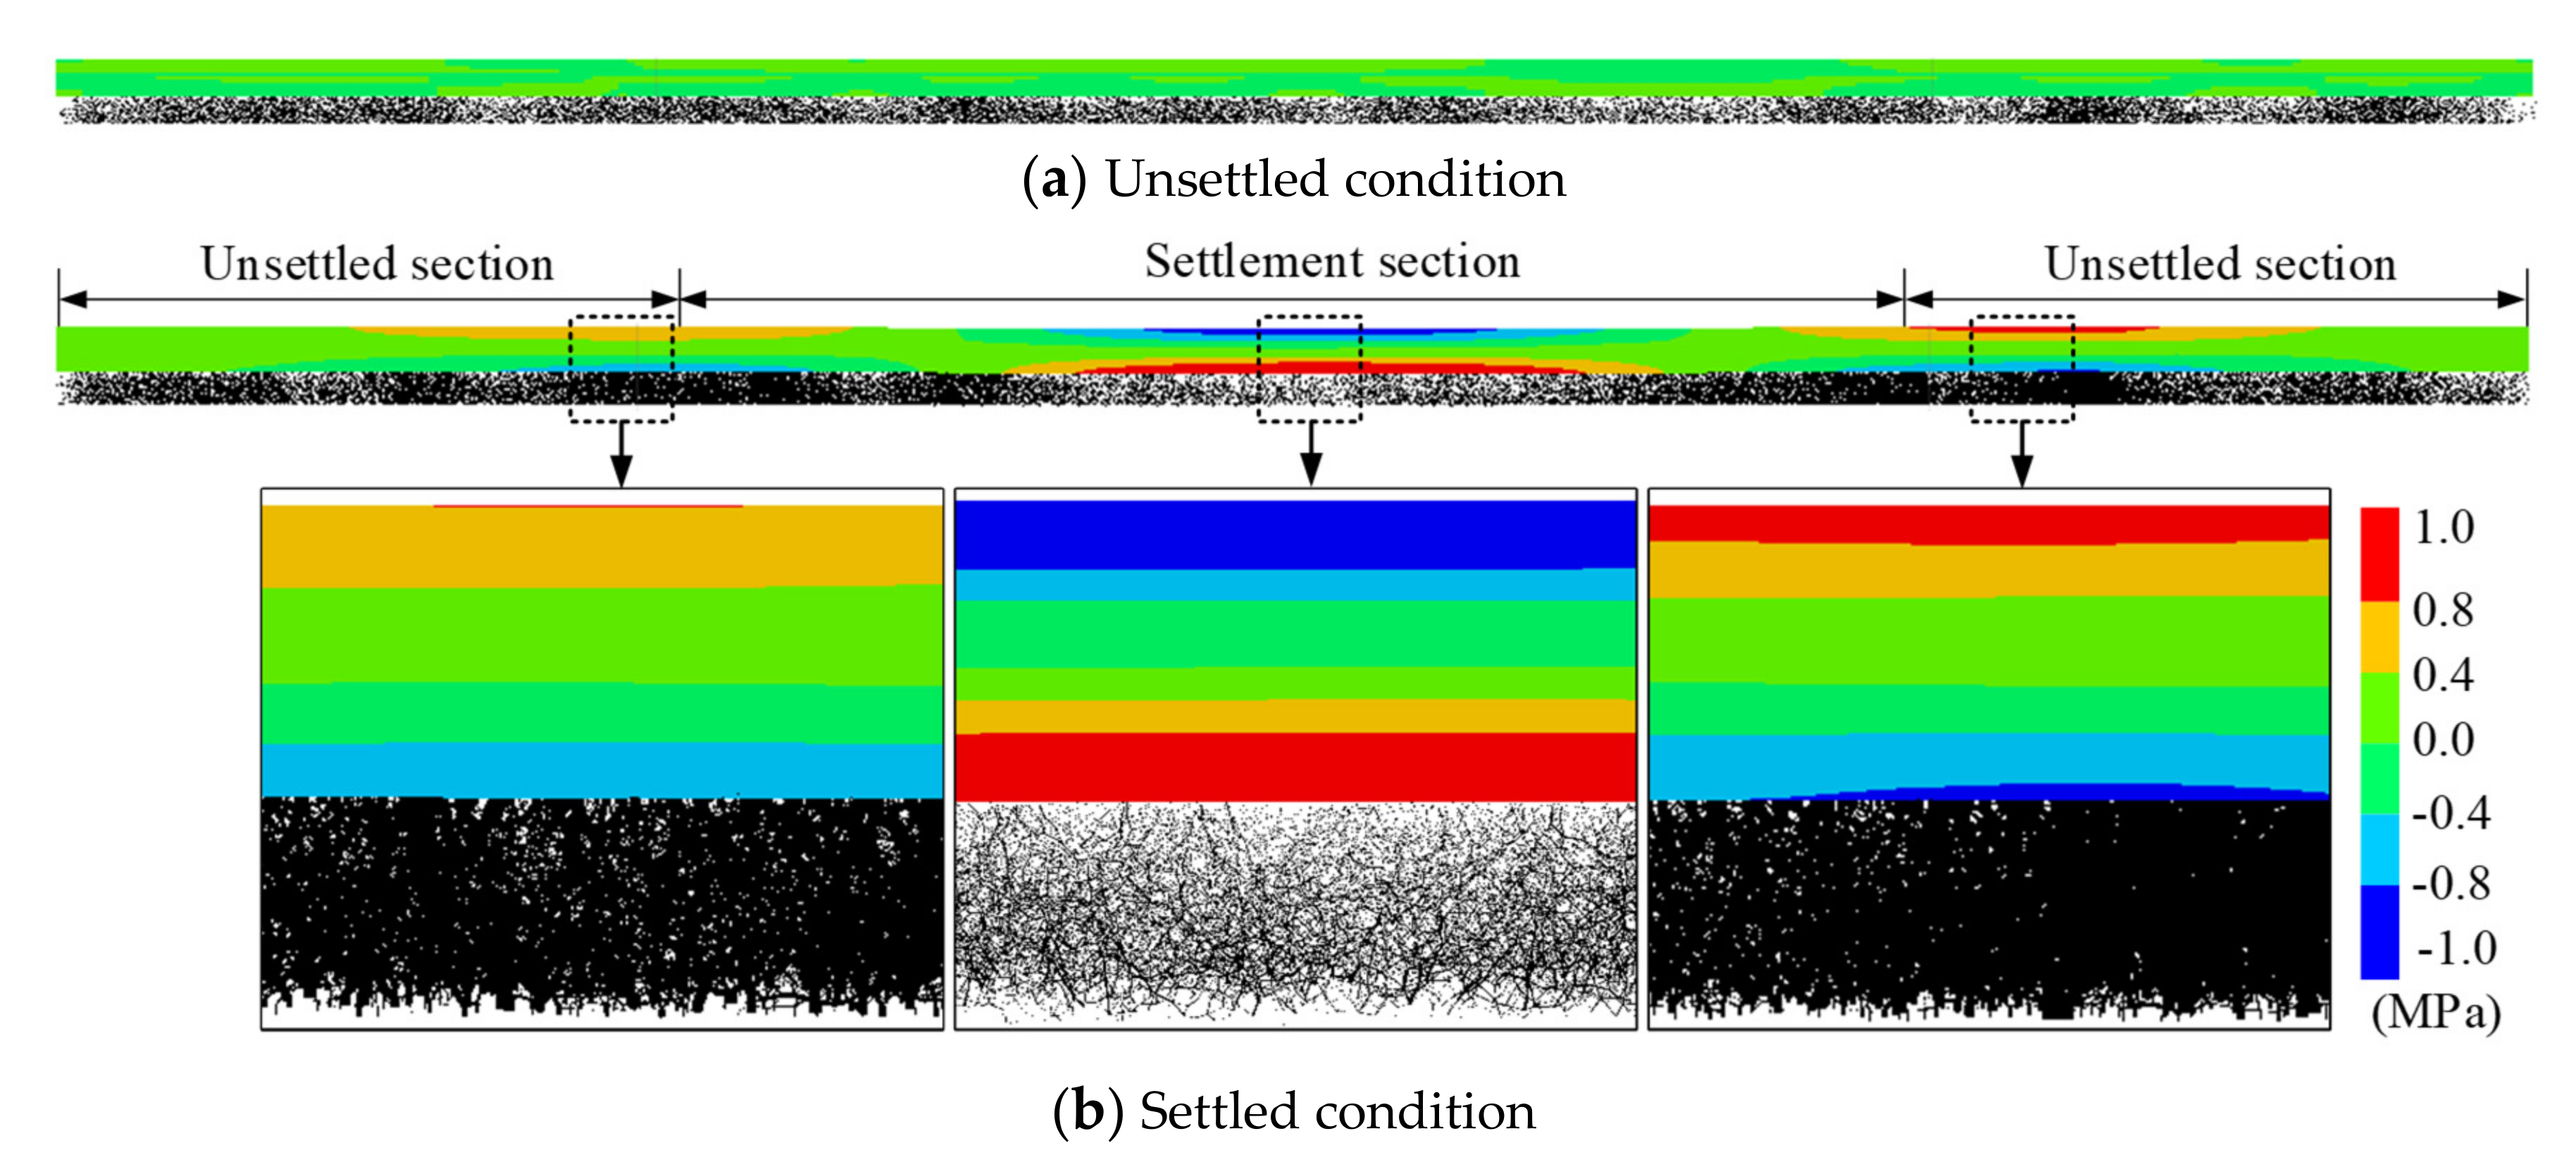
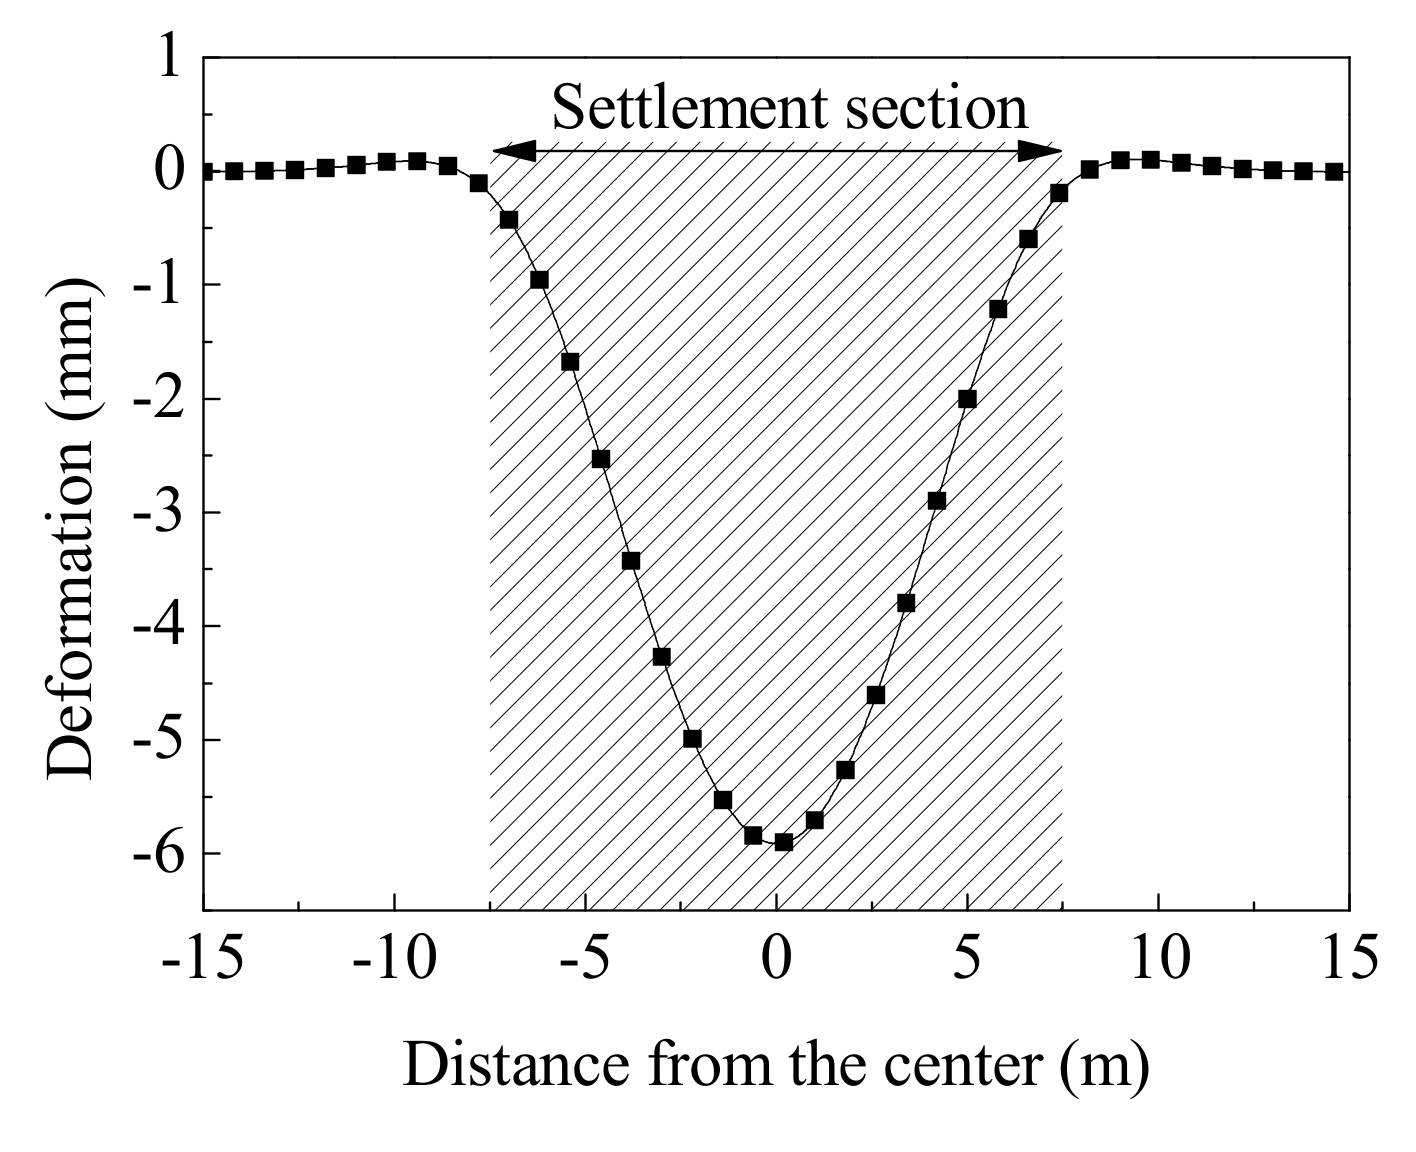
4.1. Effects of Subgrade Settlement

Figure 8 shows the longitudinal stress on the slab track and force chains in the surface layer of the subgrade under the settlement condition of 10 mm/15 m (settlement amplitude/settlement wavelength). The calculation results of the unsettled condition are also presented to highlight the effects of differential subgrade settlement.
As shown in Figure 8a, the longitudinal stress on the slab track and the values of the force chains in the subgrade are both small when there is no settlement in the subgrade. In this case, the distribution of force chains is relatively uniform and the limited differences between the distributions of force chains are caused by the bulk properties of the gravel in the subgrade.
It can be seen from Figure 8b that the upper side of the track structure is subjected to compressive stress and the lower side of the track structure is subjected to tensile stress in the settlement section. Near the boundaries of the settlement section, there is a small area in which the upper side of the track structure is in a tension state and the lower side is in a compression state. This is because the slab track exhibits upward arching near both boundaries of the settlement section. The contact forces between the gravel grains in the settlement section are smaller than those when there is no settlement in the subgrade. In the center of the settlement section, there is no contact between the gravel grains and the bottom surface of the concrete base. In other words, a gap appears between the concrete base and the subgrade, meaning the track structure is in a suspended state near the center of the settlement section. However, the force chains in the surface layer of the subgrade near the boundaries of the settlement section are densely distributed and the values of the contact forces are relatively large. This indicates that the gravel contact forces at the center of the settlement section are reduced, but the contact forces between the gravel grains near the boundaries of the settlement range are increased.
The average and maximum contact forces between the gravel grains under different conditions are computed. The average and maximum contact forces between the gravel grains in the unsettled condition are 2.83 × 10² and 2.62 × 10³ N, respectively. Under the settlement condition of 10 mm/15 m, the average and maximum contact forces are 2.87 × 10² and 7.58 × 10³ N, respectively. Compared with the unsettled condition, the average and maximum contact forces between the gravel grains under the settlement condition of 10 mm/15 m increased by 1.41% and 189.31%, respectively. This indicates that the average contact force between the gravel grains in the surface layer of the subgrade increases slightly, but the maximum value of the contact force increases significantly under subgrade settlement condition. The large contact force of the gravel grains near the boundaries of the settlement section easily accelerates the plastic settlement of the subgrade, causing expansion of the settlement section.
Figure 9 shows the deformation of the slab track under the settlement condition of 10 mm/15 m.
As shown in Figure 9, the slab track exhibits deformation under the forces of gravity in the subgrade settlement section. The deformation curve of the slab track is close to a cosine shape, but it does not completely coincide with the subgrade settlement curve. The deformation wavelength of the slab track is greater than the settlement wavelength of the subgrade, but the deformation amplitude of the slab track is less than the settlement amplitude of the subgrade. Furthermore, there are significant upward arches in the slab track structure near the boundaries of the settlement section. It should be noted that the train load is not considered in the analysis in this paper. Only the self-weight of the structure is considered.

4.2. Effects of Settlement Wavelength

Variation in settlement wavelength has different effects on the deformation of the slab track. Figure 10 shows the deformation curve and deformation amplitude of the slab track when the settlement wavelength increases from 5 to 25 m and the settlement amplitude remains unchanged at 10 mm.
It can be seen from Figure 10a that the deformation wavelength of the slab track gradually increases with an increase in the settlement wavelength of the subgrade. As shown in Figure 10b, the growth trend of the deformation amplitude of the slab track first accelerates and then decelerates with an increase in the settlement wavelength of the subgrade. The growth rate of the deformation amplitude of the slab track is the fastest when the settlement wavelength of the subgrade increases from 10 to 15 m. When the settlement wavelength reaches 25 m, the deformation amplitude of the slab track is 8.87 mm, which is closer to the settlement amplitude of the subgrade.
Figure 11 shows the gravel contact forces in the subgrade for different settlement wavelengths, as well as the growth rate of the contact forces compared to the unsettled condition.
As shown in Figure 11a, the average and maximum contact forces of the gravel grains increase when the settlement wavelength increases from 0 to 20 m. However, when the settlement wavelength is greater than 20 m, the average and maximum contact forces decrease with increasing settlement wavelength. This is because the slab track is still in a suspended state when the settlement wavelength is less than 20 m and a longer section of the track is suspended with an increase in the settlement wavelength. A longer section of suspended track causes the gravel grains near the boundaries of the settlement section to bear an additional load. When the settlement wavelength is greater than 20 m, the subgrade and slab track are in contact again due to the deformation of the slab track. Therefore, the contact forces of the gravel grains near the boundaries of the settlement section are reduced.
Figure 11b indicates that an increase in the settlement wavelength has little effect on the average contact force. However, the maximum contact force of the gravel grains changes significantly with an increase in settlement wavelength. The maximum contact force can reach approximately 2.5 times that in the unsettled condition.

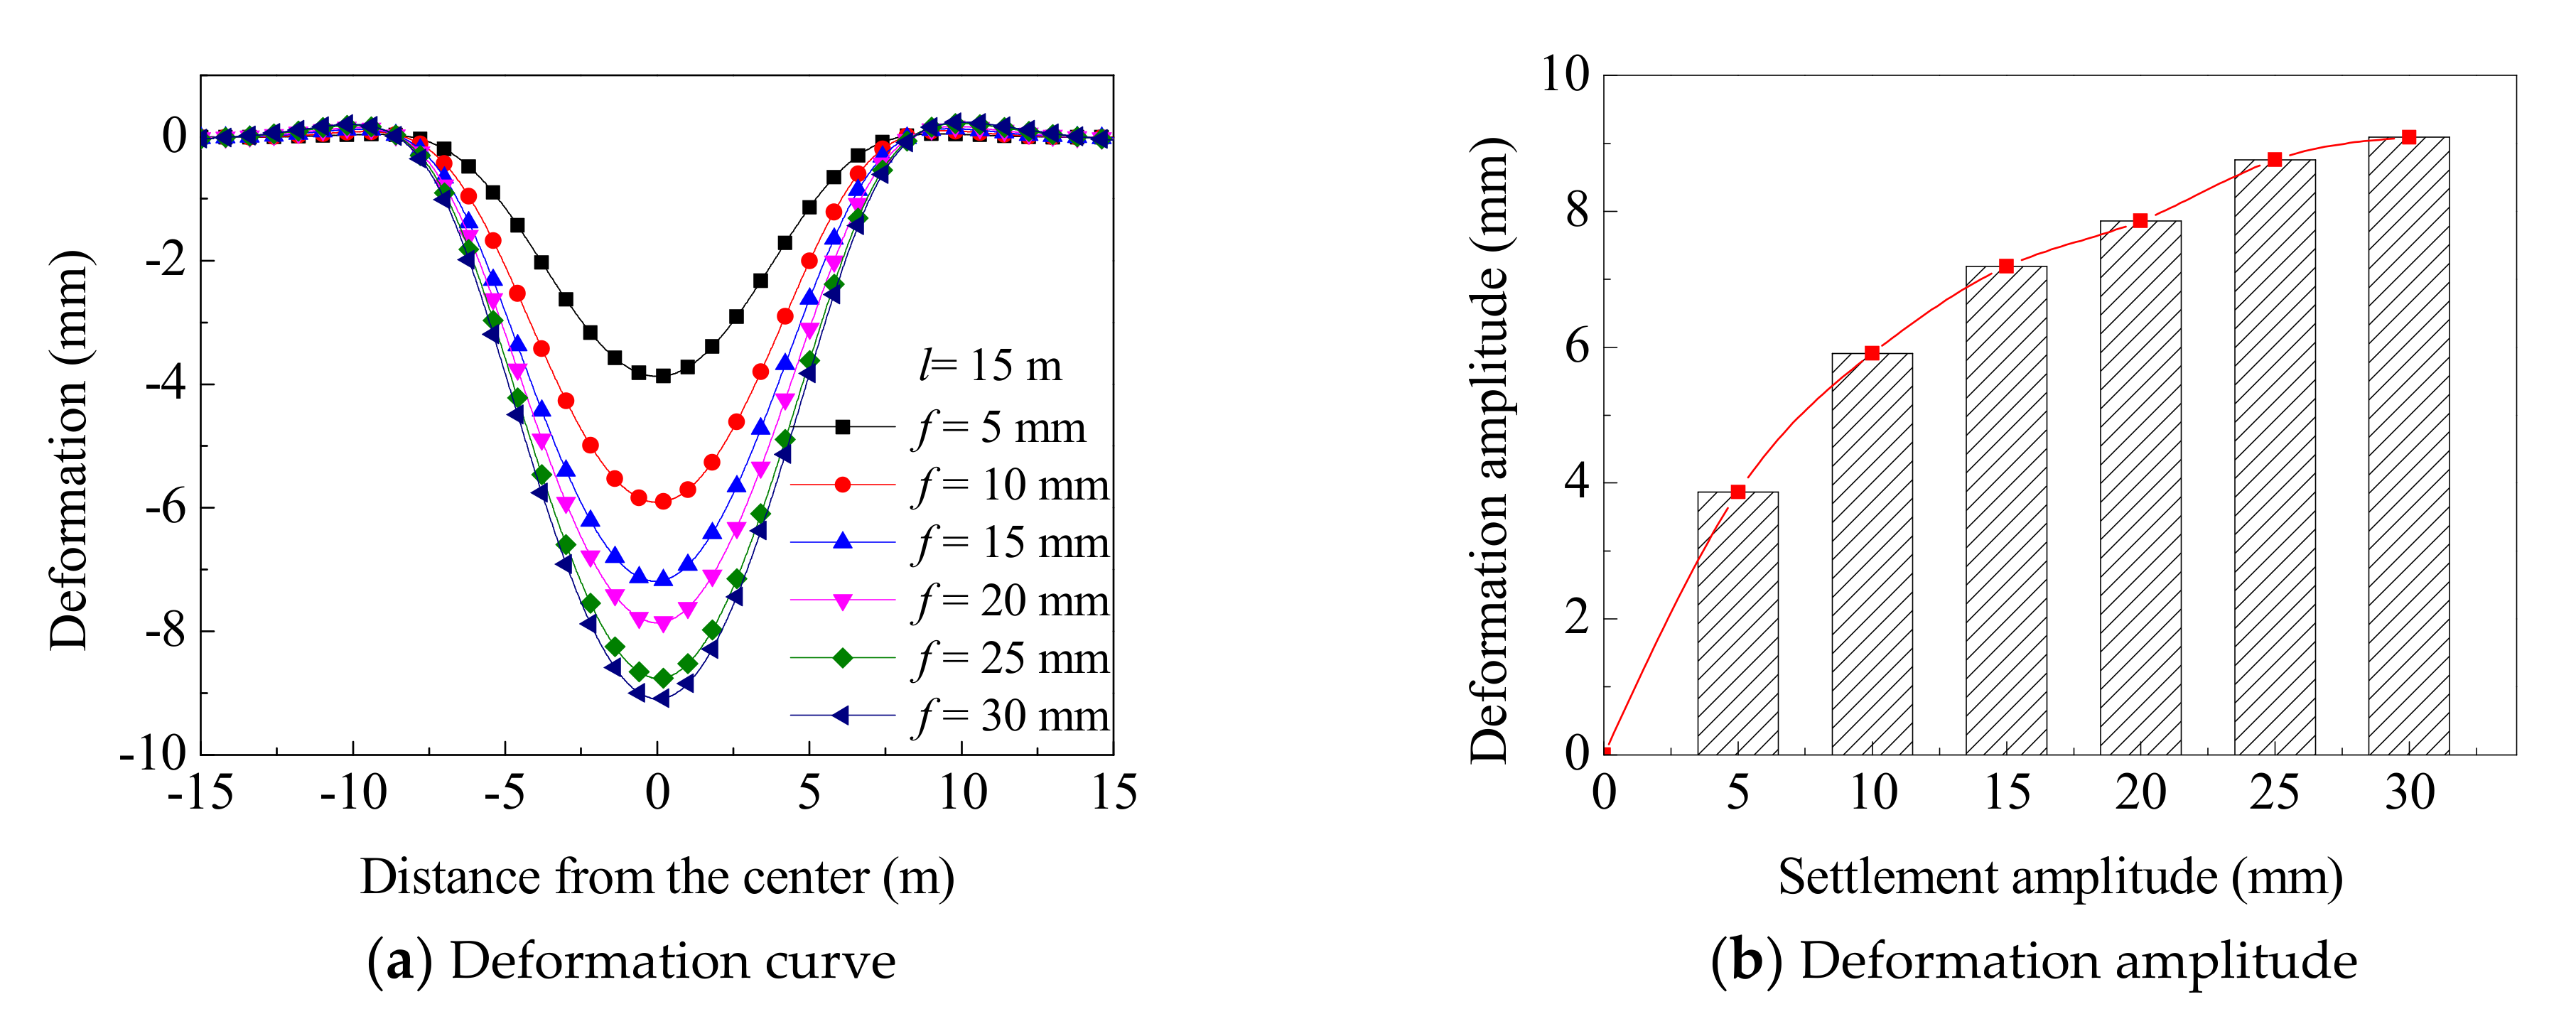
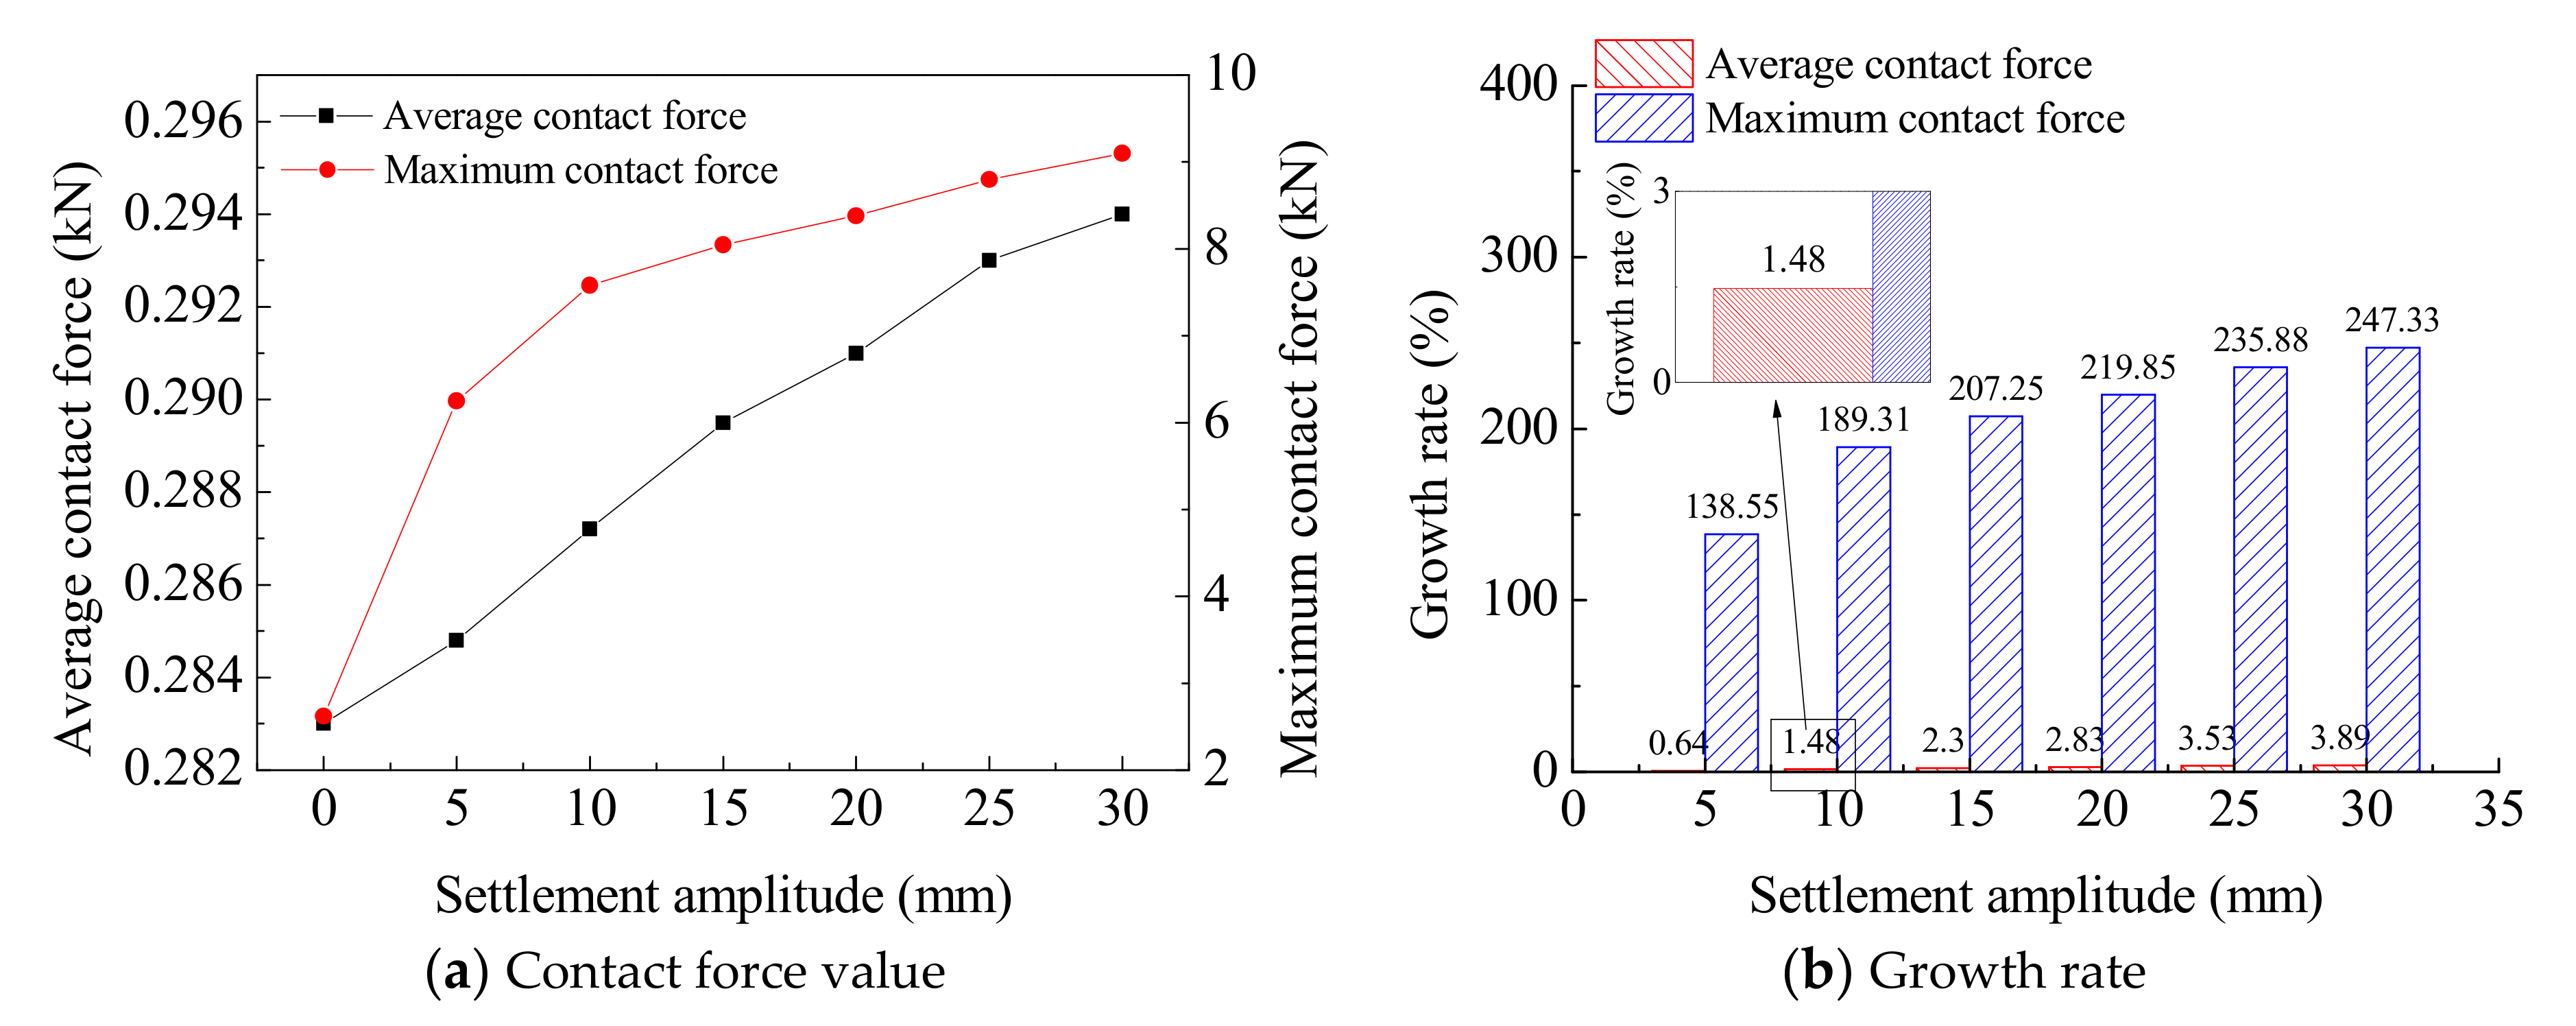
4.3. Effects of Settlement Amplitude

Figure 12 shows the deformation curve and deformation amplitude of the track when the settlement amplitude increases from 5 to 30 mm and the settlement wavelength remains unchanged at 15 m.
Figure 12a indicates that the deformation amplitude of the slab track gradually increases with an increase in the settlement amplitude of the subgrade. However, the change in the deformation wavelength of the slab track is not obvious. As shown in Figure 12b, the deformation amplitude of the slab track increases nonlinearly with an increase in the settlement amplitude of the subgrade. The growth rate of the deformation amplitude of the slab track decreases when the settlement amplitude of the subgrade is greater than 10 mm. In this case, there is a gap between the concrete base and subgrade. The track structure is in a suspended state.
Figure 13 shows the gravel contact forces in the surface layer of the subgrade under different settlement amplitudes, as well as the growth rate of the contact forces compared to the unsettled condition.
Figure 13 indicates that the average contact force of the gravel grains in the subgrade increases linearly with an increase in the settlement amplitude. However, the growth rate of the average contact force is small (less than 4%) compared to the unsettled condition. The maximum contact force increases nonlinearly with an increase in the settlement amplitude. The growth rate of the maximum contact force decreases and the track is in a suspended state when the settlement amplitude of the subgrade is greater than 10 mm. When the settlement amplitude is 5 mm, the maximum contact force is 138.55% greater than that in the unsettled condition. It can be inferred that the maximum contact force of the gravel grains in the subgrade increases significantly even when the settlement amplitude of the subgrade is small.

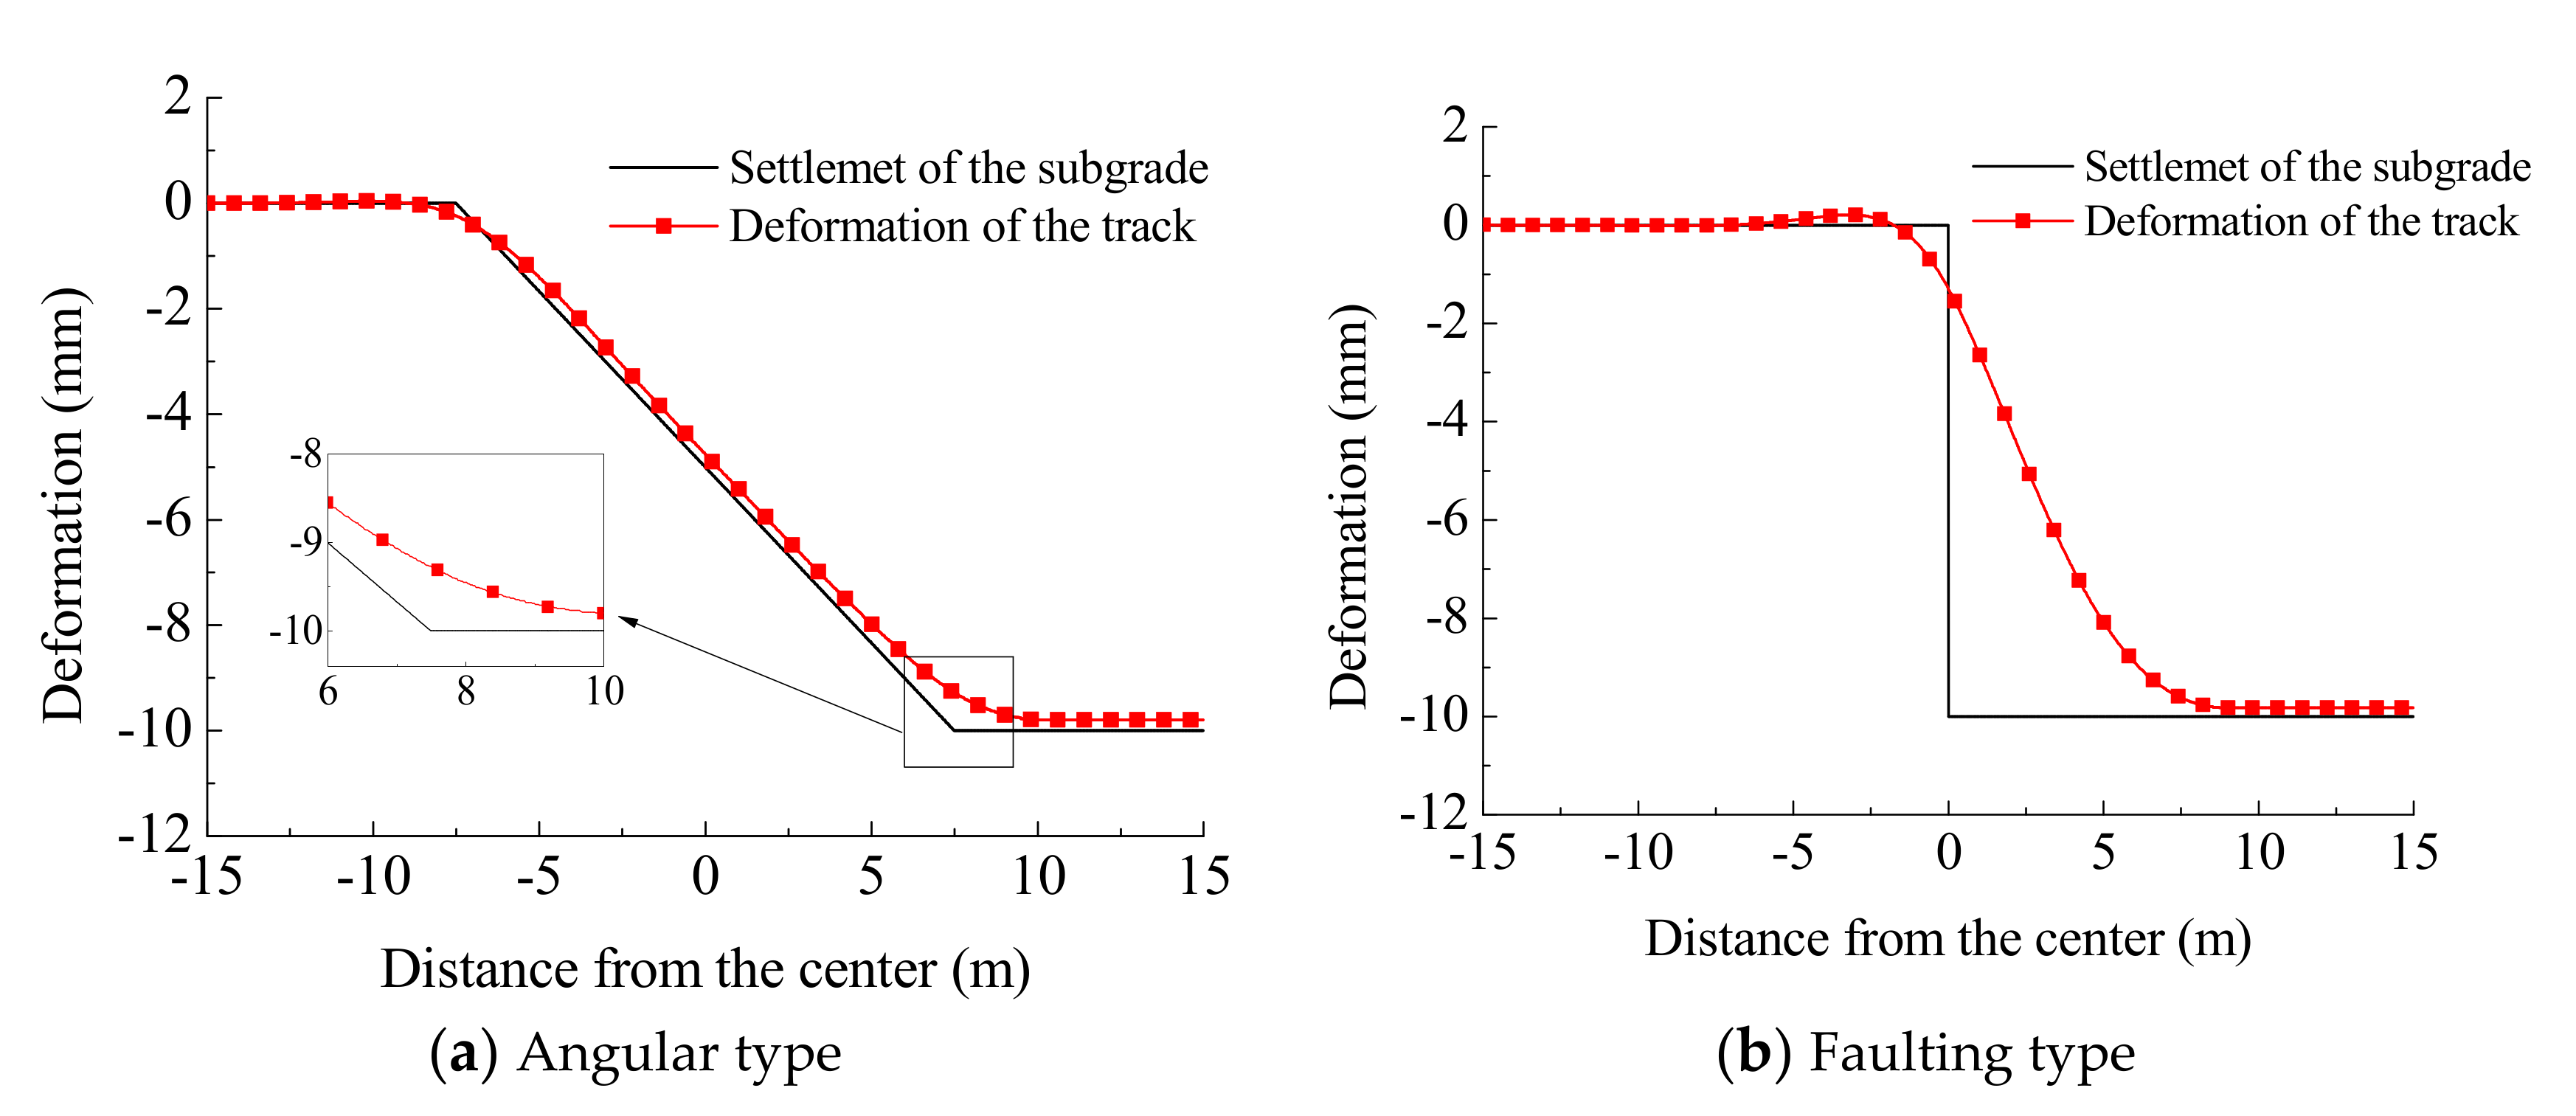
4.4. Effects of Other Types of Settlement

Different types of subgrade settlement have different effects on the deformation of the slab track and the contact force of the gravels in the subgrade. Site investigation shows that the angular type and faulting type subgrade settlement often occur at the transition zones. Therefore, the situations under differential subgrade settlement with angular type and faulting type are also studied in this paper. It is assumed that the longitudinal length of the angular type settlement is 15 m, and the settlement amplitude is 10 mm. The amplitude of the faulting type settlement is taken as 10 mm. The deformation curves of the track structure are shown in Figure 14.
It can be seen from Figure 14a that the deformation curve of the slab track is in good agreement with the shape of the subgrade settlement with angular type. The deformation curve of the slab track is smoother compared to the settlement curve of the subgrade. As shown in Figure 14b, the slab track undergoes severe settlement in the faulting type settlement section. There is a significant difference between the track deformation and the subgrade settlement. In this case, there is a clear gap between the concrete base and subgrade.
The calculation results indicate that the average contact force of the gravel grains in the subgrade under angular type settlement is 2.93 × 10² N. The maximum contact force is 1.01× 10⁴ N. The average and maximum contact forces of the gravel grains in the subgrade under faulting type settlement are 2.91 × 10² and 1.30× 10⁴ N, respectively. The growth rates of the gravel contact forces under angular and faulting types settlement compared to the unsettled condition are shown in Figure 15. It can be seen that the maximum contact forces of the gravel grains are significantly increased by the angular and faulting types settlements, especially the faulting type settlement.

5. Conclusions

An FD model of a CRTS II slab track and a DE model of a subgrade were established. DEM-FDM coupled simulations were realized by adopting interface elements for data interaction. The effects of differential subgrade settlement on the deformation of the slab track and contact forces of gravel grains in the subgrade were studied. The following conclusions can be drawn.
(1)
The slab track has a smaller deformation amplitude and larger deformation wavelength compared to the subgrade. The contact force of the gravel grains near the boundaries of the settlement section is relatively large, which easily causes the plastic settlement of the subgrade and expansion of the settlement section.
(2)
The deformation wavelength of the slab track increases with an increase in the settlement wavelength of the subgrade. The slab track structure is in a suspended state when the settlement wavelength is short. When the settlement wavelength is 20 m and settlement amplitude is 10 mm, the maximum contact force can reach approximately 2.5 times that in the unsettled condition.
(3)
The deformation amplitude of the slab track increases nonlinearly with an increase in the settlement amplitude of the subgrade. The maximum contact force of the gravel grains increases significantly, even if the settlement amplitude of the subgrade is small.
(4)
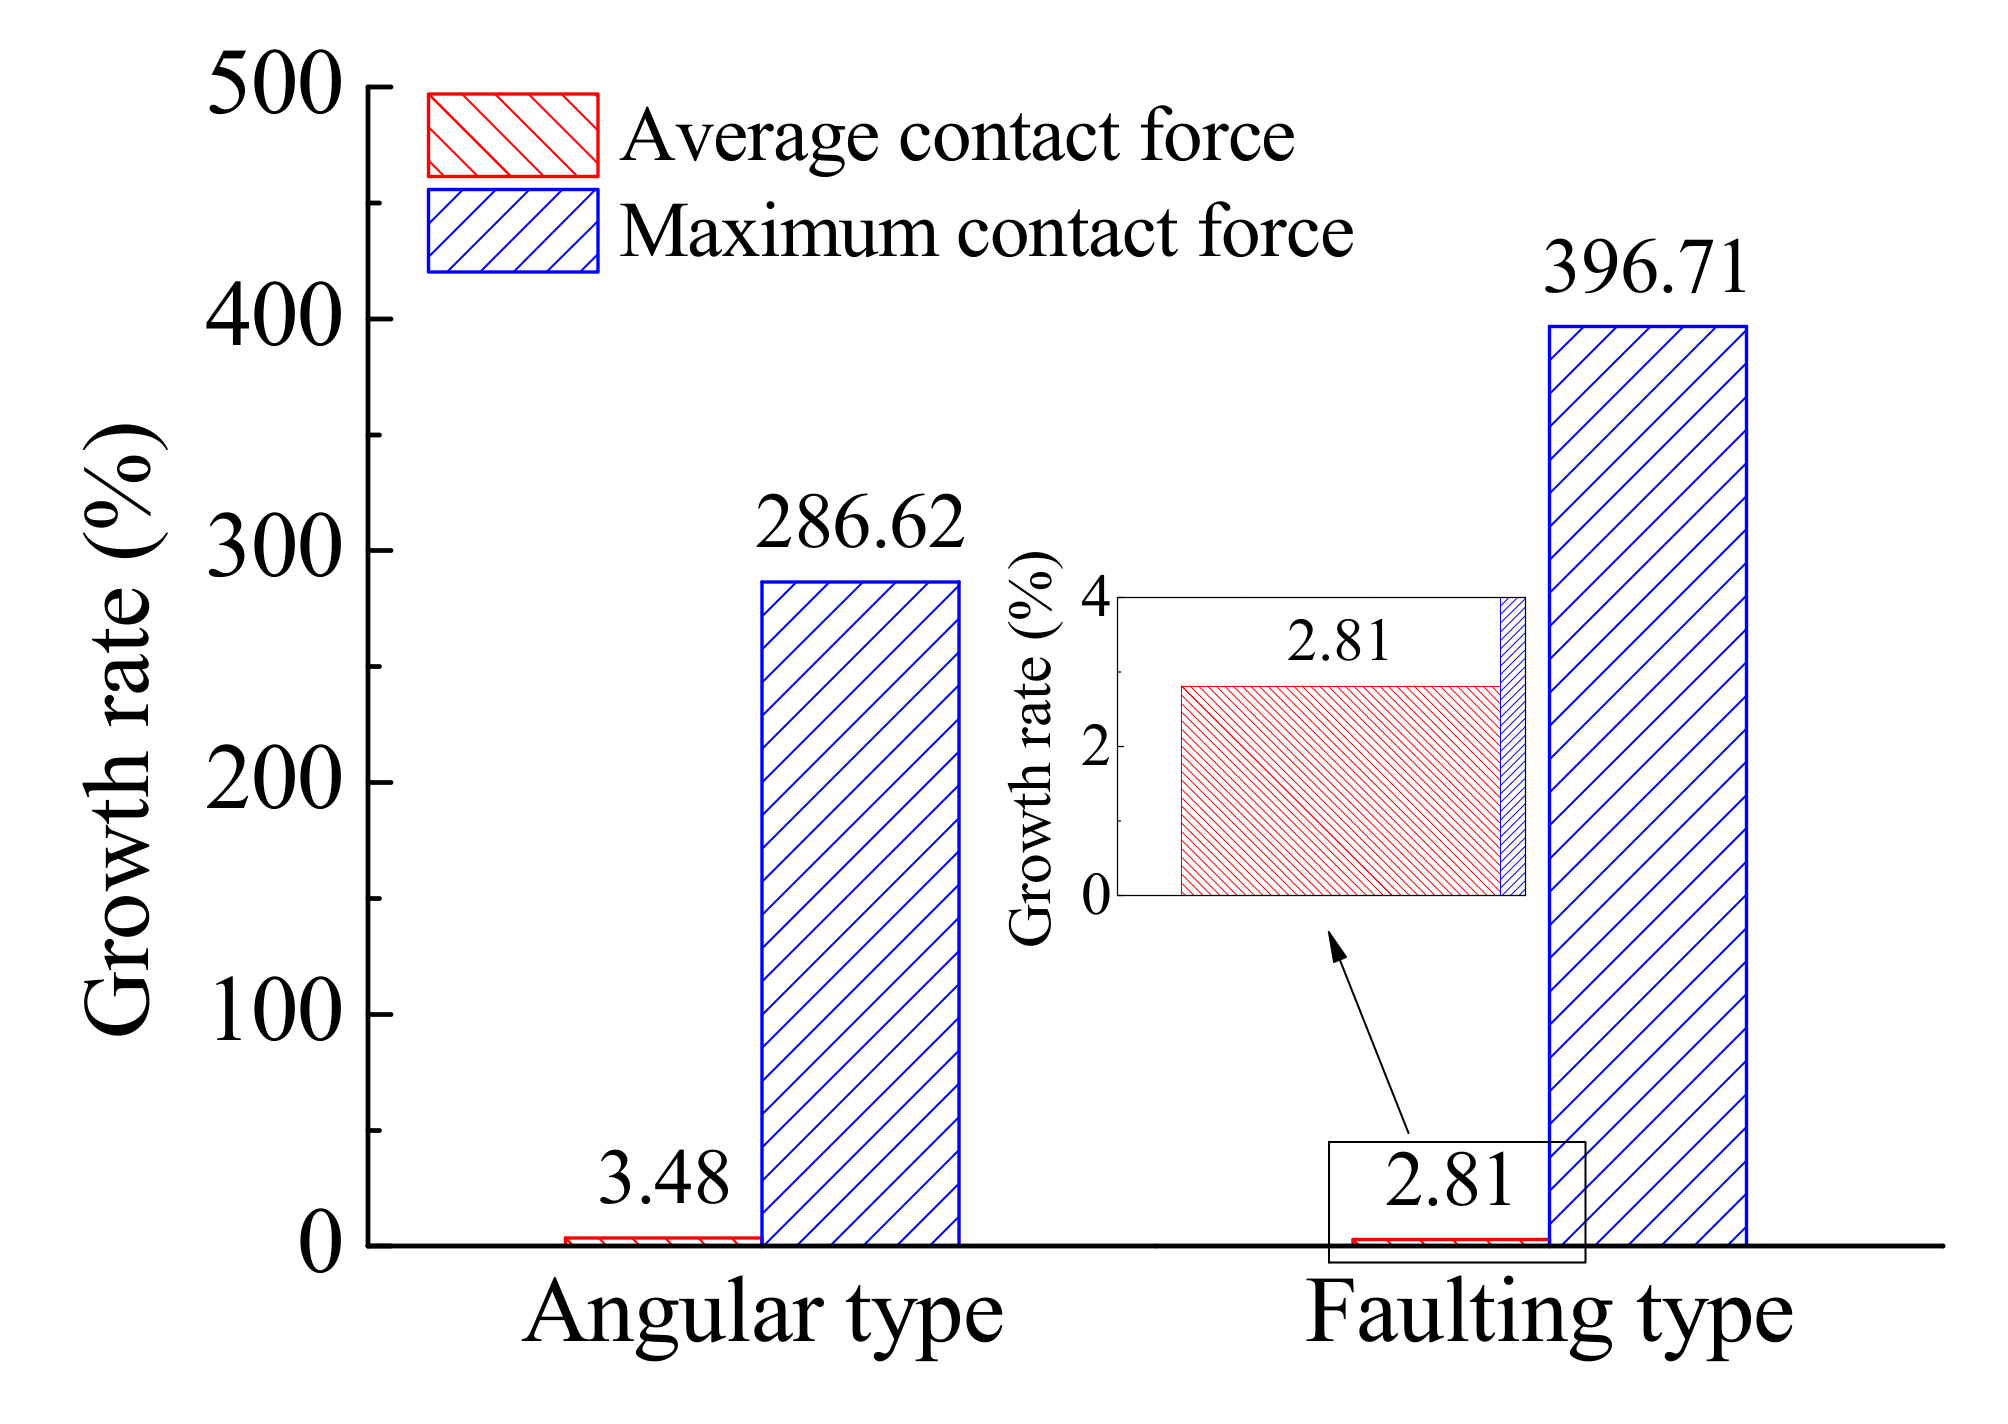
The angular and faulting types of settlements cause severe deformation of the track structure. There is a clear gap between the concrete base and subgrade under a faulting type settlement, which is harmful to the service state of the railway line. Therefore, the faulting type settlement should be strictly controlled during maintenance.
However, the DEM-FDM coupled model in this paper still needs validation by more tests for practical applications. In the future, the effect of the contact force of the gravel grains on the service life and maintenance of the subgrade will be further studied. The effect of external weather on the deformation of the track will also be investigated.

Author Contributions

Funding acquisition, B.D.; investigation, X.C.; methodology, R.Z. and B.D.; validation, G.G. and H.L.; visualization, R.Z.; writing—original draft, X.C. All authors have read and agreed to the published version of the manuscript.

Funding

This research was funded by the Research and Development Program of China Railway Corporation under Grant P2018G005-2, Research Project of Beijing-Shanghai High Speed Railway Co., Ltd. under Grant 2020-15, and Shenzhen Science and Technology Innovation Commission under Grant 827-000468.

Conflicts of Interest

The authors declare no conflict of interest.

References

  1. Luo, J.; Zhu, S.; Zhai, W. An efficient model for vehicle-slab track coupled dynamic analysis considering multiple slab cracks. Constr. Build. Mater. 2019, 215, 557–568. [Google Scholar] [CrossRef]
  2. Hu, N.; Dai, G.L.; Yan, B. Recent development of design and construction of medium and long span high-speed railway bridges in China. Eng. Struct. 2014, 74, 233–241. [Google Scholar] [CrossRef]
  3. Jiang, L.; Zhang, Y.; Feng, Y.; Zhou, W.; Tan, Z. Dynamic response analysis of a simply supported double-beam system under successive moving loads. Appl. Sci. 2019, 9, 2162. [Google Scholar] [CrossRef] [Green Version]
  4. Gou, H.; Shi, X.; Zhou, W.; Cui, K.; Pu, Q. Dynamic performance of continuous railway bridges: Numerical analyses and field tests. Proc. Inst. Mech. Eng. Part F J. Rail Rapid Transit. 2018, 232, 936–955. [Google Scholar] [CrossRef]
  5. Kang, G. Influence and control strategy for local settlement for high-speed railway infrastructure. Engineering 2016, 2, 374–379. [Google Scholar] [CrossRef] [Green Version]
  6. Kouroussis, G.; Connolly, D.P.; Alexandrou, G.; Vogiatzis, K. The effect of railway local irregularities on ground vibration. Transport. Res. Part D Transp. Environ. 2015, 39, 17–30. [Google Scholar] [CrossRef] [Green Version]
  7. Kouroussis, G.; Connolly, D.; Alexandrou, G.; Vogiatzis, K. Railway ground vibrations induced by wheel and rail singular defects. Veh. Syst. Dyn. 2015, 53, 1500–1519. [Google Scholar] [CrossRef]
  8. Gou, H.; Zhou, W.; Bao, Y.; Li, X.; Pu, Q. Experimental study on dynamic effects of a long-span railway continuous beam bridge. Appl. Sci. 2018, 8, 669. [Google Scholar] [CrossRef] [Green Version]
  9. Wang, S.-J.; Xu, Z.-D.; Li, S.; Dyke, S.J. Safety and stability of light-rail train running on multispan bridges with deformation. J. Bridge Eng. 2016, 21, 06016004. [Google Scholar] [CrossRef]
  10. Guo, Y.; Gao, J.M.; Sun, Y.; Zhai, W. Mapping Relationship between Rail Deflection of Slab Track and Subgrade Settlement. J. Southwest Jiaotong Univ. 2017, 52, 1139–1147+1215. [Google Scholar]
  11. Gou, H.Y.; Yang, L.C.; Leng, D.; Bao, Y.; Pu, Q.H. Effect of bridge lateral deformation on track geometry of high-speed railway. Steel. Compos. Struct. 2018, 29, 219–229. [Google Scholar]
  12. Sun, Y.; Guo, Y.; Chen, Z.; Zhai, W. Effect of differential ballast settlement on dynamic response of vehicle–track coupled systems. Int. J. Struct. Stab. Dy. 2018, 18, 1850091. [Google Scholar] [CrossRef]
  13. Feng, Y.; Jiang, L.; Zhou, W.; Lai, Z.; Chai, X. An analytical solution to the mapping relationship between bridge structures vertical deformation and rail deformation of high-speed railway. Steel Compos. Struct. 2019, 33, 209–224. [Google Scholar]
  14. Cai, X.; Liu, W.; Wang, P.; Ning, X. Effect of Land Subsidence on Regularity of Double-Block Ballastless Track. Eng. Mech. 2014, 31, 160–165. [Google Scholar]
  15. Xiao, W.; Guo, Y.; Gao, J.; Zhai, W. Effect of uneven subgrade settlement on the CRTS III slab track stress and deformation of high-speed railway. J. Railw. Sci. Eng. 2015, 12, 724–730. [Google Scholar]
  16. Chen, Z.; Sun, Y.; Zhai, W. Mapping relationship between pier settlement and rail deformation of high-speed railways-part (II): The longitudinal connected ballastless track system. Sci. Sin. Technol. 2014, 44, 778–785. [Google Scholar]
  17. Zhou, W.; Nie, L.; Jiang, L.-Z.; Feng, Y.; Tan, Z.; Chai, X. Mapping relation between pier settlement and rail deformation of unit slab track system. Structures 2020, 27, 1066–1074. [Google Scholar] [CrossRef]
  18. Xiang, J.; Lin, S.; Yu, C. Transfer rules and effect of stress and deformation of ballastless track under uneven subgrade settlement. J. Traff. Trans. Eng. 2019, 19, 69–81. [Google Scholar]
  19. He, C.; Chen, Z.; Zhai, W. Mapping relationship between uneven settlement of subgrade and rail deformation in subgrade-bridge transition section and its dynamic application. Sci. Sin. Technol. 2018, 48, 881–890. [Google Scholar] [CrossRef]
  20. Xu, Q.; Fan, H.; Li, B.; Zhou, X. Limited value for uneven settlement of subgrade under CRTS−II type slab track. J. Cent. South. Univ. (Sci. Tech.) 2013, 44, 5038–5044. [Google Scholar]
  21. Che, X.; Zhang, Z.; Li, Z.; Zhang, X. Discrete element modeling of ballasted railway track with silty-clay-subgrade under cyclic load. Fresen. Environ. Bull. 2018, 27, 380–386. [Google Scholar]
  22. Li, L.; Liu, W.; Ma, M.; Jing, G.; Liu, W. Research on the dynamic behaviour of the railway ballast assembly subject to the low loading condition based on a tridimensional DEM-FDM coupled approach. Constr. Build. Mater. 2019, 218, 135–149. [Google Scholar] [CrossRef]
  23. Zhu, H.X.; Yin, Z.Y.; Zhang, Q. A novel coupled FDM-DEM modelling method for flexible membrane boundary in laboratory tests. Int. J. Numer. Anal. Methods Geomech. 2020, 44, 389–404. [Google Scholar] [CrossRef]
  24. Guo, Y.; Zhai, W. Long-term prediction of track geometry degradation in high-speed vehicle–ballastless track system due to differential subgrade settlement. Soil. Dyn. Earthq. Eng. 2018, 113, 1–11. [Google Scholar] [CrossRef]
  25. Zhang, Z.; Zhang, X.; Qiu, H.; Daddow, M. Dynamic characteristics of track-ballast-silty clay with irregular vibration levels generated by high-speed train based on DEM. Constr. Build. Mater. 2016, 125, 564–573. [Google Scholar] [CrossRef]
  26. Itasca Consulting Group, Inc. PFC 6.0 Documentation, User’s Guide; Itasca Consulting Group, Inc.: Minneapolis, MN, USA, 2019. [Google Scholar]
  27. Jiang, G.L.; Kong, X.H.; Meng, L.J.; Wang, Z.M. Dynamic Characteristics of Soil Subgrade Bed for Ballastless Track. J. Southwest Jiaotong Univ. 2010, 45, 855–862. [Google Scholar]
  28. Lu, M.; McDowell, G.R. The importance of modelling ballast particle shape in the discrete element method. Granul. Matter. 2007, 9, 69. [Google Scholar] [CrossRef]
  29. Li, N.; Zhou, R.; Hu, Q.; Liu, X. Mechanical fault diagnosis based on redundant second generation wavelet packet transform, neighborhood rough set and support vector machine. Mech. Syst. Signal. Process. 2012, 28, 608–621. [Google Scholar] [CrossRef]
  30. Guo, Y.; Zhai, W.; Sun, Y. A mechanical model of vehicle-slab track coupled system with differential subgrade settlement. Struct. Eng. Mech. 2018, 66, 15–25. [Google Scholar]
  31. Ministry of Railways of P.R. China. Code for Soil Test of Railway Engineering; TB10102-2010; Ministry of Railways of P.R. China: Beijing, China, 2011; pp. 273–280.
  32. Ministry of Railways of P.R. China. Code for Design of High Speed Railway; TB 10621-2014; Ministry of Railways of P.R. China: Beijing, China, 2014; pp. 40–42.
Figure 1. China Railway Track System (CRTS) II slab track.
Applsci 11 01384 g001
Figure 2. Contact diagram for the coupled model.
Applsci 11 01384 g002
Figure 3. The coupled model.
Applsci 11 01384 g003
Figure 4. Gradation curve of the gravel on the surface layer of the subgrade.
Applsci 11 01384 g004
Figure 5. Differential subgrade settlement.
Applsci 11 01384 g005
Figure 6. Schematic diagram and simulation results of the K 30 test.
Applsci 11 01384 g006
Figure 7. Stress on the loading plate and force chains in the surface layer of the subgrade.
Applsci 11 01384 g007
Figure 8. Longitudinal stress on the slab track and force chain in the subgrade.
Applsci 11 01384 g008
Figure 9. Deformation of the slab track.
Applsci 11 01384 g009
Figure 10. Deformation of the slab track at different settlement wavelengths.
Applsci 11 01384 g010
Figure 11. Contact force characteristics of the gravel grains in the subgrade at different settlement wavelengths.
Applsci 11 01384 g011
Figure 12. Deformation of the track at different settlement amplitudes.
Applsci 11 01384 g012
Figure 13. Contact force characteristics of gravel grains in the subgrade at different settlement amplitudes.
Applsci 11 01384 g013
Figure 14. Deformation of the slab track under other types of settlement.
Applsci 11 01384 g014
Figure 15. Growth rates of contact force under other types of settlement.
Applsci 11 01384 g015
Table 1. Parameters for the DEM-FDM coupled model.
ComponentsParameterValue
Precast slabElastic modulus (MPa)3.55 × 10⁴
Density (kg/m3)2400
Poisson’s ratio0.2
CA mortar layerElastic modulus (MPa)8.00 × 10³
Density (kg/m3)2400
Poisson’s ratio0.2
Concrete baseElastic modulus (MPa)2.20 × 10⁴
Density (kg/m3)2400
Poisson’s ratio0.2
The surface layer of the subgradeDensity of gravel (kg/m3)2300
Normal contact stiffness between gravel grains (N/m)1.0 × 108
Shear contact stiffness between gravel grains (N/m)1.0 × 108
Sliding Friction coefficient0.7
Rolling friction coefficient0.25
Publisher’s Note: MDPI stays neutral with regard to jurisdictional claims in published maps and institutional affiliations.

